The document discusses speed-time graphs and motion. It contains questions about interpreting various speed-time graphs to determine properties like acceleration, retardation, maximum speed, etc. It also contains questions about drawing speed-time graphs based on data and calculating speed and distance from position-time graphs. The questions cover concepts like uniform acceleration, constant speed, uniform retardation, and interpreting the slopes and areas under graphs.
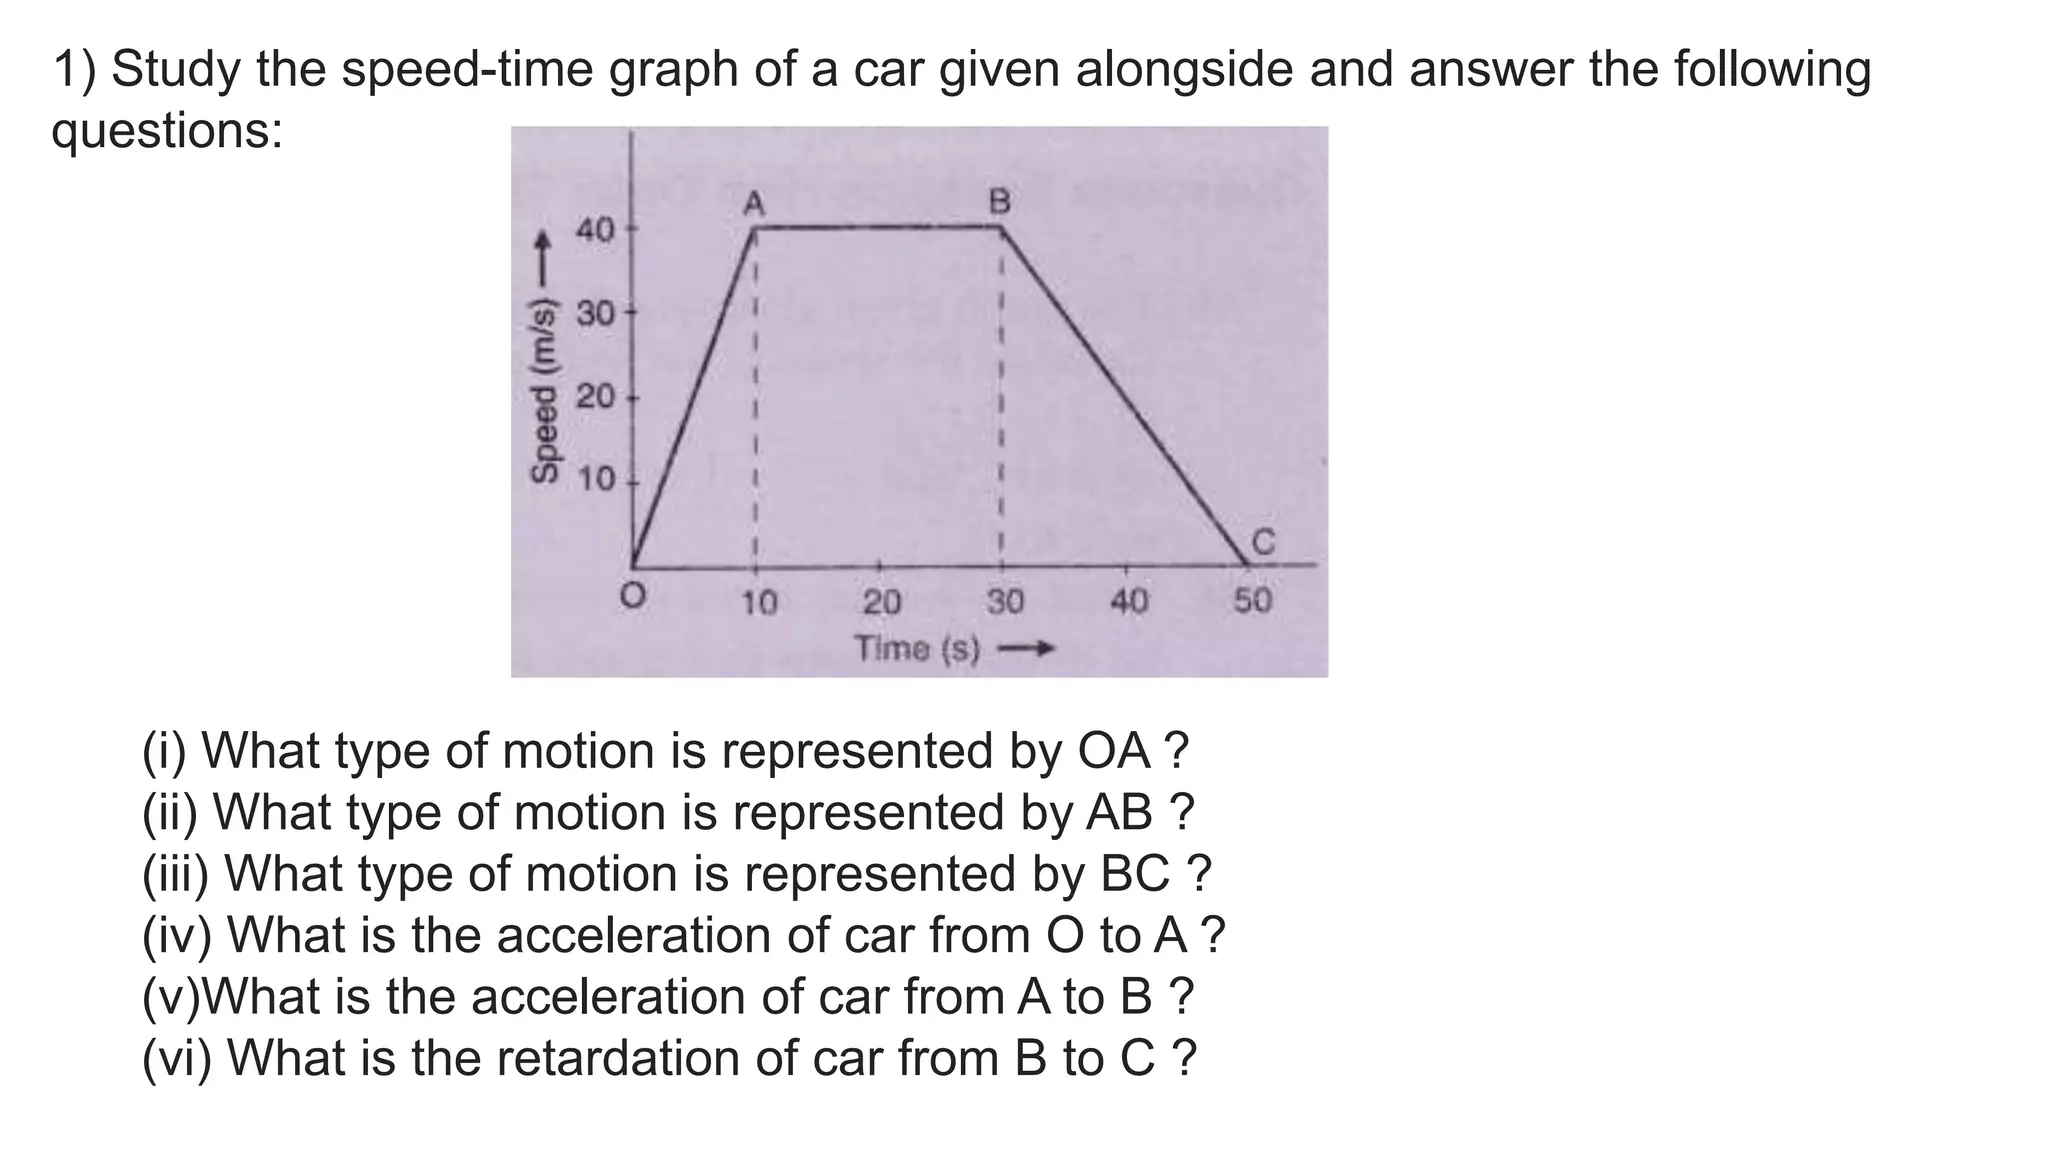
1) Study thespeed-time graph of a car given alongside and answer the following
questions:
(i) What type of motion is represented by OA ?
(ii) What type of motion is represented by AB ?
(iii) What type of motion is represented by BC ?
(iv) What is the acceleration of car from O to A ?
(v)What is the acceleration of car from A to B ?
(vi) What is the retardation of car from B to C ?
3.
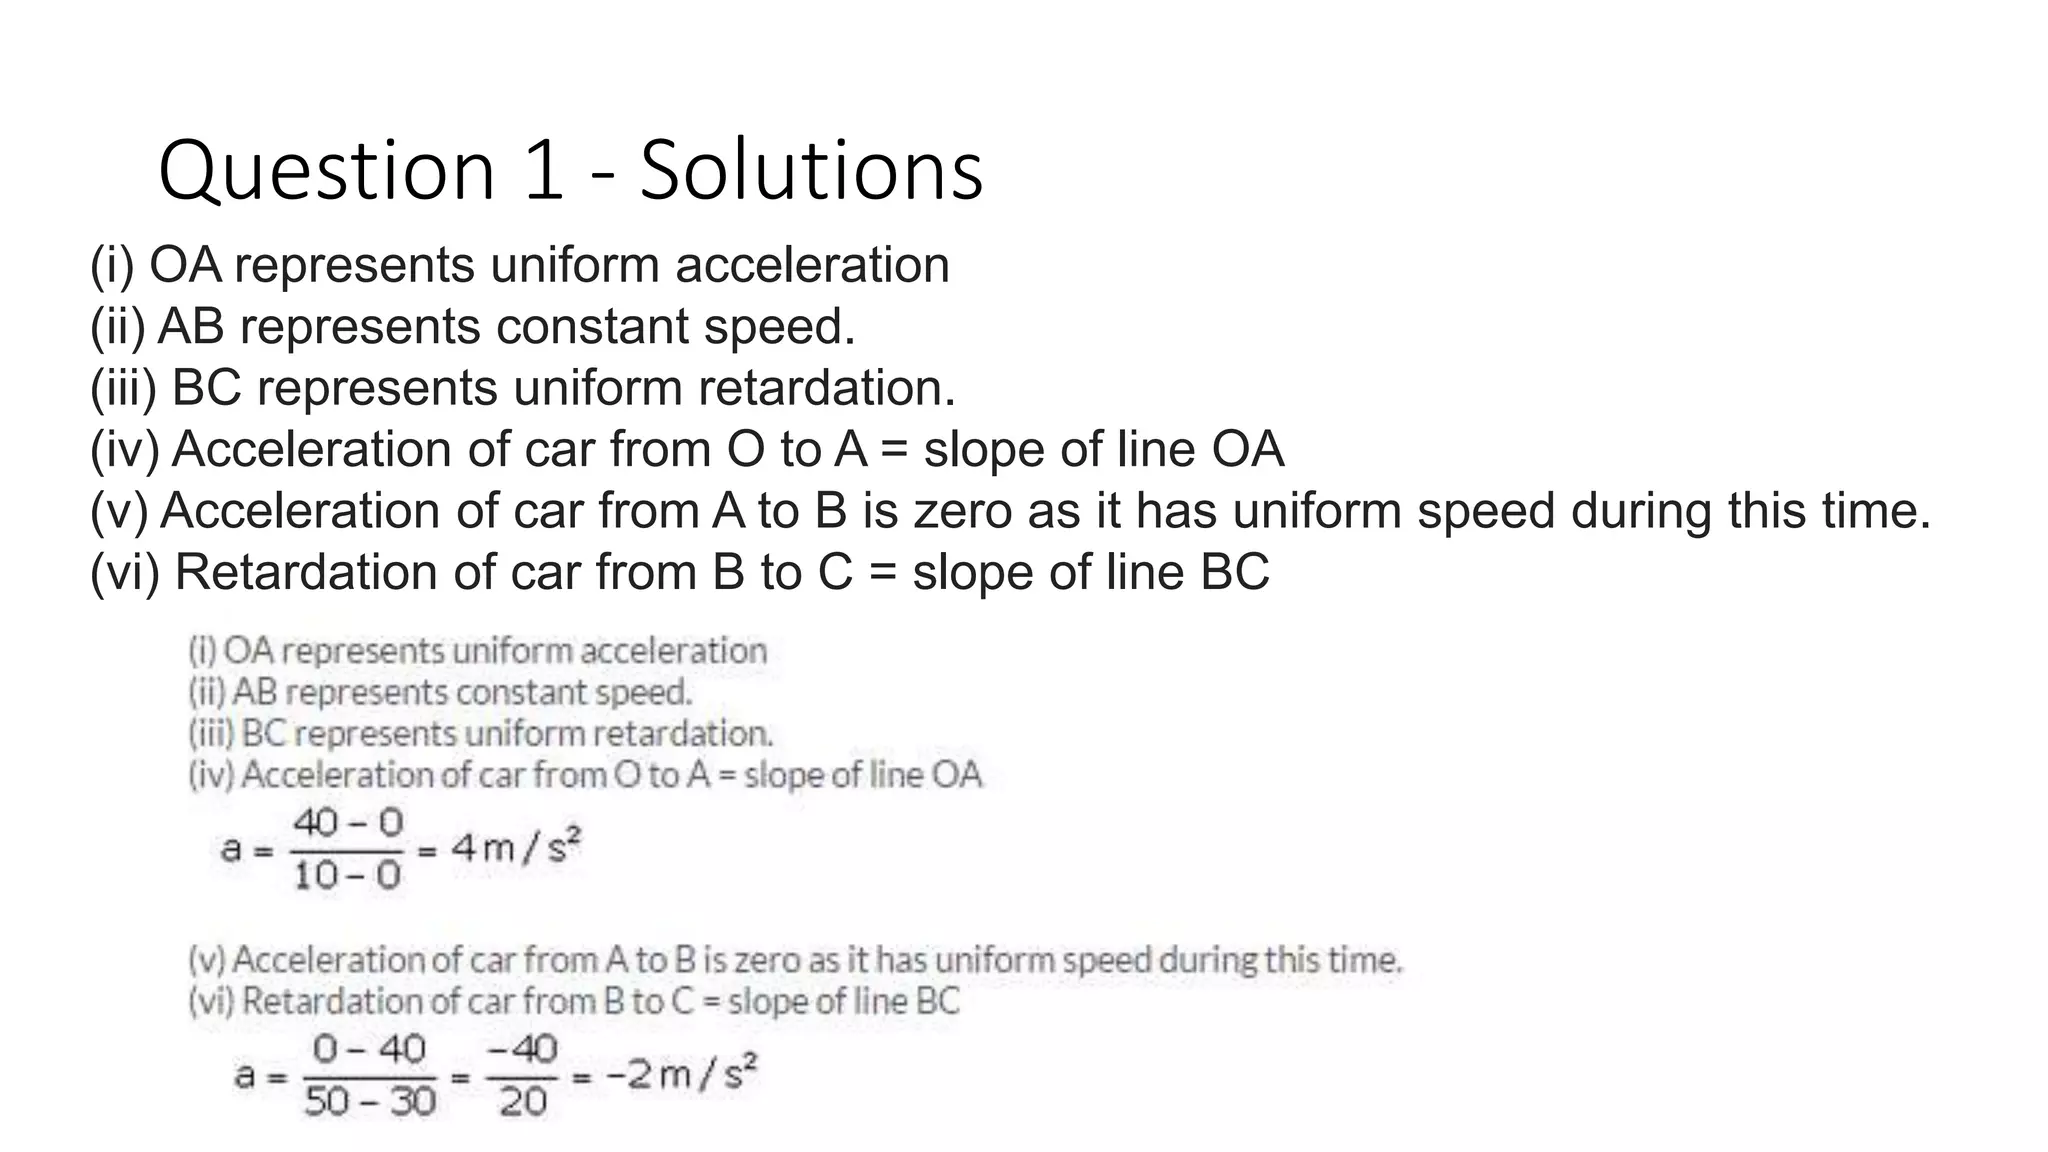
Question 1 -Solutions
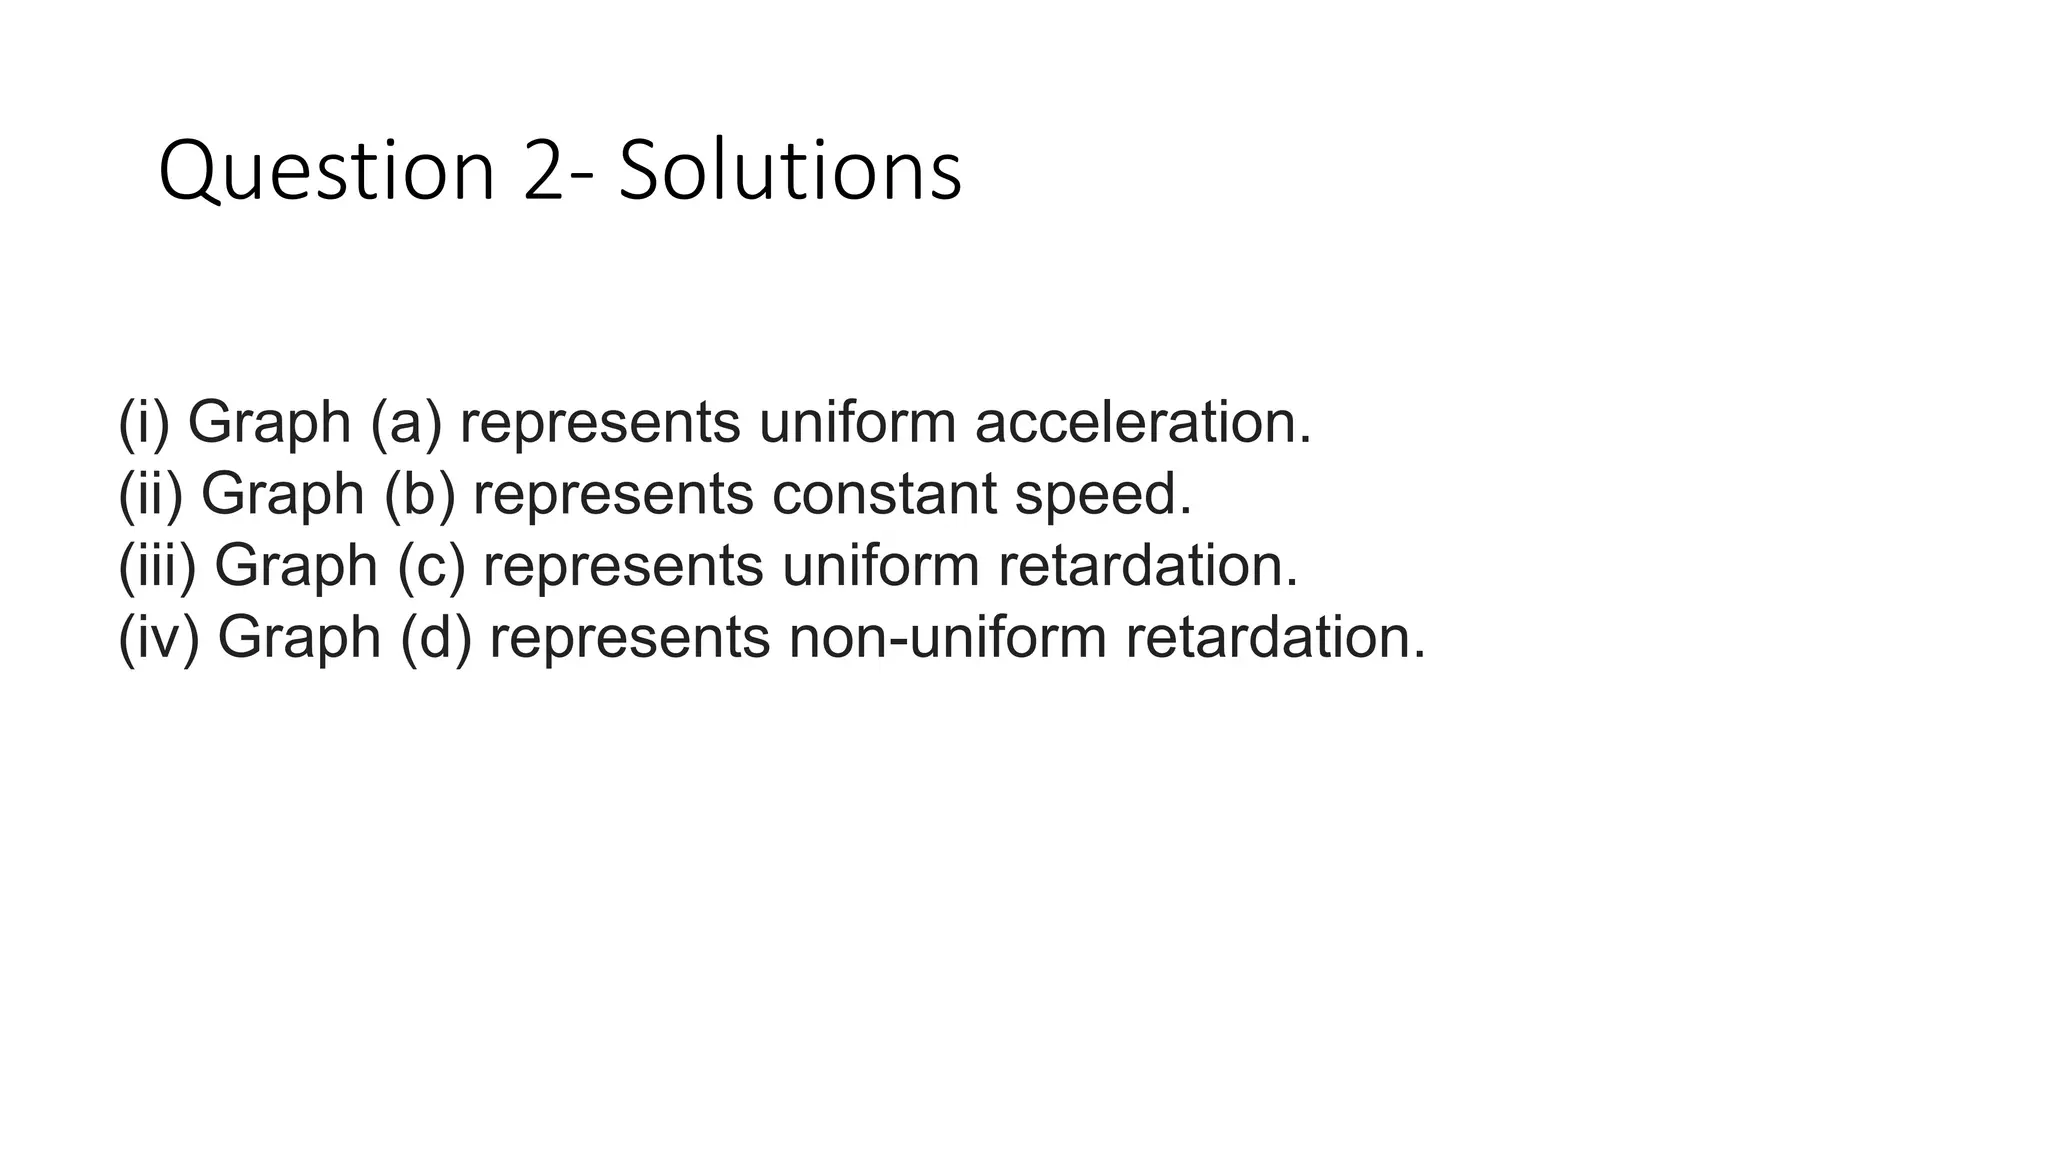
(i) OA represents uniform acceleration
(ii) AB represents constant speed.
(iii) BC represents uniform retardation.
(iv) Acceleration of car from O to A = slope of line OA
(v) Acceleration of car from A to B is zero as it has uniform speed during this time.
(vi) Retardation of car from B to C = slope of line BC
4.
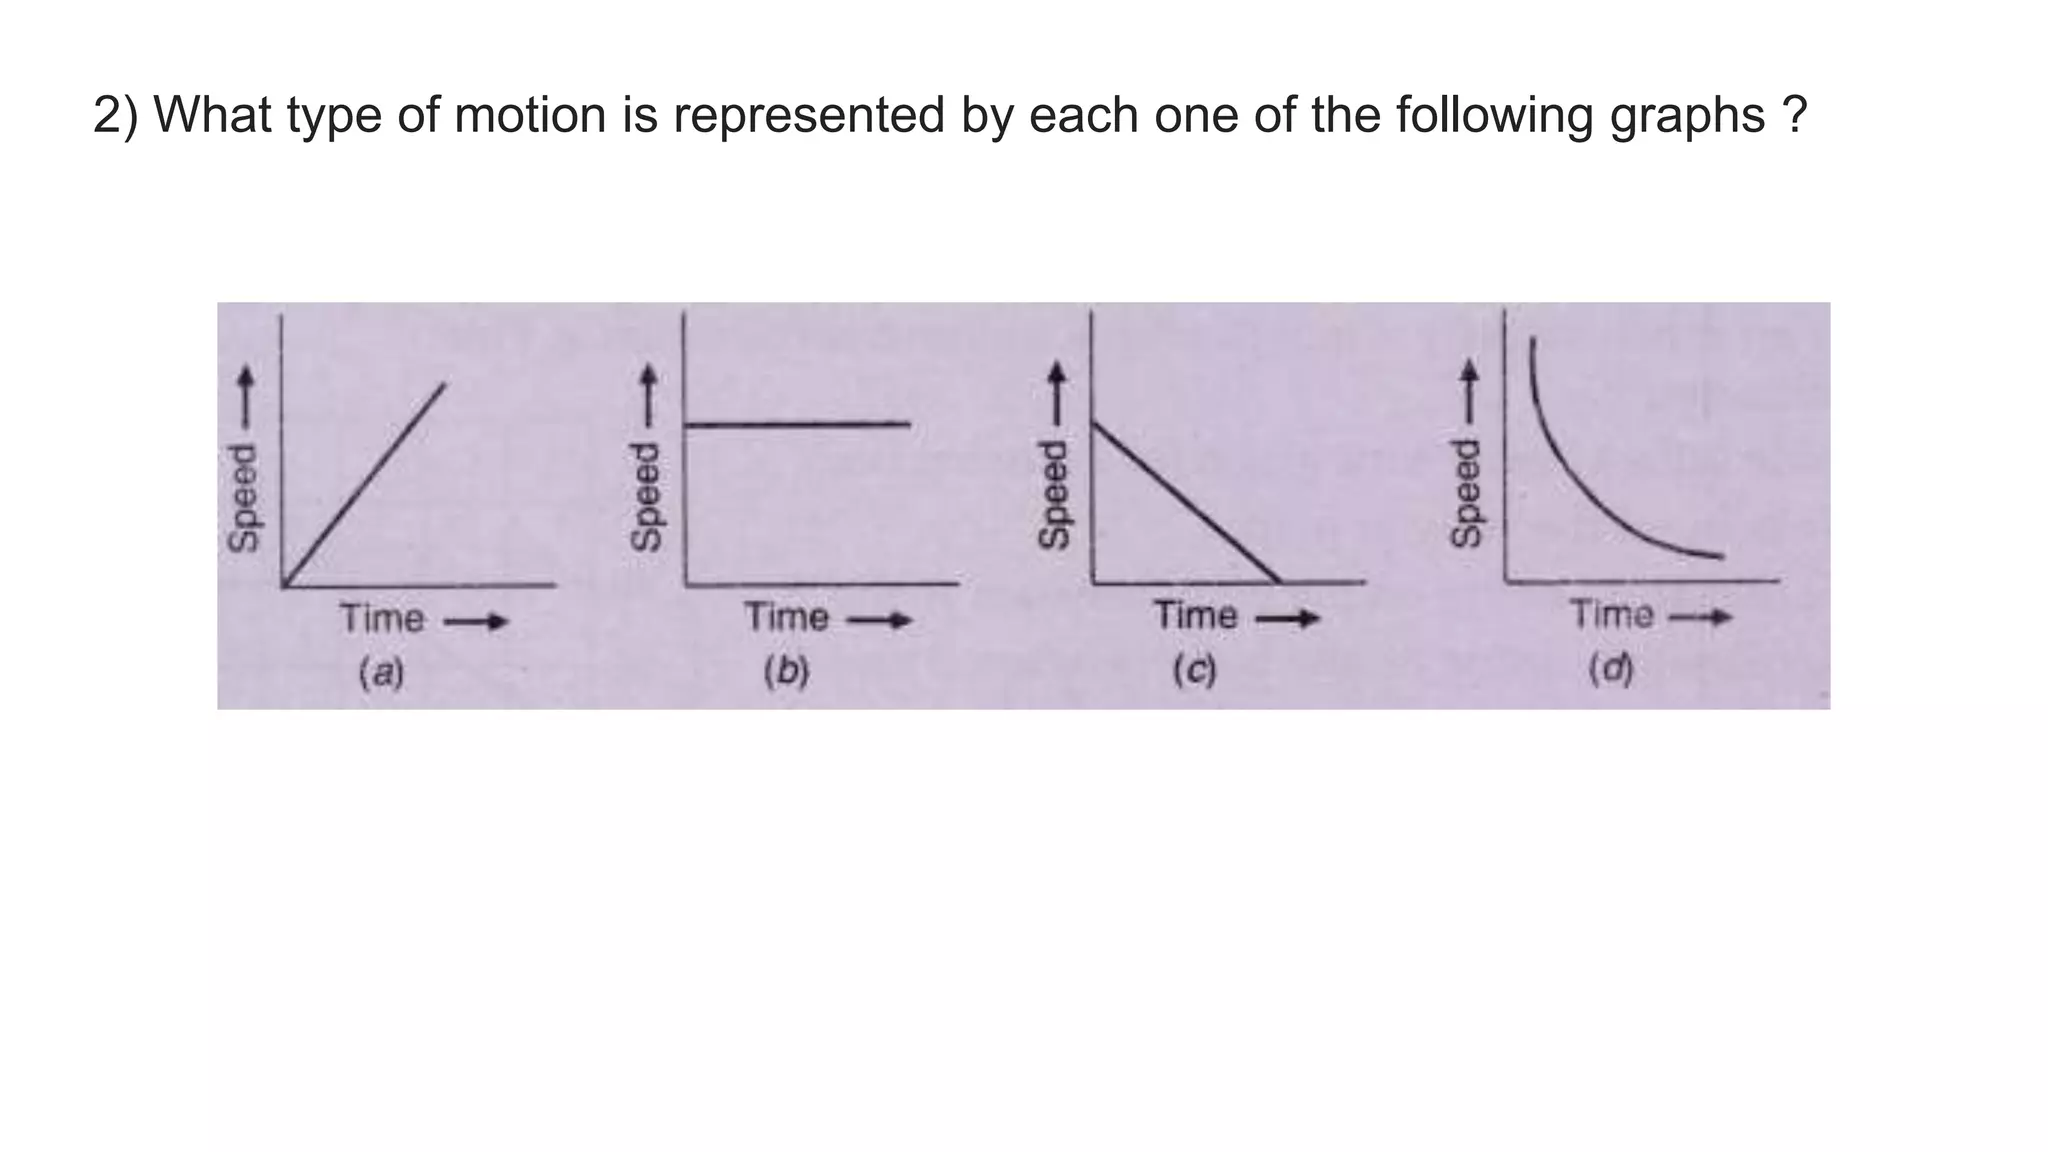
2) What typeof motion is represented by each one of the following graphs ?
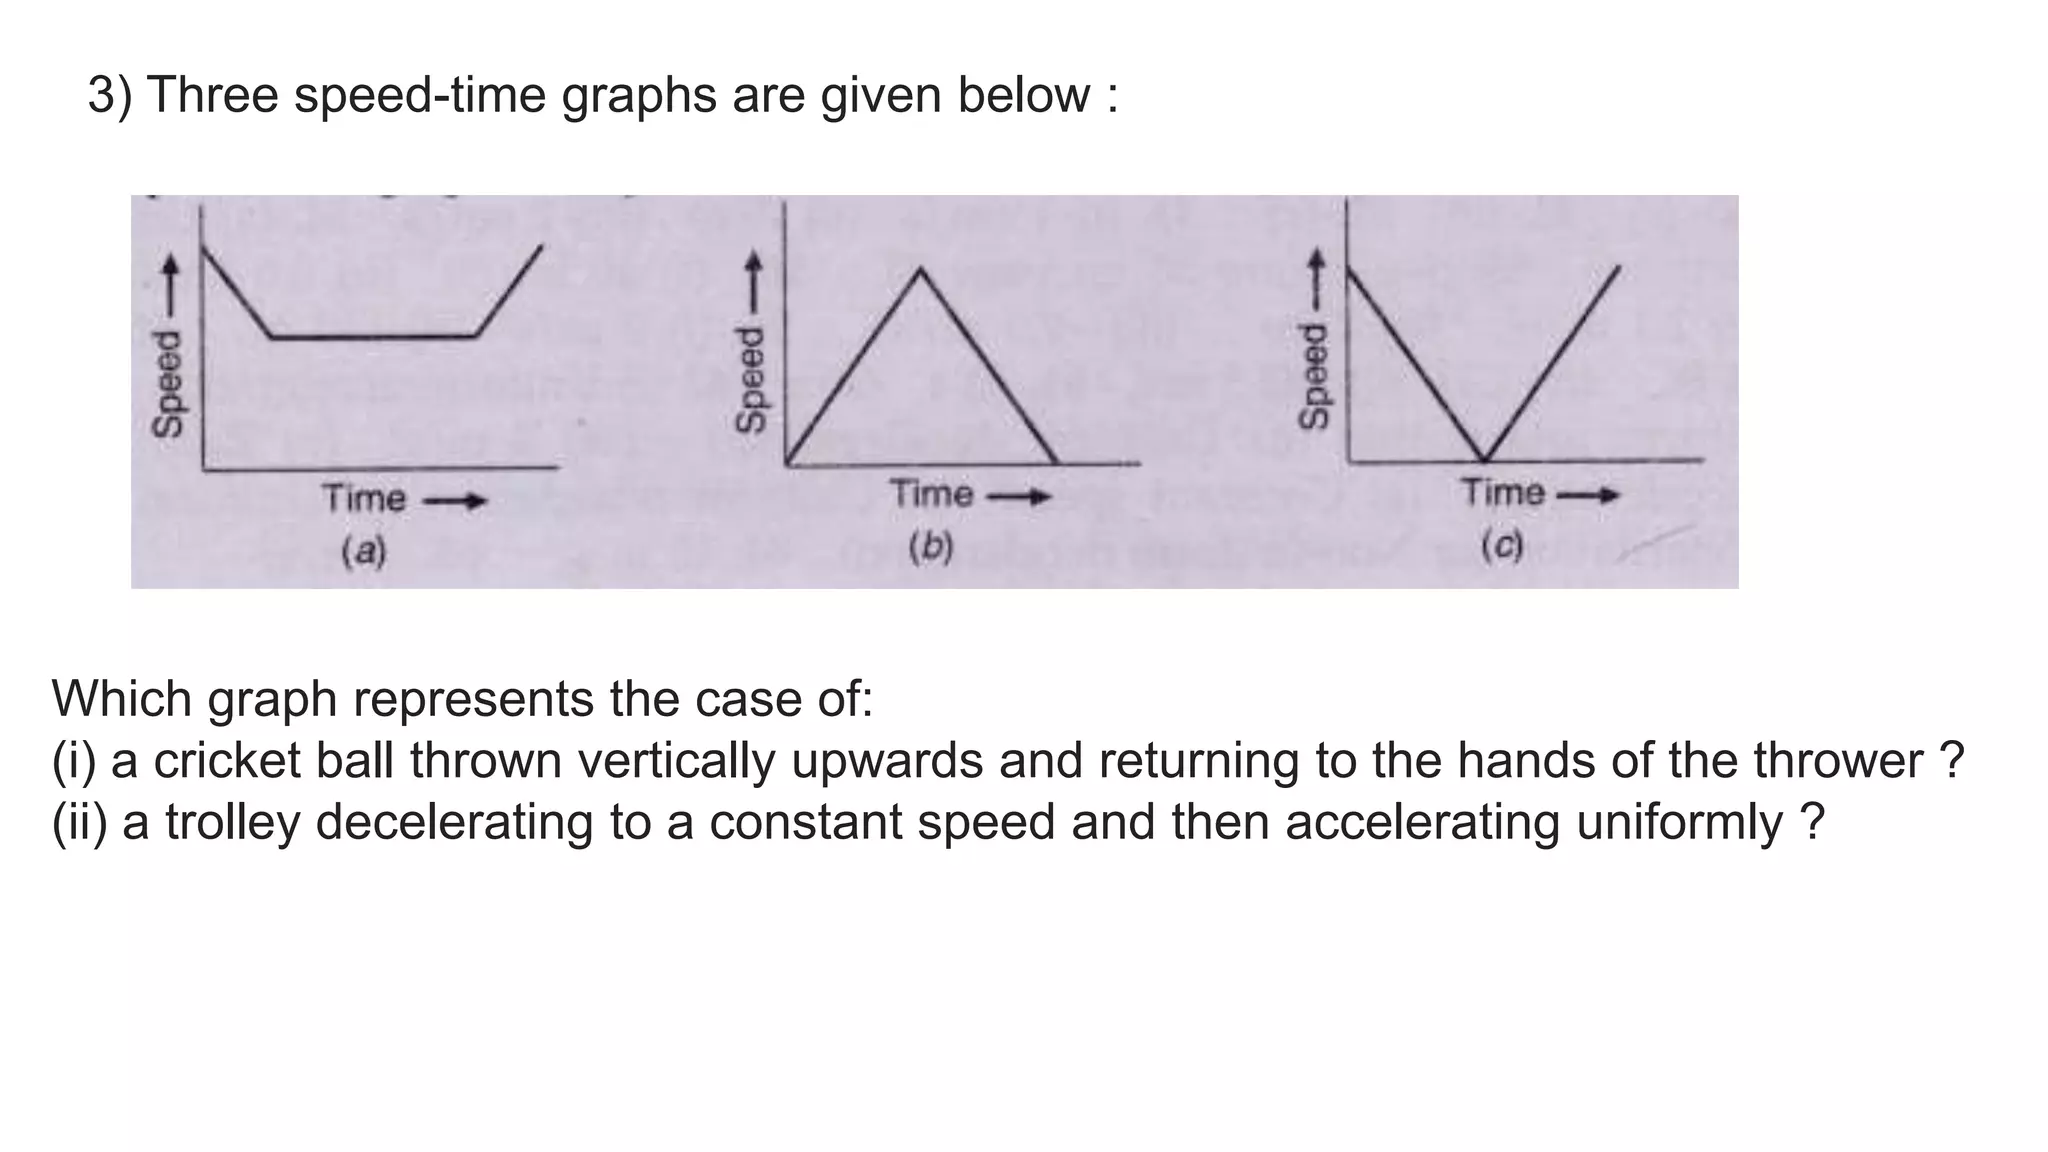
3) Three speed-timegraphs are given below :
Which graph represents the case of:
(i) a cricket ball thrown vertically upwards and returning to the hands of the thrower ?
(ii) a trolley decelerating to a constant speed and then accelerating uniformly ?
7.
Question 3- Solutions
(i)Graph (c): The speed of the ball goes on decreasing uniformly as it
moves upward, reaches zero at the highest point, and then increases
uniformly as it moves downward.
(ii) Grap(a): The speed of the trolley decreases uniformly, then it moves at
a constant speed, and then the speed increases uniformly.
8.
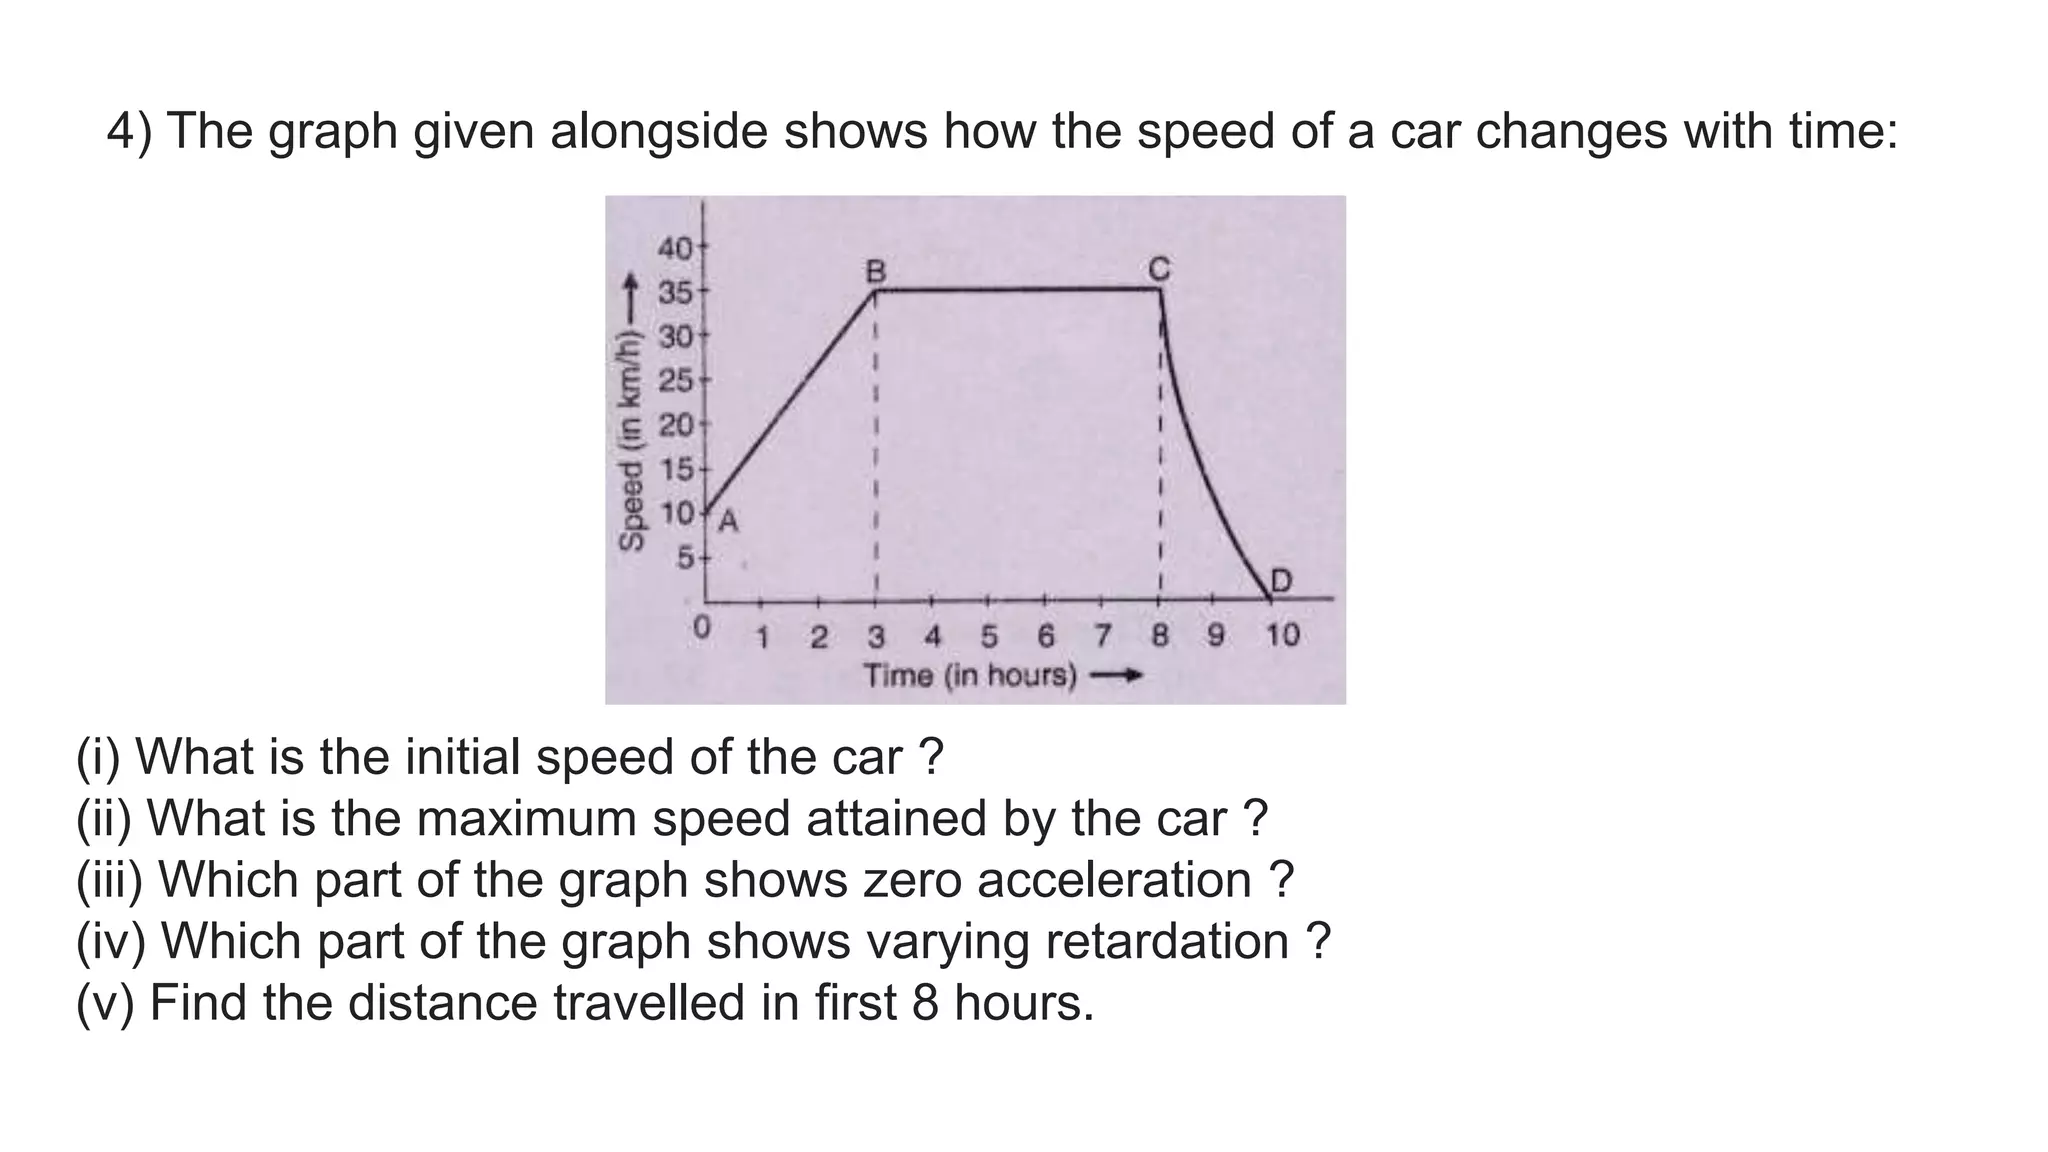
4) The graphgiven alongside shows how the speed of a car changes with time:
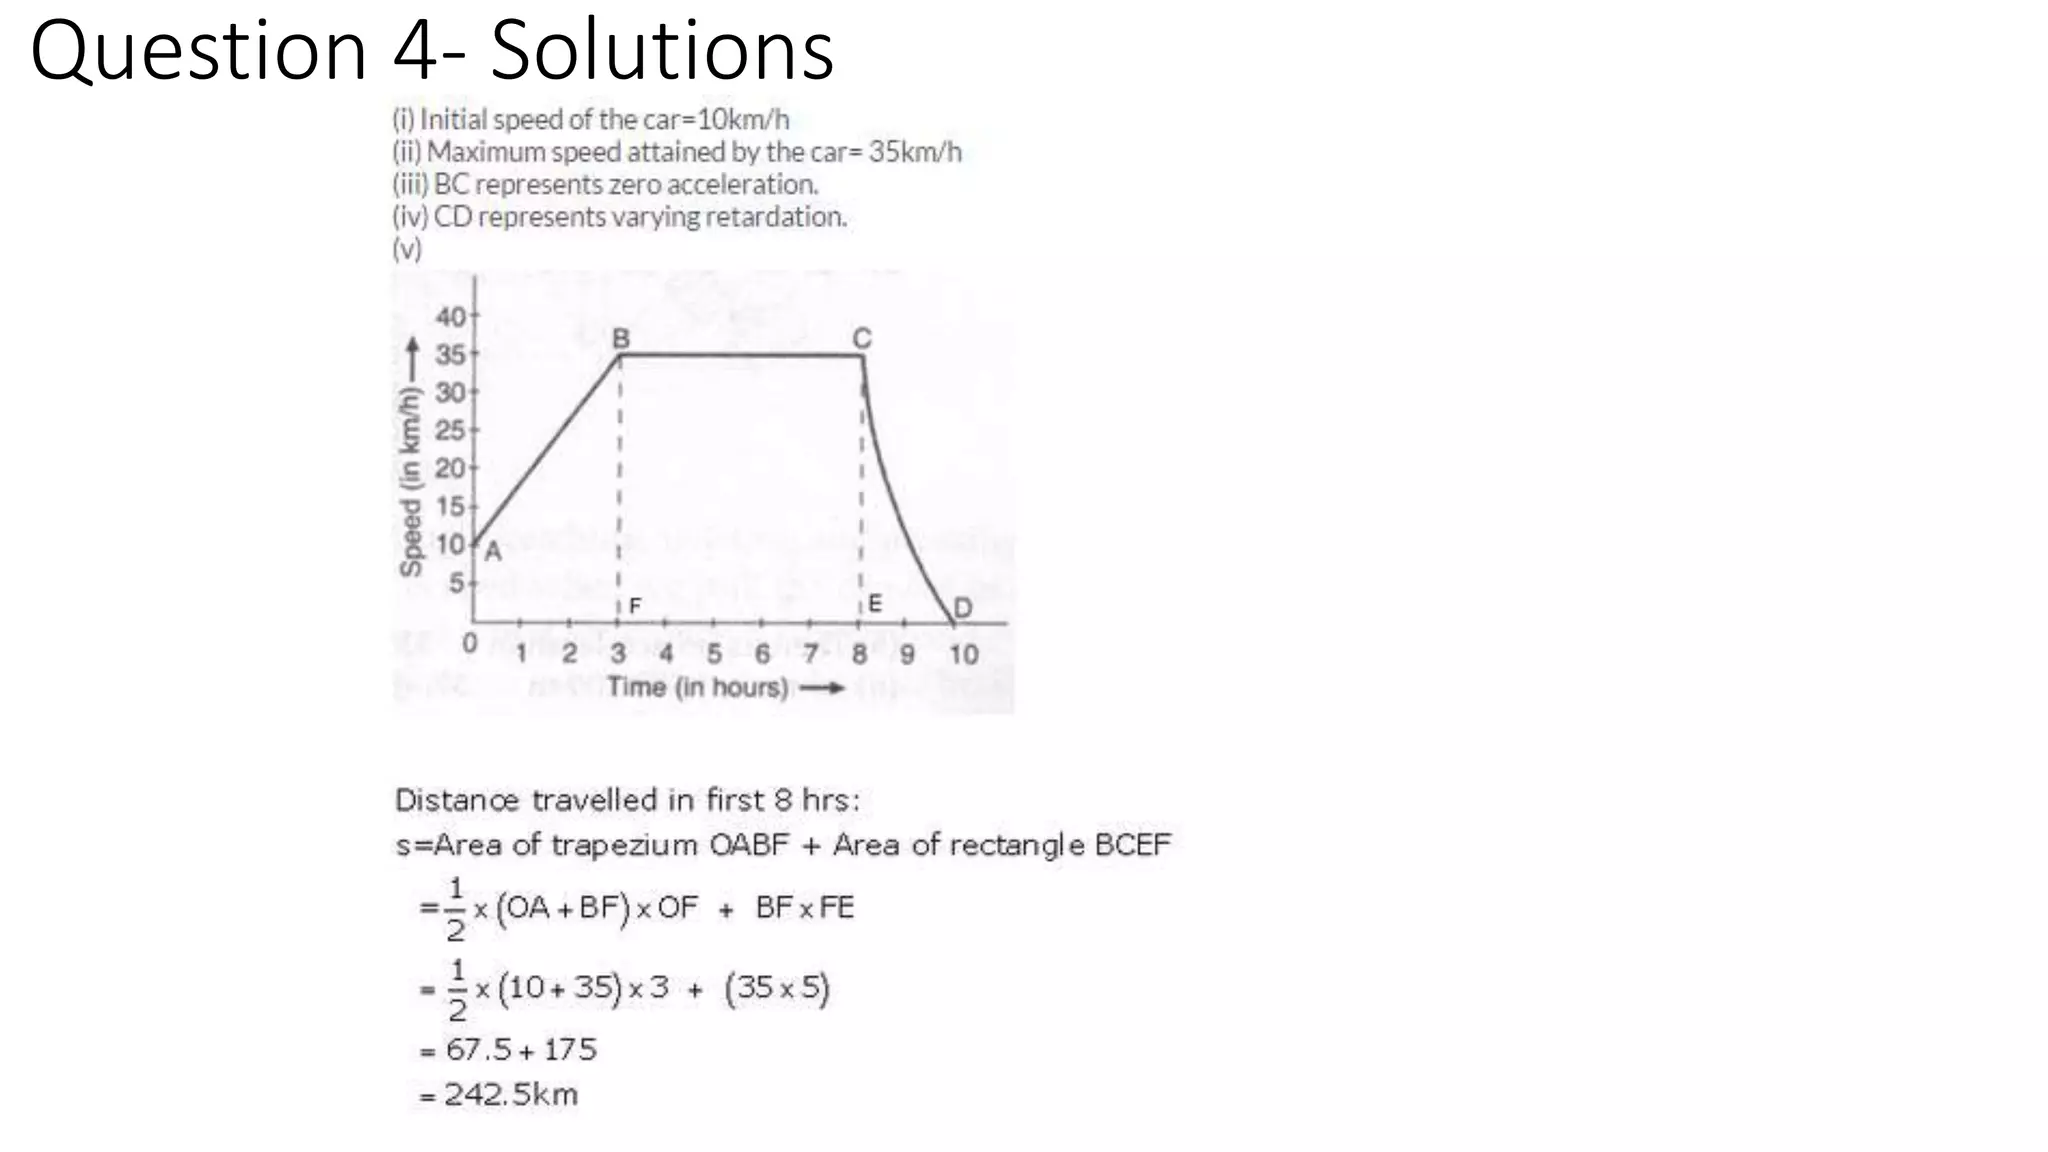
(i) What is the initial speed of the car ?
(ii) What is the maximum speed attained by the car ?
(iii) Which part of the graph shows zero acceleration ?
(iv) Which part of the graph shows varying retardation ?
(v) Find the distance travelled in first 8 hours.
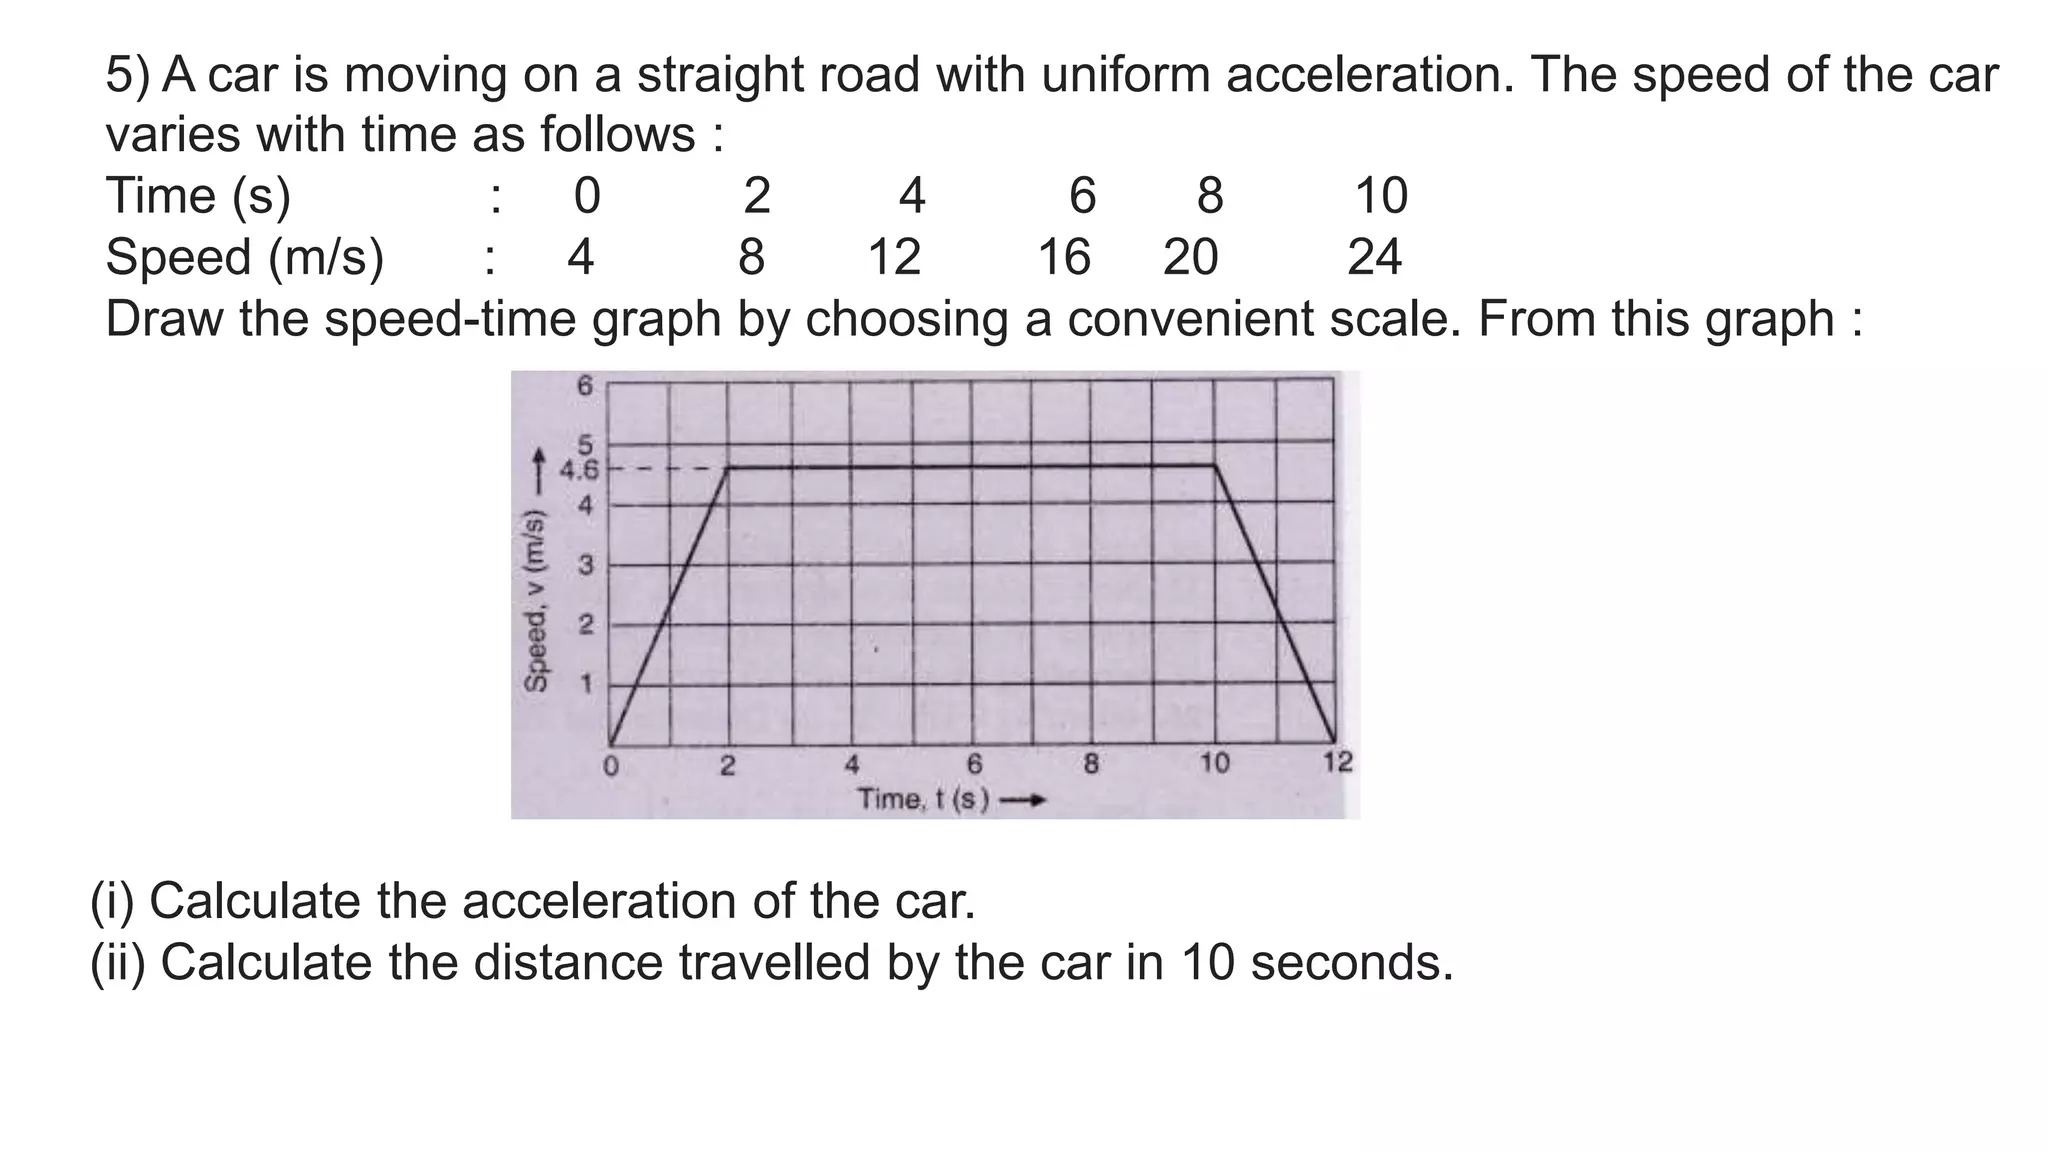
5) A caris moving on a straight road with uniform acceleration. The speed of the car
varies with time as follows :
Time (s) : 0 2 4 6 8 10
Speed (m/s) : 4 8 12 16 20 24
Draw the speed-time graph by choosing a convenient scale. From this graph :
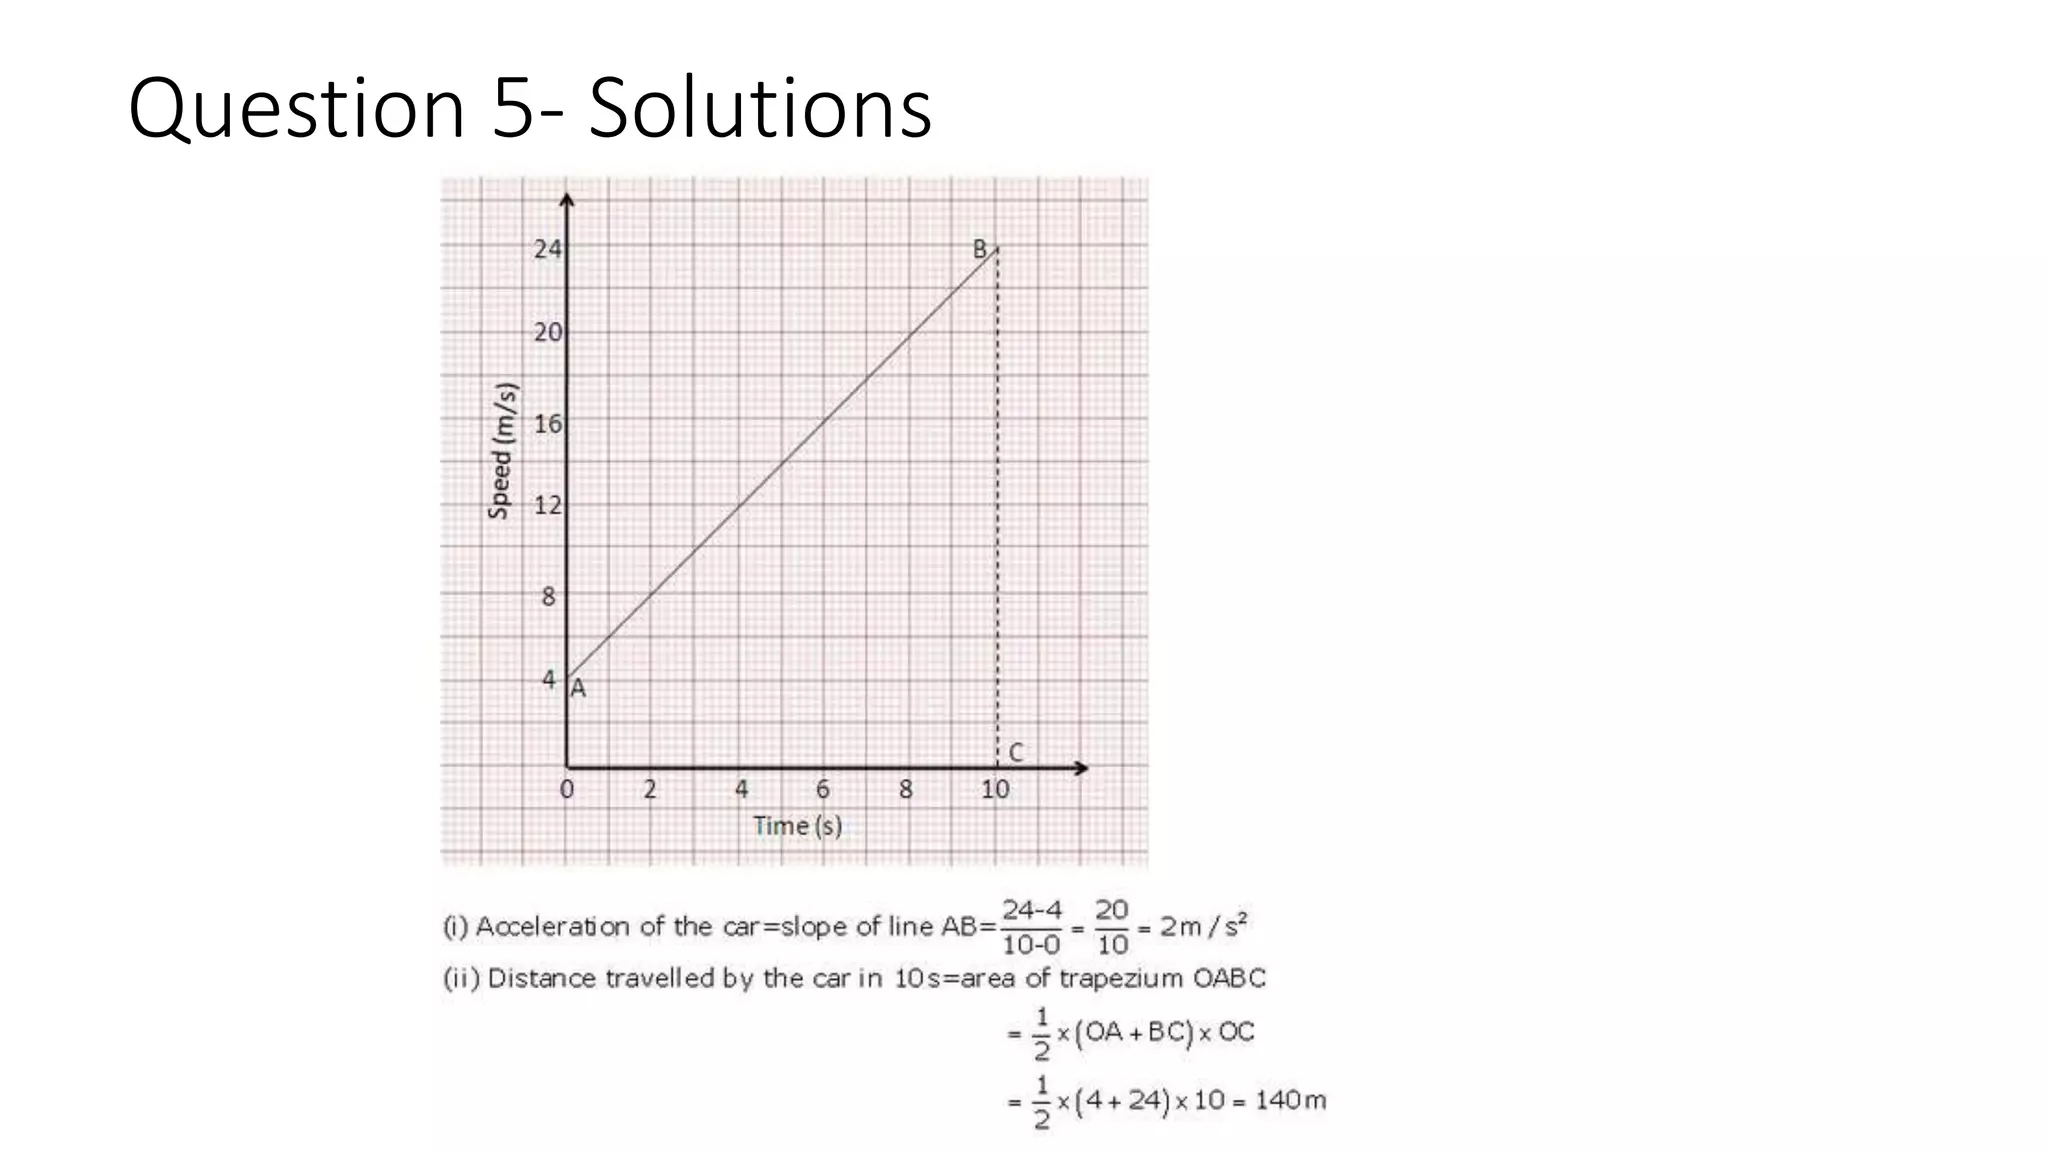
(i) Calculate the acceleration of the car.
(ii) Calculate the distance travelled by the car in 10 seconds.
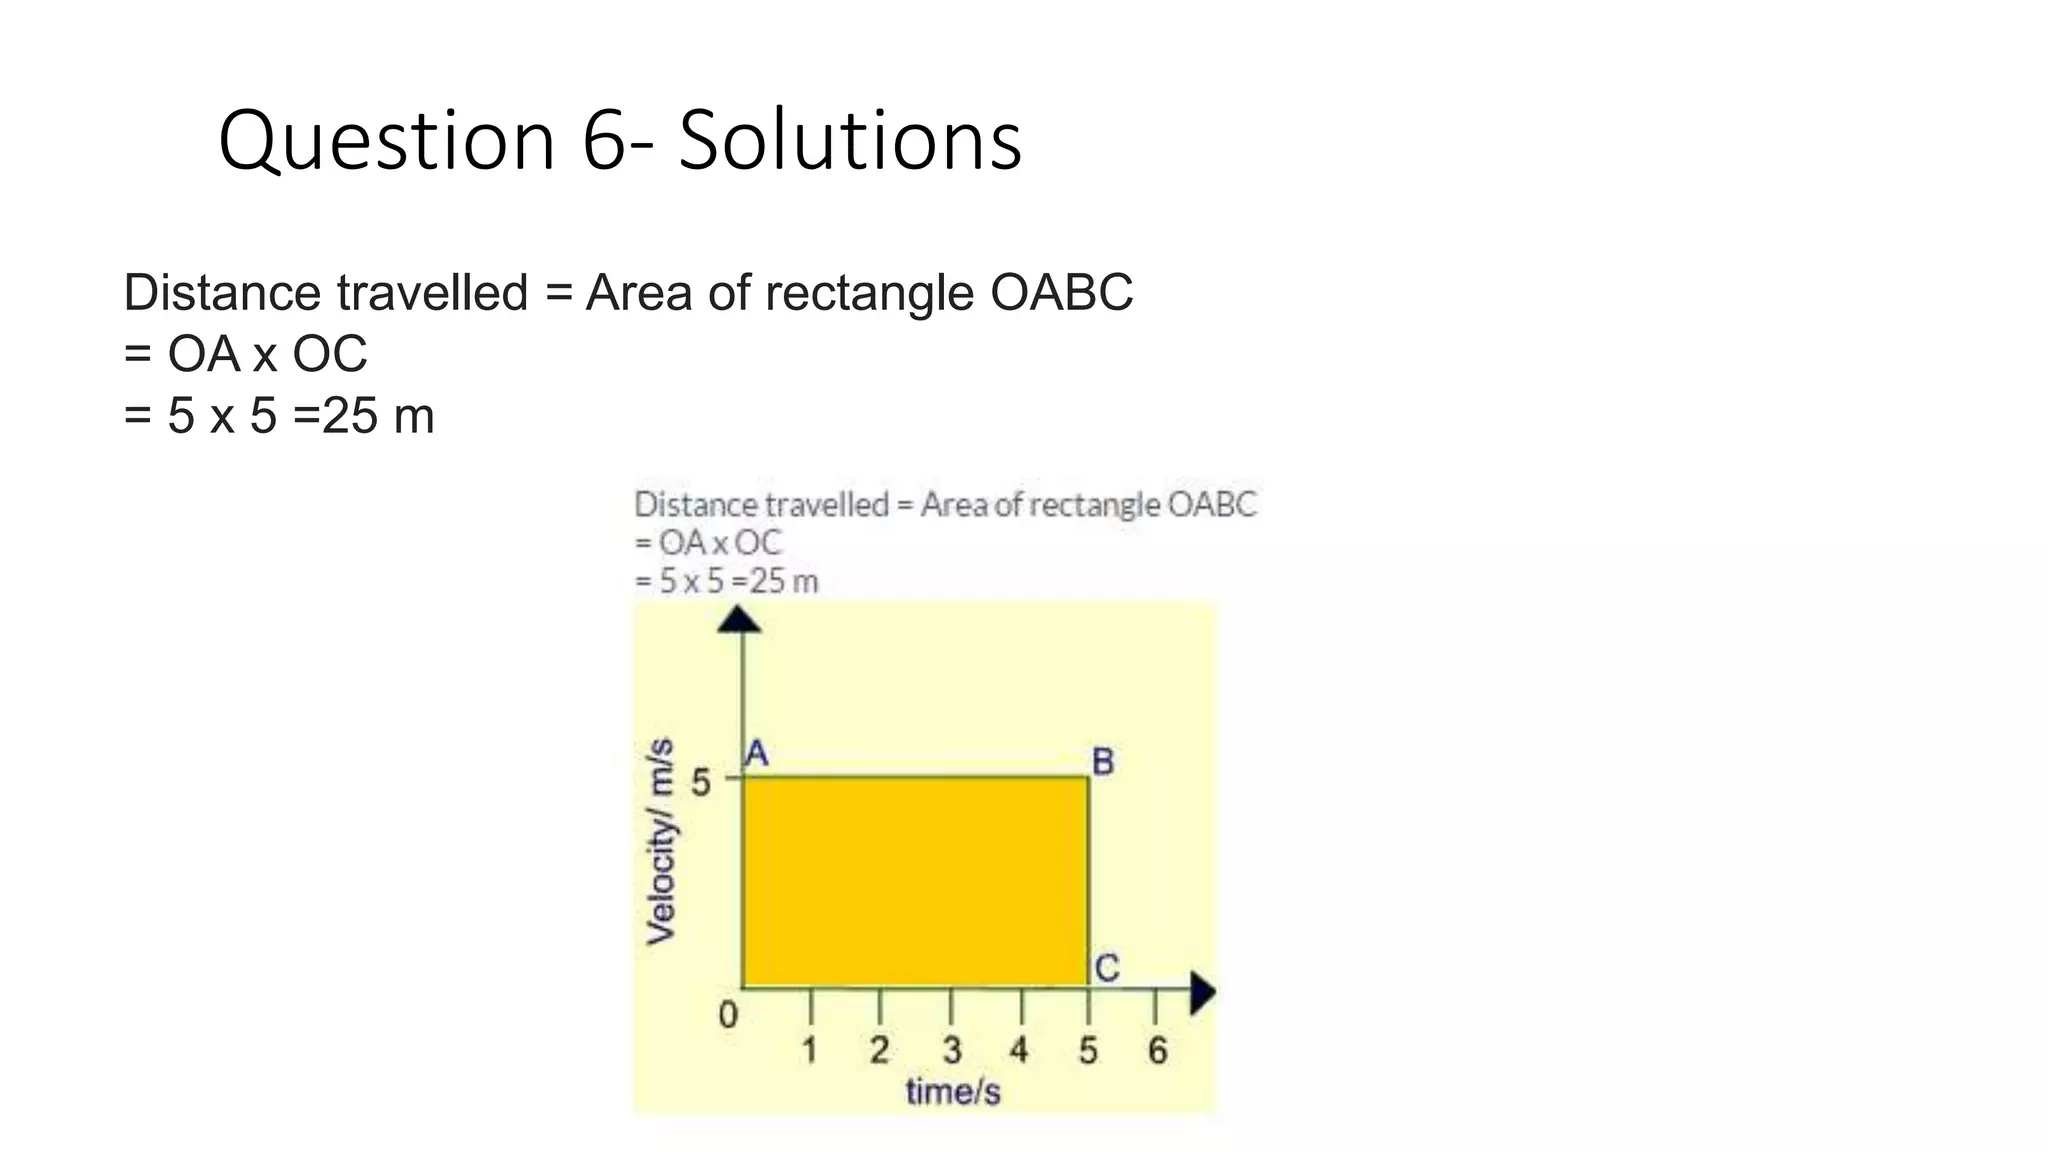
6) A bodyis moving uniformly in a straight line with a velocity of 5 m/s. Find
graphically the distance covered by it in 5 seconds.
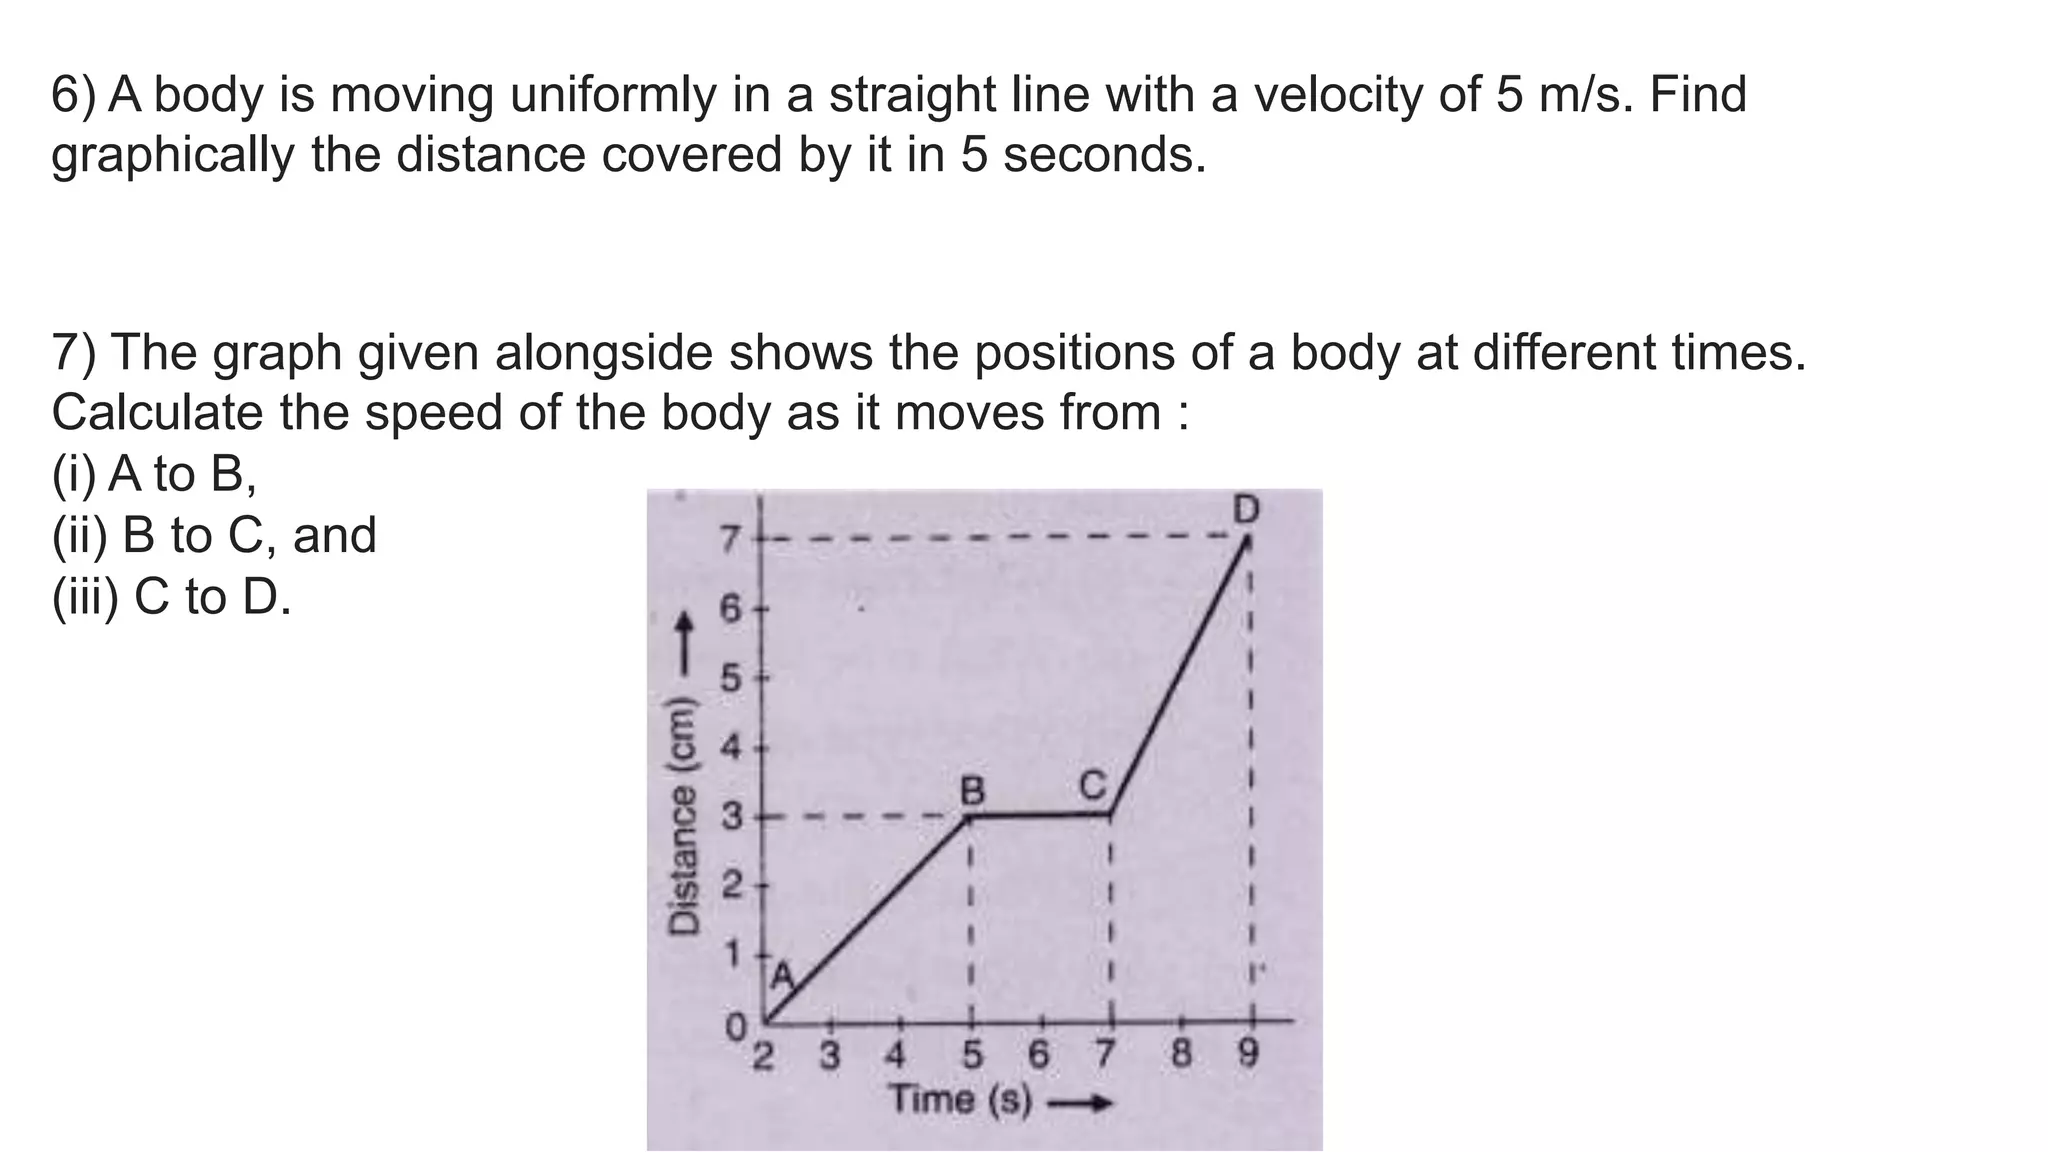
7) The graph given alongside shows the positions of a body at different times.
Calculate the speed of the body as it moves from :
(i) A to B,
(ii) B to C, and
(iii) C to D.
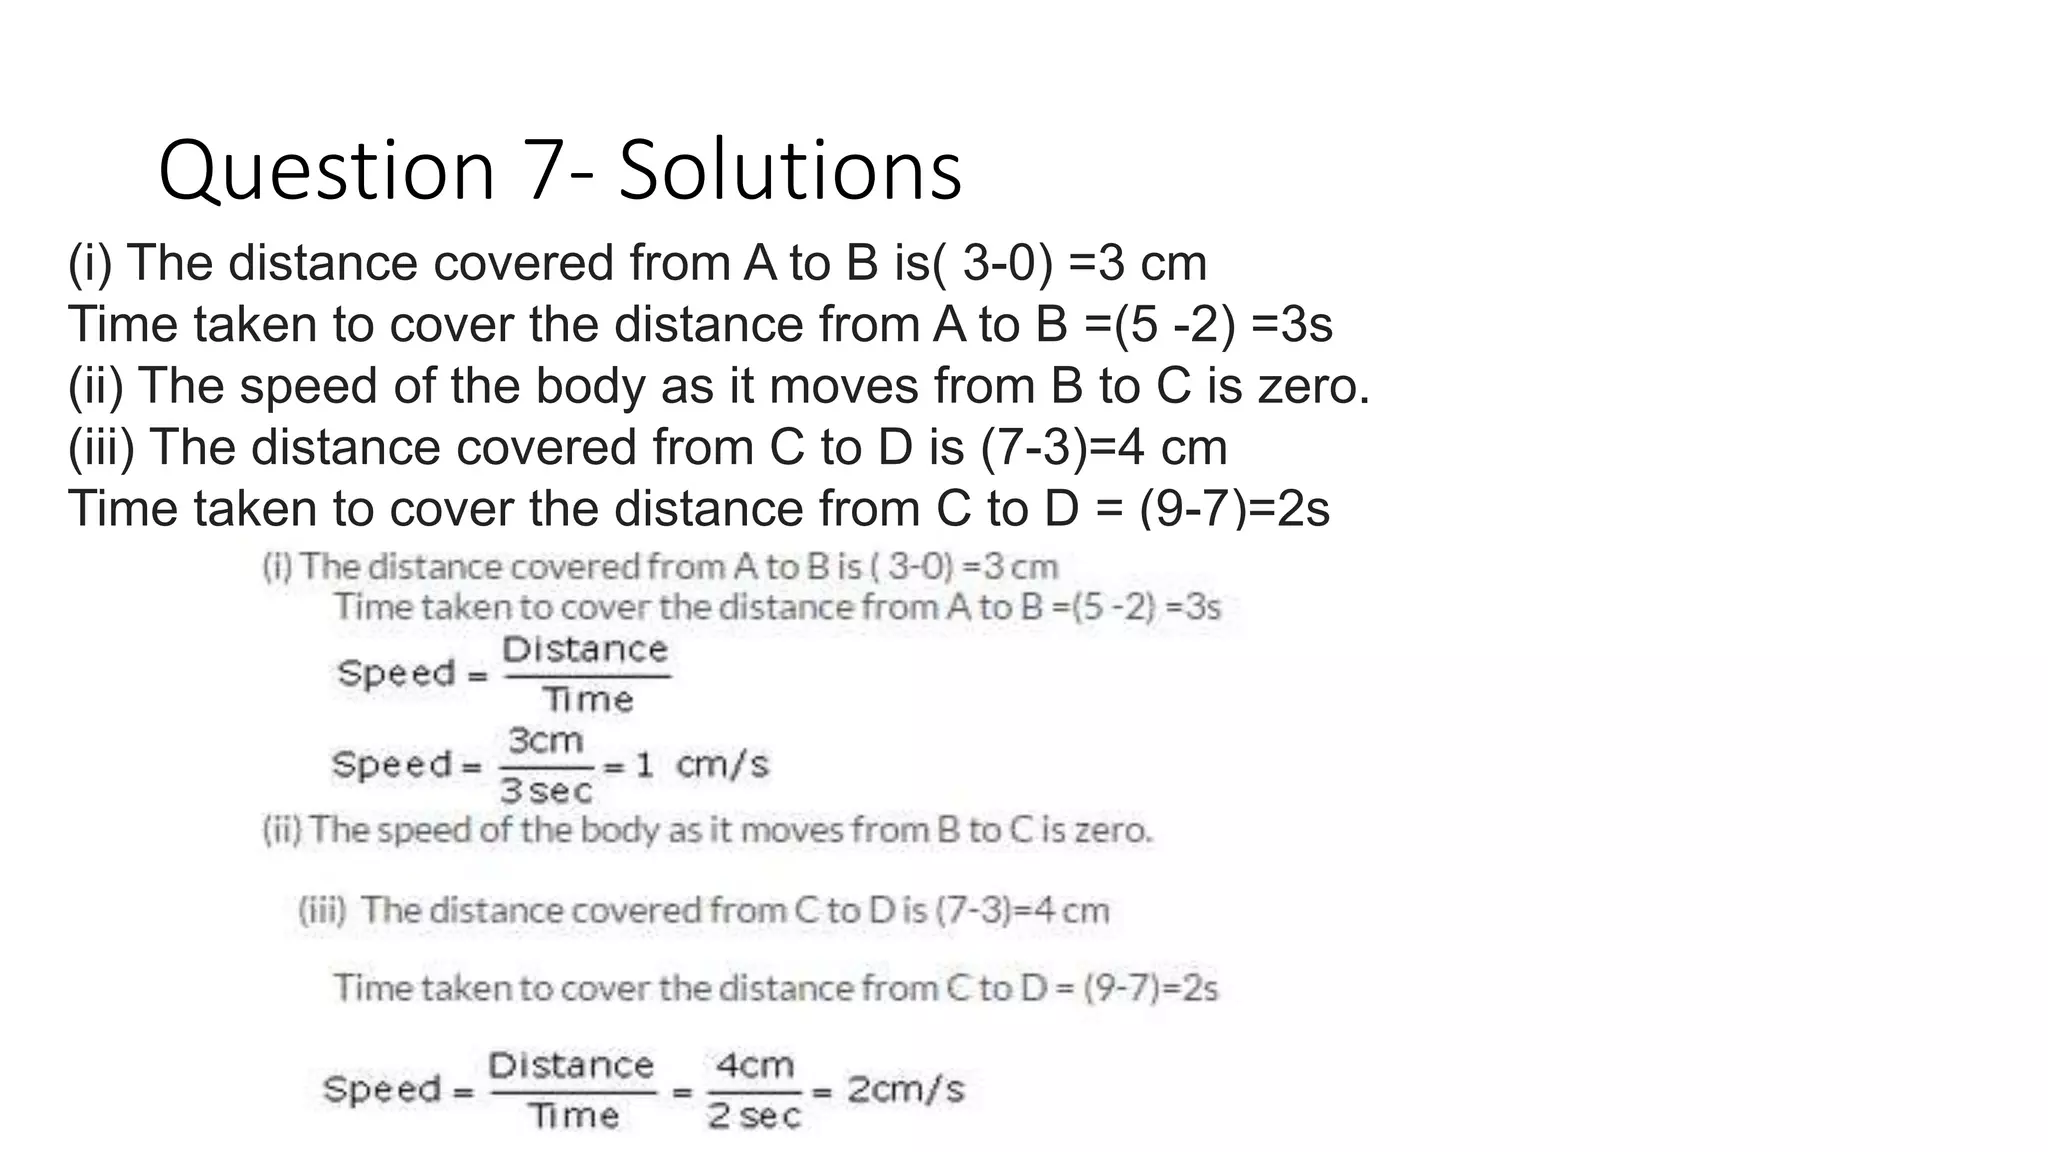
Question 7- Solutions
(i)The distance covered from A to B is( 3-0) =3 cm
Time taken to cover the distance from A to B =(5 -2) =3s
(ii) The speed of the body as it moves from B to C is zero.
(iii) The distance covered from C to D is (7-3)=4 cm
Time taken to cover the distance from C to D = (9-7)=2s
15.
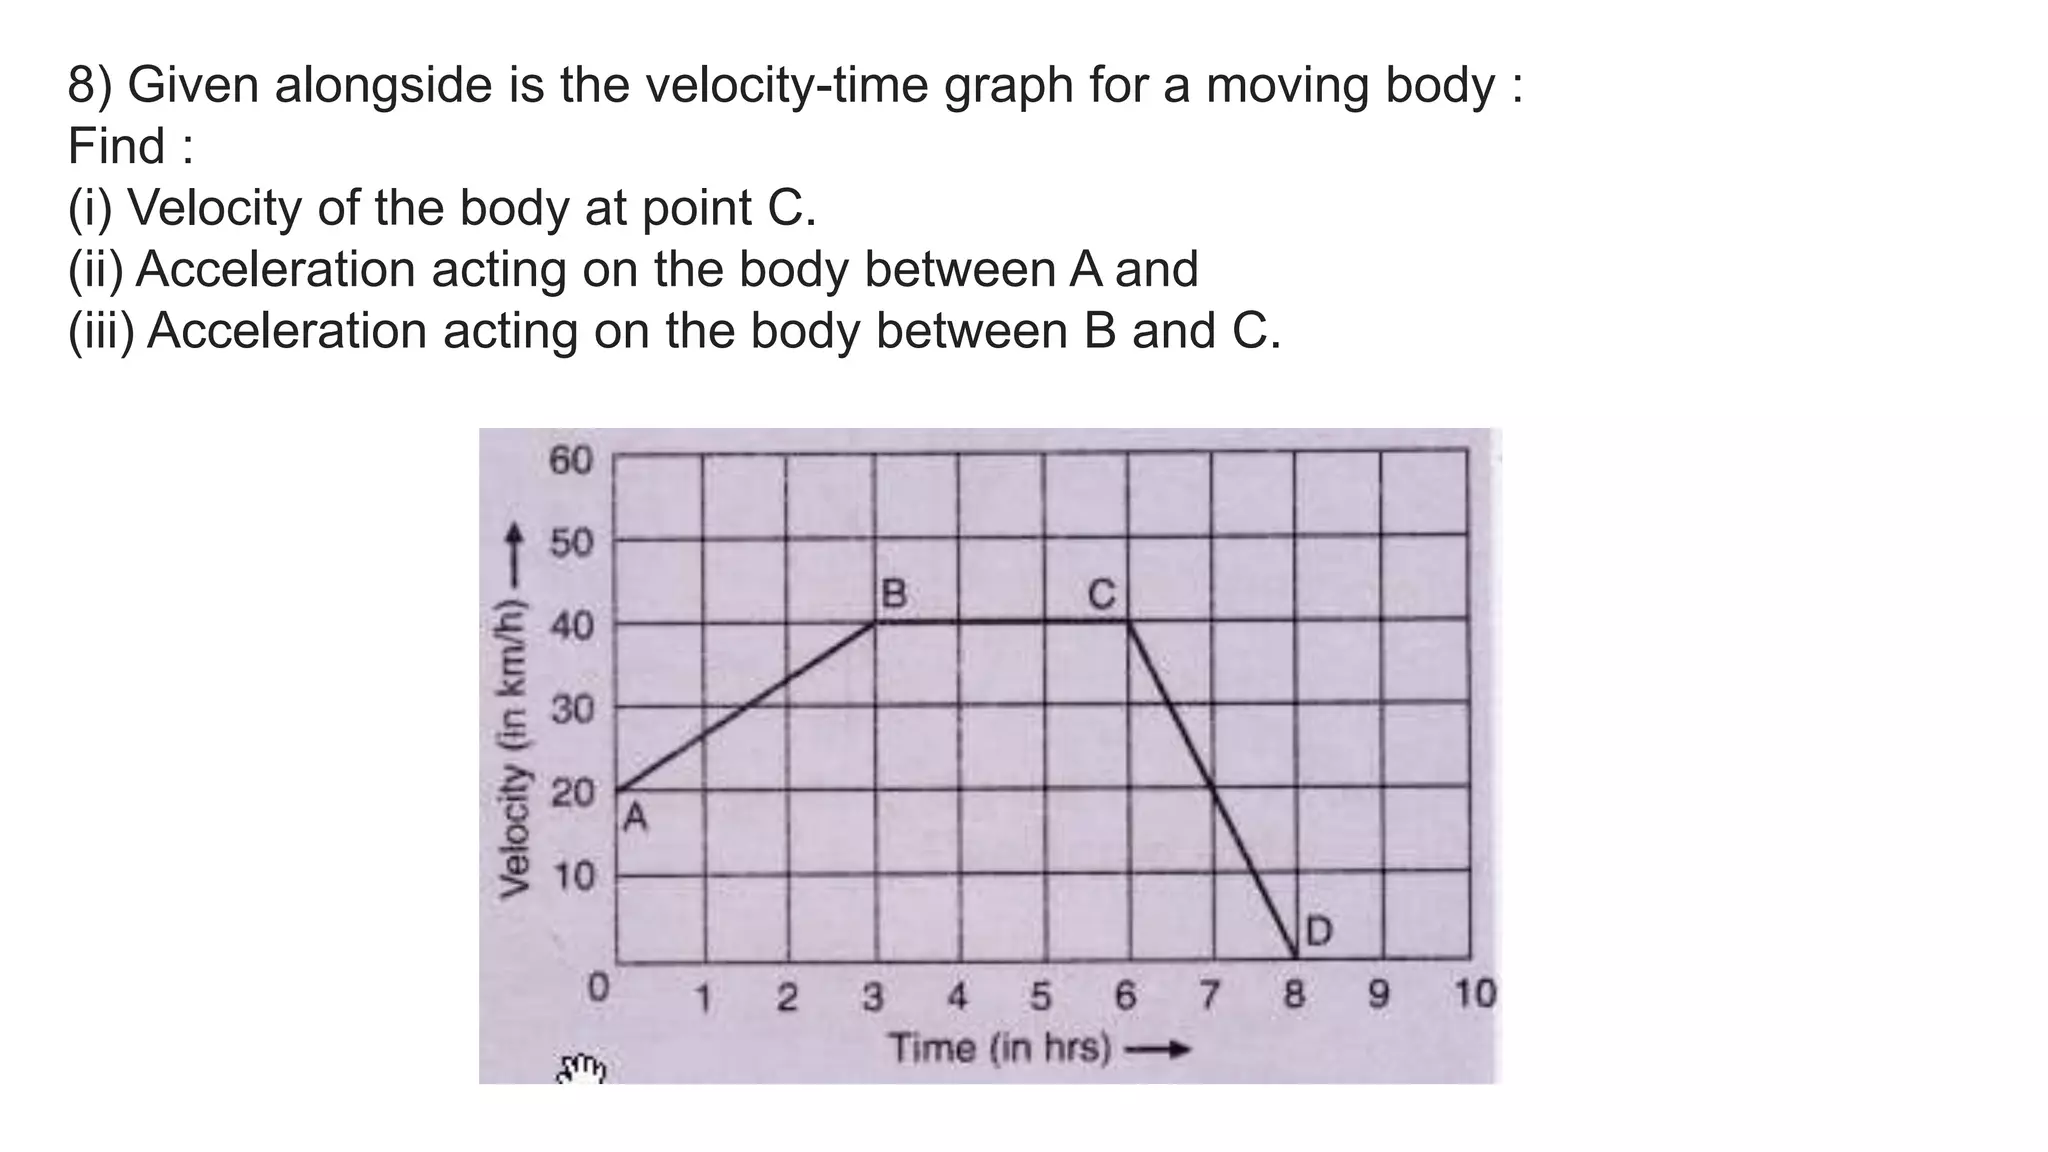
8) Given alongsideis the velocity-time graph for a moving body :
Find :
(i) Velocity of the body at point C.
(ii) Acceleration acting on the body between A and
(iii) Acceleration acting on the body between B and C.
16.
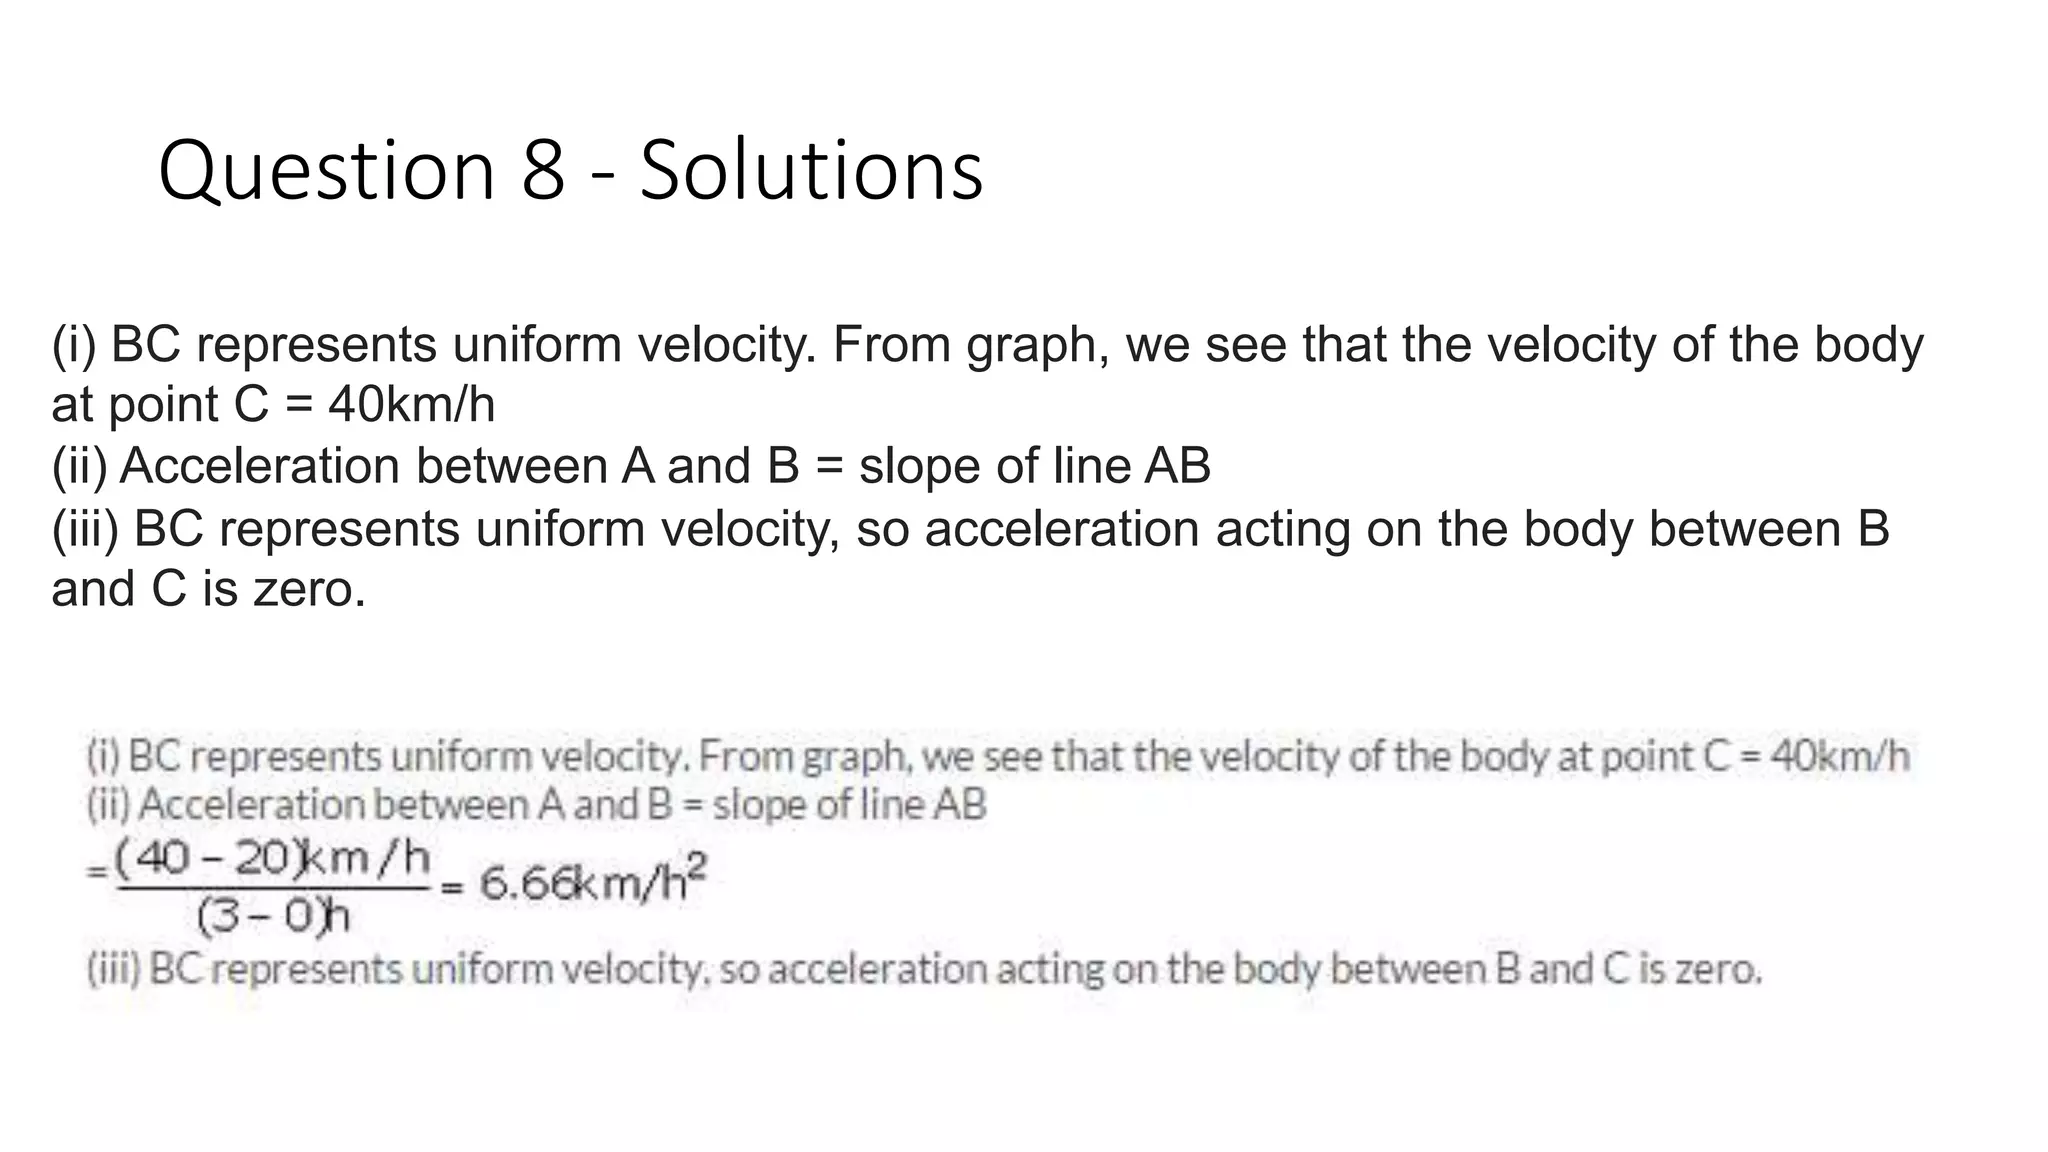
Question 8 -Solutions
(i) BC represents uniform velocity. From graph, we see that the velocity of the body
at point C = 40km/h
(ii) Acceleration between A and B = slope of line AB
(iii) BC represents uniform velocity, so acceleration acting on the body between B
and C is zero.


![8motion [autosaved]](https://cdn.slidesharecdn.com/ss_thumbnails/8motionautosaved-150707124342-lva1-app6891-thumbnail.jpg?width=640&height=640&fit=bounds)


![Topic 1 - Forces and Motion [Autosaved].pptx](https://cdn.slidesharecdn.com/ss_thumbnails/topic1-forcesandmotionautosaved-231219145058-b924d3b6-thumbnail.jpg?width=640&height=640&fit=bounds)


