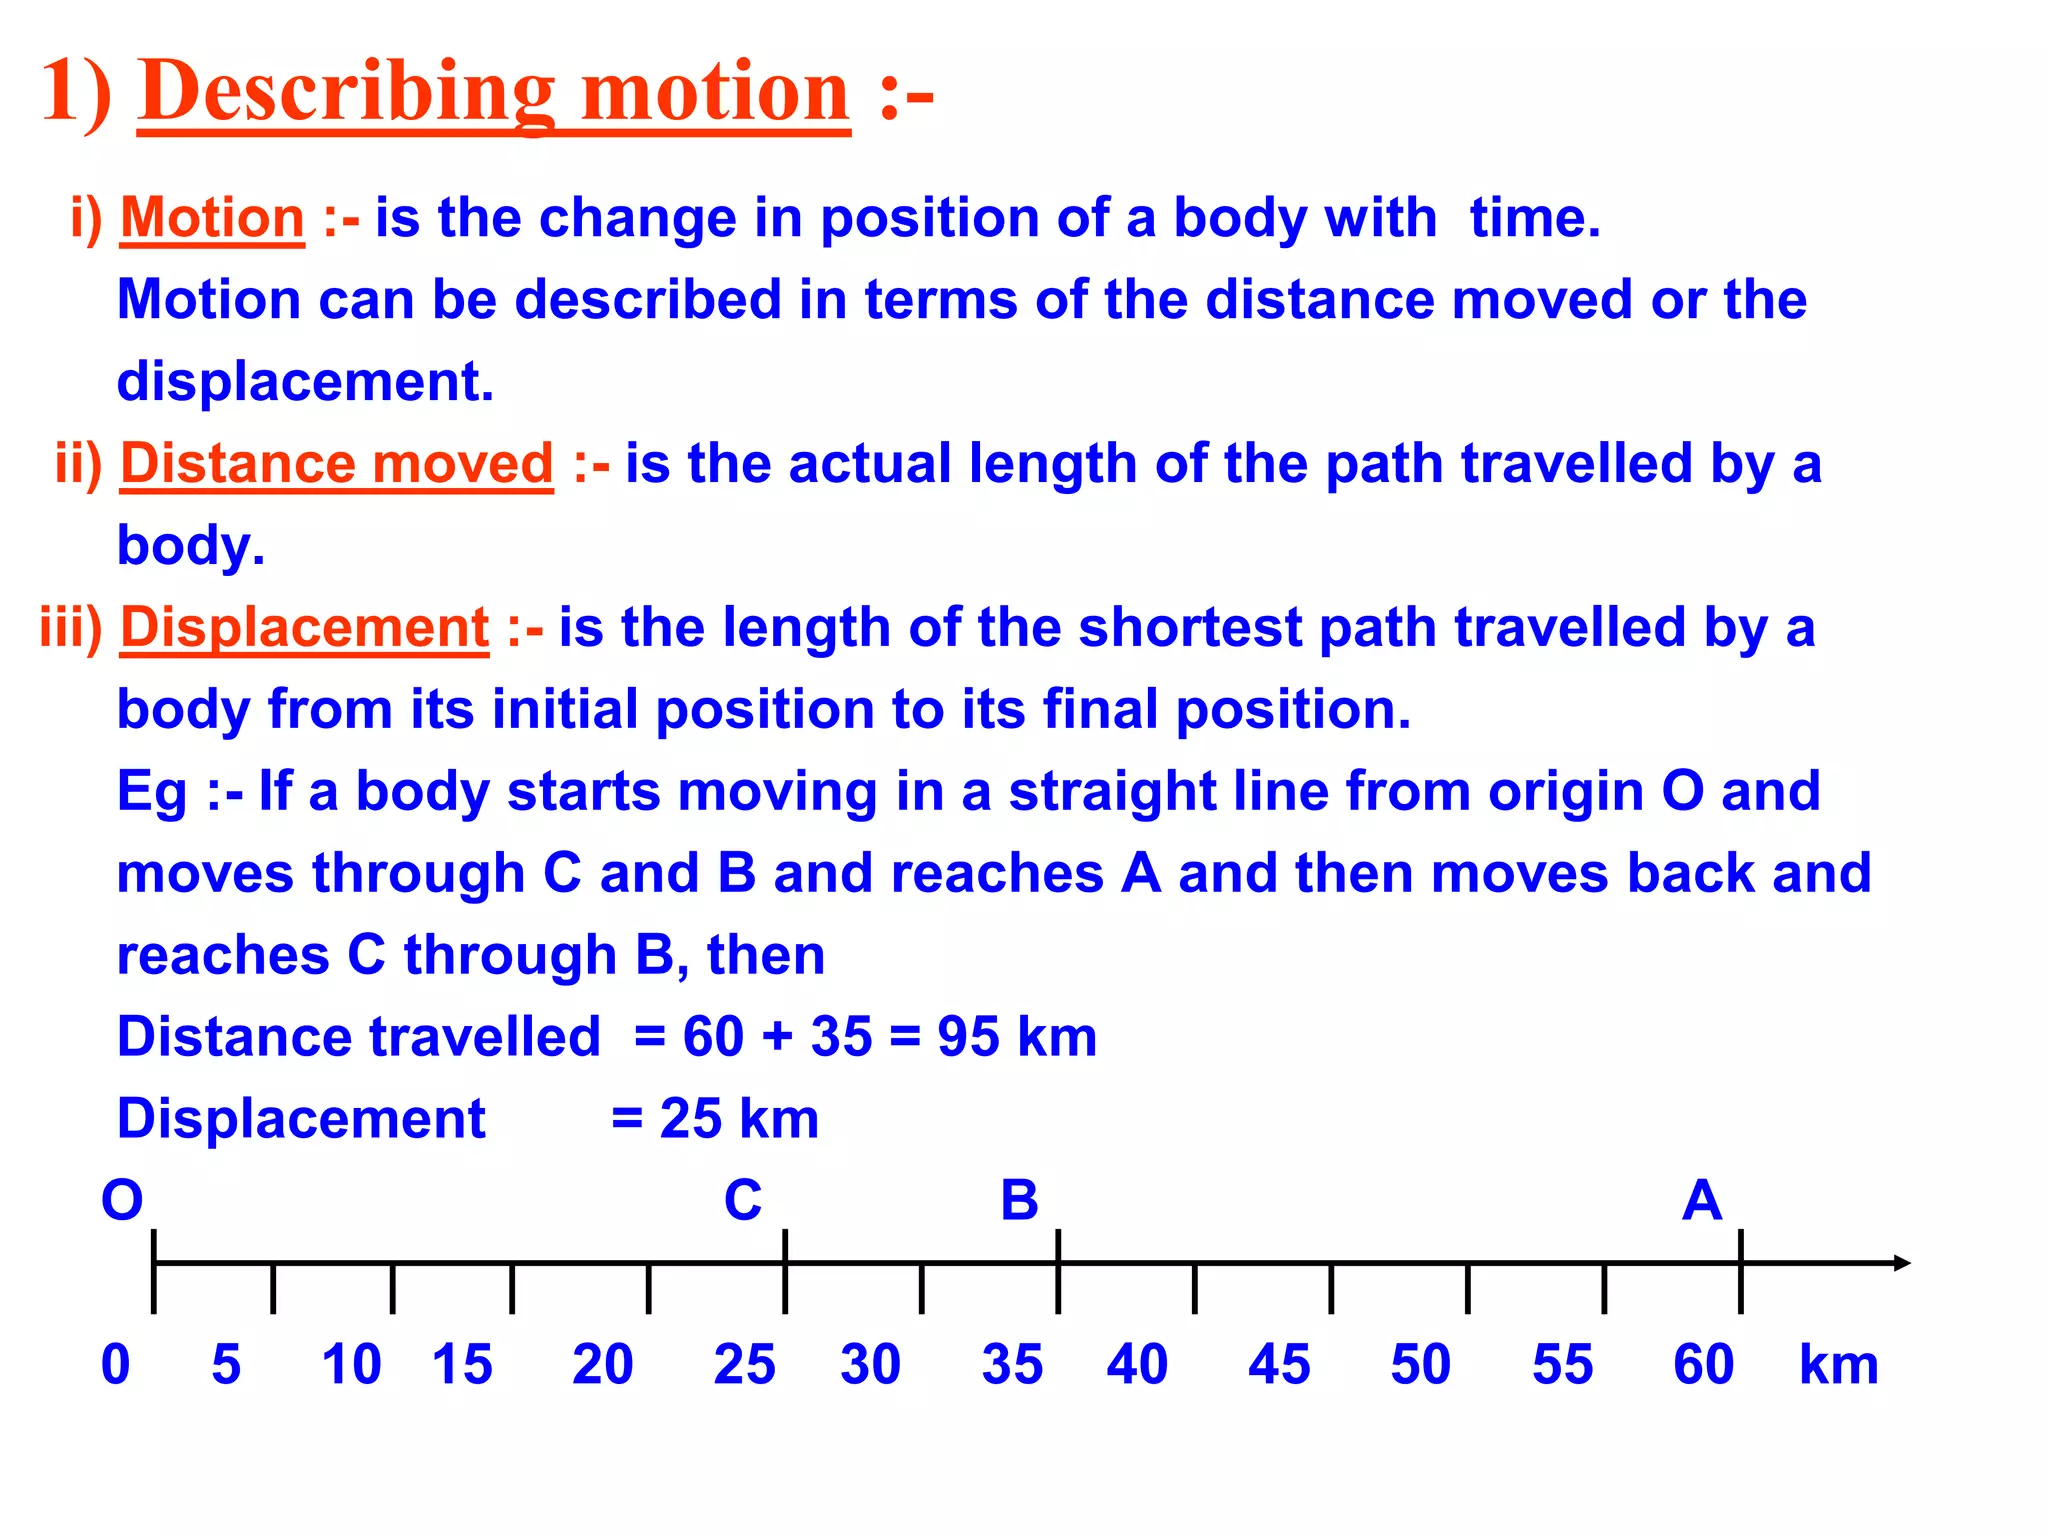
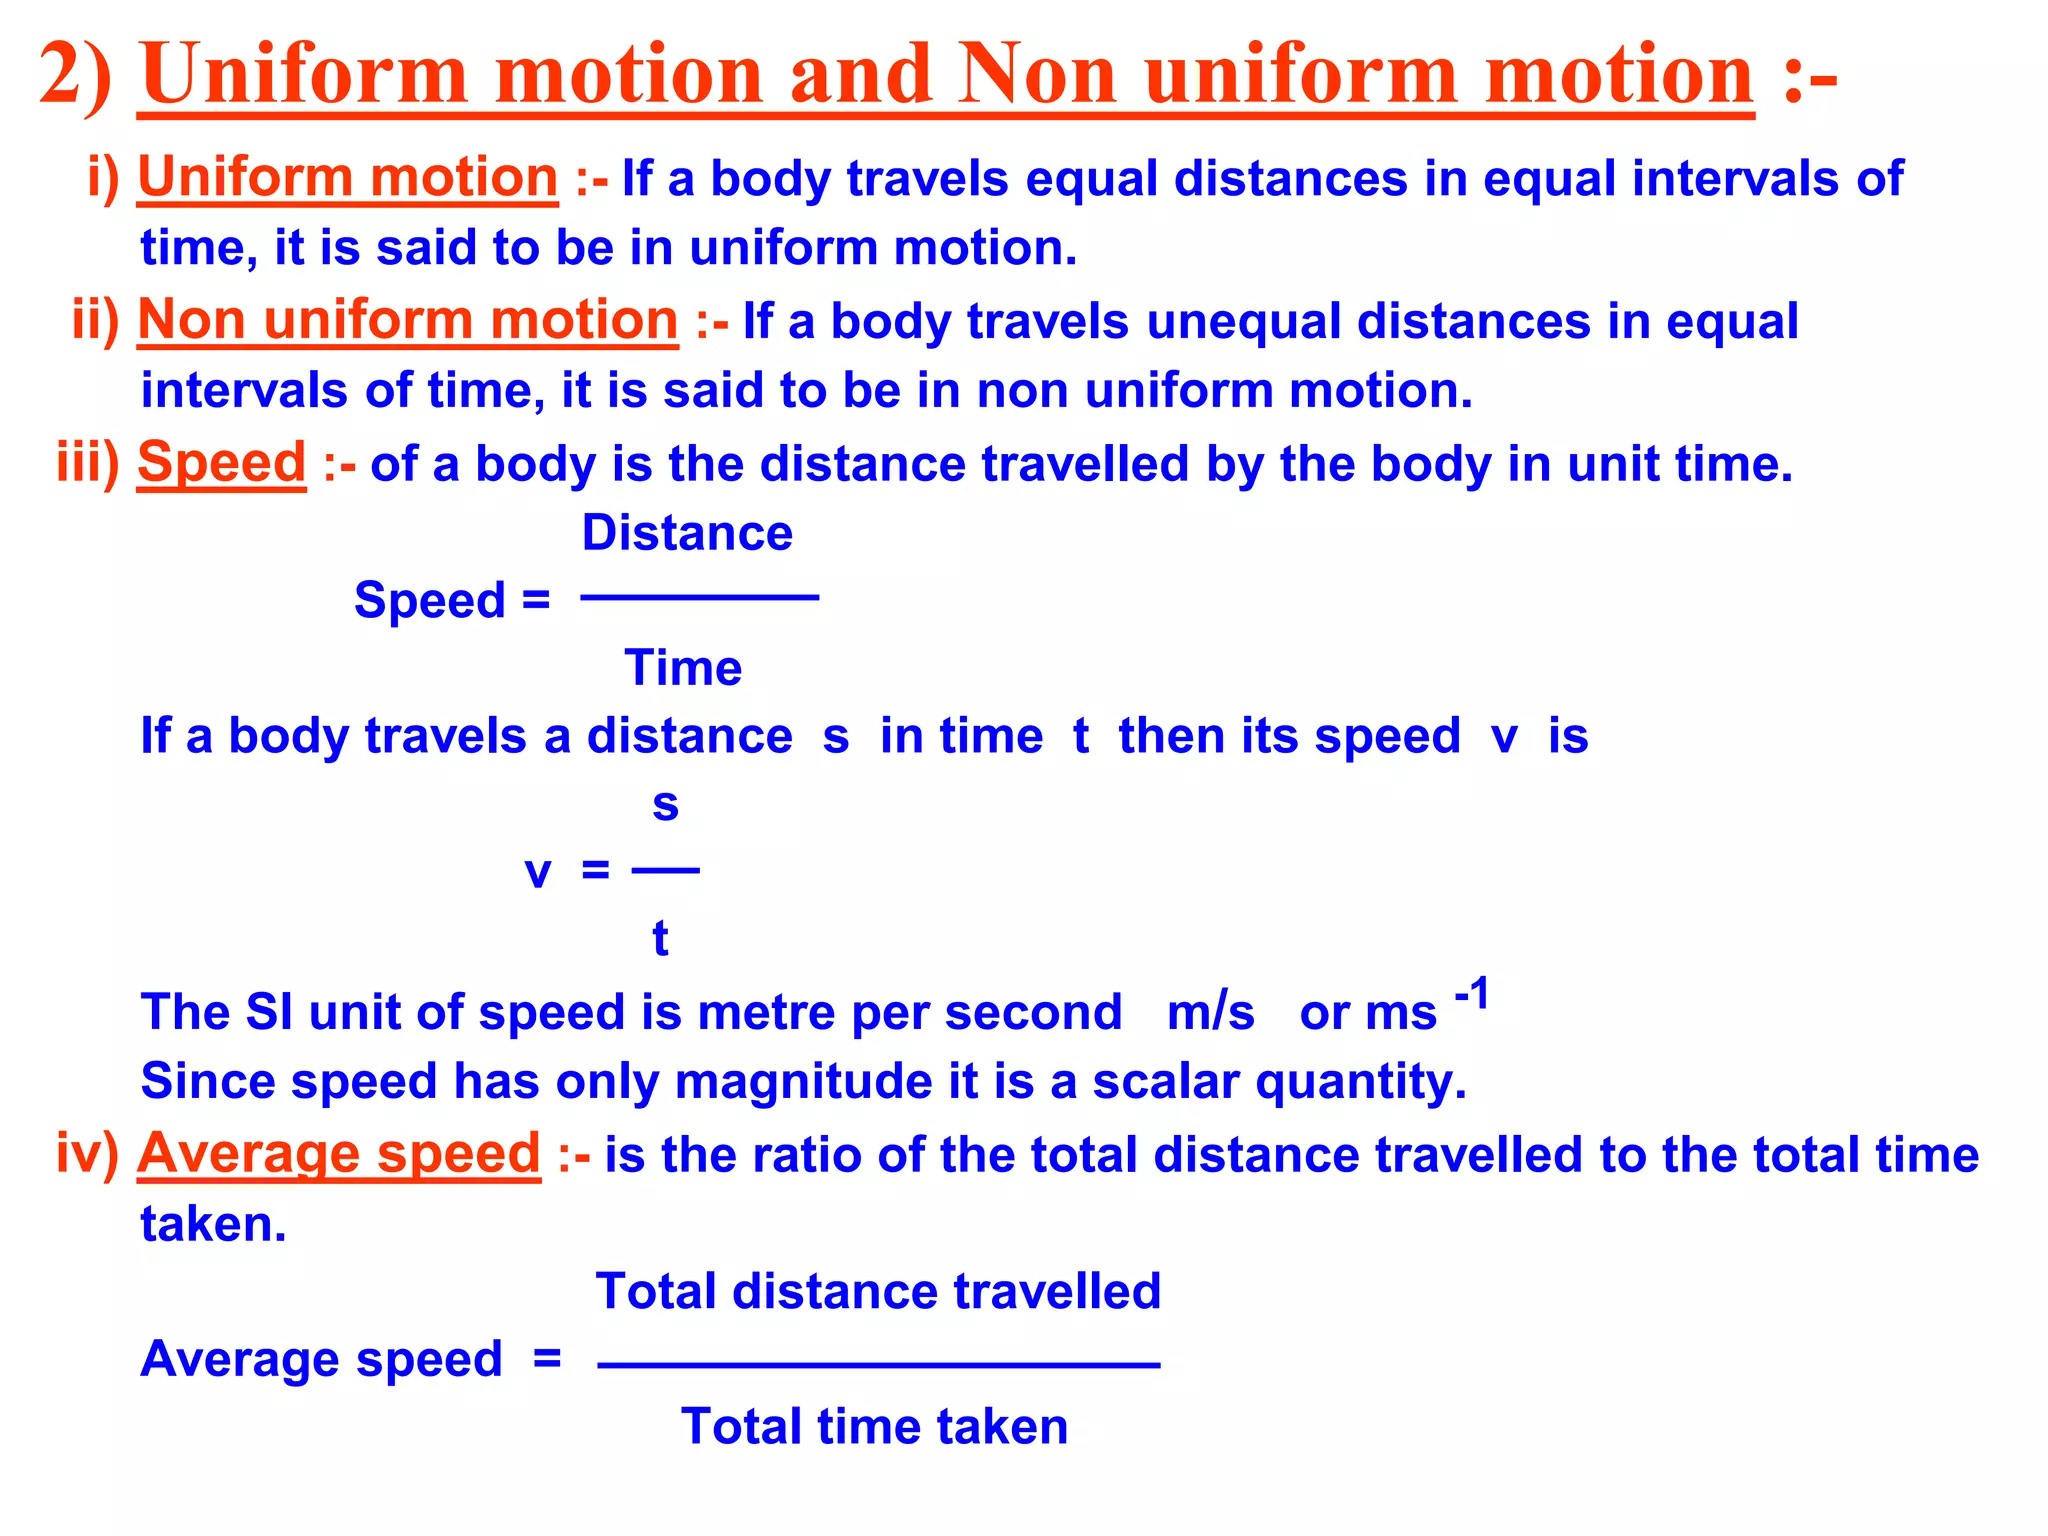
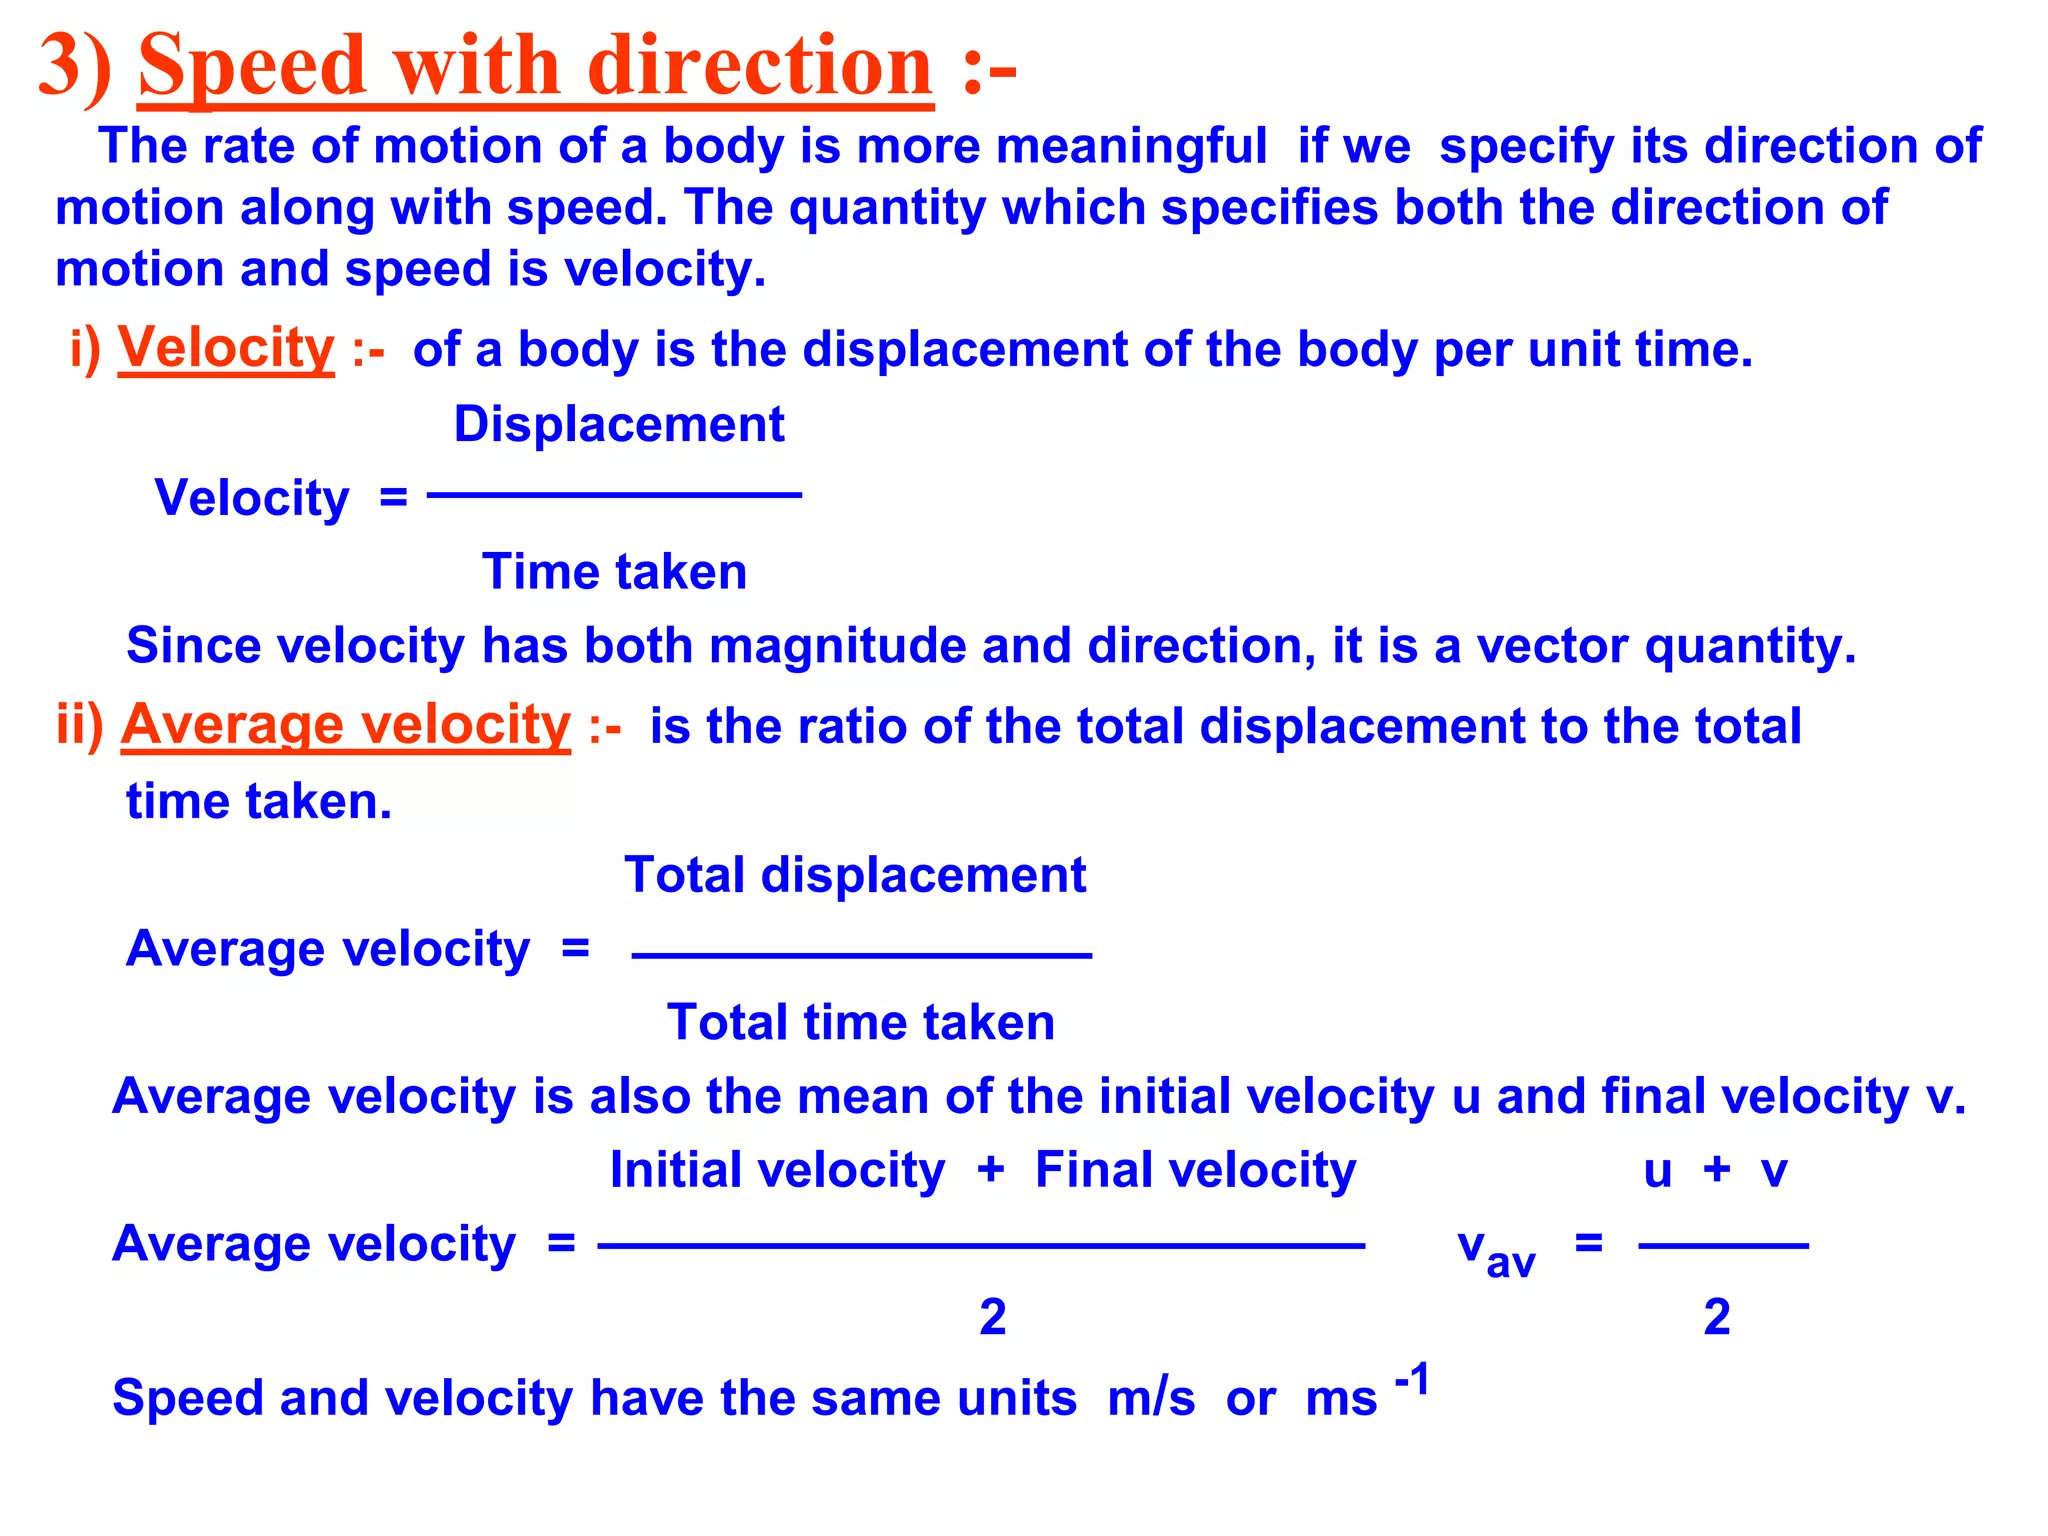
This is a ppt on motion for class 9 studying students, hope you like it. If you have any questions message me on http;//sh.st/PVqfi
Regards
Mridul Verma
Innocent Hearts School
This is a ppt on motion for class 9 studying students, hope you like it. If you have any questions message me on http;//sh.st/PVqfi
Regards
Mridul Verma
Innocent Hearts School
This PPT is based on Physics on Chapter Motion. In this you will find every thing of that chapter with great images. in this PPT their are many animation and images .
thank you
This PPT is based on Physics on Chapter Motion. In this you will find every thing of that chapter with great images. in this PPT their are many animation and images .
thank you
motion lesson into simple teIn physics, motion is the phenomenon in which an object changes its position over time. Motion is mathematically described in terms of displacement, distance, velocity, acceleration, speed, and time. ... As there is no absolute frame of reference, absolute motion cannot be determined.rms and equation sums
CBSE Class 9&10th Sample eBook , which helps you to understand the chapter in easy way also downaload sample papers and previous year papers and practice to solve the question on time. Download at www.misostudy.com.
CBSE Class 9th Sample eBook, which helps you to understand the chapter in easy way also downaload sample papers and previous year papers and practice to solve the question on time. Download at www.misostudy.com.
Nutraceutical market, scope and growth: Herbal drug technologyLokesh Patil
As consumer awareness of health and wellness rises, the nutraceutical market—which includes goods like functional meals, drinks, and dietary supplements that provide health advantages beyond basic nutrition—is growing significantly. As healthcare expenses rise, the population ages, and people want natural and preventative health solutions more and more, this industry is increasing quickly. Further driving market expansion are product formulation innovations and the use of cutting-edge technology for customized nutrition. With its worldwide reach, the nutraceutical industry is expected to keep growing and provide significant chances for research and investment in a number of categories, including vitamins, minerals, probiotics, and herbal supplements.
Richard's aventures in two entangled wonderlandsRichard Gill
Since the loophole-free Bell experiments of 2020 and the Nobel prizes in physics of 2022, critics of Bell's work have retreated to the fortress of super-determinism. Now, super-determinism is a derogatory word - it just means "determinism". Palmer, Hance and Hossenfelder argue that quantum mechanics and determinism are not incompatible, using a sophisticated mathematical construction based on a subtle thinning of allowed states and measurements in quantum mechanics, such that what is left appears to make Bell's argument fail, without altering the empirical predictions of quantum mechanics. I think however that it is a smoke screen, and the slogan "lost in math" comes to my mind. I will discuss some other recent disproofs of Bell's theorem using the language of causality based on causal graphs. Causal thinking is also central to law and justice. I will mention surprising connections to my work on serial killer nurse cases, in particular the Dutch case of Lucia de Berk and the current UK case of Lucy Letby.
Remote Sensing and Computational, Evolutionary, Supercomputing, and Intellige...University of Maribor
Slides from talk:
Aleš Zamuda: Remote Sensing and Computational, Evolutionary, Supercomputing, and Intelligent Systems.
11th International Conference on Electrical, Electronics and Computer Engineering (IcETRAN), Niš, 3-6 June 2024
Inter-Society Networking Panel GRSS/MTT-S/CIS Panel Session: Promoting Connection and Cooperation
https://www.etran.rs/2024/en/home-english/
This presentation explores a brief idea about the structural and functional attributes of nucleotides, the structure and function of genetic materials along with the impact of UV rays and pH upon them.
The ability to recreate computational results with minimal effort and actionable metrics provides a solid foundation for scientific research and software development. When people can replicate an analysis at the touch of a button using open-source software, open data, and methods to assess and compare proposals, it significantly eases verification of results, engagement with a diverse range of contributors, and progress. However, we have yet to fully achieve this; there are still many sociotechnical frictions.
Inspired by David Donoho's vision, this talk aims to revisit the three crucial pillars of frictionless reproducibility (data sharing, code sharing, and competitive challenges) with the perspective of deep software variability.
Our observation is that multiple layers — hardware, operating systems, third-party libraries, software versions, input data, compile-time options, and parameters — are subject to variability that exacerbates frictions but is also essential for achieving robust, generalizable results and fostering innovation. I will first review the literature, providing evidence of how the complex variability interactions across these layers affect qualitative and quantitative software properties, thereby complicating the reproduction and replication of scientific studies in various fields.
I will then present some software engineering and AI techniques that can support the strategic exploration of variability spaces. These include the use of abstractions and models (e.g., feature models), sampling strategies (e.g., uniform, random), cost-effective measurements (e.g., incremental build of software configurations), and dimensionality reduction methods (e.g., transfer learning, feature selection, software debloating).
I will finally argue that deep variability is both the problem and solution of frictionless reproducibility, calling the software science community to develop new methods and tools to manage variability and foster reproducibility in software systems.
Exposé invité Journées Nationales du GDR GPL 2024
Toxic effects of heavy metals : Lead and Arsenicsanjana502982
Heavy metals are naturally occuring metallic chemical elements that have relatively high density, and are toxic at even low concentrations. All toxic metals are termed as heavy metals irrespective of their atomic mass and density, eg. arsenic, lead, mercury, cadmium, thallium, chromium, etc.
Travis Hills' Endeavors in Minnesota: Fostering Environmental and Economic Pr...Travis Hills MN
Travis Hills of Minnesota developed a method to convert waste into high-value dry fertilizer, significantly enriching soil quality. By providing farmers with a valuable resource derived from waste, Travis Hills helps enhance farm profitability while promoting environmental stewardship. Travis Hills' sustainable practices lead to cost savings and increased revenue for farmers by improving resource efficiency and reducing waste.
Earliest Galaxies in the JADES Origins Field: Luminosity Function and Cosmic ...Sérgio Sacani
We characterize the earliest galaxy population in the JADES Origins Field (JOF), the deepest
imaging field observed with JWST. We make use of the ancillary Hubble optical images (5 filters
spanning 0.4−0.9µm) and novel JWST images with 14 filters spanning 0.8−5µm, including 7 mediumband filters, and reaching total exposure times of up to 46 hours per filter. We combine all our data
at > 2.3µm to construct an ultradeep image, reaching as deep as ≈ 31.4 AB mag in the stack and
30.3-31.0 AB mag (5σ, r = 0.1” circular aperture) in individual filters. We measure photometric
redshifts and use robust selection criteria to identify a sample of eight galaxy candidates at redshifts
z = 11.5 − 15. These objects show compact half-light radii of R1/2 ∼ 50 − 200pc, stellar masses of
M⋆ ∼ 107−108M⊙, and star-formation rates of SFR ∼ 0.1−1 M⊙ yr−1
. Our search finds no candidates
at 15 < z < 20, placing upper limits at these redshifts. We develop a forward modeling approach to
infer the properties of the evolving luminosity function without binning in redshift or luminosity that
marginalizes over the photometric redshift uncertainty of our candidate galaxies and incorporates the
impact of non-detections. We find a z = 12 luminosity function in good agreement with prior results,
and that the luminosity function normalization and UV luminosity density decline by a factor of ∼ 2.5
from z = 12 to z = 14. We discuss the possible implications of our results in the context of theoretical
models for evolution of the dark matter halo mass function.
Observation of Io’s Resurfacing via Plume Deposition Using Ground-based Adapt...Sérgio Sacani
Since volcanic activity was first discovered on Io from Voyager images in 1979, changes
on Io’s surface have been monitored from both spacecraft and ground-based telescopes.
Here, we present the highest spatial resolution images of Io ever obtained from a groundbased telescope. These images, acquired by the SHARK-VIS instrument on the Large
Binocular Telescope, show evidence of a major resurfacing event on Io’s trailing hemisphere. When compared to the most recent spacecraft images, the SHARK-VIS images
show that a plume deposit from a powerful eruption at Pillan Patera has covered part
of the long-lived Pele plume deposit. Although this type of resurfacing event may be common on Io, few have been detected due to the rarity of spacecraft visits and the previously low spatial resolution available from Earth-based telescopes. The SHARK-VIS instrument ushers in a new era of high resolution imaging of Io’s surface using adaptive
optics at visible wavelengths.
Deep Behavioral Phenotyping in Systems Neuroscience for Functional Atlasing a...Ana Luísa Pinho
Functional Magnetic Resonance Imaging (fMRI) provides means to characterize brain activations in response to behavior. However, cognitive neuroscience has been limited to group-level effects referring to the performance of specific tasks. To obtain the functional profile of elementary cognitive mechanisms, the combination of brain responses to many tasks is required. Yet, to date, both structural atlases and parcellation-based activations do not fully account for cognitive function and still present several limitations. Further, they do not adapt overall to individual characteristics. In this talk, I will give an account of deep-behavioral phenotyping strategies, namely data-driven methods in large task-fMRI datasets, to optimize functional brain-data collection and improve inference of effects-of-interest related to mental processes. Key to this approach is the employment of fast multi-functional paradigms rich on features that can be well parametrized and, consequently, facilitate the creation of psycho-physiological constructs to be modelled with imaging data. Particular emphasis will be given to music stimuli when studying high-order cognitive mechanisms, due to their ecological nature and quality to enable complex behavior compounded by discrete entities. I will also discuss how deep-behavioral phenotyping and individualized models applied to neuroimaging data can better account for the subject-specific organization of domain-general cognitive systems in the human brain. Finally, the accumulation of functional brain signatures brings the possibility to clarify relationships among tasks and create a univocal link between brain systems and mental functions through: (1) the development of ontologies proposing an organization of cognitive processes; and (2) brain-network taxonomies describing functional specialization. To this end, tools to improve commensurability in cognitive science are necessary, such as public repositories, ontology-based platforms and automated meta-analysis tools. I will thus discuss some brain-atlasing resources currently under development, and their applicability in cognitive as well as clinical neuroscience.
The use of Nauplii and metanauplii artemia in aquaculture (brine shrimp).pptxMAGOTI ERNEST
Although Artemia has been known to man for centuries, its use as a food for the culture of larval organisms apparently began only in the 1930s, when several investigators found that it made an excellent food for newly hatched fish larvae (Litvinenko et al., 2023). As aquaculture developed in the 1960s and ‘70s, the use of Artemia also became more widespread, due both to its convenience and to its nutritional value for larval organisms (Arenas-Pardo et al., 2024). The fact that Artemia dormant cysts can be stored for long periods in cans, and then used as an off-the-shelf food requiring only 24 h of incubation makes them the most convenient, least labor-intensive, live food available for aquaculture (Sorgeloos & Roubach, 2021). The nutritional value of Artemia, especially for marine organisms, is not constant, but varies both geographically and temporally. During the last decade, however, both the causes of Artemia nutritional variability and methods to improve poorquality Artemia have been identified (Loufi et al., 2024).
Brine shrimp (Artemia spp.) are used in marine aquaculture worldwide. Annually, more than 2,000 metric tons of dry cysts are used for cultivation of fish, crustacean, and shellfish larva. Brine shrimp are important to aquaculture because newly hatched brine shrimp nauplii (larvae) provide a food source for many fish fry (Mozanzadeh et al., 2021). Culture and harvesting of brine shrimp eggs represents another aspect of the aquaculture industry. Nauplii and metanauplii of Artemia, commonly known as brine shrimp, play a crucial role in aquaculture due to their nutritional value and suitability as live feed for many aquatic species, particularly in larval stages (Sorgeloos & Roubach, 2021).
2. 1) Describing motion :-
i) Motion :- is the change in position of a body with time.
Motion can be described in terms of the distance moved or the
displacement.
ii) Distance moved :- is the actual length of the path travelled by a
body.
iii) Displacement :- is the length of the shortest path travelled by a
body from its initial position to its final position.
Eg :- If a body starts moving in a straight line from origin O and
moves through C and B and reaches A and then moves back and
reaches C through B, then
Distance travelled = 60 + 35 = 95 km
Displacement = 25 km
O C B A
0 5 10 15 20 25 30 35 40 45 50 55 60 km
3. 2) Uniform motion and Non uniform motion :-
i) Uniform motion :- If a body travels equal distances in equal intervals of
time, it is said to be in uniform motion.
ii) Non uniform motion :- If a body travels unequal distances in equal
intervals of time, it is said to be in non uniform motion.
iii) Speed :- of a body is the distance travelled by the body in unit time.
Distance
Speed =
Time
If a body travels a distance s in time t then its speed v is
s
v =
t
The SI unit of speed is metre per second m/s or ms -1
Since speed has only magnitude it is a scalar quantity.
iv) Average speed :- is the ratio of the total distance travelled to the total time
taken.
Total distance travelled
Average speed =
Total time taken
4. 3) Speed with direction :-
The rate of motion of a body is more meaningful if we specify its direction of
motion along with speed. The quantity which specifies both the direction of
motion and speed is velocity.
i) Velocity :- of a body is the displacement of the body per unit time.
Displacement
Velocity =
Time taken
Since velocity has both magnitude and direction, it is a vector quantity.
ii) Average velocity :- is the ratio of the total displacement to the total
time taken.
Total displacement
Average velocity =
Total time taken
Average velocity is also the mean of the initial velocity u and final velocity v.
Initial velocity + Final velocity u + v
Average velocity = vav =
2 2
Speed and velocity have the same units m/s or ms -1
5. 4) Rate of change of velocity :-
During uniform motion of a body in a straight line the velocity remains
constant with time. In this case the change in velocity at any time interval is
zero ( no change in velocity).
During non uniform motion the velocity changes with time. In this case the
change in velocity at any time interval is not zero. It may be positive (+ ve) or
negative (- ve).
The quantity which specifies changes in velocity is acceleration.
Acceleration :- is the change in velocity of a body per unit time.( or the rate
of change of velocity.)
Change in velocity
Acceleration =
Time
If the velocity of a body changes from initial value u to final value v in time t,
then acceleration a is
v - u
a =
t
The SI unit of acceleration is ms - 2
Uniform acceleration :- If the change in velocity is equal in equal intervals
of time it is uniform acceleration.
Non uniform acceleration :- If the change in velocity is unequal in equal
intervals of time it is non uniform acceleration.
6. 5) Graphical representation of motion :-
a) Distance – Time graphs :-
The change in the position of a body with time can be represented on the
distance time graph. In this graph distance is taken on the y – axis and time is
taken on the x – axis.
i) The distance time graph for uniform speed is a straight line ( linear ). This is
because in uniform speed a body travels equal distances in equal intervals of
time.
We can determine the speed of the body from the distance – time graph.
For the speed of the body between the points A and B, distance is (s2 – s1)
and time is (t2 – t1).
s (s2 – s1)
v = ---- v = -----------
t (t2 – t1)
20 – 10 10
= --------- = ----
10 – 5 5
= 2 ms -1 A
B
10
20
30
t1 t2
s1
s2
C
Time (s)
Distance
(m)
X
Y
5 10 15 20
Distance – time graph for a body moving with uniform speed
0
7. ii) The distance – time graph for non uniform motion is non linear. This is
because in non uniform speed a body travels unequal distances in equal
intervals of time.
20
40
Time (s)
Distance
(m)
X
10
30
5
0 10 15 20
Distance – time graph for a body moving with non uniform speed
Y
8. b) Velocity – time graphs :-
The change in the velocity of a body with time can be represented on the
velocity time graph. In this graph velocity is taken on the y – axis and time is
taken on the x – axis.
i) If a body moves with uniform velocity, the graph will be a straight line
parallel to the x – axis . This is because the velocity does not change with
time.
To determine the distance travelled by the body between the points A and B
with velocity 20 km h-1
s
v = ---
t
s = v x t
v = 20 km h-1 = AC or BD
t = t2 – t1 = DC
= AC (t2 – t1)
s = AC X CD
s = area of the rectangle ABDC
20
40
Time (s)
Velocity
(km
h
-1
)
X
10
30
5
0 10 15 20
t1 t2
A B
C D
Velocity – time graph for a body moving with uniform velocity
Y
9. ii) If a body whose velocity is increasing with time, the graph is a straight line
having an increasing slope. This is because the velocity increases by equal
amounts with equal intervals of time.
The area under the velocity – time graph is the distance (magnitude of
displacement) of the body.
The distance travelled by a body between the points A and E is the area
ABCDE under the velocity – time graph.
s = area ABCDE
= area of rectangle ABCD
+ area of triangle ADE
1
s = AB X BC + --- ( AD X DE )
2
A
B
10
20
30
t1 t2 C
Time (s)
Velocity
(m
s
-1
)
X
Y
10 20 30 40
Velocity – time graph for a body moving with uniform acceleration
D
E
0
10. iii) If a body whose velocity is decreasing with time, the graph is a straight
line having an decreasing slope. This is because the velocity decreases by
equal amounts with equal intervals of time.
iv) If a body whose velocity is non uniform, the graph shows different
variations. This is because the velocity changes by unequal amounts in equal
intervals of time.
20
40
Time (s)
Velocity
(ms
-1
)
X
10
30
5
0 10 15 20
20
40
Time (s)
Velocity
(ms
-1
)
X
10
30
5
0 10 15 20
Velocity – time graph for a uniformly
decelerated motion
Velocity – time graph for
non uniform acceleration
Y Y
11. 6) Equations of motions by graphical method :-
The motion of a body moving with uniform acceleration can be
described with the help of three equations called equations of motion.
The equations of motion are :-
i) v = u + at
ii) s = ut + ½ at2
iii) 2as = v2 – u2
where u - is the initial velocity
v - is the final velocity
a - is acceleration
t - is the time
s - is the distance traveled
12. a) Equation for velocity – time relation ( v = u + at ) :-
Consider a velocity – time graph for a body moving with uniform acceleration
‘a’. The initial velocity is u at A and final velocity is v at B in time t.
Perpendicular lines BC and BE are drawn from point B to the time and
velocity axes so that the initial velocity is OA and final velocity is BC and time
interval is OC. Draw AD parallel to OC.
We observe that
BC = BD + DC = BD + OA
Substituting BC = v and OA = u
We get v = BD + u
or BD = v - u
Change in velocity
Acceleration = ---------------------------
Time
BD BD v - u
a = ----- = ----- or a = ---------
AD OC t
v – u = at or v = u + at Time (s)
Velocity
(ms
-1
)
X
O
Velocity – time graph for a uniformly
accelerated motion
Y
t
u
v
A
B
C
D
E
13. b) Equation for position – time relation (s = ut + ½ at2 ) :-
Consider a velocity – time graph for a body moving with uniform
acceleration ‘a’ travelled a distance s in time t.
The distance traveled by the body between the points A and B is the area
OABC.
s = area OABC ( which is a trapezium )
= area of rectangle OABC + area of triangle ABD
1
= OA X OC + --- ( AD X BD )
2
Substituting OA = u, OC = AD = t,
BD = v – u = at
We get
1
s = u x t + -- ( t x at )
2
or s = ut + ½ at2
Time (s)
Velocity
(ms
-1
)
O
Velocity – time graph for a uniformly
accelerated motion
t
u
v
A
B
C
D
E
14. c) Equation for position – velocity relation (2as = v2 –u2) :-
Consider a velocity – time graph for a body moving with uniform acceleration
‘a’ travelled a distance s in time t.
The distance travelled by the body between the points A and B is the area
OABC.
s = area of trapezium OABC
(OA + BC) X OC
s = ----------------------
2
Substituting OA = u, BC = v and OC = t
( u + v ) X t
We get s = -----------------
2
From velocity – time relation
( v – u )
t = -----------
a
( v + u ) X ( v – u )
s = ----------------------- or 2as = v2 – u 2
2a
Time (s)
Velocity
(ms
-1
)
O
Velocity – time graph for a uniformly
accelerated motion
t
u
v
A
B
C
D
E
15. 7) Circular motion :-
The motion of a body in a circular path is called circular motion.
Uniform circular motion :- If a body moves in a circular path with
uniform speed, its motion is called uniform circular motion.
Uniform circular motion is accelerated motion because in a circular motion a
body continuously changes its direction.
The circumference of a circle of radius r is given by 2лr. If a body takes time
t to go once around the circular path, then the velocity v is given by
2лr
v = ----
t