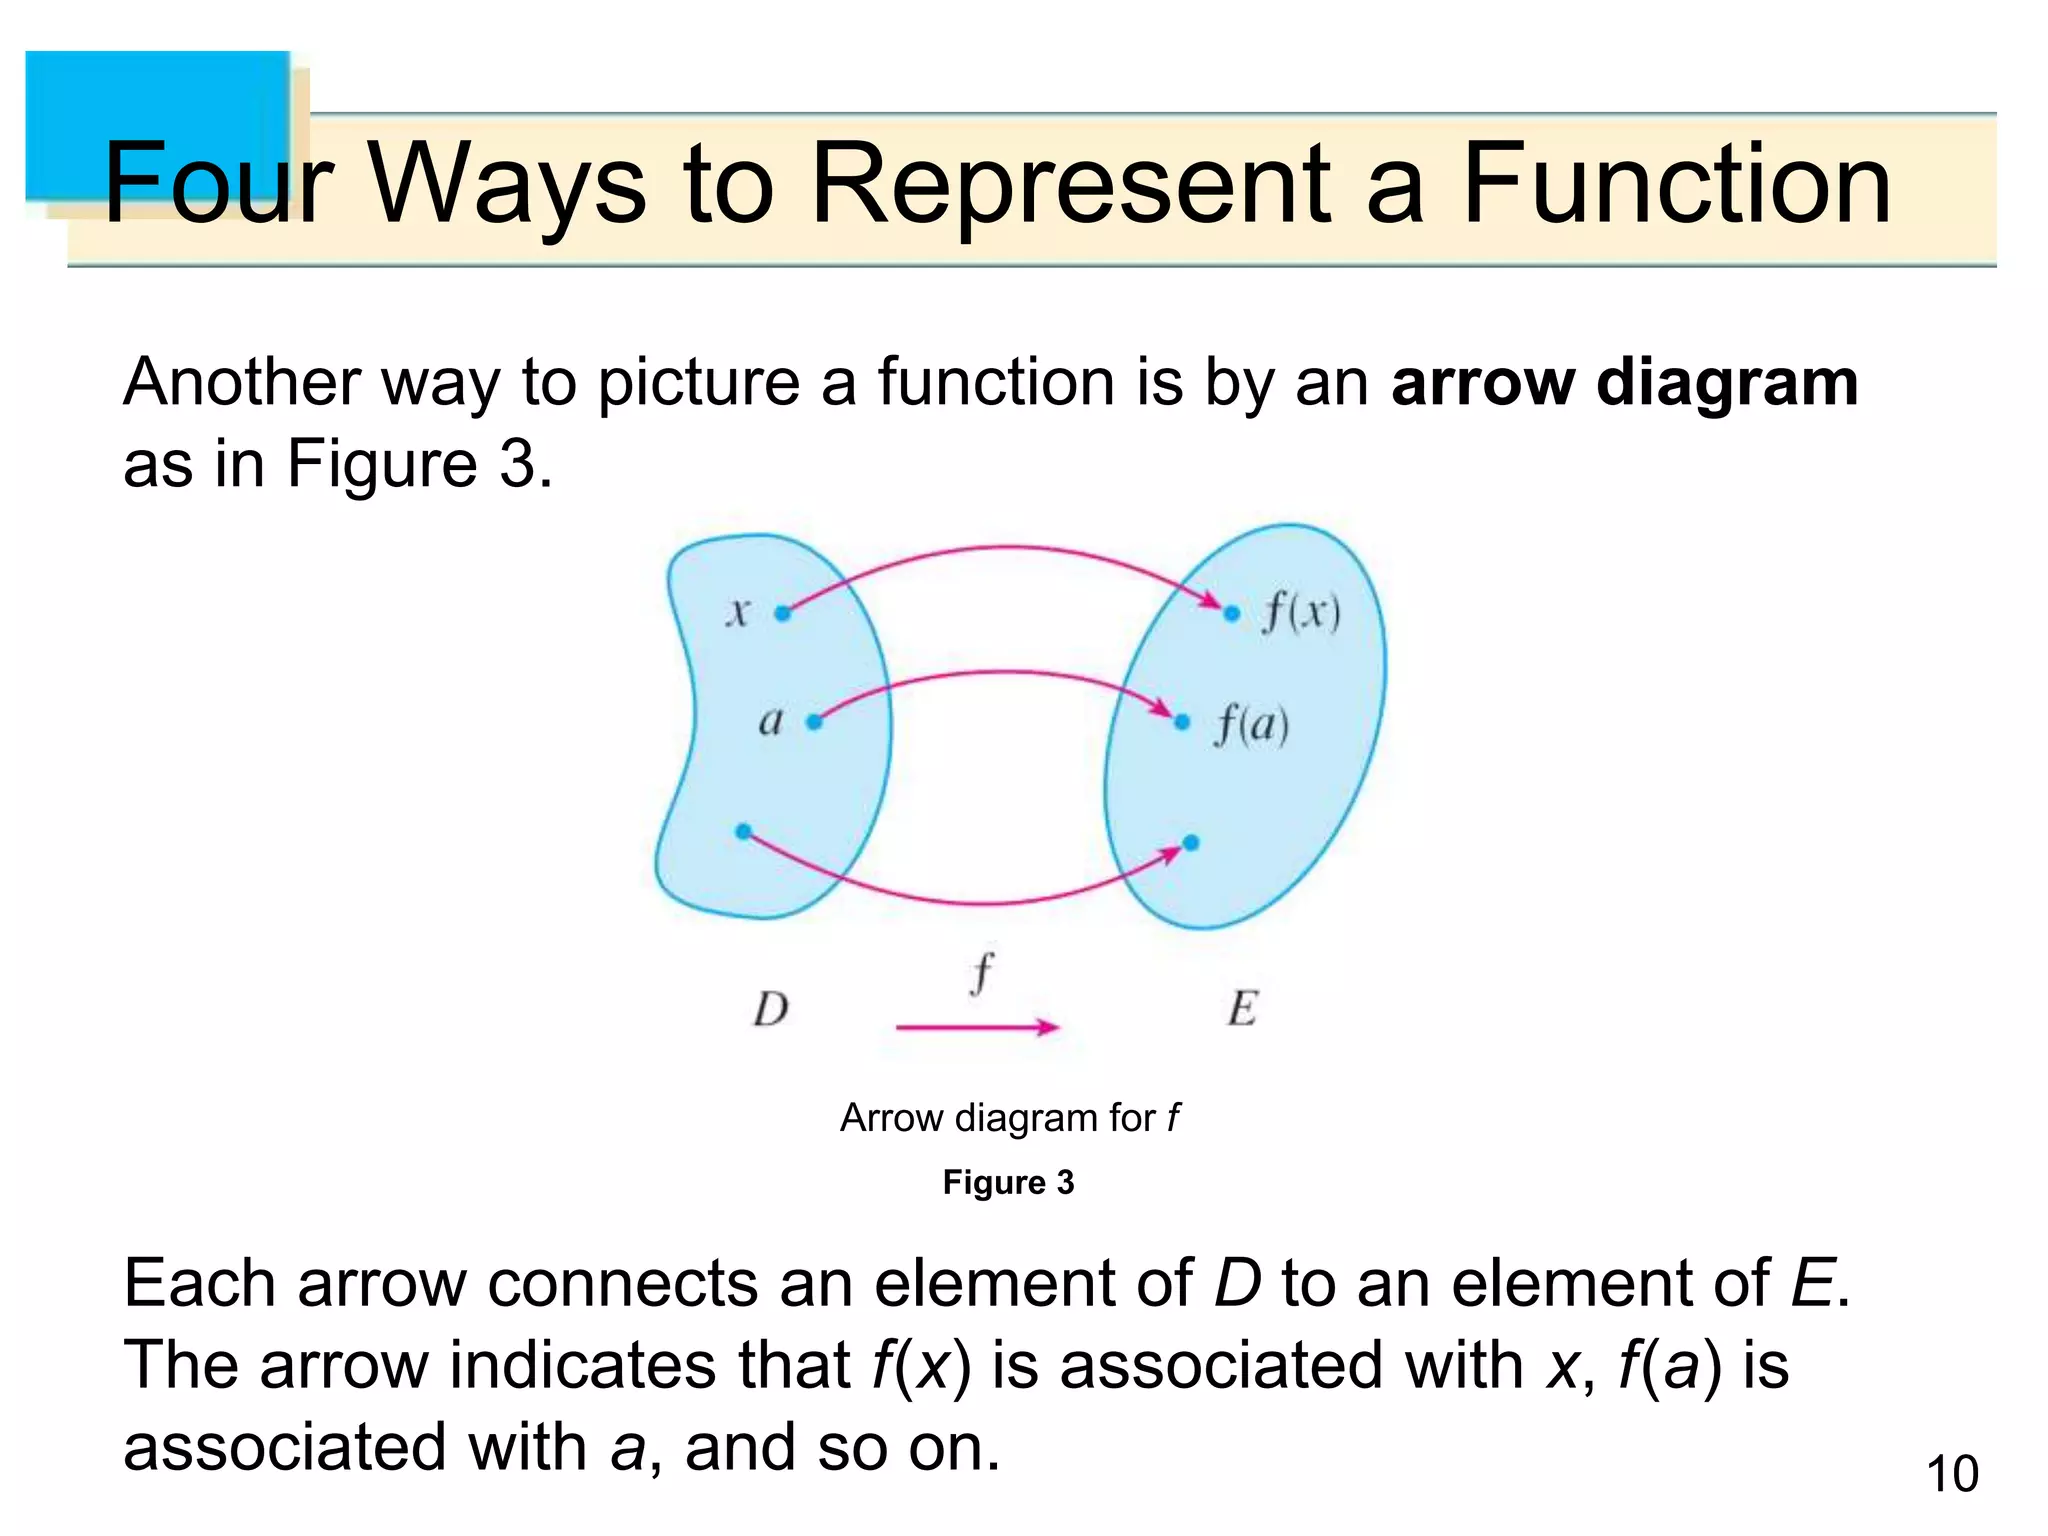
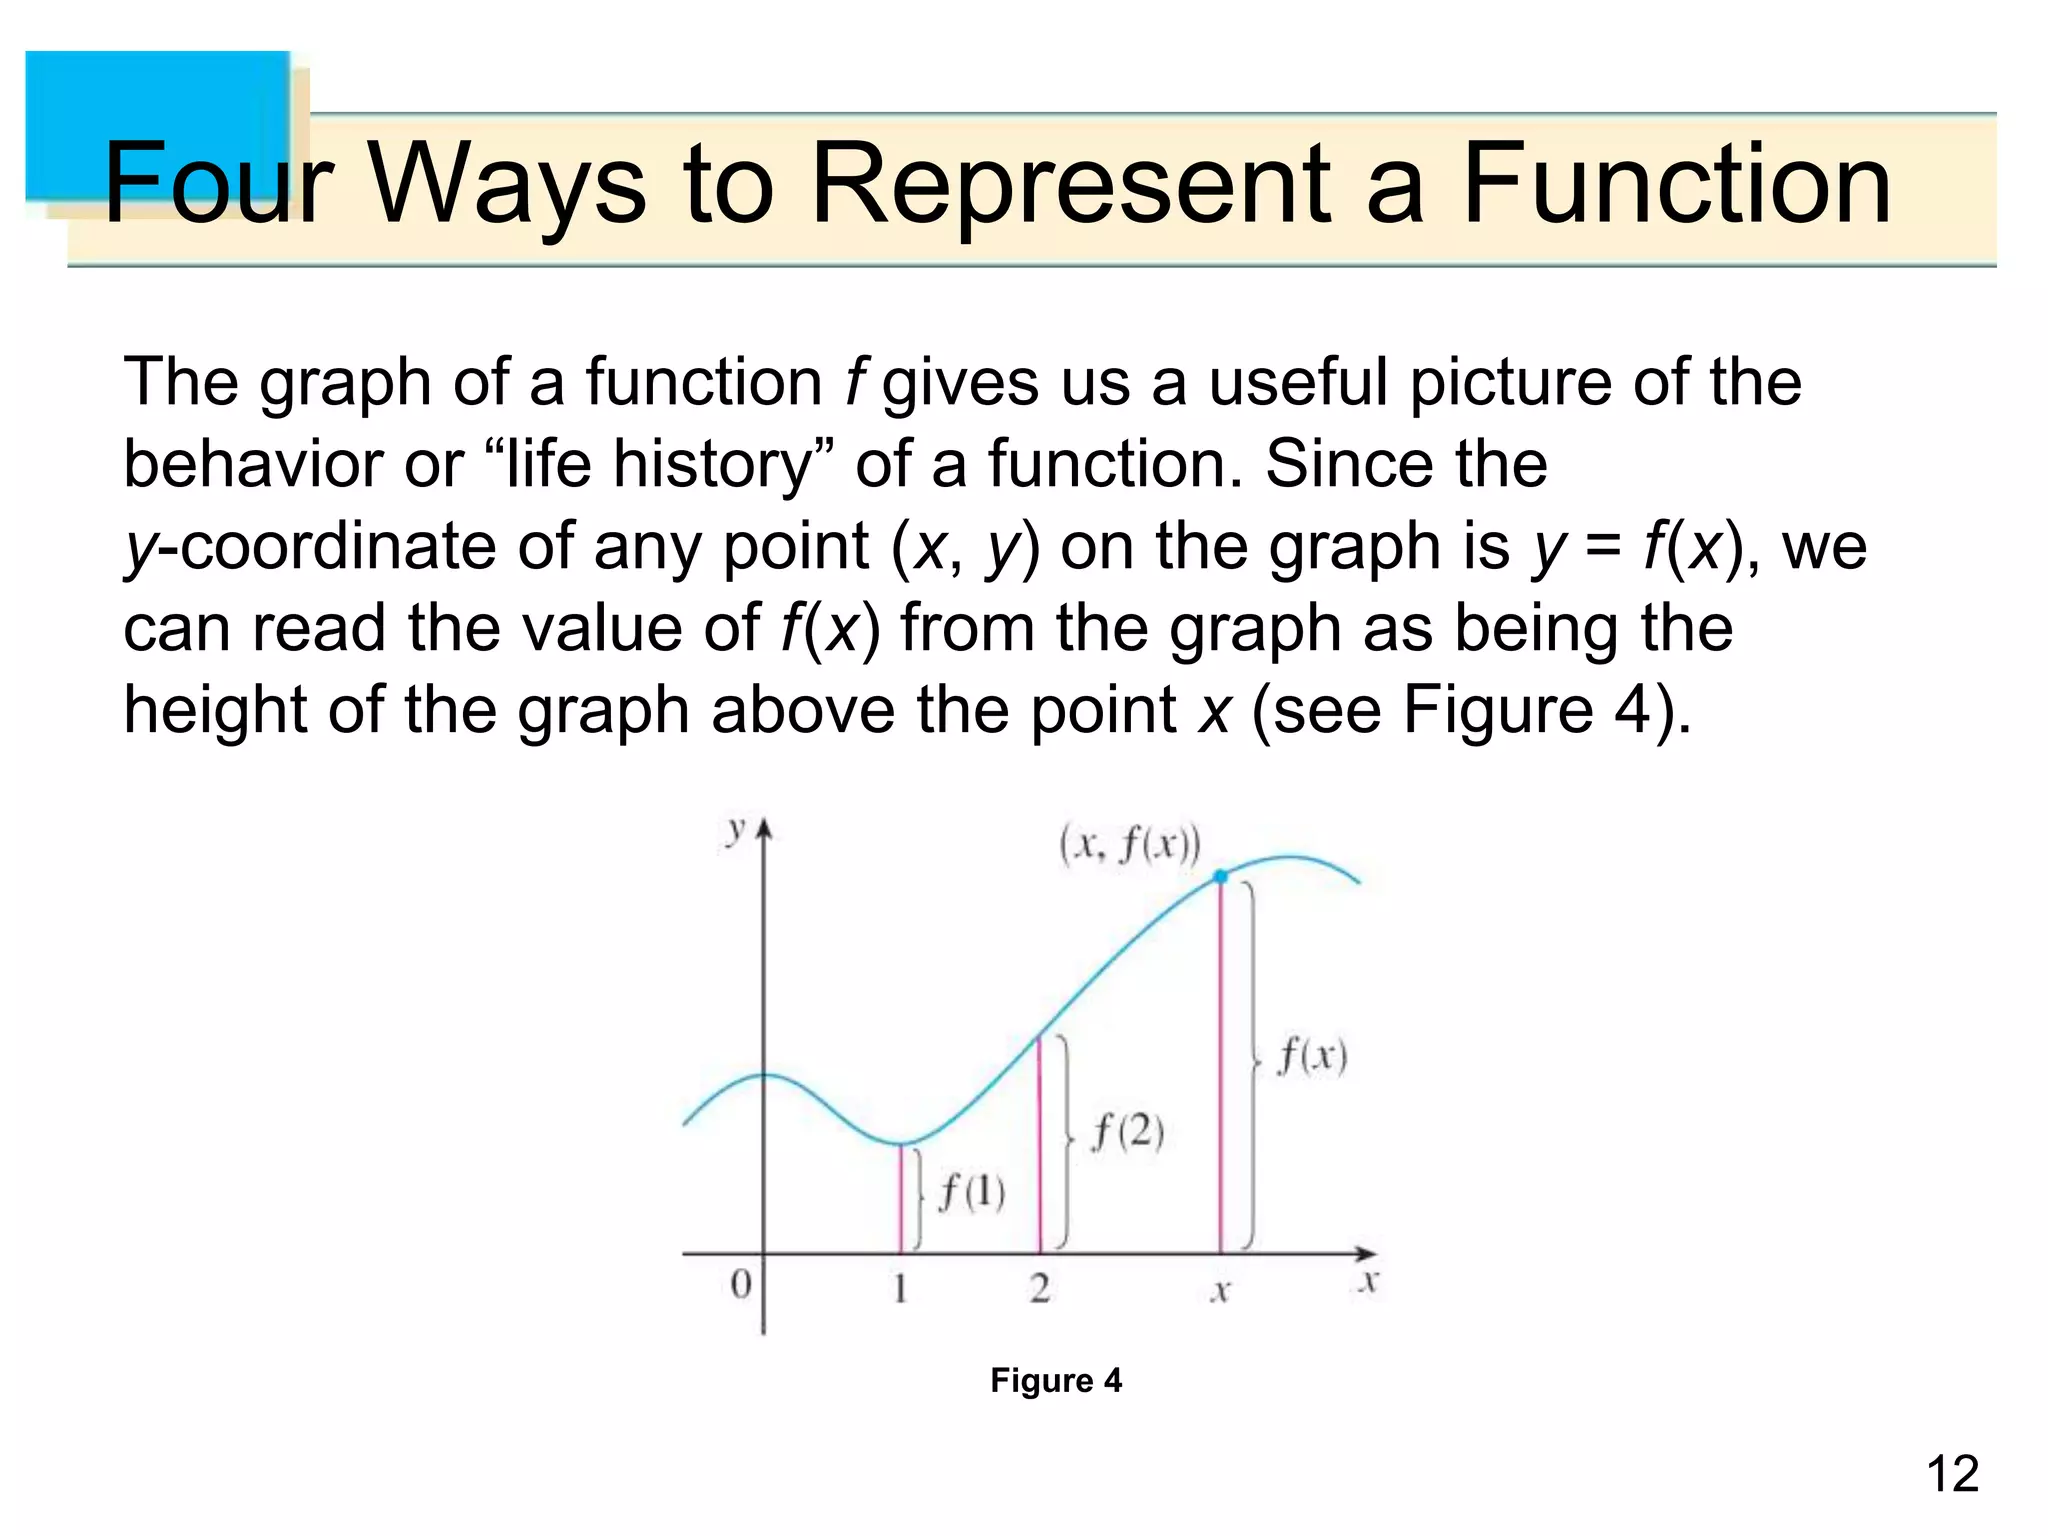
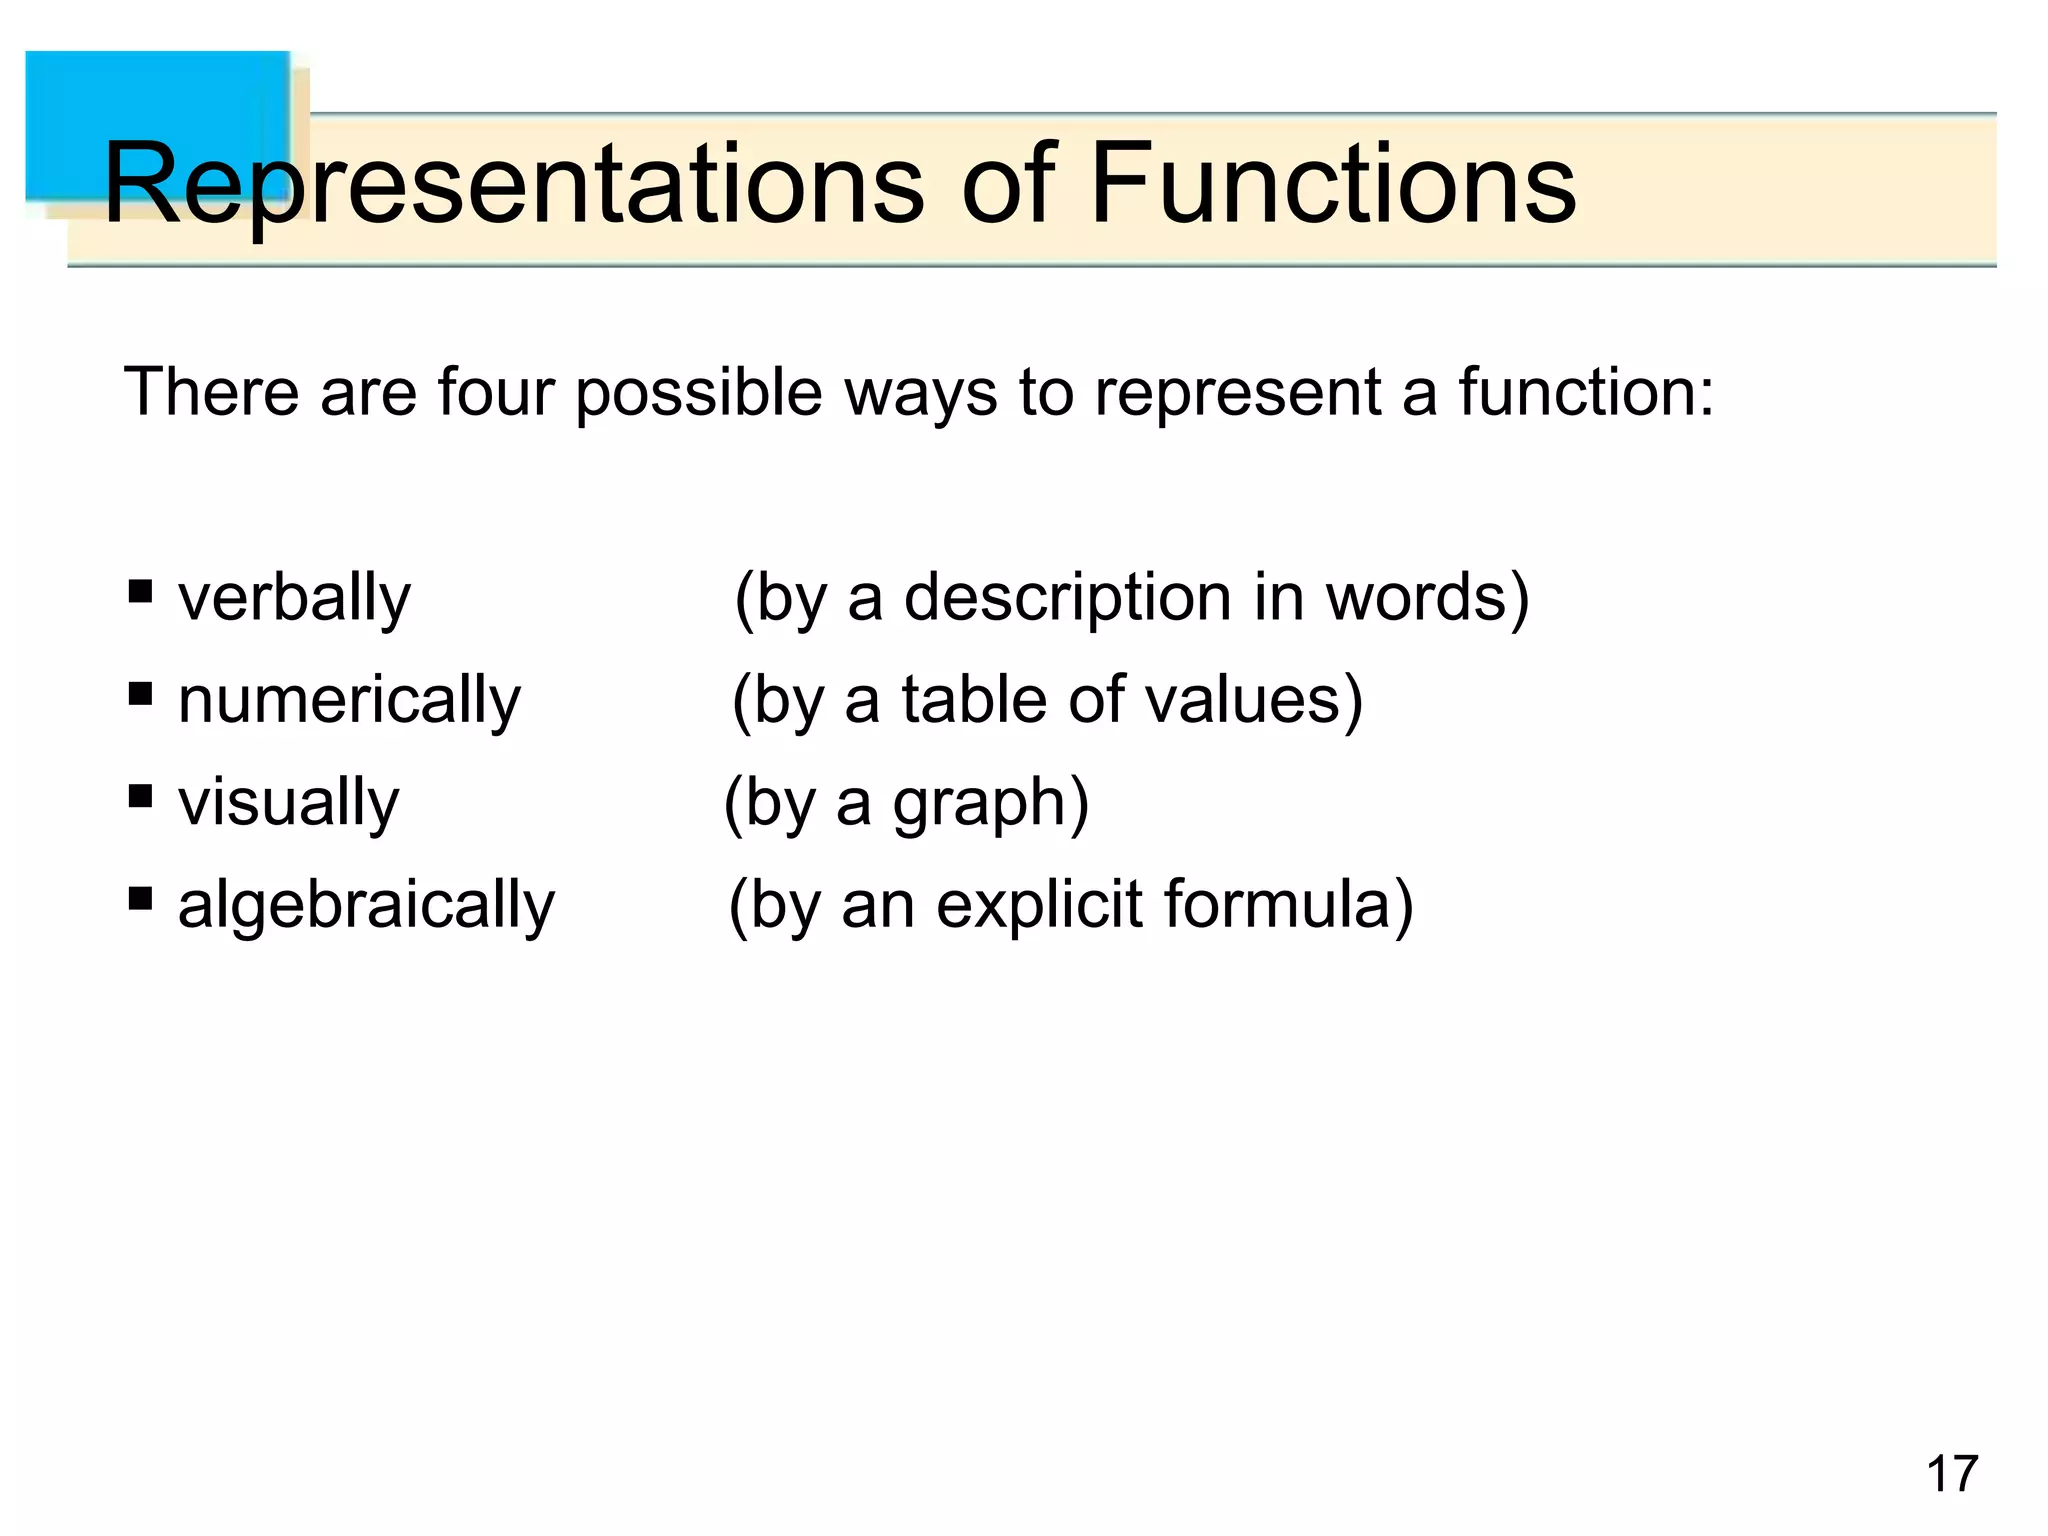
This document discusses four ways to represent functions: verbally, numerically, visually through graphs, and algebraically through explicit formulas. It provides examples of each type of representation and discusses key properties of functions like domain, range, and the vertical line test. The document also covers piecewise-defined functions and functions with symmetry properties like even functions whose graphs are symmetric about the y-axis.


![15
15
Example 1 – Solution
(a) We see from Figure 6 that the point (1, 3) lies on the
graph of f, so the value of f at 1 is f(1) = 3. (In other
words, the point on the graph that lies above x = 1 is 3
units above the x-axis.)
When x = 5, the graph lies about 0.7 unit below the
x-axis, so we estimate that f(5) –0.7.
(b) We see that f(x) is defined when 0 x 7, so the
domain of f is the closed interval [0, 7]. Notice that f
takes on all values from –2 to 4, so the range of f is
{y | –2 y 4} = [–2, 4]](https://image.slidesharecdn.com/stewartcalc7e0101-230720101928-b7303fd2/75/StewartCalc7e_01_01-ppt-15-2048.jpg)


![23
23
Representations of Functions
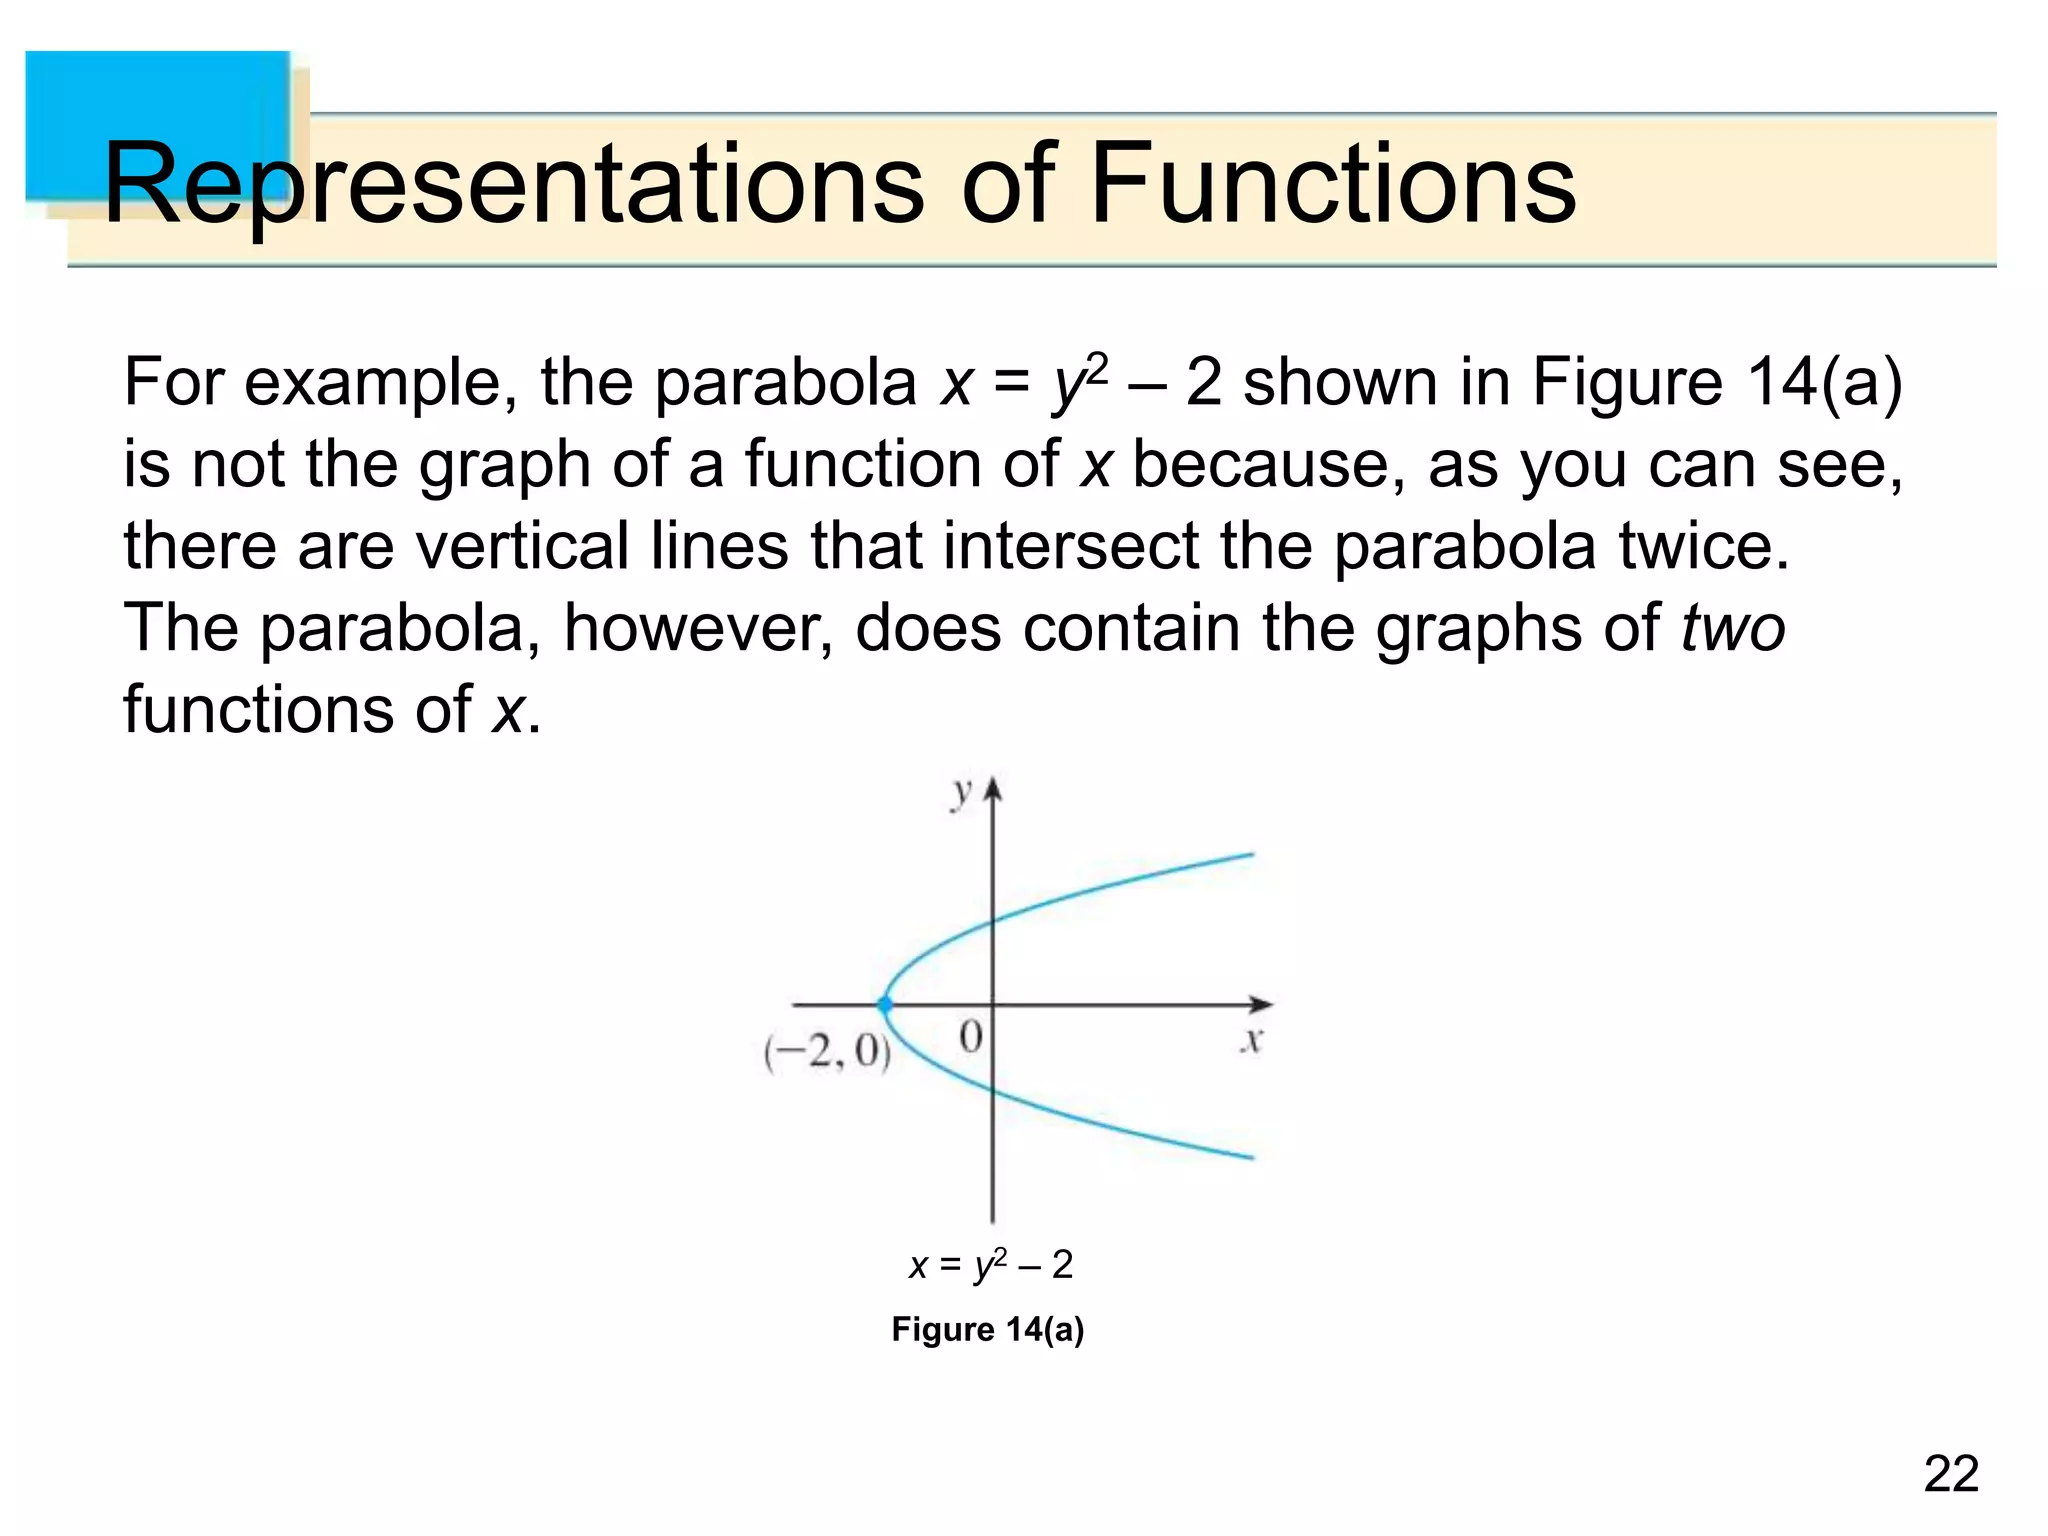
Notice that the equation x = y2 – 2 implies y2 = x + 2, so
. Thus the upper and lower halves of the
parabola are the graphs of the functions
and . [See Figures 14(b) and (c).]
Figure 14(c)
Figure 14(b)](https://image.slidesharecdn.com/stewartcalc7e0101-230720101928-b7303fd2/75/StewartCalc7e_01_01-ppt-23-2048.jpg)


![44
44
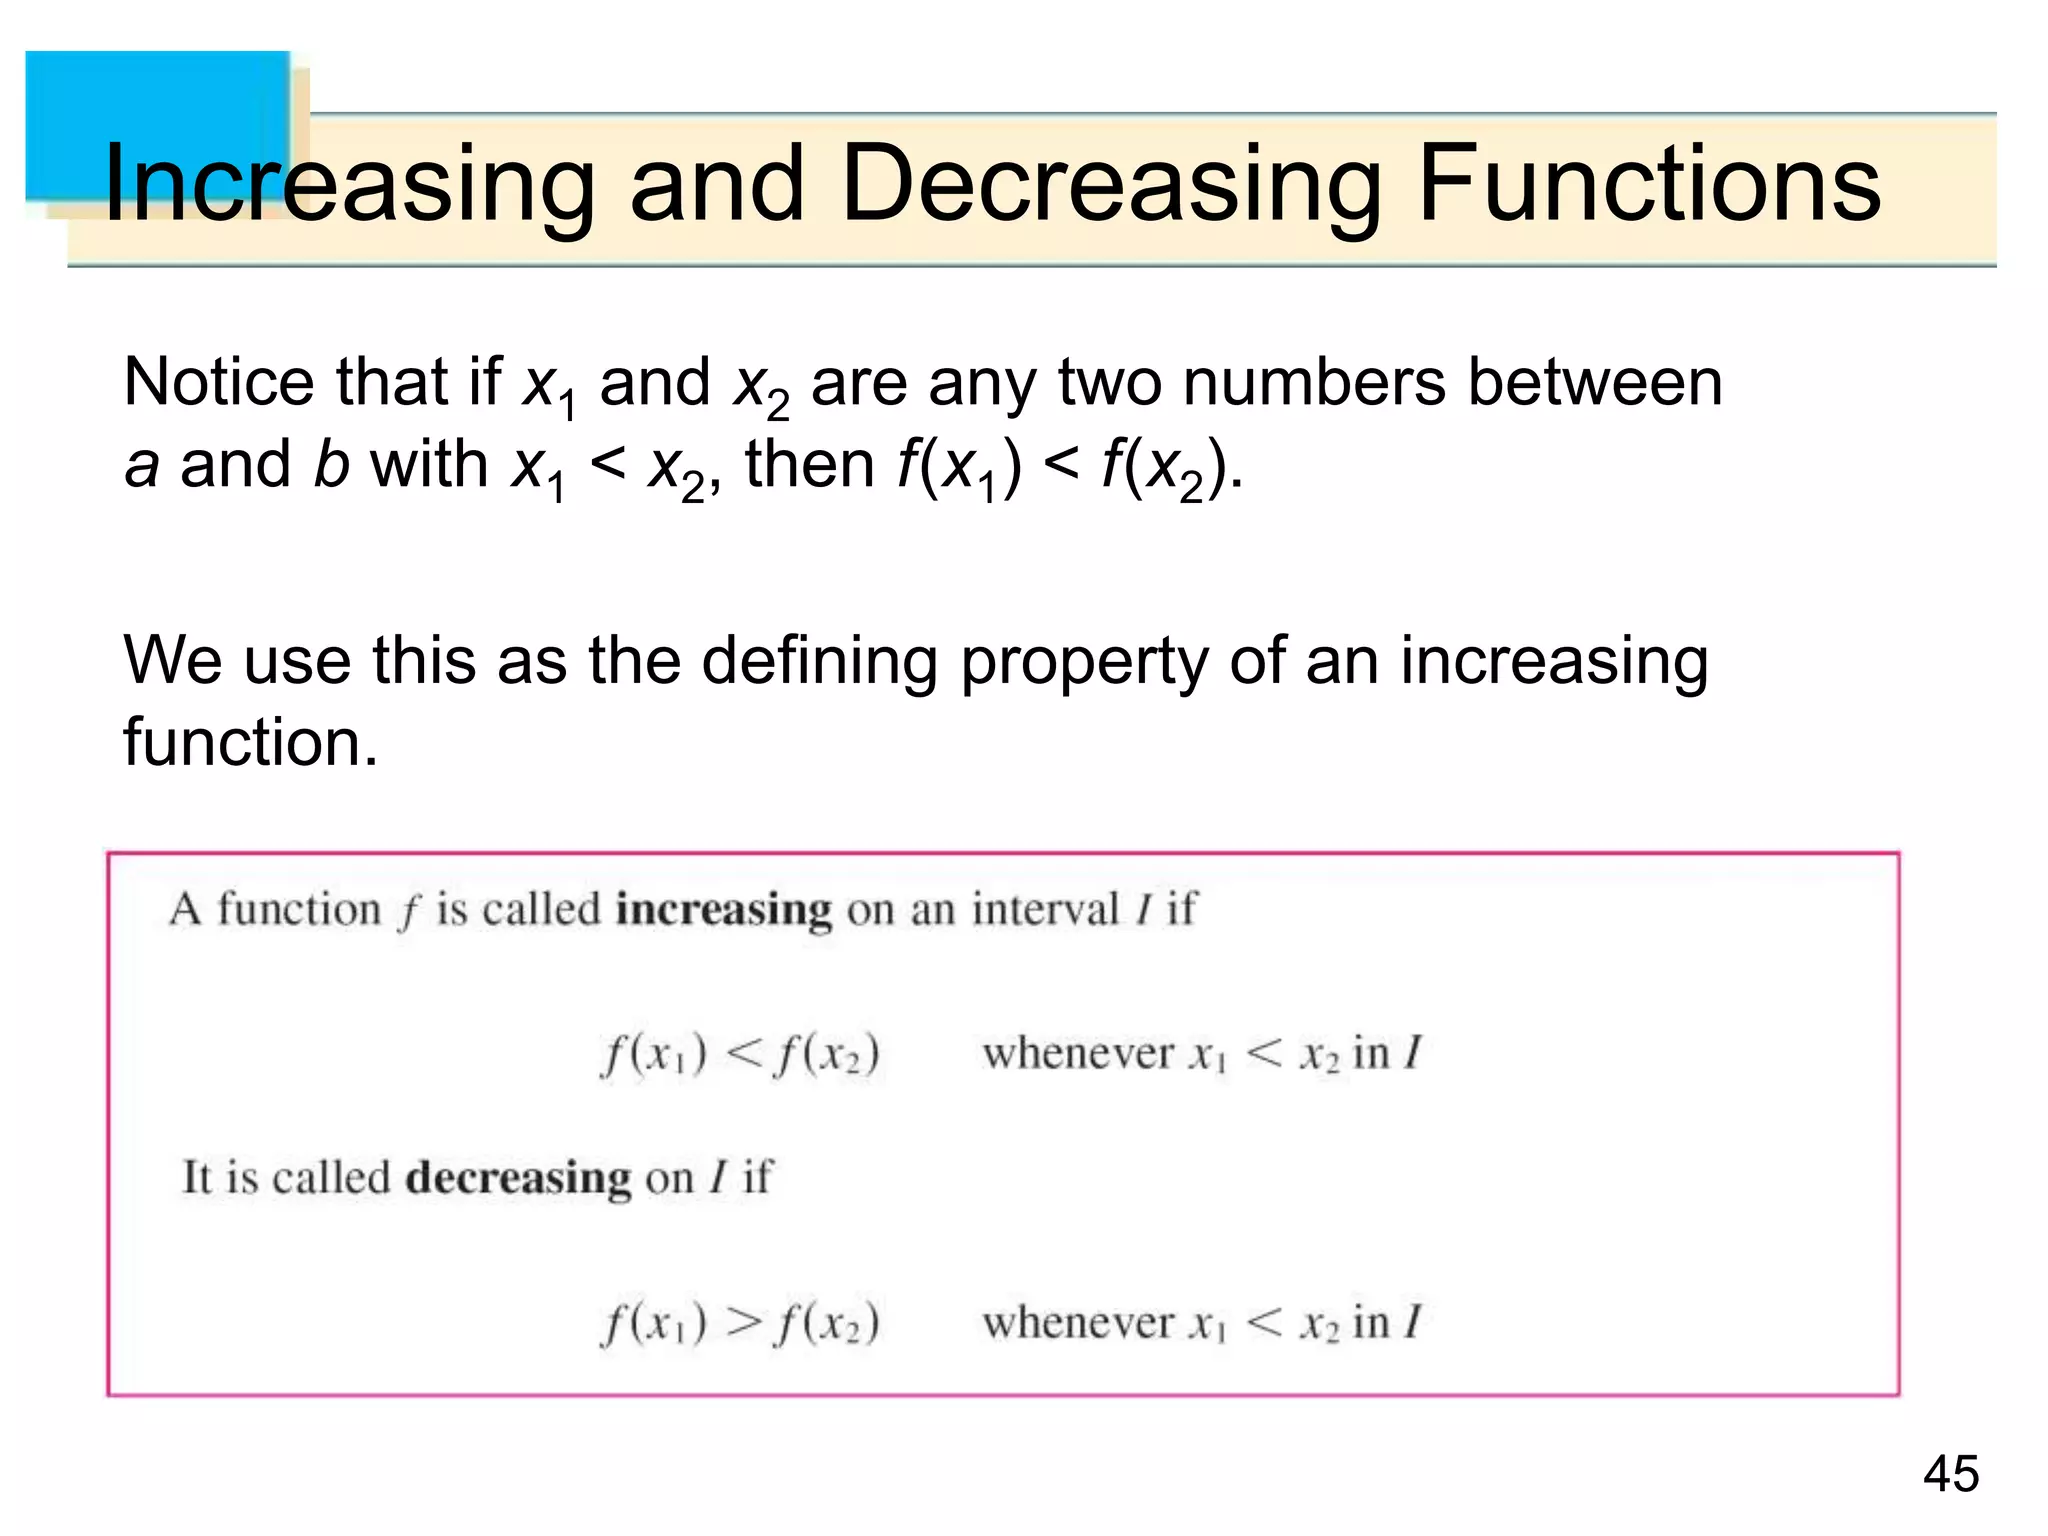
Increasing and Decreasing Functions
The graph shown in Figure 22 rises from A to B, falls from
B to C, and rises again from C to D. The function f is said to
be increasing on the interval [a, b], decreasing on [b, c],
and increasing again on [c, d].
Figure 22](https://image.slidesharecdn.com/stewartcalc7e0101-230720101928-b7303fd2/75/StewartCalc7e_01_01-ppt-44-2048.jpg)
![46
46
Increasing and Decreasing Functions
In the definition of an increasing function it is important to
realize that the inequality f(x1) < f(x2) must be satisfied for
every pair of numbers x1 and x2 in I with x1 < x2.
You can see from Figure 23
that the function f(x) = x2 is
decreasing on the interval (– , 0]
and increasing on the interval
[0, ).
Figure 23](https://image.slidesharecdn.com/stewartcalc7e0101-230720101928-b7303fd2/75/StewartCalc7e_01_01-ppt-46-2048.jpg)