![© 2011 ANSYS, Inc. June 5, 201334
Summary of Results
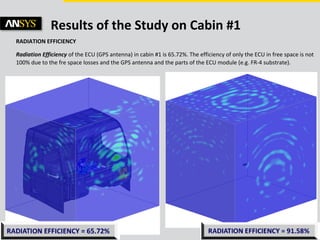
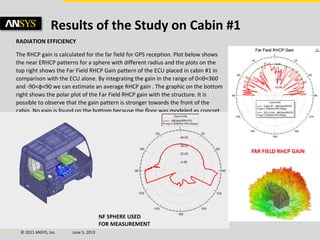
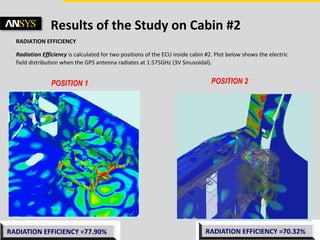
From the parameters presented below, the Normalized Radiation Efficiency is usually used to quantify the GPS
sensitivity. It shows that when the ECU is placed in the specified position inside cabin #1, the efficiency of the
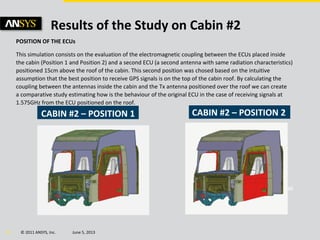
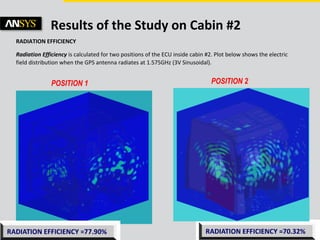
GPS antenna decreases to 71.76% (or reduces 28.24% in comparison with the ECU alone). For cabin #2, position
1 shows a better performance compared to position #2.
Only ECU Cabin #1
Cabin #2
Position 1
Cabin #2
Position 2
Peak Directivity 19.1815 7.40758 10.5449 8.06356
Peak Gain [dBi] 17.5678 4.86819 7.52303 5.19307
Radiated Power [W] 0.00589929 0.00390389 0.00423796 0.00382564
Radiation Efficiency 0.915871 0.6572 0.713427 0.644017
Normalized Radiation Efficiency 100.00% 71.76% 77.9% 70.32%
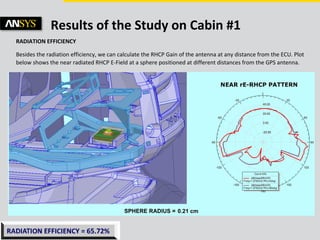
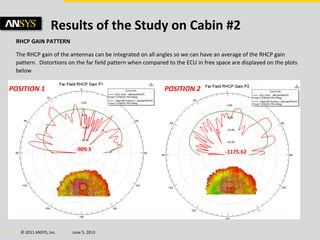
RHCP Gain Average [dBc] 1 -491.48 -1152.91 -909.30 -1175.62
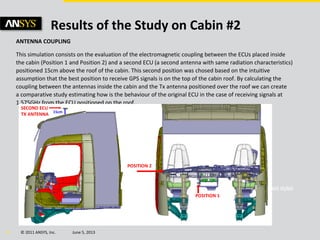
2 Antenna Coupling [dB] -69.09 -90.98 -93.31 -96.25
Transient Average2 0.7921 0.6476 1.7708 0.7972
1 RHCP gain average was calculated by integrating the RHCP gain in a far field surface of 0<φ<360 -90<θ<90
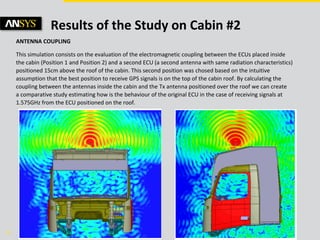
2 Transient average is a time integration of the electric field received by the GPS antenna of the ECU. Cabin #2 shows higher values due to the high number of reflections
in the case of position 1, which retains the electromagnetic field, and the proximity of the ECU to the metallic sheets in the case of position #2.
NOTE: The studies were carried out considering only the geometry and the material properties of the cabin. In cabin #2,
the ECU when placed in position 1 is very close to the electrical center, which works with fuses and relays at very high
currents. It is also close to the radio which works with very high speed digital signals. The proximity of the ECU to these
devices can decrease the GPS performance due to electromagnetic interference (EMI). Further studies can be made
including additional ECUs to study EMI between them.](https://image.slidesharecdn.com/gpsplacement-130605111148-phpapp02/85/GPS-Placement-34-320.jpg)

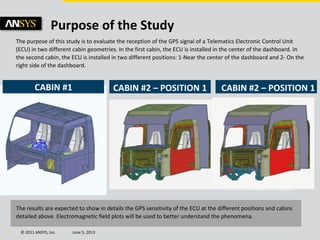
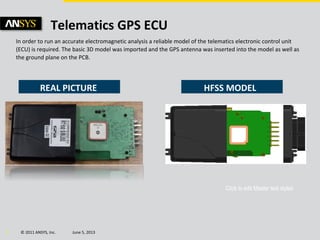
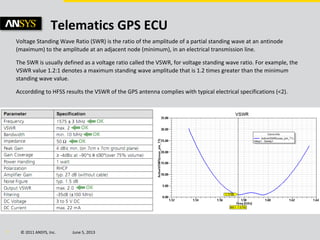
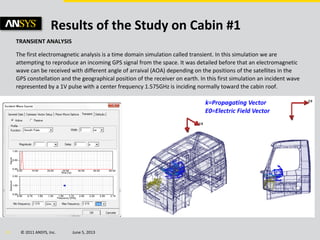
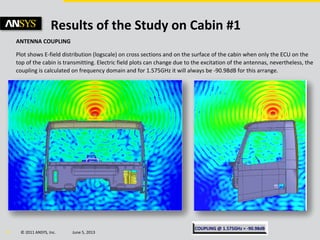
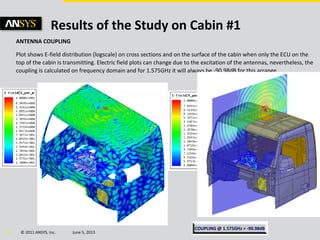
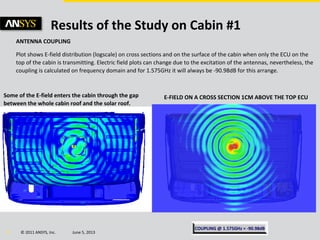
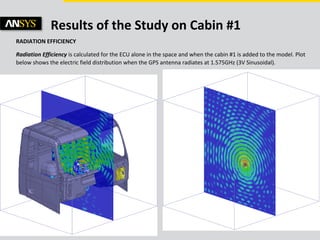
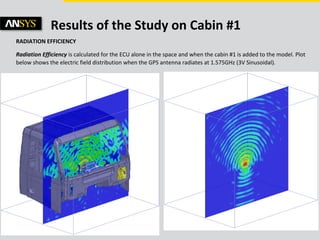
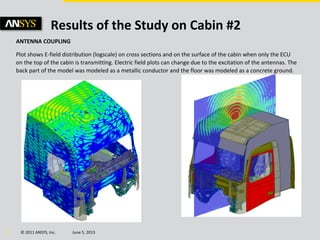
This study evaluates GPS signal reception of a telematics electronic control unit (ECU) in two cabin geometries, aiming to understand GPS sensitivity at different ECU positions. Key findings indicate that the ECU's radiation efficiency decreases by 28.24% when housed within the cabin, with variations in performance between positions in cabin #2. The results utilize simulations and electromagnetic field plots to analyze the influences of cabin geometry on GPS signal reception.