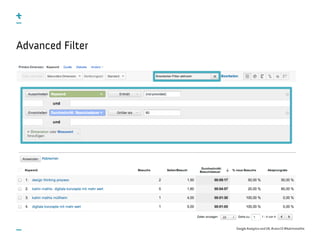
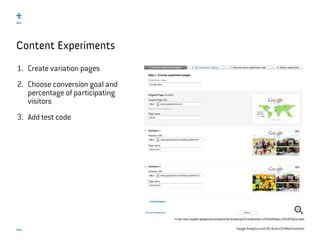
Download as PDF, PPTX


![Google Analytics and UX, #uxce13 @katrinmathis
<a href=‘/document.pdf‘
onClick =‘_gaq.push([‘_trackPageview‘, ‘/downloads/document-xy.pdf‘]);‘>
Jetzt Downloaden</a>
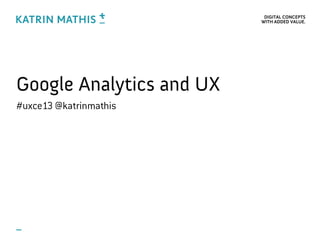
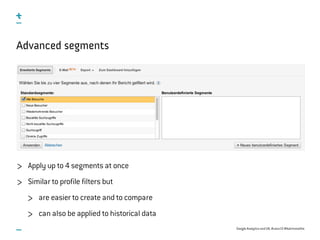
Virtual Page Views
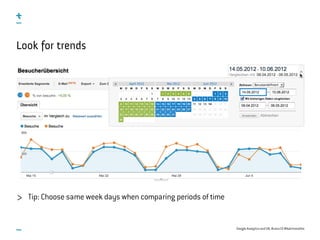
Tracking of actions that are not page views,
e.g. Downloads or outbound Links
Tip: Integrate script that tracks automatically all downloads and outbound links
Tip: File into categories, e.g. /downloads und /links
Request tracked, not completion!
Number of page views increased by virtual page views!](https://image.slidesharecdn.com/googleanalyticsux-130622072718-phpapp01/85/Google-Analytics-UX-18-320.jpg)
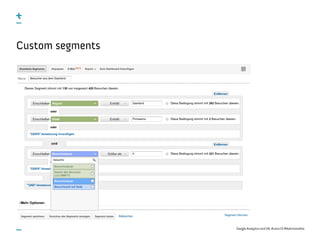
![Google Analytics and UX, #uxce13 @katrinmathis
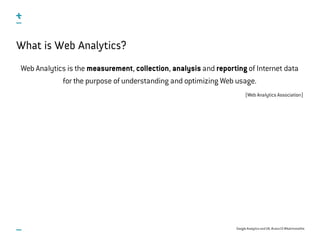
<a onclick=“_gaq.push([‘_trackEvent‘, category, action, label, value]);“>...</a>
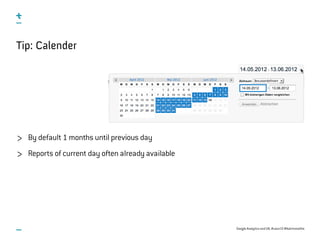
Event Tracking
Tracking of objects (e.g. Video) and interactions (Play, Pause etc.)
category
action
label (Optional)
value (Optional)
In contrast to virtual pageviews events do not generate additional page views
Image: http://analytics.blogspot.de/2011/04/new-google-analytics-events-goals.html](https://image.slidesharecdn.com/googleanalyticsux-130622072718-phpapp01/85/Google-Analytics-UX-19-320.jpg)
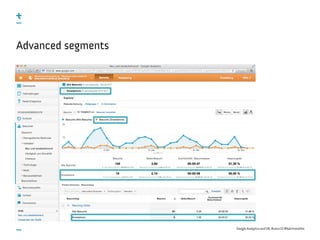
![Google Analytics and UX, #uxce13 @katrinmathis
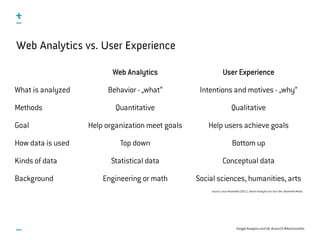
_gaq.push([‘_trackSocial‘, network, socialAction, opt_target, opt_pagePath]);
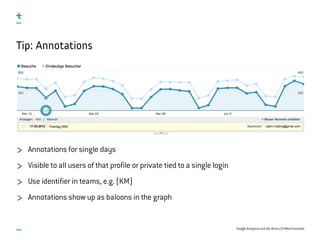
Social Media Tracking - Social Plugins
Google +1 Button tracked automatically
Plugins of other networks require manual tracking
network
social action
opt_target
opt_pagePath](https://image.slidesharecdn.com/googleanalyticsux-130622072718-phpapp01/85/Google-Analytics-UX-20-320.jpg)
![Google Analytics and UX, #uxce13 @katrinmathis
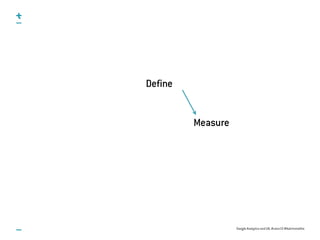
_gaq.push([‘_setCustomVar‘, index, name, value, scope]);
_gaq.push([‘_getVisitorCustomVar‘, index]);
_gaq.push([‘_deleteCustomVar‘, index]);
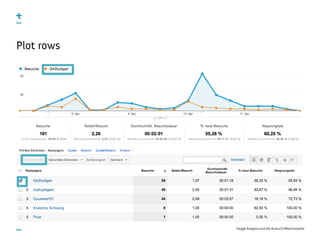
Custom variables
Up to 5 custom variables per page view or event
index
name
value
scope
1: Visitor
2: Session
3: Page](https://image.slidesharecdn.com/googleanalyticsux-130622072718-phpapp01/85/Google-Analytics-UX-21-320.jpg)
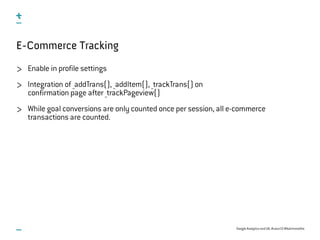
![Google Analytics and UX, #uxce13 @katrinmathis
_gaq.push([‘_addTrans‘,
‘transaction id‘,
‘affiliation‘,
‘total‘,
‘tax‘
‘shipping‘,
‘city‘,
‘region‘,
‘country‘]);
_gaq.push([‘_addItem‘,
‘transaction id‘,
‘SKU/code‘,
‘product name‘,
‘category‘,
‘price‘,
‘quantity‘]);
_gaq.push([‘_trackTrans‘]);
E-Commerce Tracking](https://image.slidesharecdn.com/googleanalyticsux-130622072718-phpapp01/85/Google-Analytics-UX-23-320.jpg)
![Google Analytics and UX, #uxce13 @katrinmathis
<script type="text/javascript">
_gaq.push(['_trackEvent', 'Error', '404', 'page: ' + document.location.pathname +
document.location.search + ' ref: ' + document.referrer ]);
</script>
Error tracking
Track errors as events
Types of errors
404 Not found errors
Referrer
URL trying to reach
Form field errors](https://image.slidesharecdn.com/googleanalyticsux-130622072718-phpapp01/85/Google-Analytics-UX-25-320.jpg)
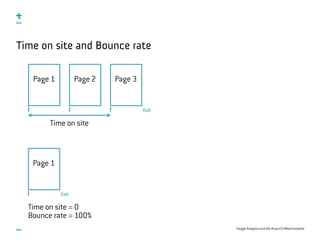
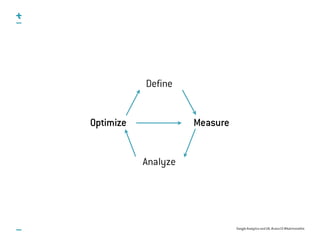
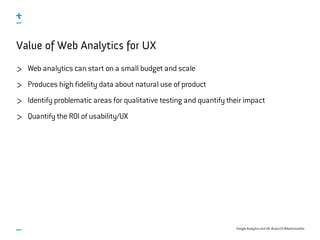

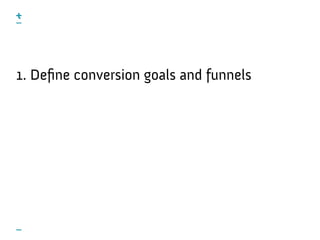
The document discusses how Google Analytics can be used to measure and analyze user experience on a website. It provides 10 steps for using Google Analytics for UX: 1) define conversion goals and funnels, 2) track internal search, 3) individualize tracking, 4) track errors, 5) analyze metrics in context, 6) understand time on site and bounce rate, 7) segment data, 8) customize reports, 9) validate minimum viable products, and 10) verify the effects of changes. The overall value of web analytics for UX is that it provides data about natural website use at a low cost and identifies areas for further qualitative testing and evaluation.


![Designing with Lean UX : Rapid Product Design [UX Lisbon 2014]](https://cdn.slidesharecdn.com/ss_thumbnails/uxlisbon2014designingleanux-workshopslideshare-140604100358-phpapp02-thumbnail.jpg?width=640&height=640&fit=bounds)


![[Webinar] Advanced Google Analytics](https://cdn.slidesharecdn.com/ss_thumbnails/webinargoogleanalyticsbychristinasanders-170328183539-thumbnail.jpg?width=640&height=640&fit=bounds)


