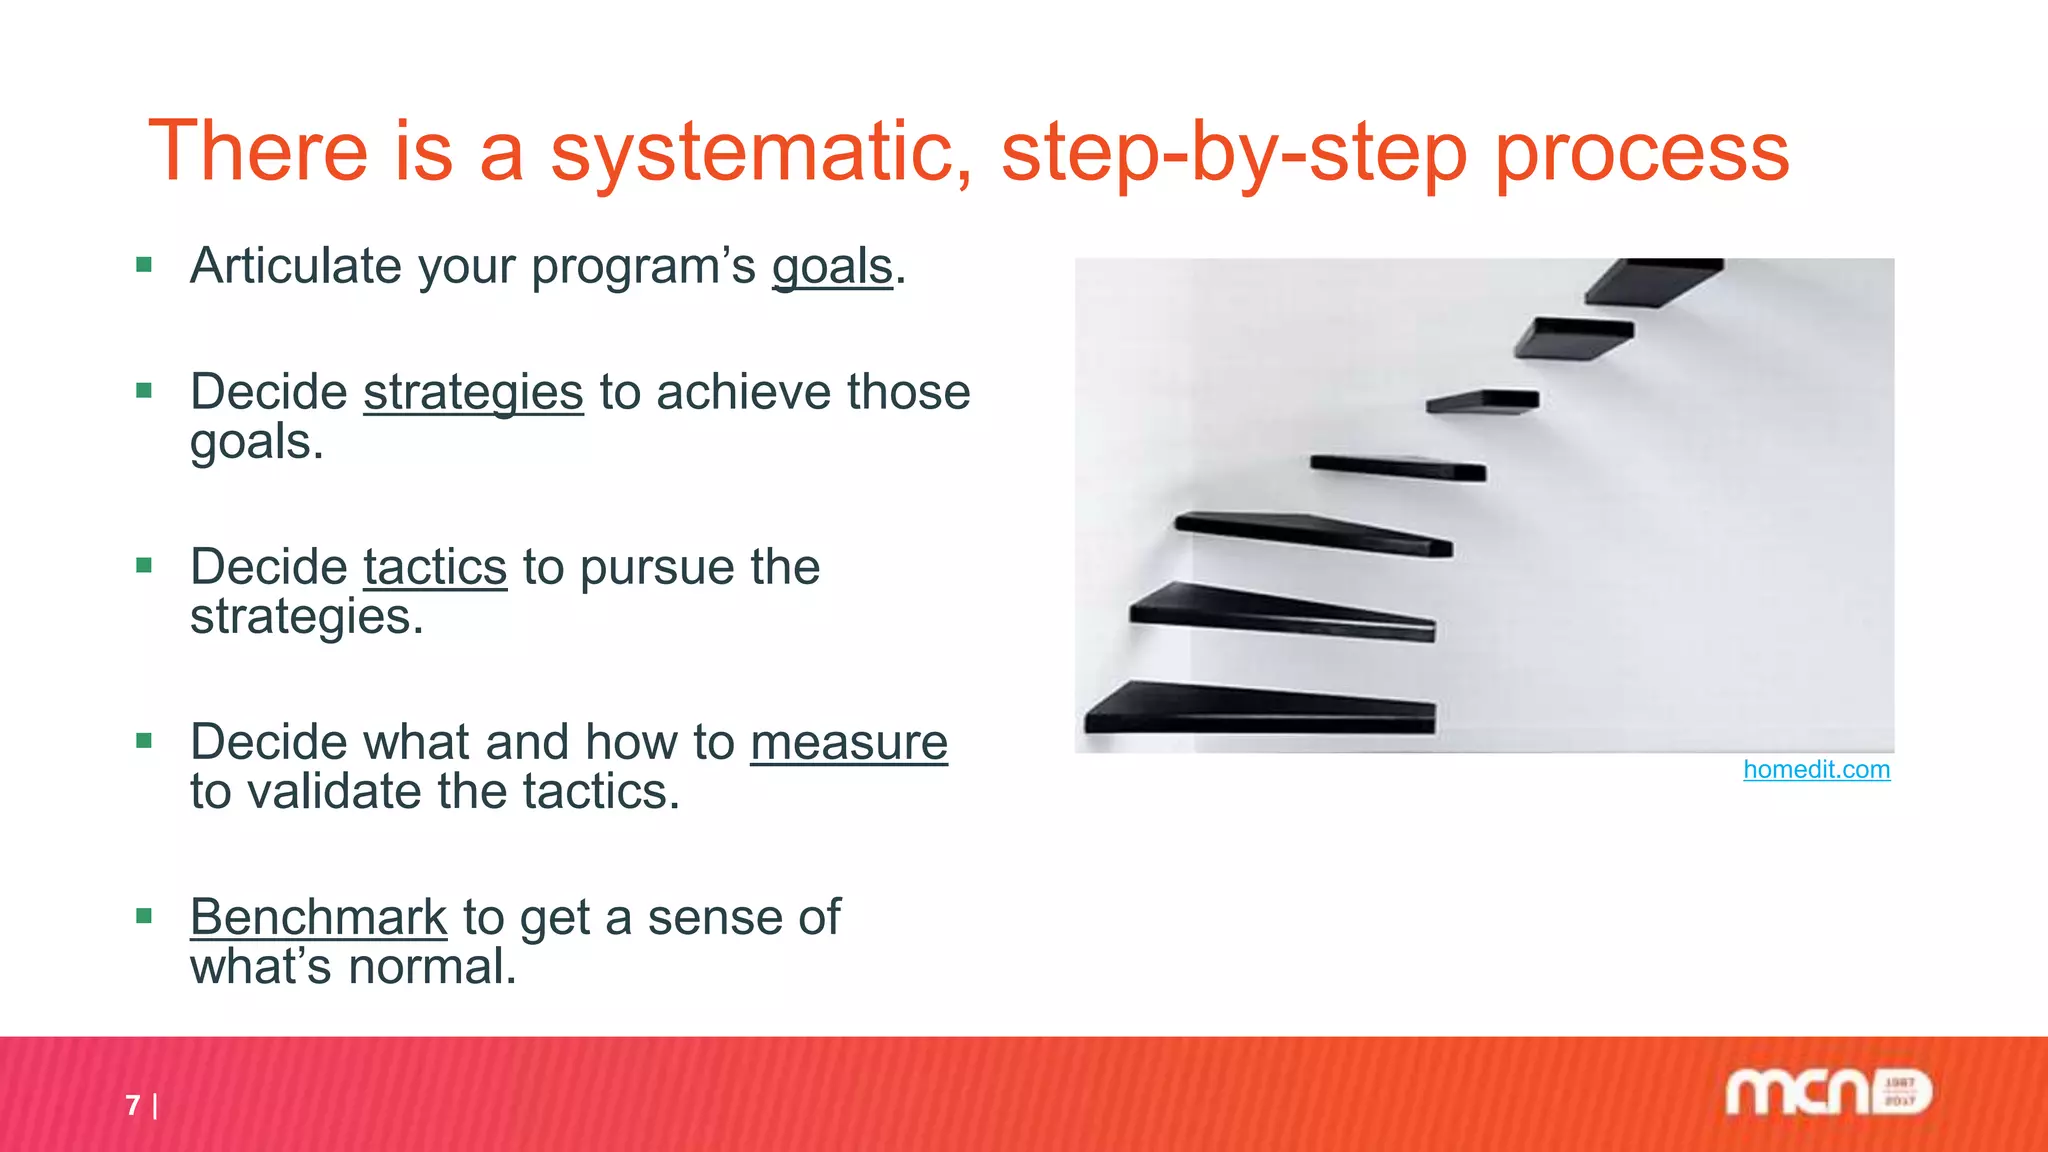
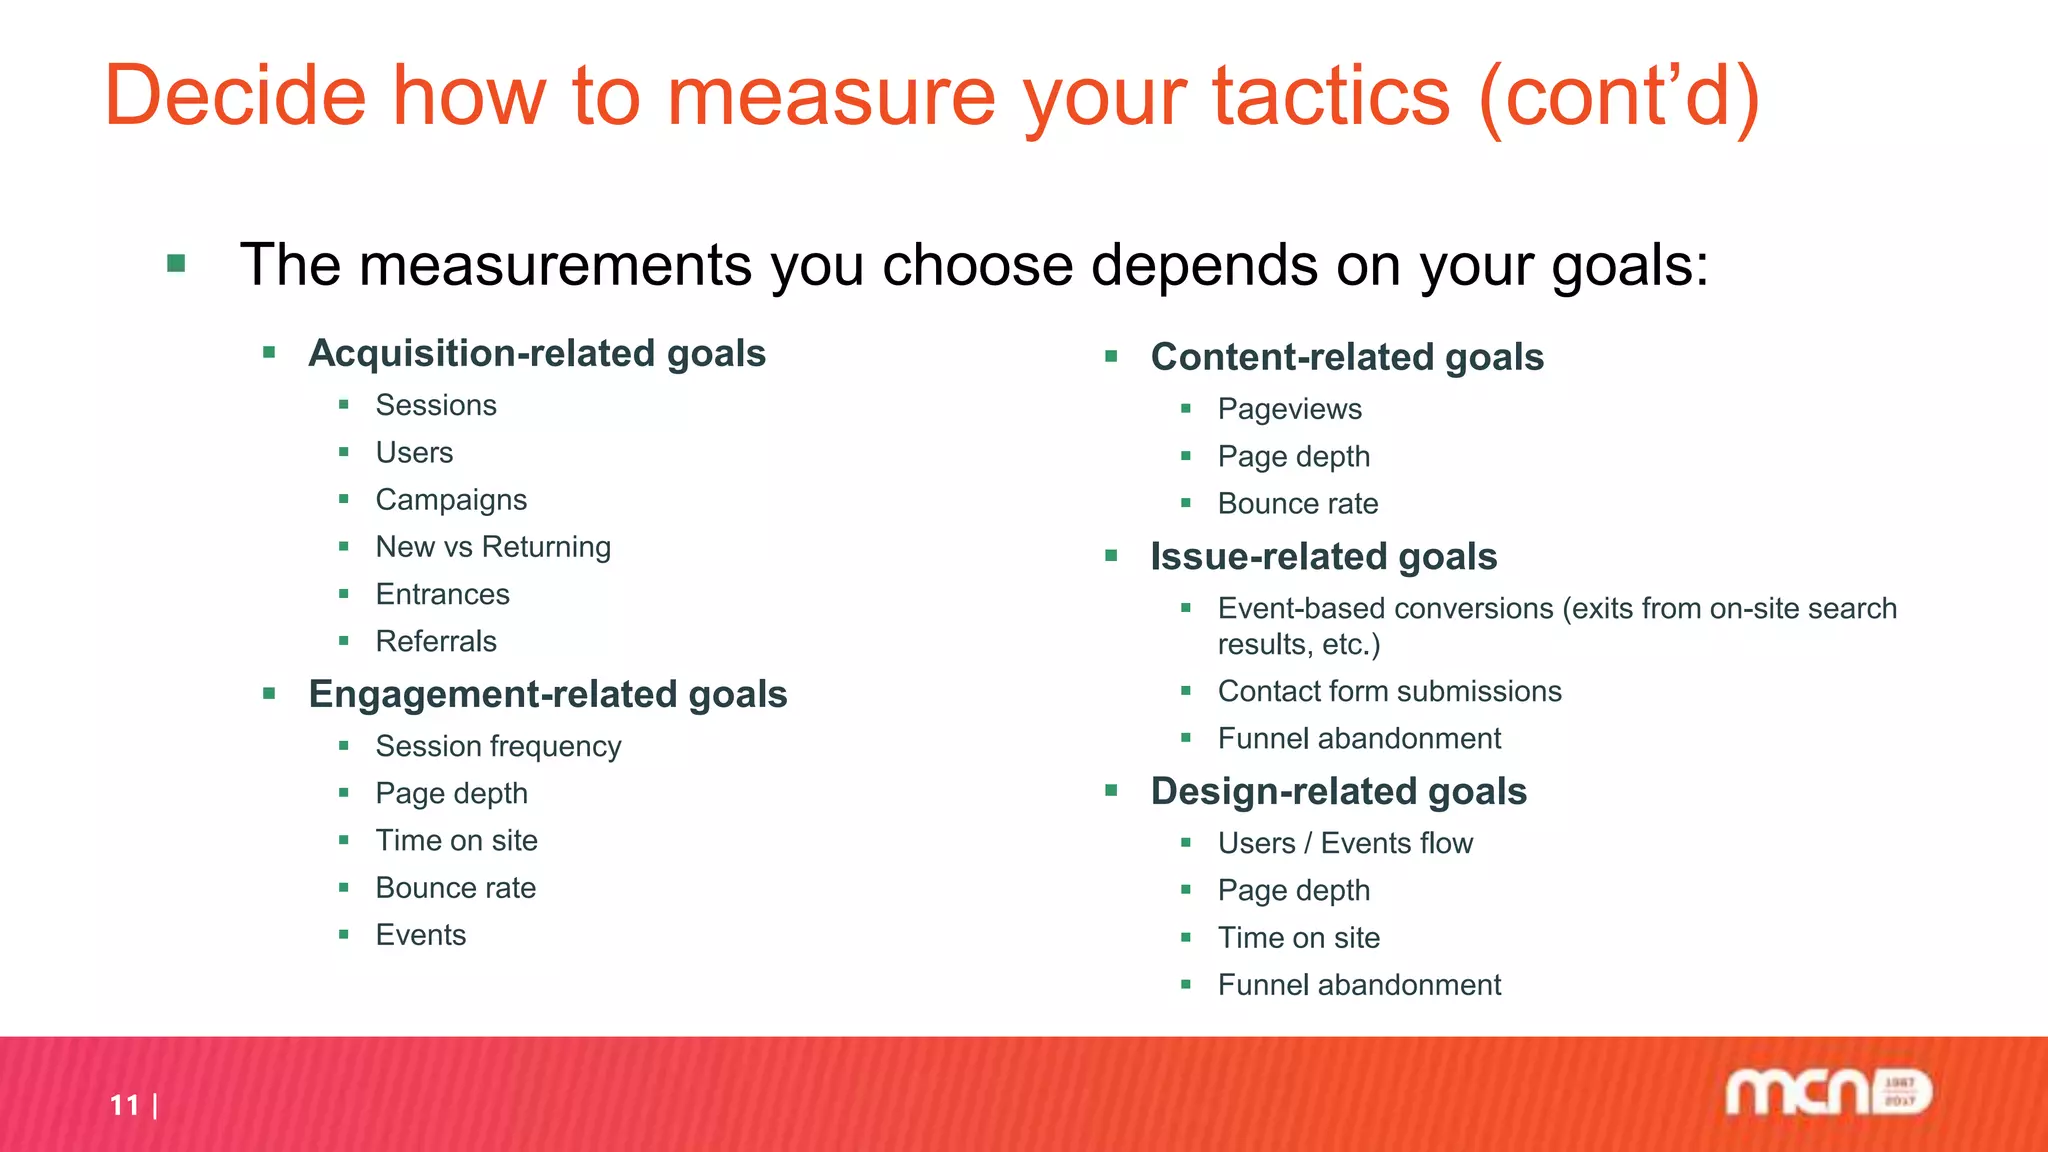
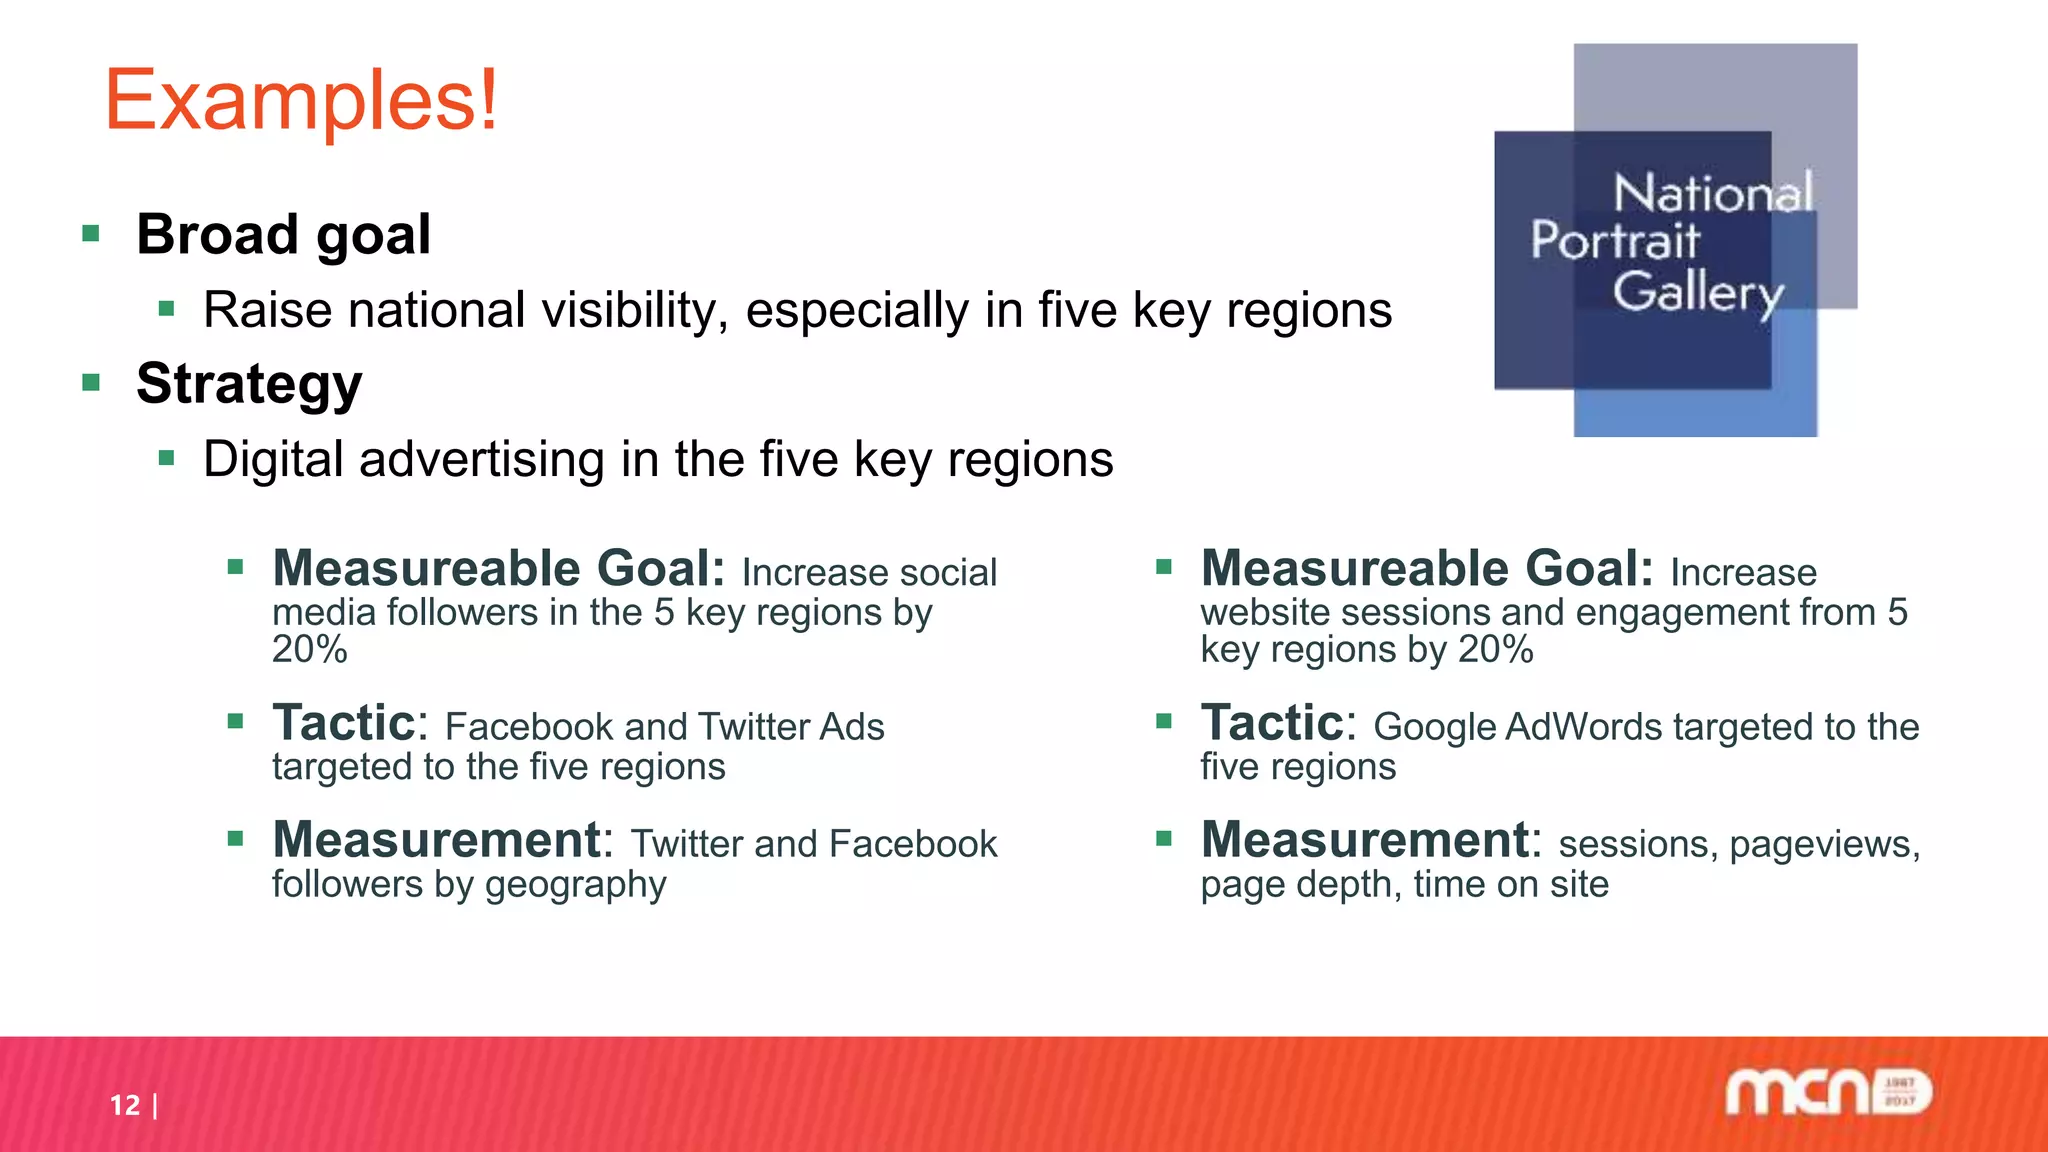
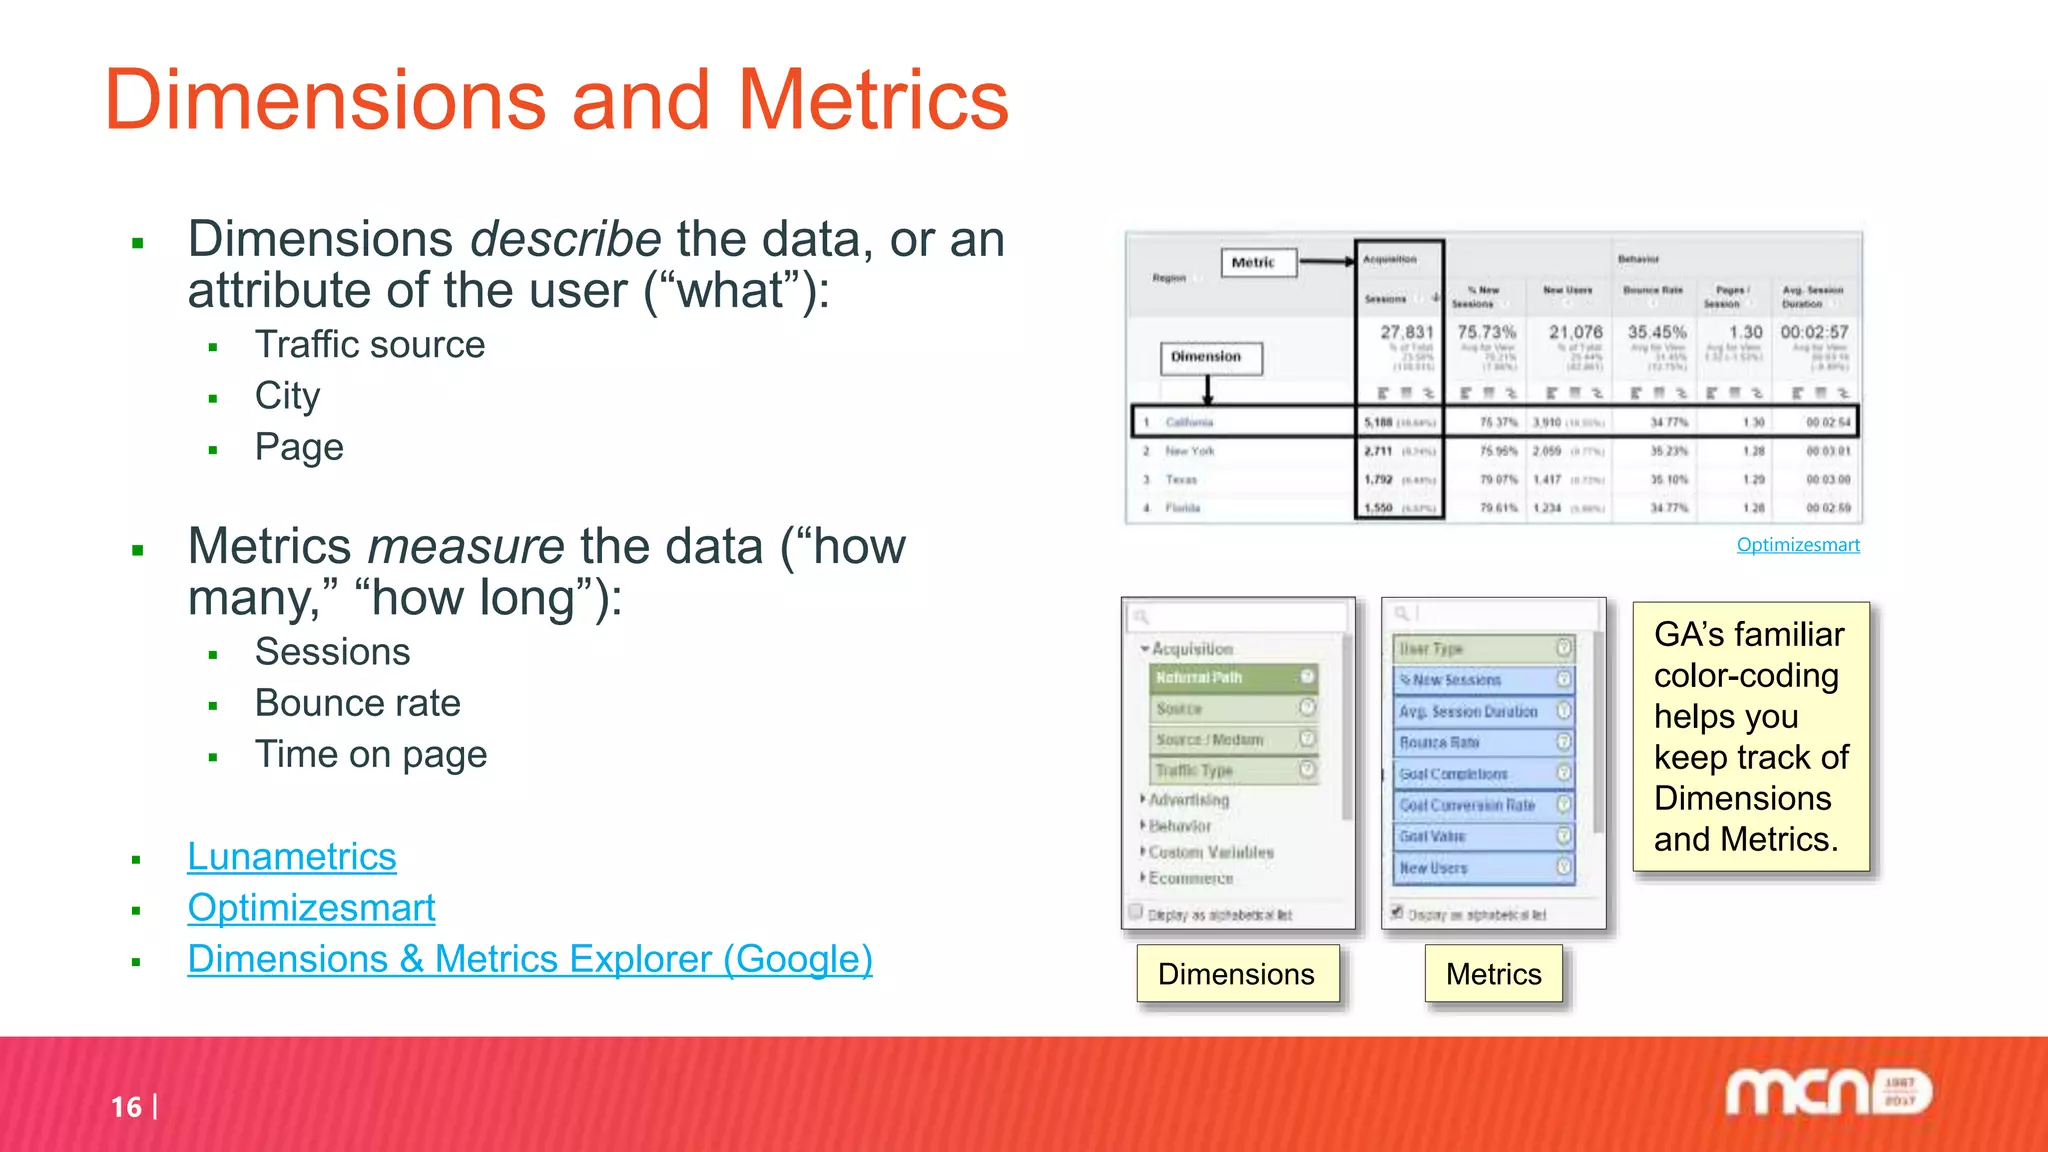
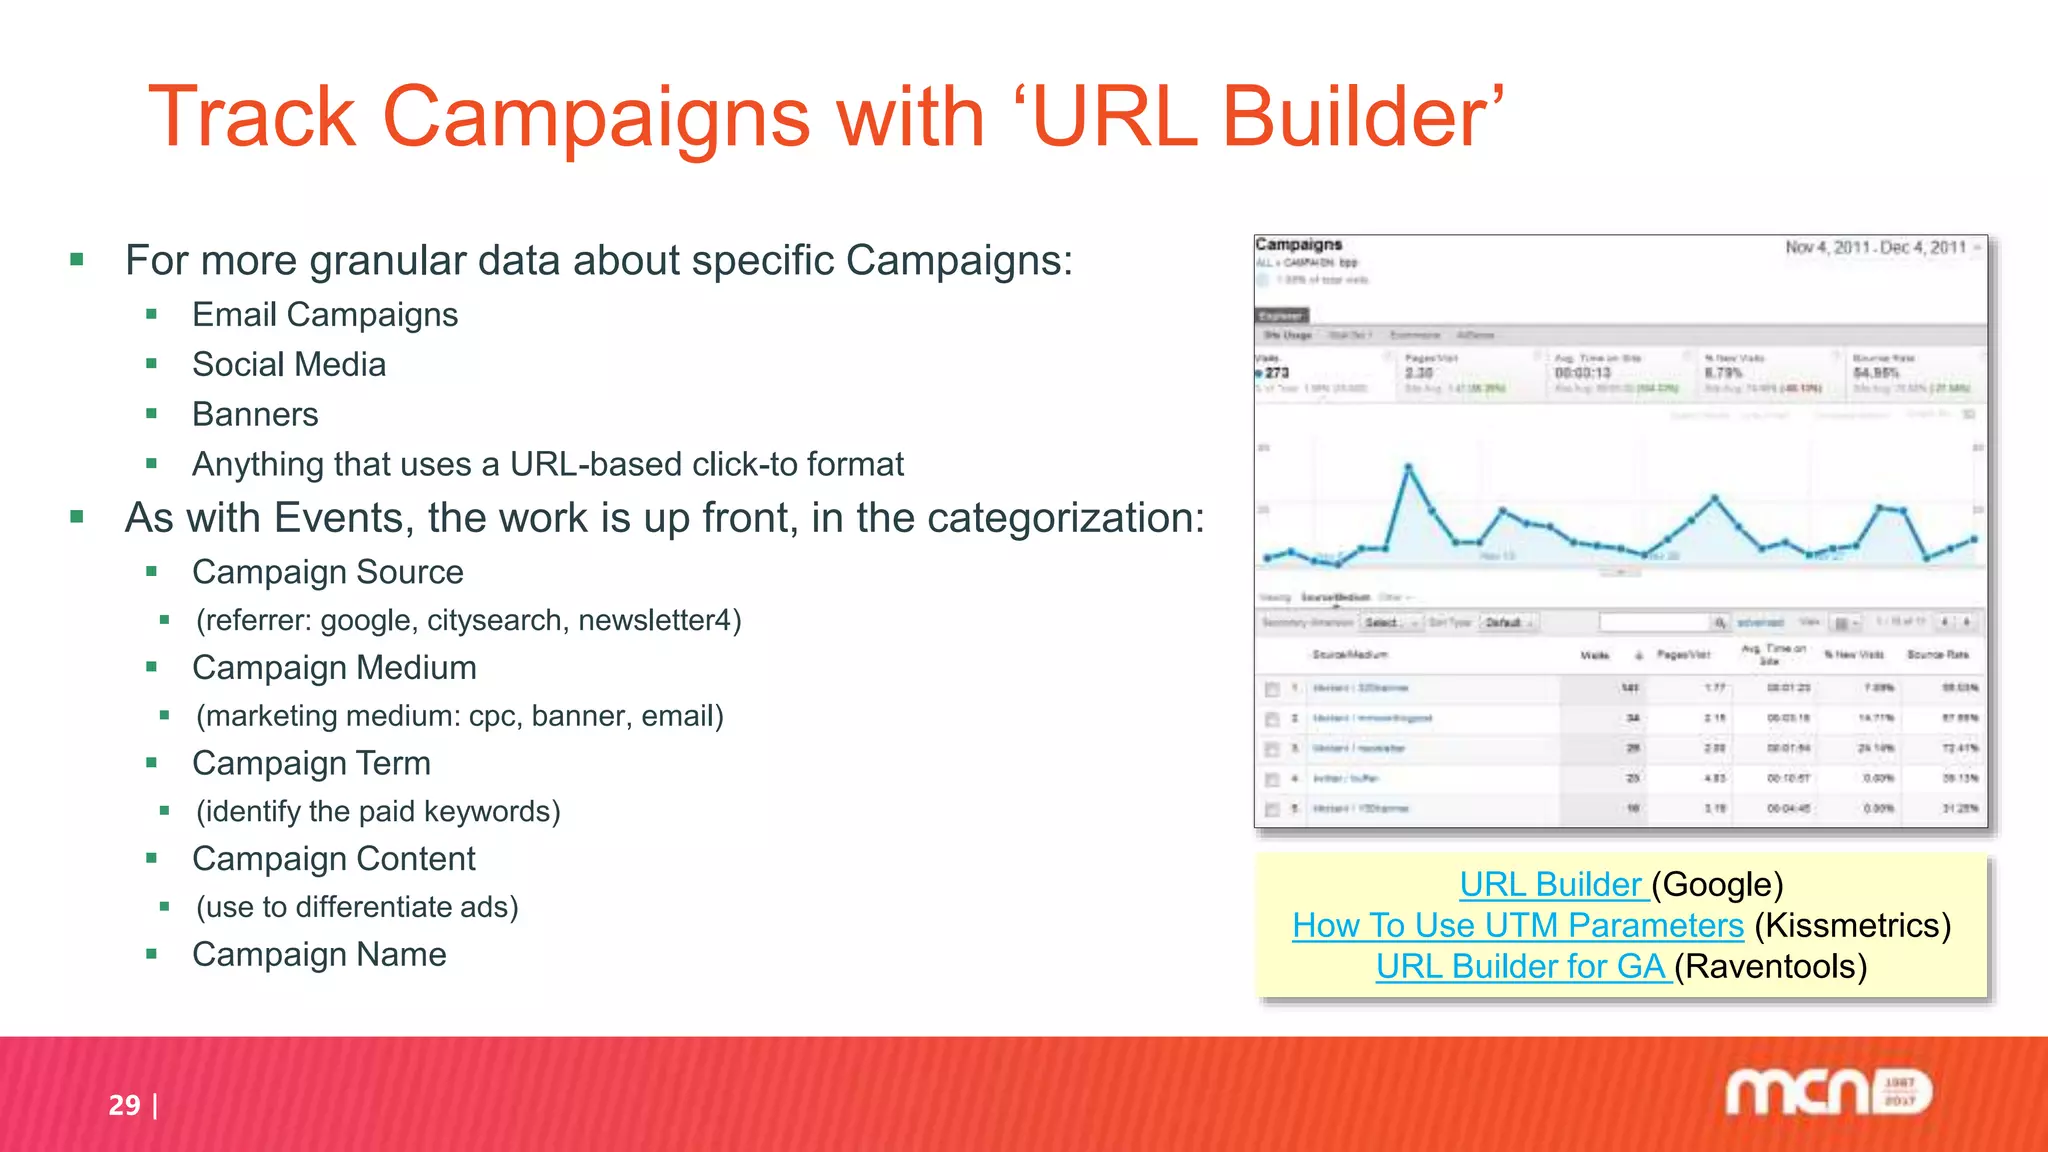
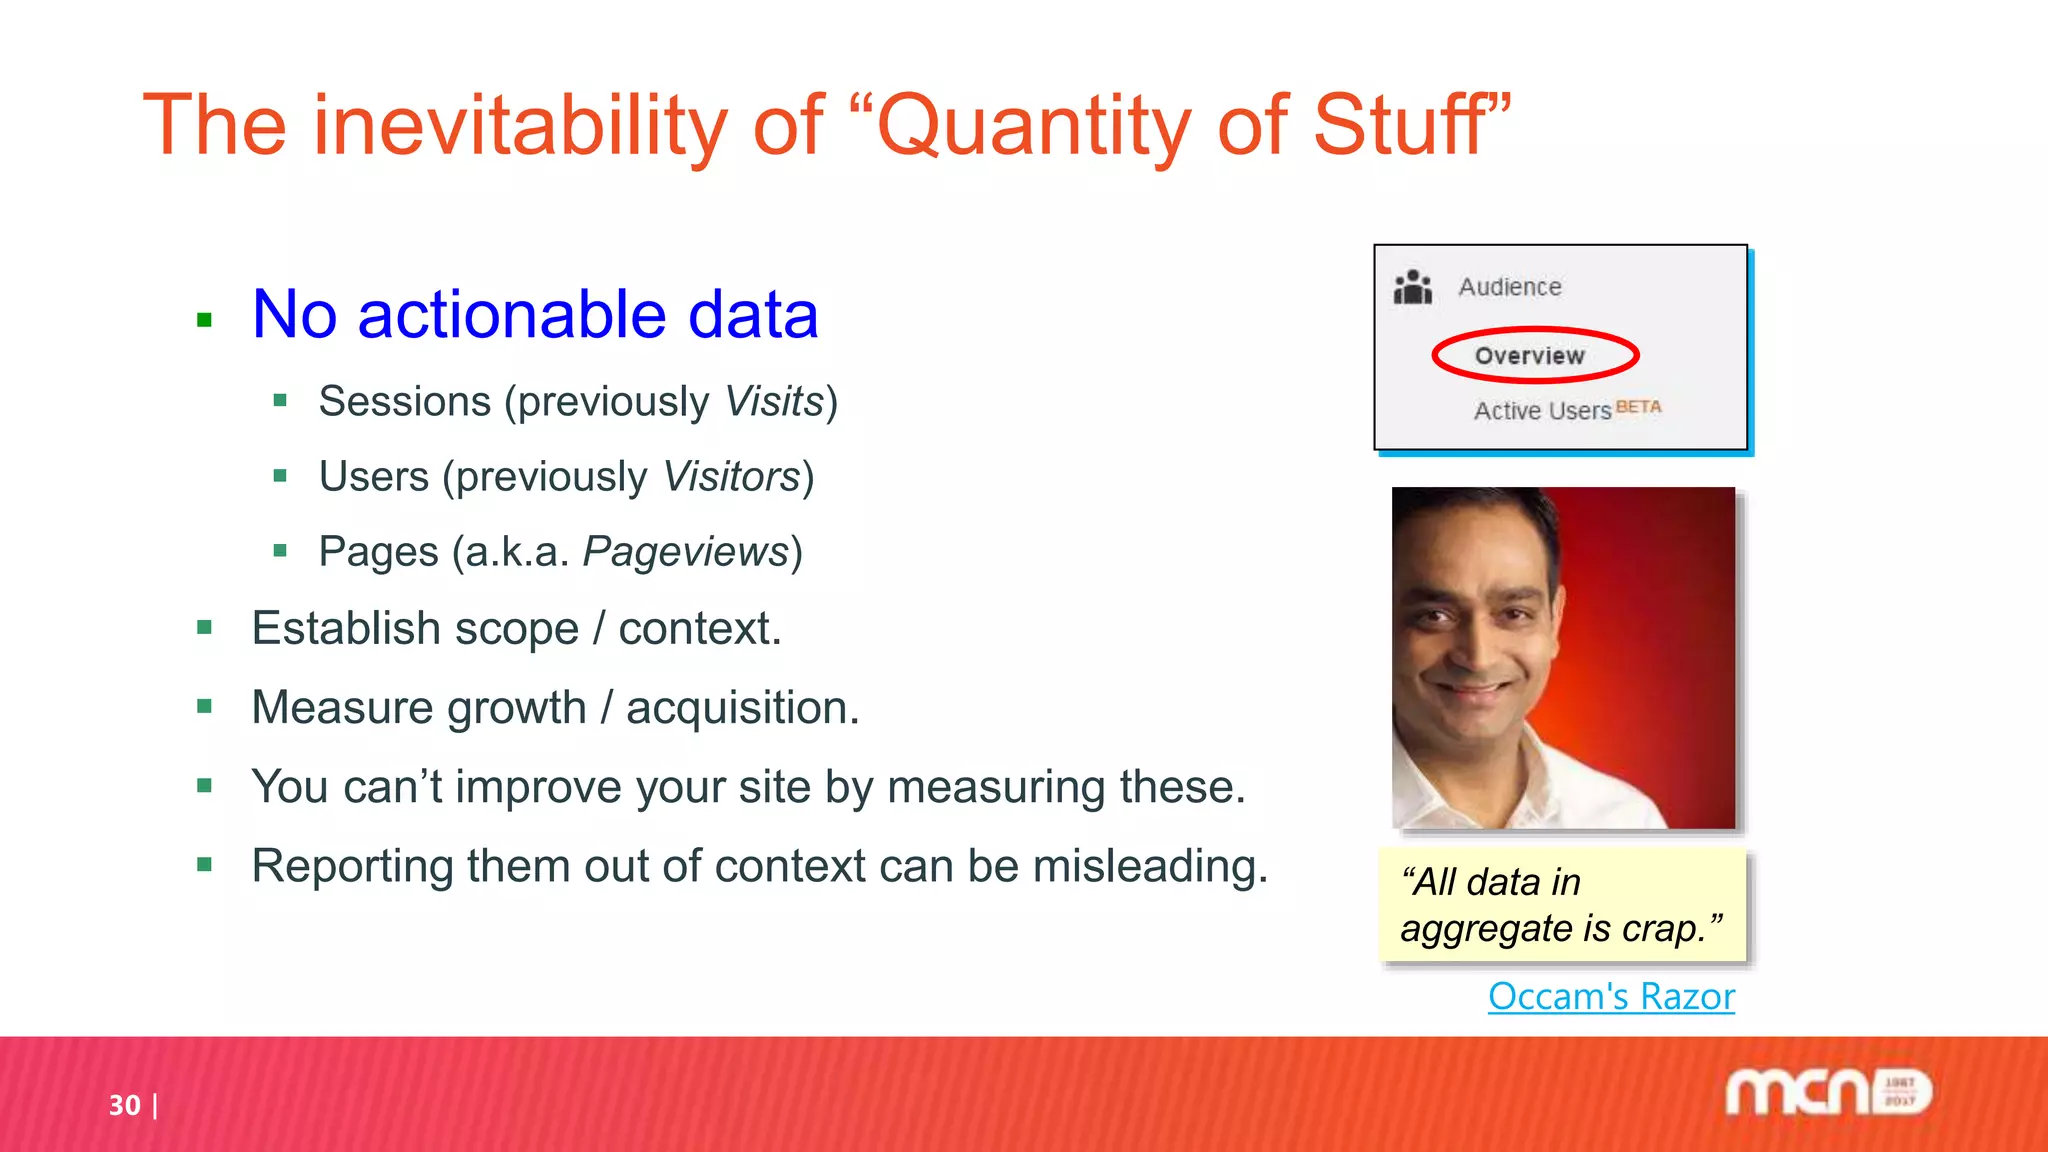
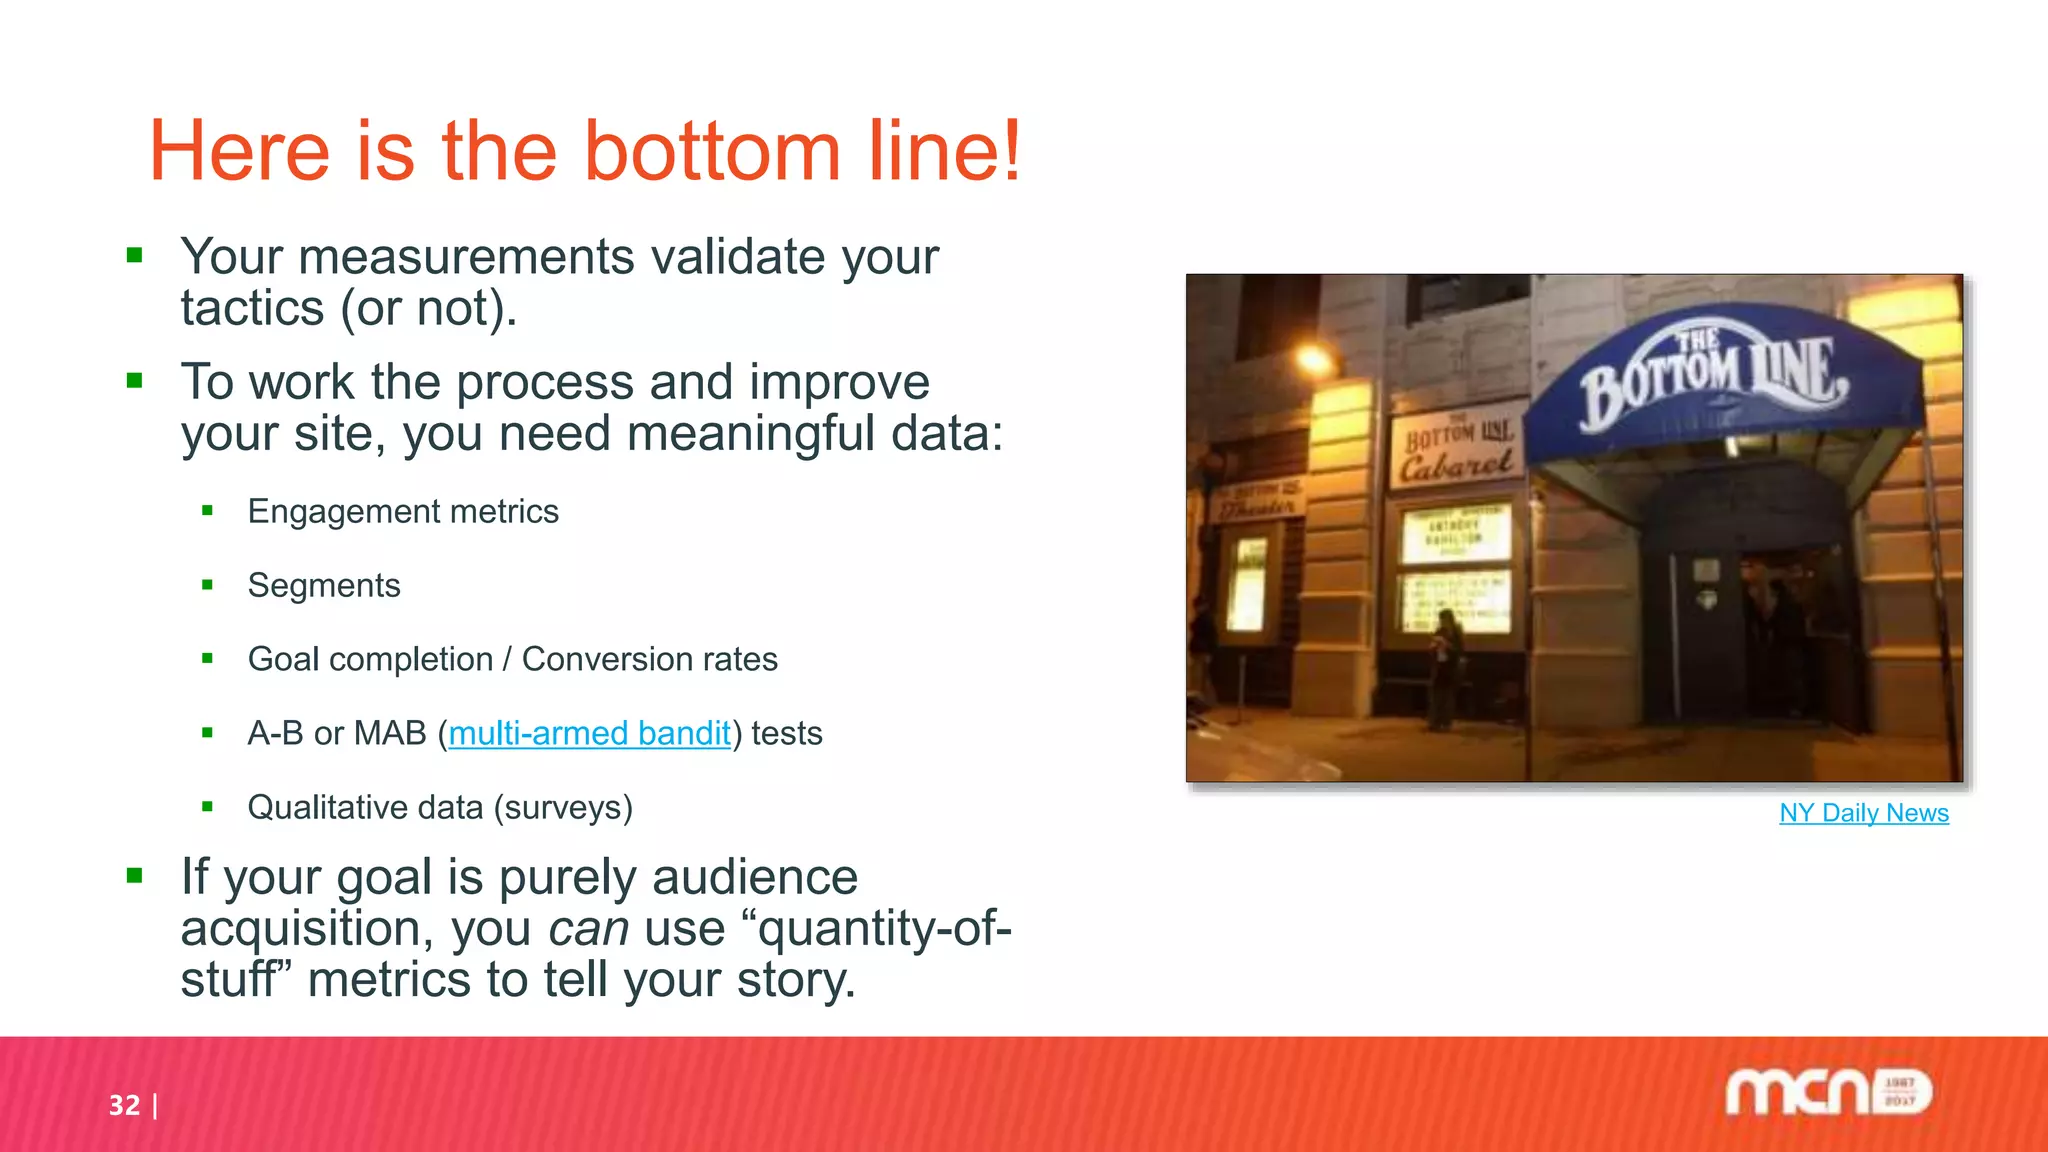
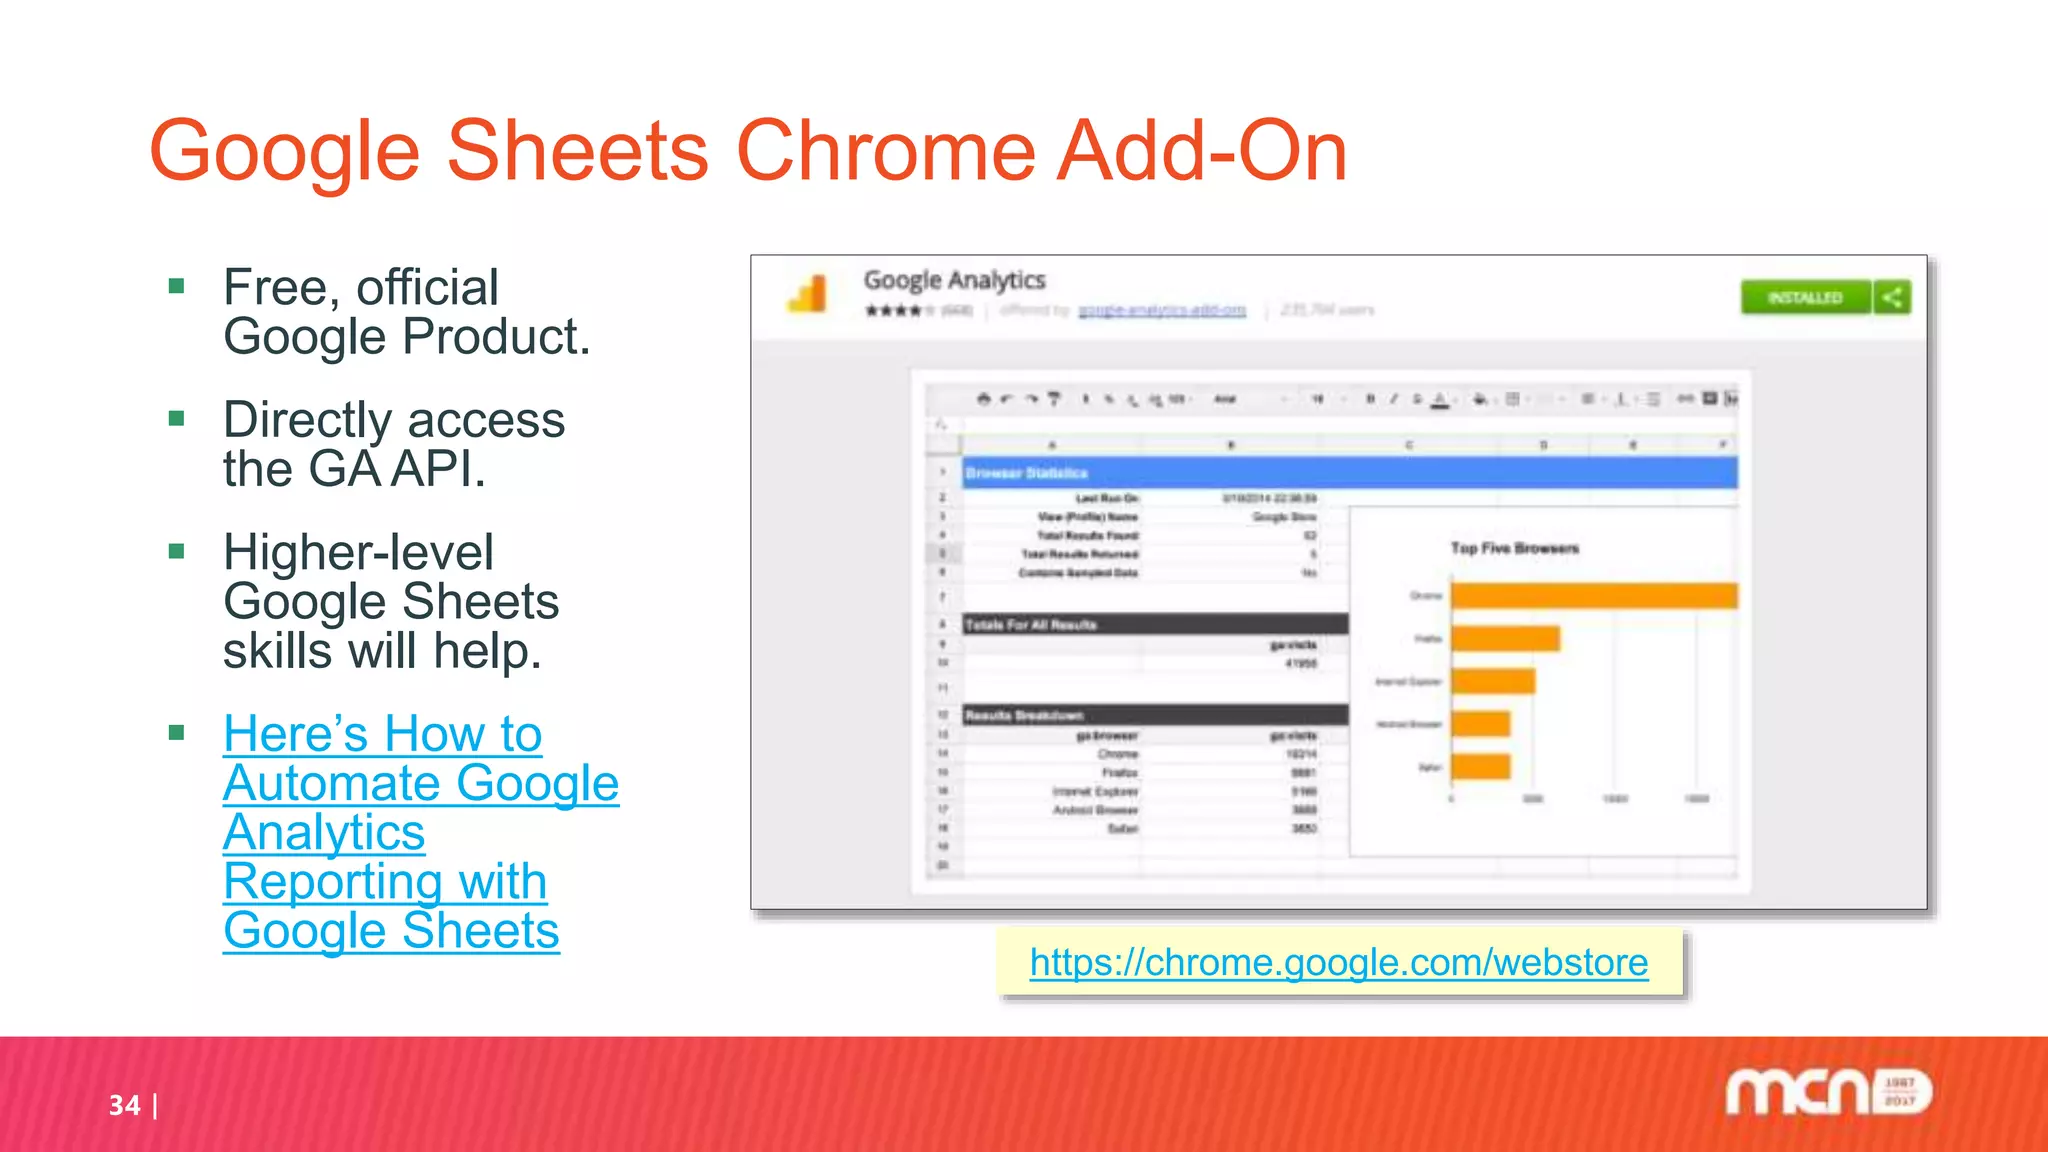
"Web Analytics and SEO: Learn the Ropes, Work a Plan, Measure the Right Stuff... Declare Victory!" - MCN2017 workshop conducted by Brian Alpert and Elena Villaespesa Cantalapiedra. A workshop designed to make Web Analytics and SEO both understandable, manageable and actionable. Recognizing that most practitioners don't have much time yet need to show measurable results, a common sense, multi-stepped web analytics process is introduced. Tool-specific highlights are largely oriented toward the world's most popular web analytics tool, Google Analytics. Automation tools to lighten the load are presented as well as Google’s new powerful dashboard tool Data Studio. The conversation then shifts to today's SEO landscape, and safe, effective steps practitioners may take to improve findability. The metrics focus continues with a discussion of search-specific free tools and specialized metrics that are effective in demonstrating whether or not website findability is improving.
Measure, Rinse, Repeat! Choosing the Right Metrics to Better Understand & R...Brian Alpert
Social media and website measurement workshop presented with @SBanks20 and @digitaleffie at MCN2016, New Orleans, LA. Steps through the process of defining clear, measurable goals for target audiences to streamline digital communications and help use data to tell a story. In this updated half-day workshop, Smithsonian's Brian Alpert, Sarah Banks and Effie Kapsalis worked with participants through a series of methodologies, case studies and a small group activity.
Google Analytics: MVPs and Game-Changing New FeaturesBrian Alpert
Part two of Seb Chan & Brian Alpert’s "Web Metrics and Google Analytics for Museums" workshop looks at some of the most significant recent changes to Google Analytics. With many improvements released over the course of the 2013-14, Google dramatically altered the landscape of the tool's capabilities. The presentation discusses such GA "MVPs" as Advanced Segmentation and Event Tracking, and provides an overview of some of the many new features, including Demographics and Interests reports, custom channels and content grouping, and the coming change to Universal Analytics. Case studies and slides showing best practices and "tips and tricks" are also included, as well as links to the valuable resources used to collect the information. Presented 4/2/14 at Museums and the Web 2014, Baltimore Maryland.
Web Analytics and SEO: Learn the Ropes, Work a Plan, Measure the Right Stuff....Brian Alpert
Updated web analytics and SEO workshop presented by Brian Alpert at MCN2016, New Orleans, LA. The workshop is designed to make Web Analytics and SEO understandable, manageable and actionable. A common sense, multi-stepped web analytics process is discussed, and carefully-crafted exercises help familiarize you with Google Analytics' most powerful features. The conversation shifts to today's SEO landscape and where SEO is heading. Safe, effective steps practitioners may take to improve findability are outlined, including specialized metrics for demonstrating whether or not website findability is improving.
Cut Through the Web Analytics Fog: Using GA Data Grabber to Act on Google Ana...Brian Alpert
A common chorus from museum professionals is how challenging it is to make data-driven decisions with which to improve their programs. Popular tools such as Google Analytics are intuitive and seemingly easy-to-use, yet when the time comes to use data to measure a program's stated goals, too often the main question surrounding the data is "So what?" This workshop will focus on bringing clarity to this challenge. Presented at MCN2012, on 11/7/12.
Metrics, Metrics, Everywhere - Choosing the Right Ones for Your Website and S...Brian Alpert
Museums and the Web 2015 workshop includes the analytics process, case studies and a social media framework. Presented by Brian Alpert, Erin Blasco, Effie Kapsalis and Sarah Banks, Smithsonian Institution.
the current state of... Search Engine Optimization (SEO) (Oct, 2015)Brian Alpert
Presented at the Smithsonian National Museum of Natural History Social Media Summit, 7/21/15, updated 10/1/15. A presentation exploring the current state of affairs vis a vis Search Engine Optimization (SEO). Areas of exploration include on-page and off-page SEO, the role social media plays, and tips for search-optimizing the leading social media sites. Overview of the current state of App Indexing. Links to many resources are sprinkled throughout.
Metrics, Metrics, Everywhere: Choosing the Right Ones for Your Website and So...Brian Alpert
Social media has connected millions of people in ways never before possible, disrupting the landscape and breathing new life into the old questions: "Why is this important and how do we know it's working?" Only now, the answers are more complex. Today's landscape is a splintered collection of new channels, sublimely named yet inscrutable metrics, and a dizzying array of tools both free and paid, offering a dizzying range of possibilities with which to answer the classic analytics question, "What do I measure?" and its first cousin, "What does that have to do with our program?" At this MCN 2013 workshop, the presenters worked with participants to refine and articulate this conversation through a series of examples, case studies, and recommendations. In addition to social media, a healthy dose of web analytics is included, with a particular focus on Google Analytics.
Metrics, Metrics, Everywhere: Choosing the Right Ones for Your Website and So...Effie Kapsalis
#MWXX Workshop
Brian Alpert, Smithsonian Institution, USA, Sarah Banks, Smithsonian's National Air and Space Museum, USA, Erin Marie Blasco, National Museum of American History, Smithsonian Institution, USA, Effie Kapsalis, Smithsonian Institution Archives, USA
From the web’s earliest days, digital professionals have been pressed to demonstrate that their online efforts were contributing to their organizations, whether by increased revenue, a more finely-honed brand identity, or the profound ability to enhance their mission via content delivery to anyone with a browser. Along comes social media, connecting millions in ways never before possible, disrupting the landscape and breathing new life into the questions: “Why is this important and how do we know it’s working?” Today’s landscape is a splintered collection of new channels, inscrutable metrics, and a dizzying array of tools offering a dizzying range of possibilities with which to answer the classic question, “What do I measure?” and its first cousin, “What does that have to do with our program?”
Join Smithsonian’s Brian Alpert, Sarah Banks, Erin Blasco and Effie Kapsalis as they work with participants to refine and articulate this conversation through a series of examples, case studies and recommendations. In addition to presenting a manageable, common sense approach to selecting metrics and extending the web analytics process to social media, examples will demonstrate how metrics served to support organizational goals and what tools proved most useful. Brian will present the process for measuring websites and social media in terms of your goals. He will also discuss the ongoing conversion to Google’s “Universal” code, the “User ID” feature, and discuss what changes are in store for ALL Google Analytics users. Effie and Erin will present case studies showing this process in action, illustrating how their approaches to social media, website and mobile measurement are mapped to specific goals. Erin will lead a group exercise that will bring participants closer to the actual process steps and definitions, and Sarah will talk about Google Analytics for mobile apps and show a framework she devised to help measure a museum’s impact through its social media outreach.
At #SMDayADL I presented on the topic of social media reporting, sharing tips on establishing suitable goals, aligning them to relevant metrics, and employing reporting best practices.
Benchmarking Your Online Impact: From Stats to Reputation ManagementNSI Partners, LLC
"Benchmarking Your Online Impact: From Stats to Reputation Management" delivered live at UnTech10, 1:30pm Thursday Feb. 11, 2010; combined from 2 sessions originally scheduled for delivery at the ASAE Technology Conference (canceled due to snowfall in Washington, DC)
Google Analytics can help you understand what content is getting traction: what gets viewed, what sends traffic and what converts to action.. Dana Chinn, web analytics lecturer at Annanberg USC and Sally Falkow, President of PRESSfeed, the social online newsroom, cover the top10 Google Analytics reports.
For retailers, the holiday season is omnipresent. You’re either neck deep in it or you’re preparing for it. In this presentation, Chad White, the Salesforce Marketing Cloud’s Lead Research Analyst and author of “Email Marketing Rules,” discusses the 6 things retailers need to work on before the upcoming holiday season: (1) Reassessing program goals, (2) Getting mobile-friendly, (3) Optimizing snippet text, (4) Increasing targeting and personalization, (5) Building out triggered emails, and (6) Keeping inactivity in check. This slide deck includes links to research reports, articles, and real-world examples so you can go in depth on the topics that are most important to you.
Subscribers are raising the bar on relevance. They’re tired of being treated the same as everyone else and they’re tuning out “one size fits all” messaging. They want brands to prove they’re paying attention by delivering the right content at the right time. In short, they expect smarter emails.
In this presentation, Chad White, Lead Research Analyst at Salesforce Marketing Cloud, presents a framework for gradually turning up the IQ of your emails in several manageable steps by improving the (1) design, (2) personalization, and (3) journeys. Along the way, tactics are illustrated with examples from Salesforce’s award-winning Email Swipe File. Get inspired and take the next step toward building smarter emails.
Webinar Featuring Forrester Customer Experience for the 'Right Now' EconomyDataStax
Forrester Principal Analyst Tony Costa shares results from a survey of 200+ global organisations who responded to 19 in-depth questions evaluating the current success of their customer experience initiatives and the challenges they face. This webinar is your chance to hear fresh and exclusive insights about customer experience and to learn which technological innovations you need to establish top-class customer experience initiatives for your business.
View webinar recording: https://youtu.be/Nmll5eBTsEs
Explore all DataStax webinars: http://www.datastax.com/resources/webinars
Social media monitoring met Alterian SM2- Webredacteuren.com KennissessieWebredacteuren.com
Presentatie over de mogelijkheden van social media monitoring tools, specifiek Alterian SM2, door Paul Kloet van Alterian. Dez epresentatie werd gegeven tijdens de Webredacteuren.com Kennissessie, georganiseerd door internetbureau Presenter op 15 februari 2011.
Social Media Insights Presentation - Fresh Egg UKFresh Egg UK
Getting actionable insights from better social media measurement
The presentation slides from the Social Media Insights event hosted by Fresh Egg as part of the Brighton Digital Festival. Presented by head of social media David Somerville and head of insight Dara Fitzgerald, the presentation includes tips for social media measurement and using Google Analytics to tag campaigns.
David and Dara’s talk centred on practical tips for measuring social media activity, plus ideas on planning this measurement effectively. One of the most fundamental (and surprisingly, often overlooked) aspects of better measurement is setting out clear objectives from the outset.
Over the past two years, influencer marketing has become one of the fastest growing digital marketing tactics. Brands are seeing the impact influencers have on their content strategy and audience development. However, many marketers are still gaining a full understanding of how to run an influencer campaign and which insights they should be paying attention to.
This presentation covers:
- Influencer marketing overview – the who, what, where and why
- Starting an influencer campaign – setting goals, identifying audience, keywords and content
- Building a content campaign – building strategy, setting timelines, finding and engaging with influencers
- Monitoring and Reporting – tracking off-site content, measuring true influence beyond likes and shares
One of the crucial trends nowadays will be the growth of attribution modeling. However, many savvy marketers are still missing the opportunity to reap the benefits of attribution modeling, hence this whitepaper is aimed at providing a comprehensive overview of what marketing attribution is all about.
You'd like to be more rational and data-driven in your decision making. You know that your museum has been collecting web traffic metrics using Google Analytics, but you've never fully understood what those reports mean for you or your department. How can you use this popular software to find actionable data that helps you do your job better? In this session you will get a practical tutorial, led by two Google Analytics veterans at the Smithsonian, who will provide an overview of the current Google Analytics, including some of its newest, most powerful features. The presenters will also discuss the step-by-step process for moving beyond measurement just for measurement's sake, using real-life museum case studies as examples.
Presenters: Sara Snyder, Smithsonian American Art Museum; Brian Alpert, Smithsonian Institution.
Presented at the American Alliance of Museums 2016 Annual Meeting & MuseumExpo, 5/27/2016.
Analytics Tune Up! Google Analytics workshop for beginners, intermediatesBrian Alpert
Workshop presented 6/14/2016 to digital practitioners at the Smithsonian Institution, Washington D.C. Workshop includes:
- Web Analytics Process
- GA Basics
- Exercise: “Solutions Gallery”
- Exercise: Segments
- Exercise: Custom Reports
- Demo: Goals
- Exercise: Dashboards
- New(ish) features
- Universal Analytics
- A few best practices
- A few ‘real world’ questions
Metrics, Metrics, Everywhere! Choosing the Right Ones for Your Website and ...Brian Alpert
UPDATED social media and website measurement workshop as presented by Sarah Banks, Erin Blasco, Effie Kapsalis and Brian Alpert, at Museums and the Web 2016, 4/6/16, Los Angeles California.
Hosted by MCN Data & Insights SIG co-chair, Elena Villaespesa, this hangout is an introduction to Google Analytics. Brian Alpert, Web Analyst at the Smithsonian will join Elena and show you how to get a handle on this important analytical tool.
Topics covered:
Introduction to digital analytics
Navigating Google Analytics reports
Setting goals and targets
Google Analytics features
Segmentation
Custom reports
Event tracking
Views and filters
Dashboards
Resources & tools
Q&A
Video
https://www.youtube.com/watch?v=kQDCWS4bye4
I delivered this presentation to MSc Digital Marketing class of "The UCD Michael Smurfit Graduate Business School - University College Dublin" in February 2015.
The presentation covers some basics and fundamental information about Google Analytics.
Google analytics and google data studioBrian Pichman
This webinar introduces the basics of Google Analytics – from getting started and understanding how it works so you can get your website running with the powerful tools offered through Google Analytics. This webinar highlights the importance of using it for tracking of your website or marketing campaigns so you can make better informed decisions, understand your users, and use that data to provide a better digital experience. We will also explore how you can incorporate Google Data Studio with your Analytics for amazing interactive reports that are sure to impress any board meeting.
Designing Outcomes For Usability Nycupa Hurst FinalWIKOLO
MarkoHurst.com :: My topic of discussion at the Feb 17 2009 NYC UPA.
Even as the pace of society, business, and the Internet continue to increase, many budgets and time lines continue to decrease. To compound this issue, there is a serious disconnect between business goals, user goals, and what visitors actually do on your site. UX practitioners need a simple and efficient way to reconcile these diverse needs while taking action on their data. Join us to learn about a new method for incorporating quantitative data such as web analytics and business intelligence into your qualitative user experience deliverables: personas, wireframes, and more. This presentation will include discussions of online business models, feedback loops for ensuring cross-discipline collaboration, and ongoing revisions.
6 Steps to boost your prospect funnel and sales conversion rate with truly in...Helen McInnes
How to come up with a "big idea" for a PR campaign, ensure you have the right content kit to drive traffic to your website and landing page that drives conversions
Data Driven Digital Marketing Strategy Wecomex Ltd
In today’s modern global retail environment, customers and businesses alike are increasingly empowered by the new digital technologies and channels available right at their fingertips.
But, this explosion in increased connectivity has meant an overwhelming wave of data and information.
Businesses are challenged more than ever before to adopt a Data-Driven Digital Marketing Strategy and solutions to better manage that data deluge, understand their customers from every angle and surpass customers’ growing expectations for service.
Jay Murphy, a Boston University instructor and Google Analytics pro, shows Newport Interactive Marketers how to use Google Analytics to drive ROI. Great presentation to get an understanding on how to use Google Analytics to enhance users' experience on your page.
Similar to MCN2017 Workshop: Web Analytics and SEO (20)
Generating a custom Ruby SDK for your web service or Rails API using Smithyg2nightmarescribd
Have you ever wanted a Ruby client API to communicate with your web service? Smithy is a protocol-agnostic language for defining services and SDKs. Smithy Ruby is an implementation of Smithy that generates a Ruby SDK using a Smithy model. In this talk, we will explore Smithy and Smithy Ruby to learn how to generate custom feature-rich SDKs that can communicate with any web service, such as a Rails JSON API.
GraphRAG is All You need? LLM & Knowledge GraphGuy Korland
Guy Korland, CEO and Co-founder of FalkorDB, will review two articles on the integration of language models with knowledge graphs.
1. Unifying Large Language Models and Knowledge Graphs: A Roadmap.
https://arxiv.org/abs/2306.08302
2. Microsoft Research's GraphRAG paper and a review paper on various uses of knowledge graphs:
https://www.microsoft.com/en-us/research/blog/graphrag-unlocking-llm-discovery-on-narrative-private-data/
Neuro-symbolic is not enough, we need neuro-*semantic*Frank van Harmelen
Neuro-symbolic (NeSy) AI is on the rise. However, simply machine learning on just any symbolic structure is not sufficient to really harvest the gains of NeSy. These will only be gained when the symbolic structures have an actual semantics. I give an operational definition of semantics as “predictable inference”.
All of this illustrated with link prediction over knowledge graphs, but the argument is general.
Slack (or Teams) Automation for Bonterra Impact Management (fka Social Soluti...Jeffrey Haguewood
Sidekick Solutions uses Bonterra Impact Management (fka Social Solutions Apricot) and automation solutions to integrate data for business workflows.
We believe integration and automation are essential to user experience and the promise of efficient work through technology. Automation is the critical ingredient to realizing that full vision. We develop integration products and services for Bonterra Case Management software to support the deployment of automations for a variety of use cases.
This video focuses on the notifications, alerts, and approval requests using Slack for Bonterra Impact Management. The solutions covered in this webinar can also be deployed for Microsoft Teams.
Interested in deploying notification automations for Bonterra Impact Management? Contact us at sales@sidekicksolutionsllc.com to discuss next steps.
GDG Cloud Southlake #33: Boule & Rebala: Effective AppSec in SDLC using Deplo...James Anderson
Effective Application Security in Software Delivery lifecycle using Deployment Firewall and DBOM
The modern software delivery process (or the CI/CD process) includes many tools, distributed teams, open-source code, and cloud platforms. Constant focus on speed to release software to market, along with the traditional slow and manual security checks has caused gaps in continuous security as an important piece in the software supply chain. Today organizations feel more susceptible to external and internal cyber threats due to the vast attack surface in their applications supply chain and the lack of end-to-end governance and risk management.
The software team must secure its software delivery process to avoid vulnerability and security breaches. This needs to be achieved with existing tool chains and without extensive rework of the delivery processes. This talk will present strategies and techniques for providing visibility into the true risk of the existing vulnerabilities, preventing the introduction of security issues in the software, resolving vulnerabilities in production environments quickly, and capturing the deployment bill of materials (DBOM).
Speakers:
Bob Boule
Robert Boule is a technology enthusiast with PASSION for technology and making things work along with a knack for helping others understand how things work. He comes with around 20 years of solution engineering experience in application security, software continuous delivery, and SaaS platforms. He is known for his dynamic presentations in CI/CD and application security integrated in software delivery lifecycle.
Gopinath Rebala
Gopinath Rebala is the CTO of OpsMx, where he has overall responsibility for the machine learning and data processing architectures for Secure Software Delivery. Gopi also has a strong connection with our customers, leading design and architecture for strategic implementations. Gopi is a frequent speaker and well-known leader in continuous delivery and integrating security into software delivery.
Builder.ai Founder Sachin Dev Duggal's Strategic Approach to Create an Innova...Ramesh Iyer
In today's fast-changing business world, Companies that adapt and embrace new ideas often need help to keep up with the competition. However, fostering a culture of innovation takes much work. It takes vision, leadership and willingness to take risks in the right proportion. Sachin Dev Duggal, co-founder of Builder.ai, has perfected the art of this balance, creating a company culture where creativity and growth are nurtured at each stage.
Essentials of Automations: Optimizing FME Workflows with ParametersSafe Software
Are you looking to streamline your workflows and boost your projects’ efficiency? Do you find yourself searching for ways to add flexibility and control over your FME workflows? If so, you’re in the right place.
Join us for an insightful dive into the world of FME parameters, a critical element in optimizing workflow efficiency. This webinar marks the beginning of our three-part “Essentials of Automation” series. This first webinar is designed to equip you with the knowledge and skills to utilize parameters effectively: enhancing the flexibility, maintainability, and user control of your FME projects.
Here’s what you’ll gain:
- Essentials of FME Parameters: Understand the pivotal role of parameters, including Reader/Writer, Transformer, User, and FME Flow categories. Discover how they are the key to unlocking automation and optimization within your workflows.
- Practical Applications in FME Form: Delve into key user parameter types including choice, connections, and file URLs. Allow users to control how a workflow runs, making your workflows more reusable. Learn to import values and deliver the best user experience for your workflows while enhancing accuracy.
- Optimization Strategies in FME Flow: Explore the creation and strategic deployment of parameters in FME Flow, including the use of deployment and geometry parameters, to maximize workflow efficiency.
- Pro Tips for Success: Gain insights on parameterizing connections and leveraging new features like Conditional Visibility for clarity and simplicity.
We’ll wrap up with a glimpse into future webinars, followed by a Q&A session to address your specific questions surrounding this topic.
Don’t miss this opportunity to elevate your FME expertise and drive your projects to new heights of efficiency.
LF Energy Webinar: Electrical Grid Modelling and Simulation Through PowSyBl -...DanBrown980551
Do you want to learn how to model and simulate an electrical network from scratch in under an hour?
Then welcome to this PowSyBl workshop, hosted by Rte, the French Transmission System Operator (TSO)!
During the webinar, you will discover the PowSyBl ecosystem as well as handle and study an electrical network through an interactive Python notebook.
PowSyBl is an open source project hosted by LF Energy, which offers a comprehensive set of features for electrical grid modelling and simulation. Among other advanced features, PowSyBl provides:
- A fully editable and extendable library for grid component modelling;
- Visualization tools to display your network;
- Grid simulation tools, such as power flows, security analyses (with or without remedial actions) and sensitivity analyses;
The framework is mostly written in Java, with a Python binding so that Python developers can access PowSyBl functionalities as well.
What you will learn during the webinar:
- For beginners: discover PowSyBl's functionalities through a quick general presentation and the notebook, without needing any expert coding skills;
- For advanced developers: master the skills to efficiently apply PowSyBl functionalities to your real-world scenarios.
Kubernetes & AI - Beauty and the Beast !?! @KCD Istanbul 2024Tobias Schneck
As AI technology is pushing into IT I was wondering myself, as an “infrastructure container kubernetes guy”, how get this fancy AI technology get managed from an infrastructure operational view? Is it possible to apply our lovely cloud native principals as well? What benefit’s both technologies could bring to each other?
Let me take this questions and provide you a short journey through existing deployment models and use cases for AI software. On practical examples, we discuss what cloud/on-premise strategy we may need for applying it to our own infrastructure to get it to work from an enterprise perspective. I want to give an overview about infrastructure requirements and technologies, what could be beneficial or limiting your AI use cases in an enterprise environment. An interactive Demo will give you some insides, what approaches I got already working for real.
Smart TV Buyer Insights Survey 2024 by 91mobiles.pdf91mobiles
91mobiles recently conducted a Smart TV Buyer Insights Survey in which we asked over 3,000 respondents about the TV they own, aspects they look at on a new TV, and their TV buying preferences.
6. 6
Your goal: use data to tell a story
What was happening.
What it meant.
What you did.
What’s happening now.
forbes.com
7. 7
There is a systematic, step-by-step process
Articulate your program’s goals.
Decide strategies to achieve those
goals.
Decide tactics to pursue the
strategies.
Decide what and how to measure
to validate the tactics.
Benchmark to get a sense of
what’s normal.
homedit.com
8. 8
Articulate specific goals
Express what you’re trying to
accomplish.
Make high-level goals more
specific:
“Increase influence” - too broad.
“Become the definitive source on
Smithsonian history” - more specific.
Specificity makes it easier to
identify strategies and tactics.
Not too many!
It’s a Wonderful Life
Start the conversation! Articulate goals
and next steps on your own; work with
management to finalize.
9. Determine strategies & tactics
Strategies – the plans you make to achieve the goals.
Employing social media is a strategy.
Tactics – the things you do to advance the strategy.
Producing a specific type of content is a tactic.
Individual channels (facebook, twitter) are tactics.
Per the example:
Goal: “Become the definitive source on Smithsonian history.”
Strategy: Increase engagement with history of the Smithsonian content.
Tactic: Make SI-history content more findable and measureable.
9
10. 10
Decide how to measure your tactics
Choose measurements to learn if
your tactics are succeeding.
Choose a few measurements.
Trend them over time.
Per the example:
Strategy: increase engagement with SI
history website content.
Tactic: make website history content more
findable / measureable.
Make a “history-content” segment and
measure for engagement:
Visit frequency
Visit depth
Bounce rate
History-related
visits
All
visits
“Deep history visits” were 94% higher!
11. Decide how to measure your tactics (cont’d)
Acquisition-related goals
Sessions
Users
Campaigns
New vs Returning
Entrances
Referrals
Engagement-related goals
Session frequency
Page depth
Time on site
Bounce rate
Events
Content-related goals
Pageviews
Page depth
Bounce rate
Issue-related goals
Event-based conversions (exits from on-site search
results, etc.)
Contact form submissions
Funnel abandonment
Design-related goals
Users / Events flow
Page depth
Time on site
Funnel abandonment
11
The measurements you choose depends on your goals:
12. Examples!
Measureable Goal: Increase social
media followers in the 5 key regions by
20%
Tactic: Facebook and Twitter Ads
targeted to the five regions
Measurement: Twitter and Facebook
followers by geography
Measureable Goal: Increase
website sessions and engagement from 5
key regions by 20%
Tactic: Google AdWords targeted to the
five regions
Measurement: sessions, pageviews,
page depth, time on site
12
Broad goal
Raise national visibility, especially in five key regions
Strategy
Digital advertising in the five key regions
13. 13
You can’t set targets w/o benchmarks
You need at least six months of data.
Data is seasonal.
Depends on your traffic.
Balance targets with factors beyond
your control:
Are the improvements you’re seeking
difficult to achieve?
How much resources will you have to
implement tactics? Drinks Enthusiast
14. 14
Keep it simple!
Don’t do too much!
Minimize the number of
measurements.
If they turn-out to be inconclusive,
change up.
It’s an ongoing process! arvinddevalia.com
16. Dimensions and Metrics
Dimensions describe the data, or an
attribute of the user (“what”):
Traffic source
City
Page
Metrics measure the data (“how
many,” “how long”):
Sessions
Bounce rate
Time on page
Lunametrics
Optimizesmart
Dimensions & Metrics Explorer (Google)
16
Optimizesmart
Dimensions Metrics
GA’s familiar
color-coding
helps you
keep track of
Dimensions
and Metrics.
17. How GA reports are organized
The way the reports are
organized speaks to
specific types of questions.
17
LunaMetrics
Audience
Acquisition
Behavior
Conversions
18. 18
Metrics as proxies for user engagement
Under Audience >> Behavior
New vs. Returning (e-nor post)
Frequency & Recency
Engagement (Page Depth)
Use with segments:
Traffic from search
Traffic from mobile
Etc.
‘Average Session Duration’ (‘time on site’) can help
inform engagement, but do not rely solely upon it.
Due to technical issues
19. 19
Segmentation: GA’s most powerful feature?
Segments are accessed
by clicking “Add
Segment”. “Organic
Traffic” is shown.
All Users
Organic (Search
Engine) Traffic
Analyze subsets of traffic.
Search engine traffic
Social media traffic
Demographics
Segments can be copied and shared.
Google Blog
Kissmetrics Overview
Examples (Cutroni)
Examples (Kaushik)
20. 20
Exercise: create a new segment
Google’s Avinash Kaushik wrote about a segment of
engaged visitors he called Non-Flirts, Potential Lovers
“Why not analyze people who DO engage with us?”
Engagement / Page Depth shows the distribution of the
# of pages people visit on your site.
“The "tipping point" at which a core group of people decide to stick
with your site.
Navigate to GA’s Acquisition Overview report
Click on “All Users”, or “+Add Segment” (next to it)
Click
Kaushik’s blog
Occam's Razor
is a great
resource for
making web
analytics fun and
understandable.
21. Set-up your segment’s Conditions
Click ‘Conditions’ (left menu, @ bottom)
Note that you can select between Sessions and Users
Select Sessions
21
22. Select your segment’s Dimension
Click ‘Ad Content’
Type-in ‘Page Depth’
Select the green ‘Page Depth’
dimension.
22
23. Make a new segment (cont’d)
In the ‘Conditions’ pull-
down, change to
Type ‘3’ in the box to
its right.
Name the segment
“Sessions 3+ pages”
and click ‘Save’.
23
Sessions 3+ pages
24. How can we use the new segment?
In his blog post Kaushik wants you to ask yourself “What’s unique about (any)
segmented group?”
Where did they come from? (Source/Medium)
What pages did they enter on? (Entrances)
What campaigns have a higher percentage of these people? (Campaign referrals)
What countries? (Geo >> Location report)
What is the difference between content they consume on your site compared to everyone else?
Do they all happen to use the (comparison chart) first?
Do they all read the (Sports) section?
24
25. Package entire
datasets for
deeper analysis.
Saves time
Shows just the
data you need.
Create and manage
Custom Reports (Google)
12 Awesome Custom
Reports Created by the
Experts (Kissmetrics)
5 Google Analytics Custom
Reports FTW! (Kaushik)
25
Custom Reports can save you time & effort
Create and access
Custom Reports from
the ‘Customization’
menu.
Custom Reports can be
scheduled for delivery via
email in a variety of formats.
26. A conversion is any measureable behavior with
an implicitly (or explicitly) higher value.
Conversion rates are more informative than
merely counting the number of times something
has happened.
Typical conversion goals:
Destination (ex: thanks.html)
Duration (ex: 5 minutes or more)
Pages/Screens per session (ex: 3 pages)
Event (download PDF, play video)
REQUIRES CODE
26
Deeper understanding with Conversion Goals
Studying conversion
rates levels the playing
field, versus merely
counting!
27. ‘Event Tracking’ is super-important
More sophisticated Goals typically involve creating “Events”:
Clicks on links (outbound links, PDFs, etc.)
Sign-ups, form submissions
Downloads
Many types of conversion goals
To use Events:
Define and categorize events.
Configure and add the javascript code, usually right in the link (not always).
Many social-share widgets automatically add Events.
Google Analytics Event Organizer (Smithsonian’s Michelle Herman)
The Complete Google Analytics Event Tracking Guide Plus 10 Amazing Examples (old
code, but good examples)
27
29. 29
Track Campaigns with ‘URL Builder’
For more granular data about specific Campaigns:
Email Campaigns
Social Media
Banners
Anything that uses a URL-based click-to format
As with Events, the work is up front, in the categorization:
Campaign Source
(referrer: google, citysearch, newsletter4)
Campaign Medium
(marketing medium: cpc, banner, email)
Campaign Term
(identify the paid keywords)
Campaign Content
(use to differentiate ads)
Campaign Name
URL Builder (Google)
How To Use UTM Parameters (Kissmetrics)
URL Builder for GA (Raventools)
30. 30
The inevitability of “Quantity of Stuff”
No actionable data
Sessions (previously Visits)
Users (previously Visitors)
Pages (a.k.a. Pageviews)
Establish scope / context.
Measure growth / acquisition.
You can’t improve your site by measuring these.
Reporting them out of context can be misleading.
Occam's Razor
“All data in
aggregate is crap.”
31. 31
Dashboards are useful, and easy to make
Display multiple reports at once.
“My Dashboard” (default) included.
Import from the Solutions Gallery.
Share as PDFs.
Schedule for distribution by email.
About Dashboards (Google)
10 useful Google Analytics custom dashboards
(Econsultancy)
How Google Analytics Dashboards Can Make Your Life
Easier (Kissmetrics) Customize Dashboards by adding / deleting /
manipulating widgets (up to 12 per dashboard)
Google
32. 32
Here is the bottom line!
Your measurements validate your
tactics (or not).
To work the process and improve
your site, you need meaningful data:
Engagement metrics
Segments
Goal completion / Conversion rates
A-B or MAB (multi-armed bandit) tests
Qualitative data (surveys)
If your goal is purely audience
acquisition, you can use “quantity-of-
stuff” metrics to tell your story.
NY Daily News
34. 34
Google Sheets Chrome Add-On
Free, official
Google Product.
Directly access
the GA API.
Higher-level
Google Sheets
skills will help.
Here’s How to
Automate Google
Analytics
Reporting with
Google Sheets
https://chrome.google.com/webstore
35. Supermetrics
Commercial Excel add-on.
Easy-to-use and customize.
Exceptional charting
capabilities.
Schedule reports to run
automatically.
14 days free.
$348 per year.
Limited documentation and
support.
Free version for Google
Sheets available.
35
http://supermetrics.com
36. Analytics Edge Excel Add-on
Wizard-driven interface is clean
and (relatively) intuitive.
Auto-refresh and schedule
reports.
Import data from text files,
worksheets or other workbooks
Support via online community.
Free and paid versions:
Free Social Shares connector.
More features - $6/month.
Optional connectors - $4/month.
36
http://www.analyticsedge.com
37. 37
Google Tag Manager means… what?
GTM can simplify your life, IF:
You have multiple JS tags on a straightforward site.
Your implementation configuration is basic.
You’re not customizing the data layer.
You’re not doing ecommerce or Events (link clicks, form submits, etc.).
If you’re tracking complex interactions, or have multiple
sites / subdomains, you have to be careful (test)!
You may need the services of a developer.
Unlock the Data Layer: A Non-Developer’s Guide to Google Tag Manager
10 Ways Your GTM Setup Might Be Broken Vampyre Fangs
38. 38
Google’s “Analytics Academy”
Free video-based courses
Digital Analytics Fundamentals
Google Analytics Platform Principles
Ecommerce Analytics: From Data to
Decisions
Mobile App Analytics Fundamentals
Google Tag Manager Fundamentals
Advanced Google Analytics
analyticsacademy.withgoogle.com
39. Web Analytics Resources
Google Analytics Academy (Google)
Google Analytics Blog (Google)
Universal Analytics Upgrade Guide (Google)
Absolute Beginner's Guide to Google Analytics (moz.com)
Occam’s Razor (Avinash Kaushik)
Analytics Talk (Google’s Justin Cutroni)
Jeffalytics (Jeff Saur)
Annielytics (Annie Cushing)
Analytics Edge (Mike Sullivan)
Kissmetrics blog
Lunametrics blog / Lunametrics Training
Cardinal Path Training
Discover the Google Analytics Platform (advanced tools)
39
41. What does “SEO” mean today?
Search Engines (SE’s) are smarter than ever.
Almost all traffic is personalized, which affects SE results.
Google has worked to defeat tactical SEO, but…
“Old school” stuff, (titles, text content, links, URLs, site architecture) still matters.
Depending on who you believe, Google has between 73%* and 90%** of worldwide
desktop traffic.
…Bing, Yahoo, Baidu, Yandex “and the rest” still account for billions of searches every
month.
41
*source
**source
42. SEO – Search Engine Optimization
MCN 201642
https://searchengineland.com/seotable
43. Keywords
MCN 201643
How many times should I repeat my keywords?
https://moz.com/blog/how-much-keyword-repetition-is-optimal-whiteboard-friday
44. Content Keywords
MCN 201644
http://www.tate.org.uk/art/art-terms/c/cubism - URL
<meta name="description" content="Tate glossary definition for
cubism: A revolutionary new approach to representing reality in
art invented by artists Pablo Picasso and Georges Braque in
which the artists aimed to bring different views of their subjects
together in the same picture"> - Meta description
Heading
Text
<title>Cubism – Art Term | Tate</title> - Title
45. Collection object page optimization
MCN 201645
Using the SEOMoz Chrome extension go to a Collection object on a museum’s website. Are the key
metadata information and keywords optimized? Check the following elements:
• Title
• Meta description
• URL
• Heading (H1, H2)
• Keywords in the content
46. Google Search console – Search Analytics reports
MCN 201646
• Branded traffic vs Non-Branded traffic
metropolitan museum of art
the met
met museum
metropolitan museum
met
met breuer
the metropolitan museum of art
the cloisters
metmuseum
met art
cubism
romanticism
impressionism
rei kawakubo
abstract expressionism
han dynasty
autumn rhythm
kerry james marshall
albrecht durer
Branded Non-Branded
47. Google Search console – Search Analytics reports
MCN 201647
• Keywords analysis – Are there opportunities to increase our traffic?
49. Voice search
MCN 201649
“Nearly 40% of people search only on a
Smartphone in an average day”
“50% of all searches will be voice searches
by 2020” according to comscore “
“Google voice search queries in 2016 are up
35x over 2008” according to Google trends
via Search Engine Watch”
51. Voice search usage
MCN 201651
• Plan your visit
• At the museum
How is the museum’s content positioned in your voice
search?
52. Natural language
MCN 201652
Natural language search is search
carried out in everyday language,
phrasing questions as you would
ask them if you were talking to
someone.
These queries can be typed into a
search engine, spoken aloud with
voice search, or posed as a
question to a digital assistant like
Allo, Siri or Cortana.
53. Importance of Personalization
Virtually all search results are personalized now.
This is true whether or not you are logged into Google, but especially true if you are.
SO… there is no standard rank for a given keyword.
Analyzing rankings for specific keywords is a flawed strategy anyway!
Tip: try Chrome’s ‘Incognito’ mode – Shift-Ctrl-N
53
54. Importance of Local
Over 50% of Google trillions of searches / year are mobile
Nearly one third of those are location-related. (source)
“Every month people visit 1.5 billion destinations related to what they
searched for on Google.” (source)
Searches with local intent are more likely to lead to store visits and sales
within a day. Fifty percent of mobile users are most likely to visit after
conducting a local search. (Google / source)
“Authoritative OneBox” (right) is the grand prize.
54
Appearing in the three-listing snack-
pack is critical for businesses, but not
always do-able.
Organic optimization plays a large role.
Correct/consistent “NAP” (name,
address, phone) is critical.
55. What influences Google’s algorithm?
Moz 2015 Ranking Survey
150 expert opinions
One-to-ten scale
“Old school” factors still rank
highest, but exact keyword
matches are less influential
Social ranks lowest, but
shares are important.
55
“…The data continues to show
some of the highest correlations
between Google rankings and the
number of links to a given page.”
56. Moz definitions (into the weeds)
Domain-Level, Link Authority Features: Based on link/citation metrics such as quantity of
links, trust, domain-level PageRank, etc. (8.22)
Page-Level Link Metrics: PageRank, Trust metrics, quantity of linking root domains, links,
anchor text distribution, quality/spamminess of linking sources, etc. (8.19)
Page-Level Keyword & Content-Based Metrics: Content relevance scoring, on-page
optimization of keyword usage, topic-modeling algorithm scores on content, content
quantity/quality/relevance, etc. (7.87)
Page-Level, Keyword-Agnostic Features: Content length, readability, Open Graph markup,
uniqueness, load speed, structured data markup, HTTPS, etc. (6.57)
User Usage & Traffic/Query: Data SERP engagement metrics, clickstream data, Visitor
traffic/usage signals, quantity/diversity/CTR of queries, both on the domain and page level (6.55)
Domain-Level Brand Metrics: Offline usage of brand/domain name, mentions of brand/domain
in news/media/press, toolbar/browser data of usage about the site, entity association, etc. (5.88)
Domain-Level Keyword Usage: Exact-match keyword domains, partial-keyword matches, etc.
(4.97)
Domain-Level, Keyword-Agnostic Features: Domain name length, TLD extension, SSL
certificate, etc. (4.09)
Page-Level Social Metrics: Quantity/quality of tweeted links, Facebook shares, Google +1s,
etc. to the page (3.98)
56
57. 57
Old-School Website SEO Still Matters
Navigation and link structure
Spiders still find pages by crawling the site through navigation and links.
SE’s like flatter architectures and will index flat sites more thoroughly.
Infrastructure can impact the crawler's ability to scan and index pages.
‒ Incorporating links in JavaScript, iFrames, Flash, etc.
URL / directory / filename structure. Search-friendly URLs:
Are descriptive, giving some idea what the page is about.
Are simple, static and short:
‒ A single dynamic parameter can result in lower ranking and indexing.
‒ Easier for the spider to understand and put in context
Use (but do not overuse) keywords.
Use hyphens to separate words.
58. You have control of Title and Description tags!
Page Title tags are important – every page should have its own!
They tell a search engine what the page is about.
They are the headline for the search listing – 60 characters!
Meta Description tag helps improve click-through.
They need to be short, provide a coherent description – 120 charcters!
58
Awesomesauce!
Uninspired, but to the point.
No description tag!
Dept. of Redundancy Dept.
Good description, but it’s not the
one they wrote, AND it’s cut off!
59. “Keyword research” was HUGE!
BUT – Google has gotten very (VERY) good at:
Understanding what pages are about.
How words relate to each other (“semantic keywords”).
If you have great content, you are probably using a rich variety of the right keywords.
I.e., the ones people actually search for!
MAYBE. You should know.
BUT… concentrated keyword research is an intense process:
STEP 1: Use Multiple Sources to Get Keyword Suggestions.
STEP 2: Selects Keywords that Match Multiple Types of Searcher Intent Based on Your Content Strategy.
STEP 3: Collect Keyword Metrics and Sort/Filter/Prioritize Based on Goals.
STEP 4: Determine Keyword Targeting & New Content Creation Needs/Priority.
These tips are easy-to-do however:
Google auto-suggest (search entry box pull-down).
Google “Searches related-to _______” (similar searches).
Moz’s Keyword Explorer can help identify keyword suggestions.
59
60. 60
Keyword research (into the weeds)
Process:
Discovering and Prioritizing the Best Keywords (Moz)
Keyword Research in 2016: Going Beyond Guesswork (Moz)
How to Do Keyword Research for SEO (Hubspot)
A Visual Guide to Keyword Targeting and On-Page SEO (Moz)
Tools
Google AdWords Keyword Planner (free, but limited usefulness)
Google Trends (free)
Moz Pro Keyword Explorer (paid / limited free usage)
11 Best free keyword research tools for SEO in 2016 (SEOstack blog)
SEMrush (paid)
61. You’re relaunching your site!
Launching a new site hurts in the short run…
If you change your URLs, your site disappears from engine DBs and must be
reindexed.
Don’t worry – your traffic will come back, but it can take… months.
Re-launching is an opportunity to improve your rankings by:
Migrating to https.
Using unique Title and Description tags.
Incorporating logical directory structure and navigational elements.
Having search-friendly URLs. (No numerical parameters!)
Providing lots of indexable text.
61
62. You’re relaunching your site! (cont’d)
Minimize the loss of traffic and rankings by
employing 301-type (permanent) redirects from
your old pages.
They tell the engines that a page has permanently moved.
“One-to-one” redirects are optimal, but not always possible
(practically speaking).
Google is working on lessening the importance
of using 301s, but it is still the best practice.
301 Redirects Rules Change: What You Need to Know
for SEO (Moz)
62
301-type redirects are the
way you tell the engines your
old site hasn’t died. (It’s also
an old highway in Maryland.)
63. New-ish stuff that matters
63
Tyler (10-weeks)
Mobile-friendly / responsive design is boosted in Google.
Page speed matters, but what matters more is having relevance
reduced for having a slow site.
People expect a page to load in about two secs.
Security - https is better than http.
There are new ways to improve the way your search results
appear.
Structured data - “Rich snippets.”
Schema.org metadata provides info SE’s need to understand
content, provide better results.
User reviews matter!
Improved CTR if your Google listing shows high-star reviews.
Social media content is more integrated into search results.
Localized results – Geo-targeting is pretty accurate.
64. New stuff that matters – AMP!
Google-backed, open-source initiative.
Accelerated Mobile Pages provide a MUCH faster mobile
experience!
Speed up the load time of mobile webpages using existing
technologies.
AMP for mobile search results gives the appearance of these
pages being prioritized…
Google says they are not boosted in search results. BUT...
Load time and page speed ARE ranking factors!
AMP Testing Tool in Google Search Console.
Testing tool blog post (Google)
Another blog post (SEO Roundtable)
64
Look for the symbol.
65. 65
“Off-Page” stuff that matters
More important:
LINKS (a.k.a. “backlinks”)!
‒ HIGH QUALITY external links back to your site, using keywords.
‒ Poor quality links can really hurt you!
‒ Moz free Open Site Explorer can help identify existing links and linking
opportunities.
Social shares.
Less important (but not irrelevant):
Blog appearances for domain.
Links in directories.
News releases.
Social presence (FB, Twitter, YouTube).
The Ultimate Guide to Off-Page SEO Bernard Landgraf
66. 66
Measuring SEO
Percent of visits referred from search
engines.
Manually tracked (or via API tool).
Shows your progress with engines in a
context-neutral way, independent of
ancillary traffic spikes.
Paid-search (orange) is boosting traffic, but
as the year progresses, organic share
(blue) is on the increase as well.
67. 67
Measuring SEO (cont’d)
Number of keywords referring traffic.
Manually teased out of the GA interface.
Navigate:
Acquisition
All Traffic
Channels
Organic Search
Primary dimension = Keyword
Then… look to the bottom-right of chart,
for “Show rows:”
1-10 of X,XXX
X,XXX (8,319) is your metric.
68. 68
Measuring SEO (cont’d)
Number of pages receiving at least one visit
from a search engine.
Manually teased out of the GA interface.
Navigate:
Acquisition
All Traffic
Channels
Organic Search
Primary dimension = Landing page
Then… look to the bottom-right of chart, for
“Show rows:”
1-10 of X,XXX
X,XXX (3,324) is your metric.
70. Search Console metrics Google Analytics metrics
70
Google Analytics Search Console
Linking with Google Search Console
is required.
Clicks / Impressions / CTR from
search engines
Number of landing pages referred
from search engines
Navigate:
Acquisition
Search Console
Landing Pages
Acquisition
• Impressions
• Clicks
• CTR
• Average position
• Sessions
Behavior
• Bounce Rate
• Pages / Session
Conversions
• Goal Completions
• Goal Value
• Goal Conversion Rate
71. 71
Social Media’s Role
Google stated there is no causation of high social metrics
and Google rank (2013).
I.e., authoritative “social signals" (Facebook likes, Twitter followers)
do not affect rank.
Do you believe that? Not sure I do.
Social media matters:
It encourages links to your content.
These links may influence rank by helping engines understand a
site’s credibility.
Bing: “We take into consideration how often a link has been
tweeted or retweeted, as well as the authority of the Twitter users
that shared the link.”
Social media profiles rank in search engines.
Google+ does influence search results, but its influence
is believed to be shrinking.
5 Things You Need to Know About
Social Media & SEO (kissmetrics)
72. OK, so what do I DO?!
Use your time for things you can control!
Improve your “old” site’s “on-page” findability:
Add unique Title and Meta-Description tags.
Delete the old “meta keywords” tag!
Improve your text content.
Add internal links using keywords.
Switch to https.
Reduce your site’s load time.
Off-page: try and get backlinks!
When someone is going to link to you, use keywords for the link – unless your
institutional name NEEDS the exposure.
Off-page: social content that stimulates shares, user reviews.
Register with “Google My Business”
Make sure your existing info is correct
72
Vampyre Fangs
73. OK, so then what do I do?!
If redesigning your site, go to the mat for:
Mobile-friendly (responsive) design.
Quick load-time and AMP compatibility.
Unique Title and Meta-description tags.
Search-friendly nav structure and URLs.
Text content! Sometimes sites are surprisingly devoid of this,
esp. if the design mantra was a “clean look.”
Work the analytics process, benchmark and measure!
73
Vampyre Fangs
74. Search Engine Marketing References
Search Engine Land
Search Engine Watch
Danny Sullivan (twitter)
Matt Cutts (twitter)
Moz (free/paid)
Woorank (free/paid SEO checker)
SEMrush (paid)
Bruce Clay
SEO Smarty - Ann Smarty
SEOBook - Aaron Wall (paid)
74
76. How to create a dashboard
MCN 201676
• Selection of metrics
• Type of dashboard: strategic, tactical or operational
• Data sources (Google Analytics, Facebook Insights, Twitter Analytics, Surveys…)
• Frequency of updates (real-time, last X days, monthly, weekly…)
• Update process, automation
• User interface, type of widgets (number, graph, text, embeds, feeds…)
92. A ‘real world’ example from @sosarasays
Question: “Is anybody using those resources my department created?”
92
93. 93
Behavior > Site Content > All Pages >
Search for the web directories in question, e.g., /resources/guides/
94. A ‘real world’ example from @sosarasays
Next question: “How might we increase the use of these specific resources?”
94
95. A ‘real world’ example from @sosarasays
Make a new custom segment!
Allows you to benchmark the sessions which included viewing at least one of the “guide”
pages.
Improve the data by working on:
Making the guides more visible in navigation
Getting more inbound links
Optimizing page metadata to help with search engine findability (SEO)
95
96. SEO and Museums
In our favor:
We have great content!
We (sometimes) have ultra-high domain authority!
We have some of the strongest brands in the world!
Brands matter on search engines
Many sites receive 40-60% of traffic from organic search.
Social media helps (but maybe not as much as we think).
Challenges:
Despite great content, many sites aren’t optimized.
Some have technical issues such as “duplicate content.”
Some are too small / unlinked, to break through.
96
Drew Bowie
97. SO MUCH going on, on a ‘SERP’ these days!
(With a little help from the moz.com Google Glossary)
97
Paid Search
(PPC) ads
Twitter results
Organic
search result
with “mini-
sitelinks”
“Google My
Business”
(formerly
Google
Places)
“Knowledge
Panel” – MANY
things can show
here – team
rosters, “popular
times,” etc.
Social
Networks
Recommendations
(“People also search
for…”)
98. Old-School Website SEO Still Matters
Good quality “backlinks” (keywords)
Body content – keywords, semantically-related words
Page Title Tags and Meta Description tags
URLs, site architecture, page structure
Internal “anchor” links using keywords
Titles, headlines (H1) and sub-heads (H2)
Images with ALT and TITLE tags.
“301 Redirects” still matter, but not as much as before (source).
Misc. content emphasis attributes (bold, italics, underline, etc.).
The Beginner’s Guide to SEO (Moz)
98
New Orleans Public Library
99. Exercise: write a title tag
Length is important (if you want the tag the display properly)!
Short! ~55 characters! (source)
Best case: individual tags for each page.
Write a headline in 55 characters or less (including spaces) that:
Imparts an accurate expectation of what the page is about.
Will serve as a clear, clickable headline for your search result.
Steps:
1. Open a browser and a text editor.
2. Make a 55-character ‘character counter’ in a monospaced (Courier) font:
3. Pick a page and choose ‘View Source’
4. Find <TITLE> (or <title>)
5. Copy your current Title Tag, paste it into a text file under the character counter
6. Edit / write a new tag!
99
+++++++++++++++++++++++++++++++++++++++++++++++++++++++ (55 characters)
V&A · The world's leading museum of art and design
Home | Cooper Hewitt, Smithsonian Design Museum
Projects | National Air and Space Museum
100. Exercise: write a meta-description tag
Meta Description tag helps improve click-through.
Needs to be customized and short.
Describe what the page is about in 120 characters or less.
If for your homepage, describe the site.
BTW, 120 characters is very conservative! Moz says between 150 and 160 characters is ok.
I Can't Drive 155: Meta Descriptions in 2015 - Moz
Steps:
1. Pick a page and choose ‘View Source’
2. Find meta name="description"
3. Make a 120-character character counter in Courier font
4. Copy your current description tag, paste it into a text file under the character counter
5. Edit / write a new tag!
100
++++++++++++++++++++++++++++++++++++++++++++++++++++++++++++++++++++++++++++++++++++++++++++++++++++++++++++++++++++++++ (120 chars.)
Museum of the decorative arts founded in 1852 to support and encourage excellence in art and design. Located in London, England.
(8 extra chars.)
101. 101
Google’s ‘divided we stand’ strategy
Currently, Google has a single search index.
By 2018 (est.) Google will divide its index,
giving mobile users better, fresher content
(SMX Advanced – 6/13/17).
The separate mobile search index will become
the primary, more frequently updated one.
Google’s Gary Illyes says they will
“communicate a lot” before rolling out the
mobile-first index.
“Don’t freak out.”
mobile searchers
everyone else!
A mobile-optimized site is no longer a luxury!
102. Hummingbirds, Pandas, Penguins – what?!
Hummingbird – Google’s algorithm changes OFTEN -
weekly.
Panda (2011/2015) – Boosted high-quality sites and
demoted lower quality (spammy) sites.
Penguin (2012/2016) – Penalized sites that use
“unnatural” backlinks.
Moz blogs to help you plunder the Google-Algo depths:
Google Algorithm Change History
Penguin 4.0: Was It Worth the Wait?
Google Algorithm Cheat Sheet
102
103. Discredited Practices
On-page:
Keyword stuffing
Meta keyword tag
Spammy comments
Off-page:
Paid links
Poor-quality links
Content farms
Guest blogging
Exact match domains:
“cheap-airline-tickets.com”
SEO “gateway” pages
Flash (doesn’t get indexed)
Google Penalties are usually applied by algorithm
103
Behaving badly means real penalties!
104. How are SE’s getting better and better?
Machine-learning / artificial intelligence.
Microsoft Bing’s RankNet was first (2005).
Google’s RankBrain algorithm (2015).
RankBrain:
Used to process search results and rank web pages.
The third most important part of Google’s so-called Hummingbird
ranking algorithm!
Google: RankBrain (Search Engine Land)
FAQ: All About The New Google RankBrain Algorithm (Search Engine
Land)
How Machine Learning Works (Martech)
Machine Learning: Making Sense of a Messy World (Google)
104
HAL 9000
105. 105
Structured Data
Schema.org metadata provides info SE’s
need to understand content, provide better
results.
Tells the engines what your data means,
not just what it says.
Moz rates schema.org tags as a low-
influence ranking factor, but…
Meta tags improve CTR in search results
by displaying enhanced content.
Authorship
"In-depth articles" feature (Article markup)
Other “Rich Snippets”
106. 106
Structured Data (cont’d)
Structured data can be used to mark up:
Creative work
Event
Organization
Person
Place
Product
Recipes
Structured data may help:
Enhance CTR from search engine results.
Search engines understand your content.
Your content to appear in specialized search results
like “in-depth Articles.”
Google Structured Data Testing Tool
Museum content can be relevant to “in-depth articles”
107. 107
Open Graph meta tags are essential
Open Graph (OG) tags (2010) promote
integration between social sites and your
website.
Allows you to control how site content
appears in social media posts.
OG tags can significantly affect click-
through rates and conversions from
social sites.
The Open Graph Protocol
What You Need to Know About Open Graph Meta Tags
for Total Facebook and Twitter Mastery (kissmetrics)
og:title
og:description
109. Demographics and Interests Reports
Demographics
Age (traffic by age ranges)
Gender (traffic by gender)
Interests – behavior by
Affinity Categories
In-Market Categories
Other Categories
No PII is tracked!
You have to turn the reports on in the U-I, and add a
line of code to your pages.
https://support.google.com/analytics/answer/2819948?hl=en
https://support.google.com/analytics/answer/2444872#trackingcode
You have to modify your privacy policy.
https://support.google.com/analytics/answer/2799357
109
110. Benchmarking Reports!
Compare your site to others in the same category (or
across categories).
Compare by:
Channels (traffic sources)
Location
Devices
How to find the Libraries and Museums category:
Search box, or:
Audience Benchmarking
Use top left pull-down; click ‘Reference’
Scroll down to ‘Libraries & Museums’
Benchmarking Reports (Google)
110
111. 111
Mobile automated insights
GA mobile app only.
Looks at your data, automatically
analyzes it.
Suggests insights and actions!
Other cool features too, such as the
‘Users by time of day’ heat map.
Google blog (9/2/16)
Google Analytics App now offers Google Now-like
automated insights (MarketingLand)
Google Analytics can now summarize your data
with automated insights (TechCrunch)