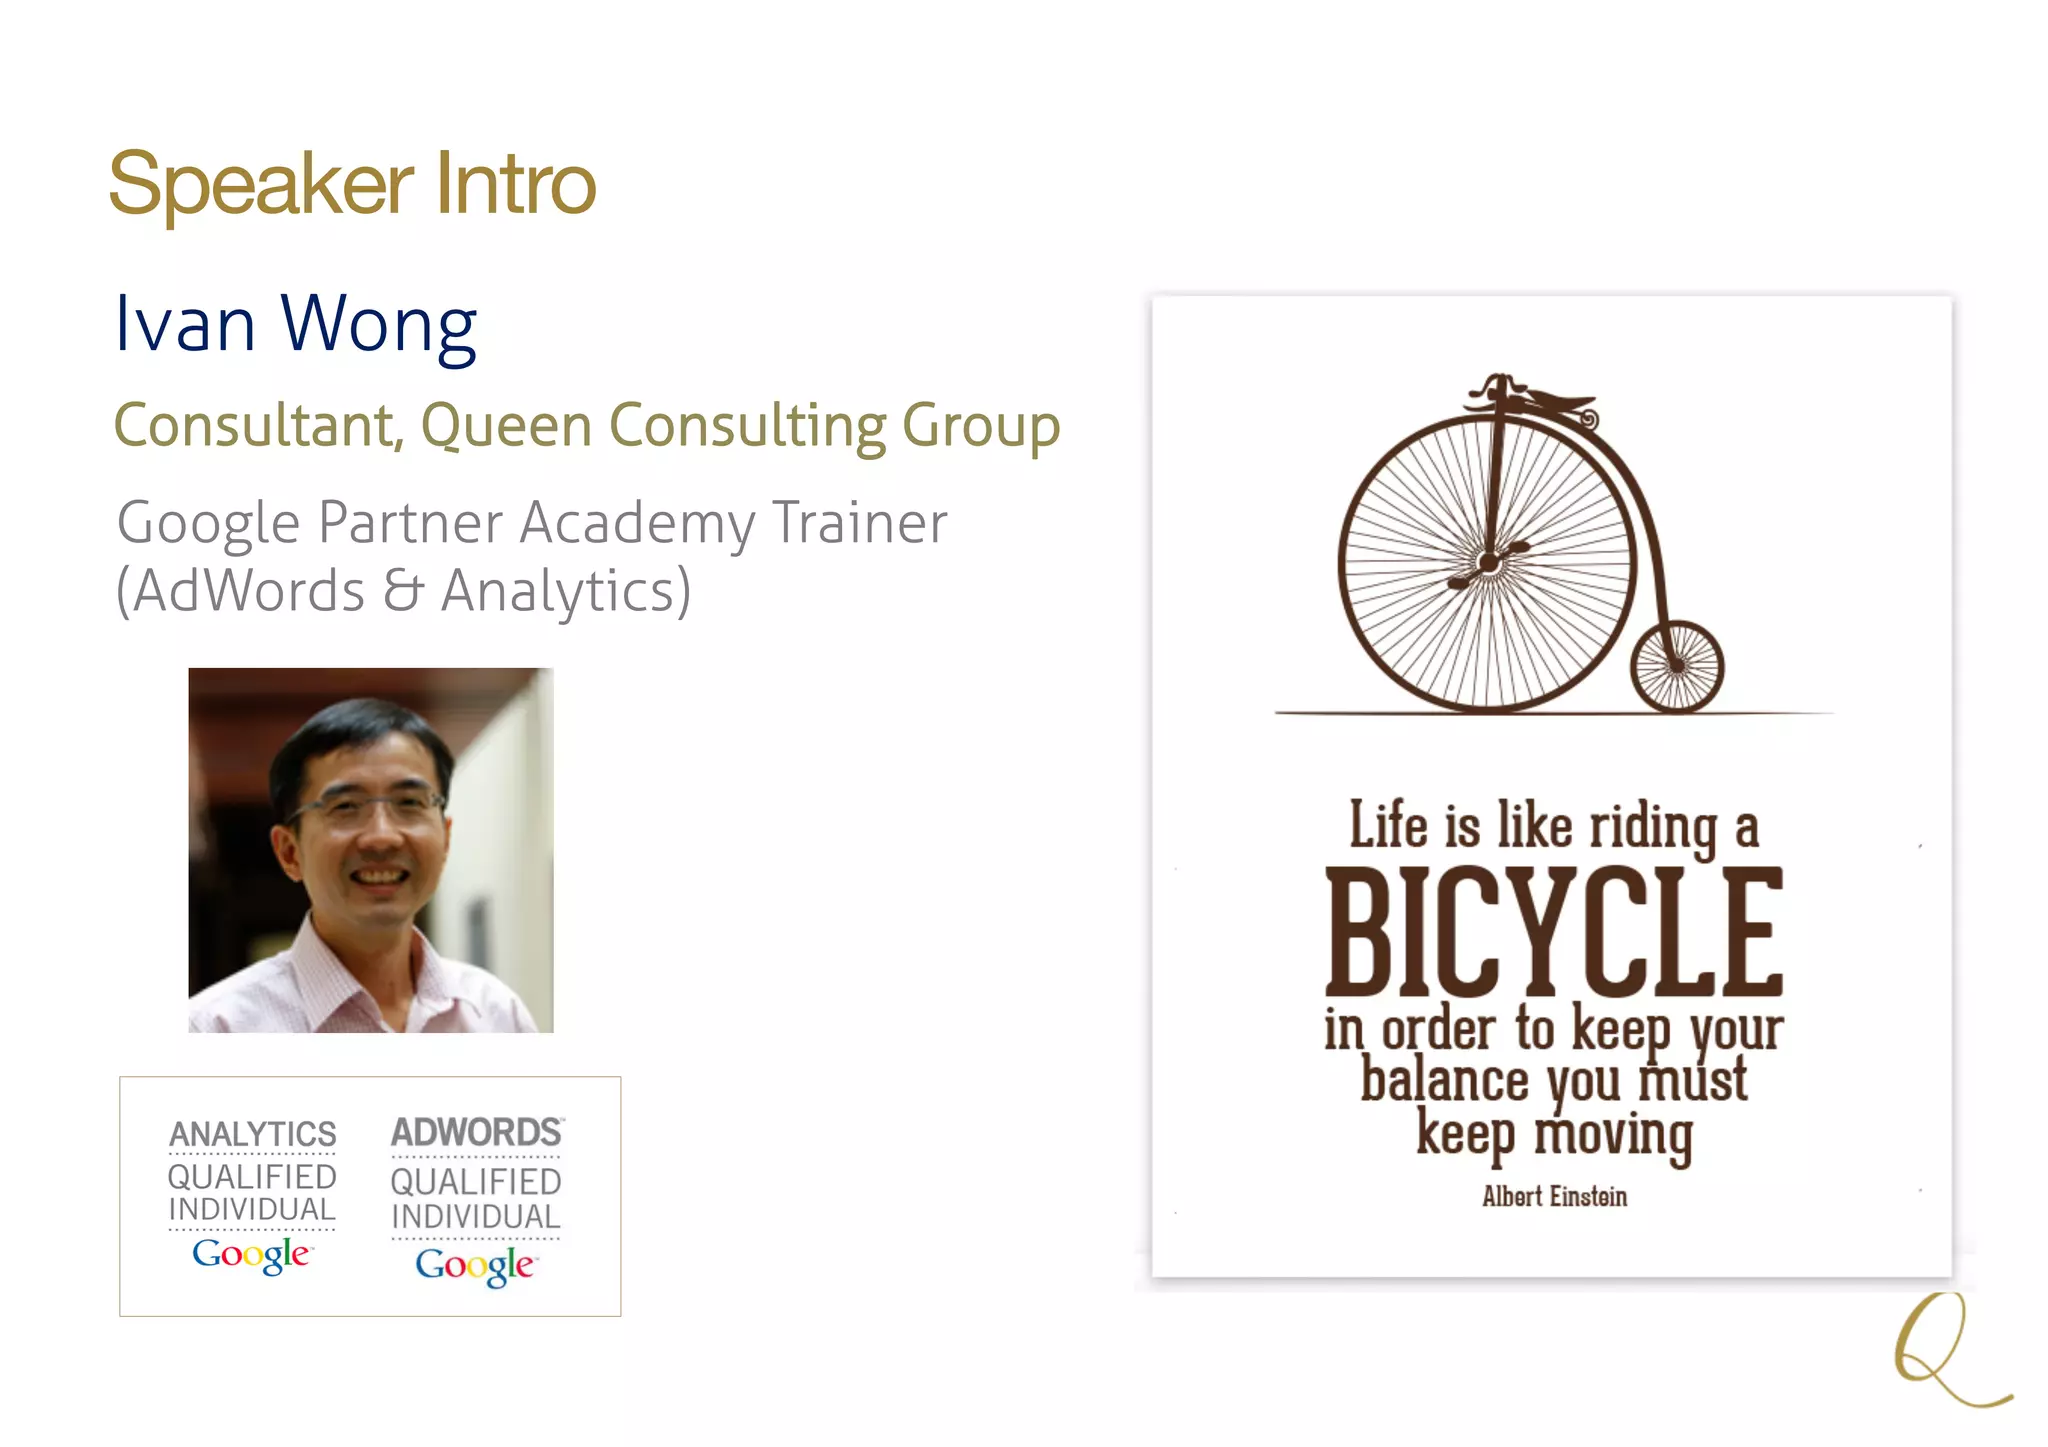
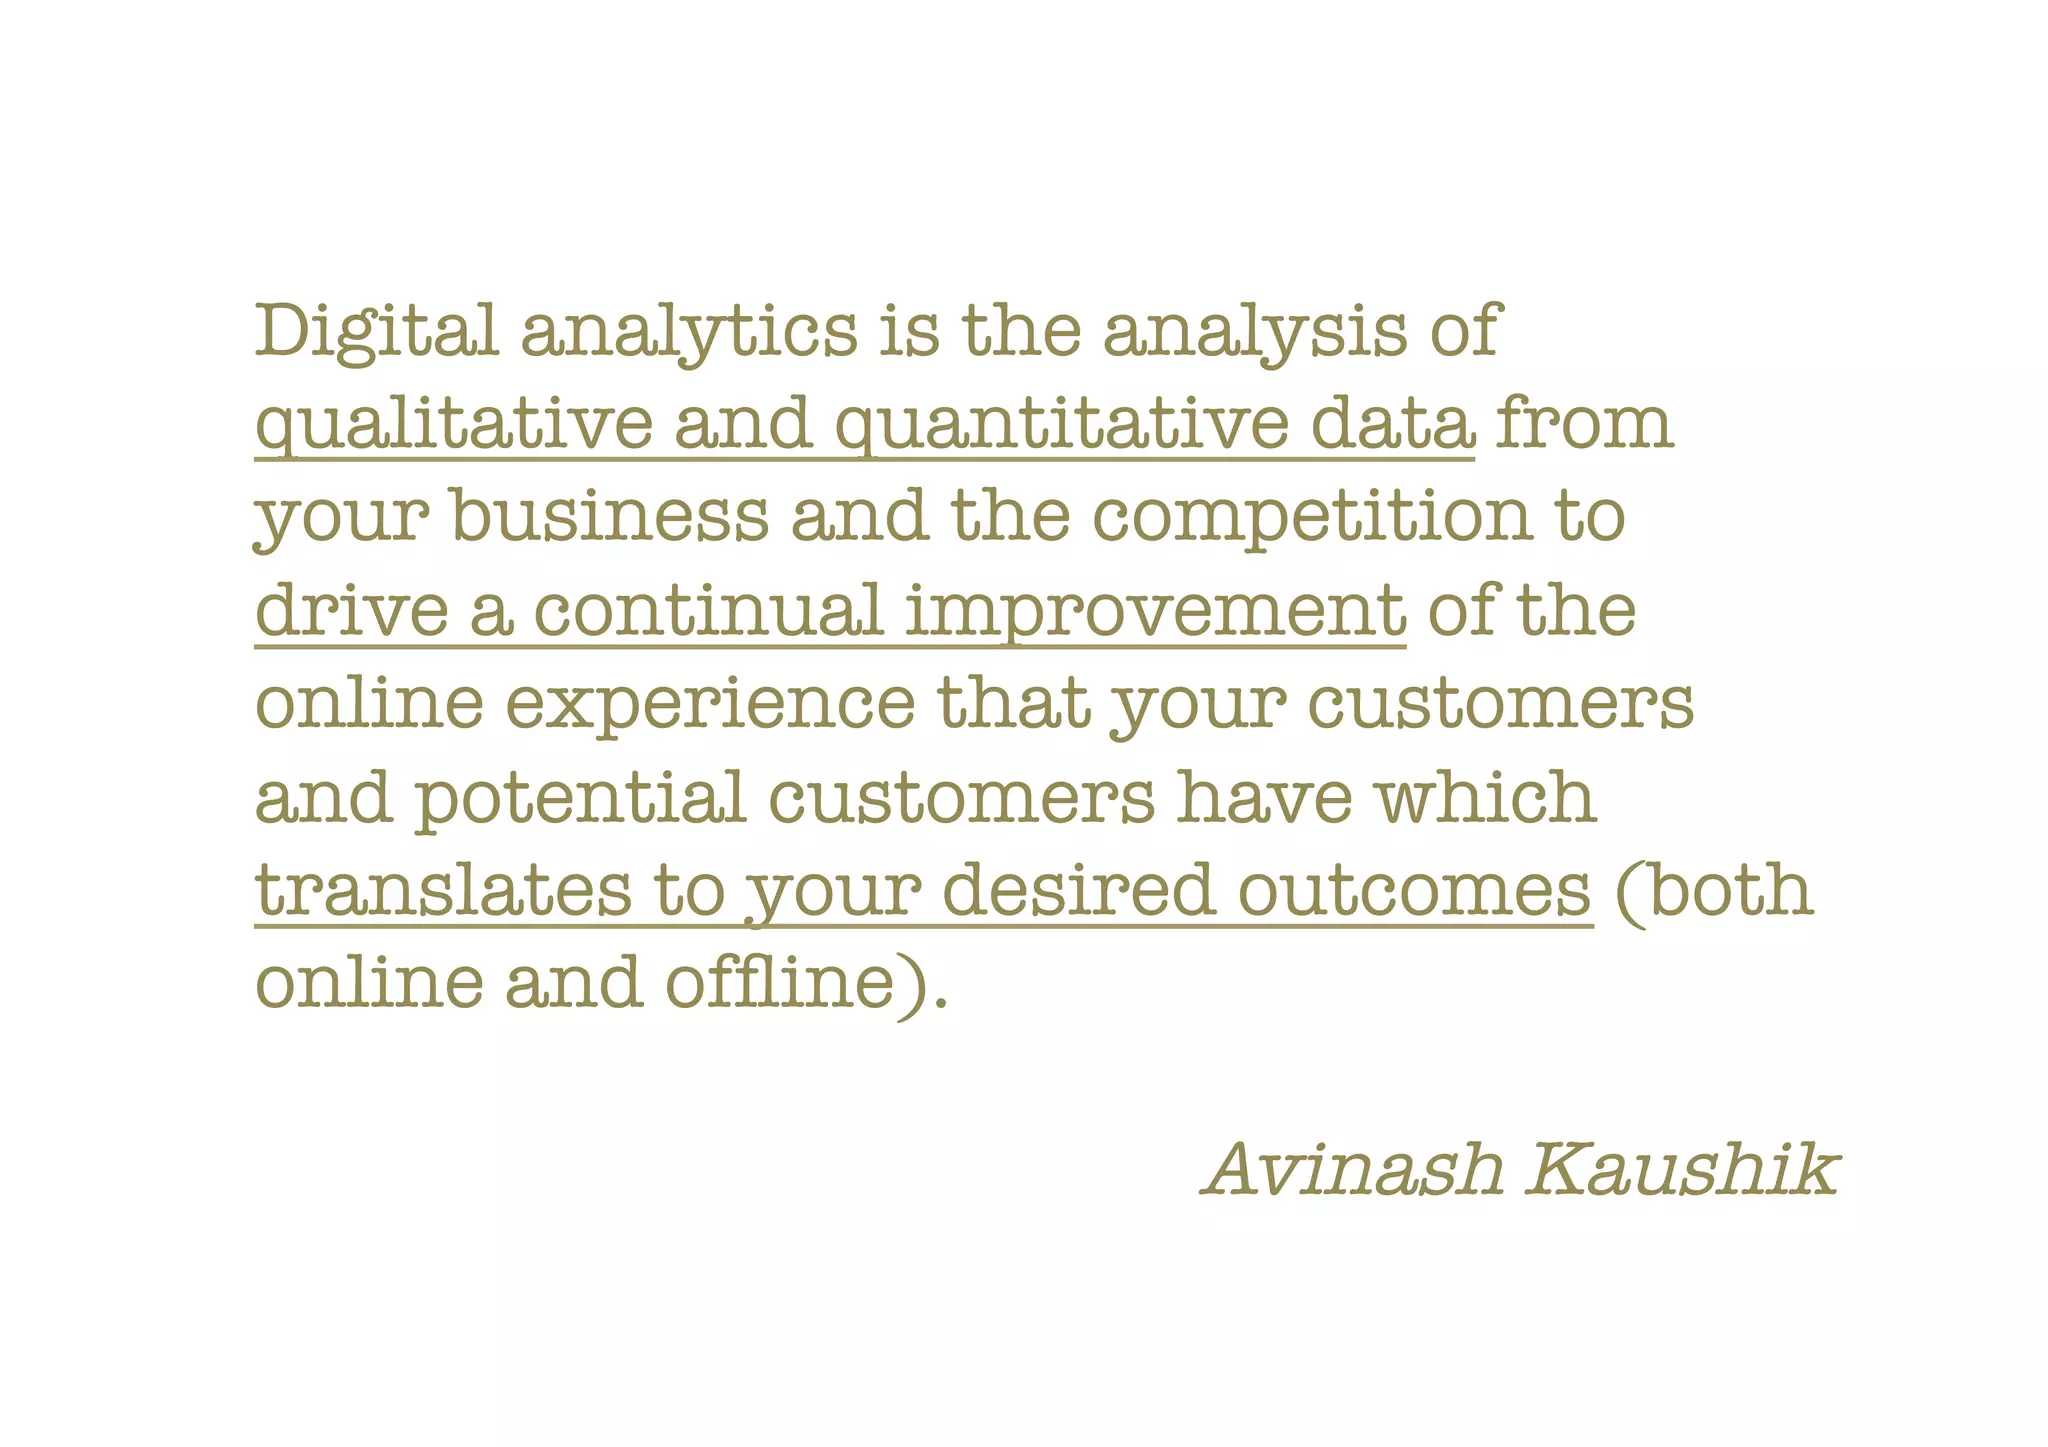
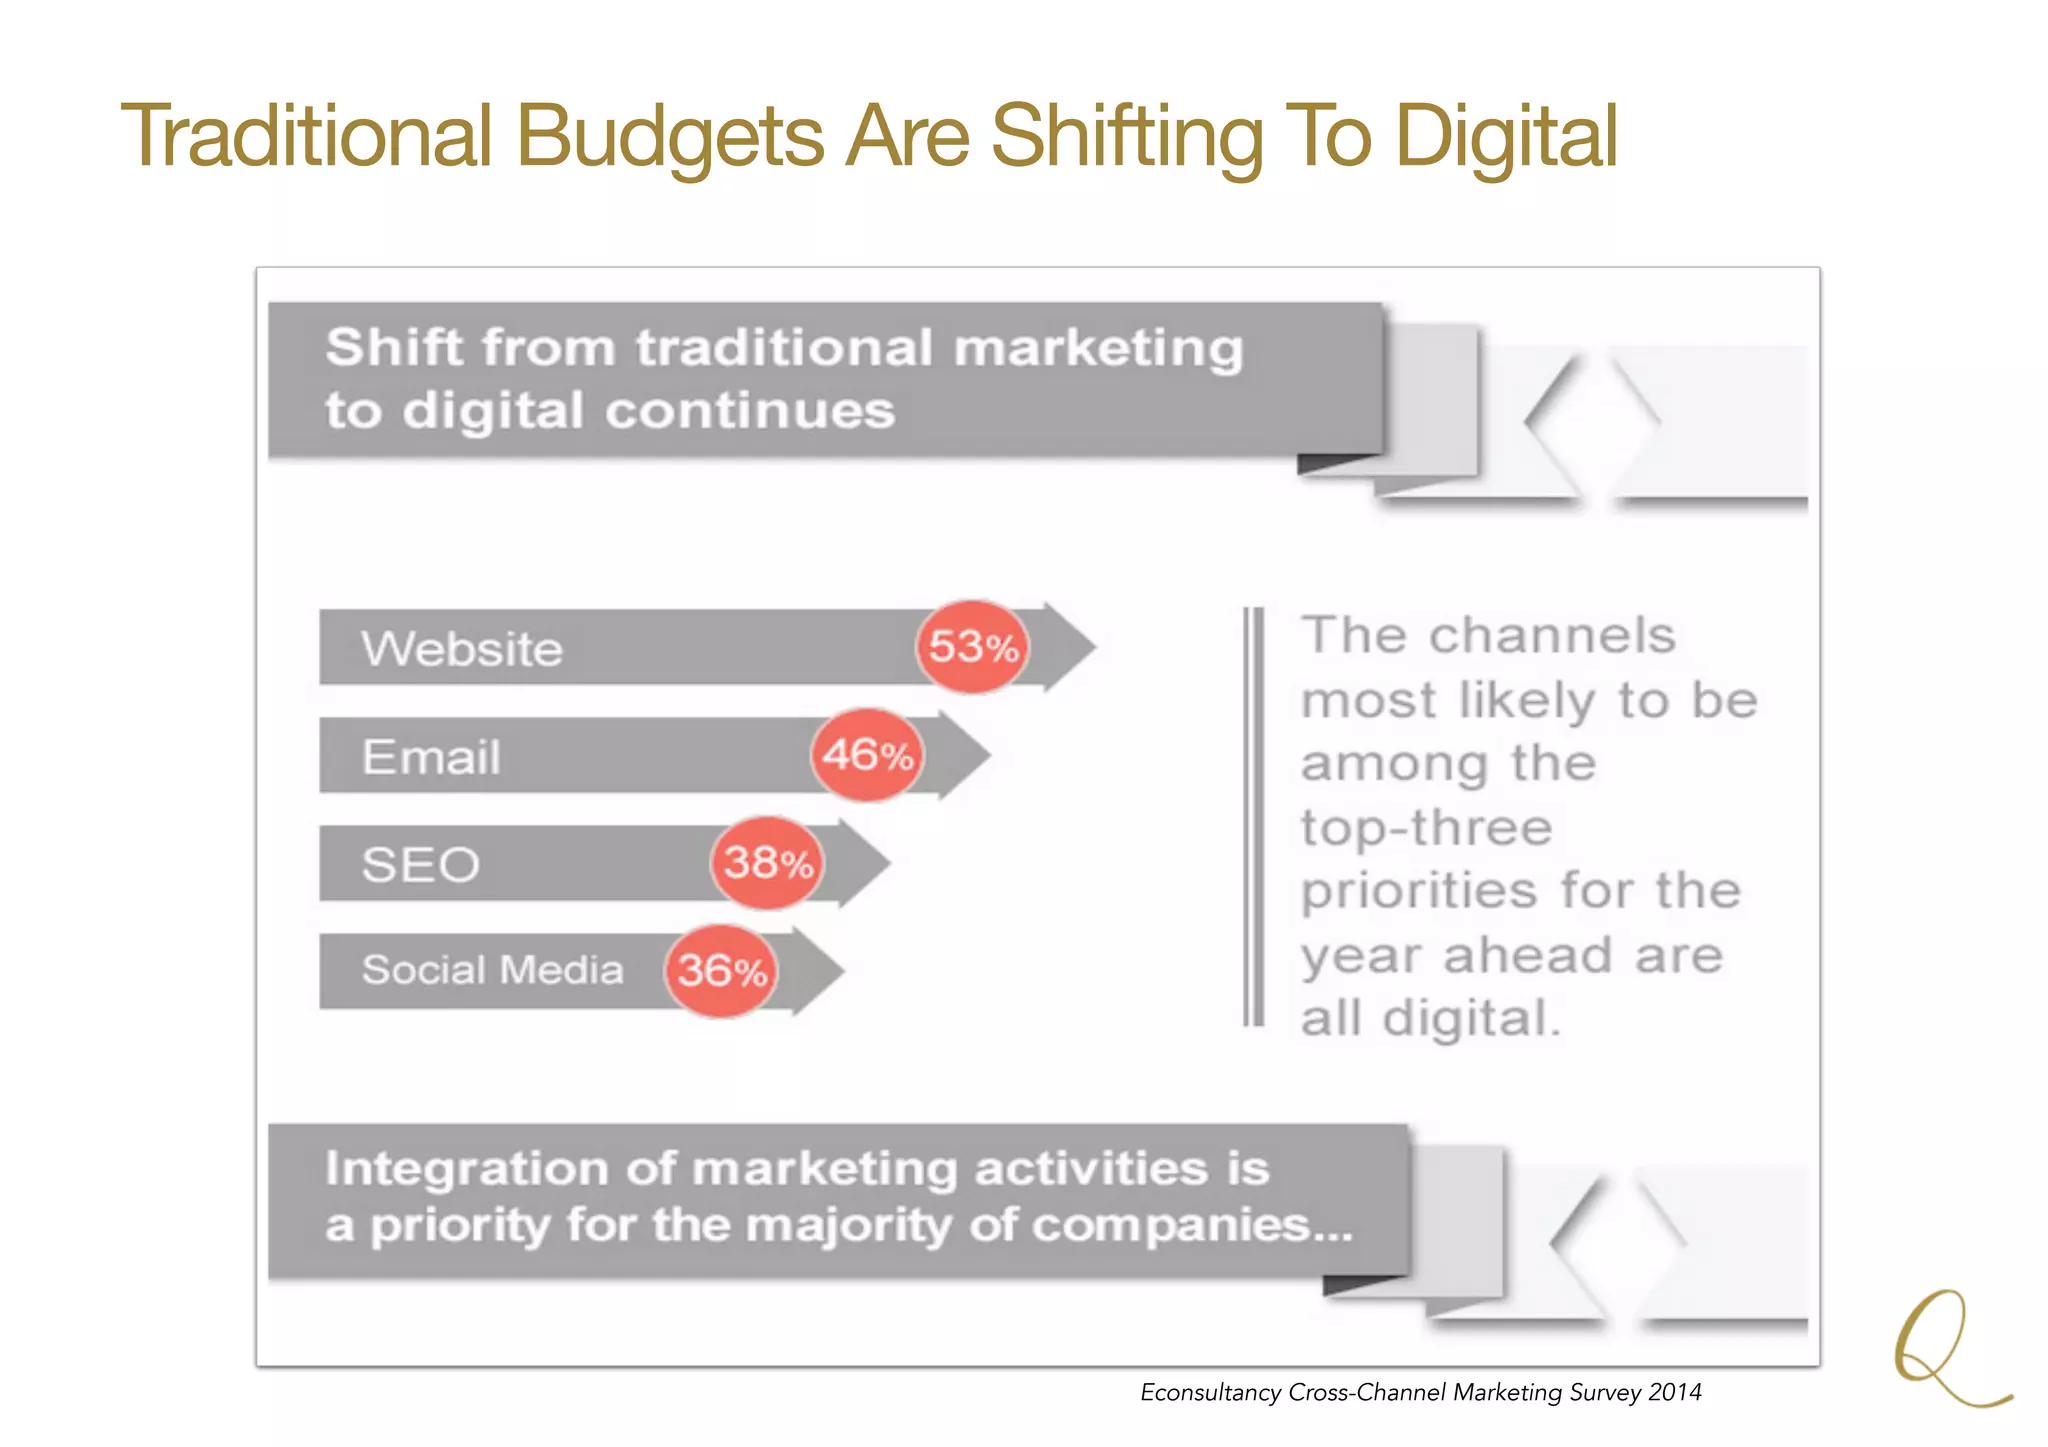
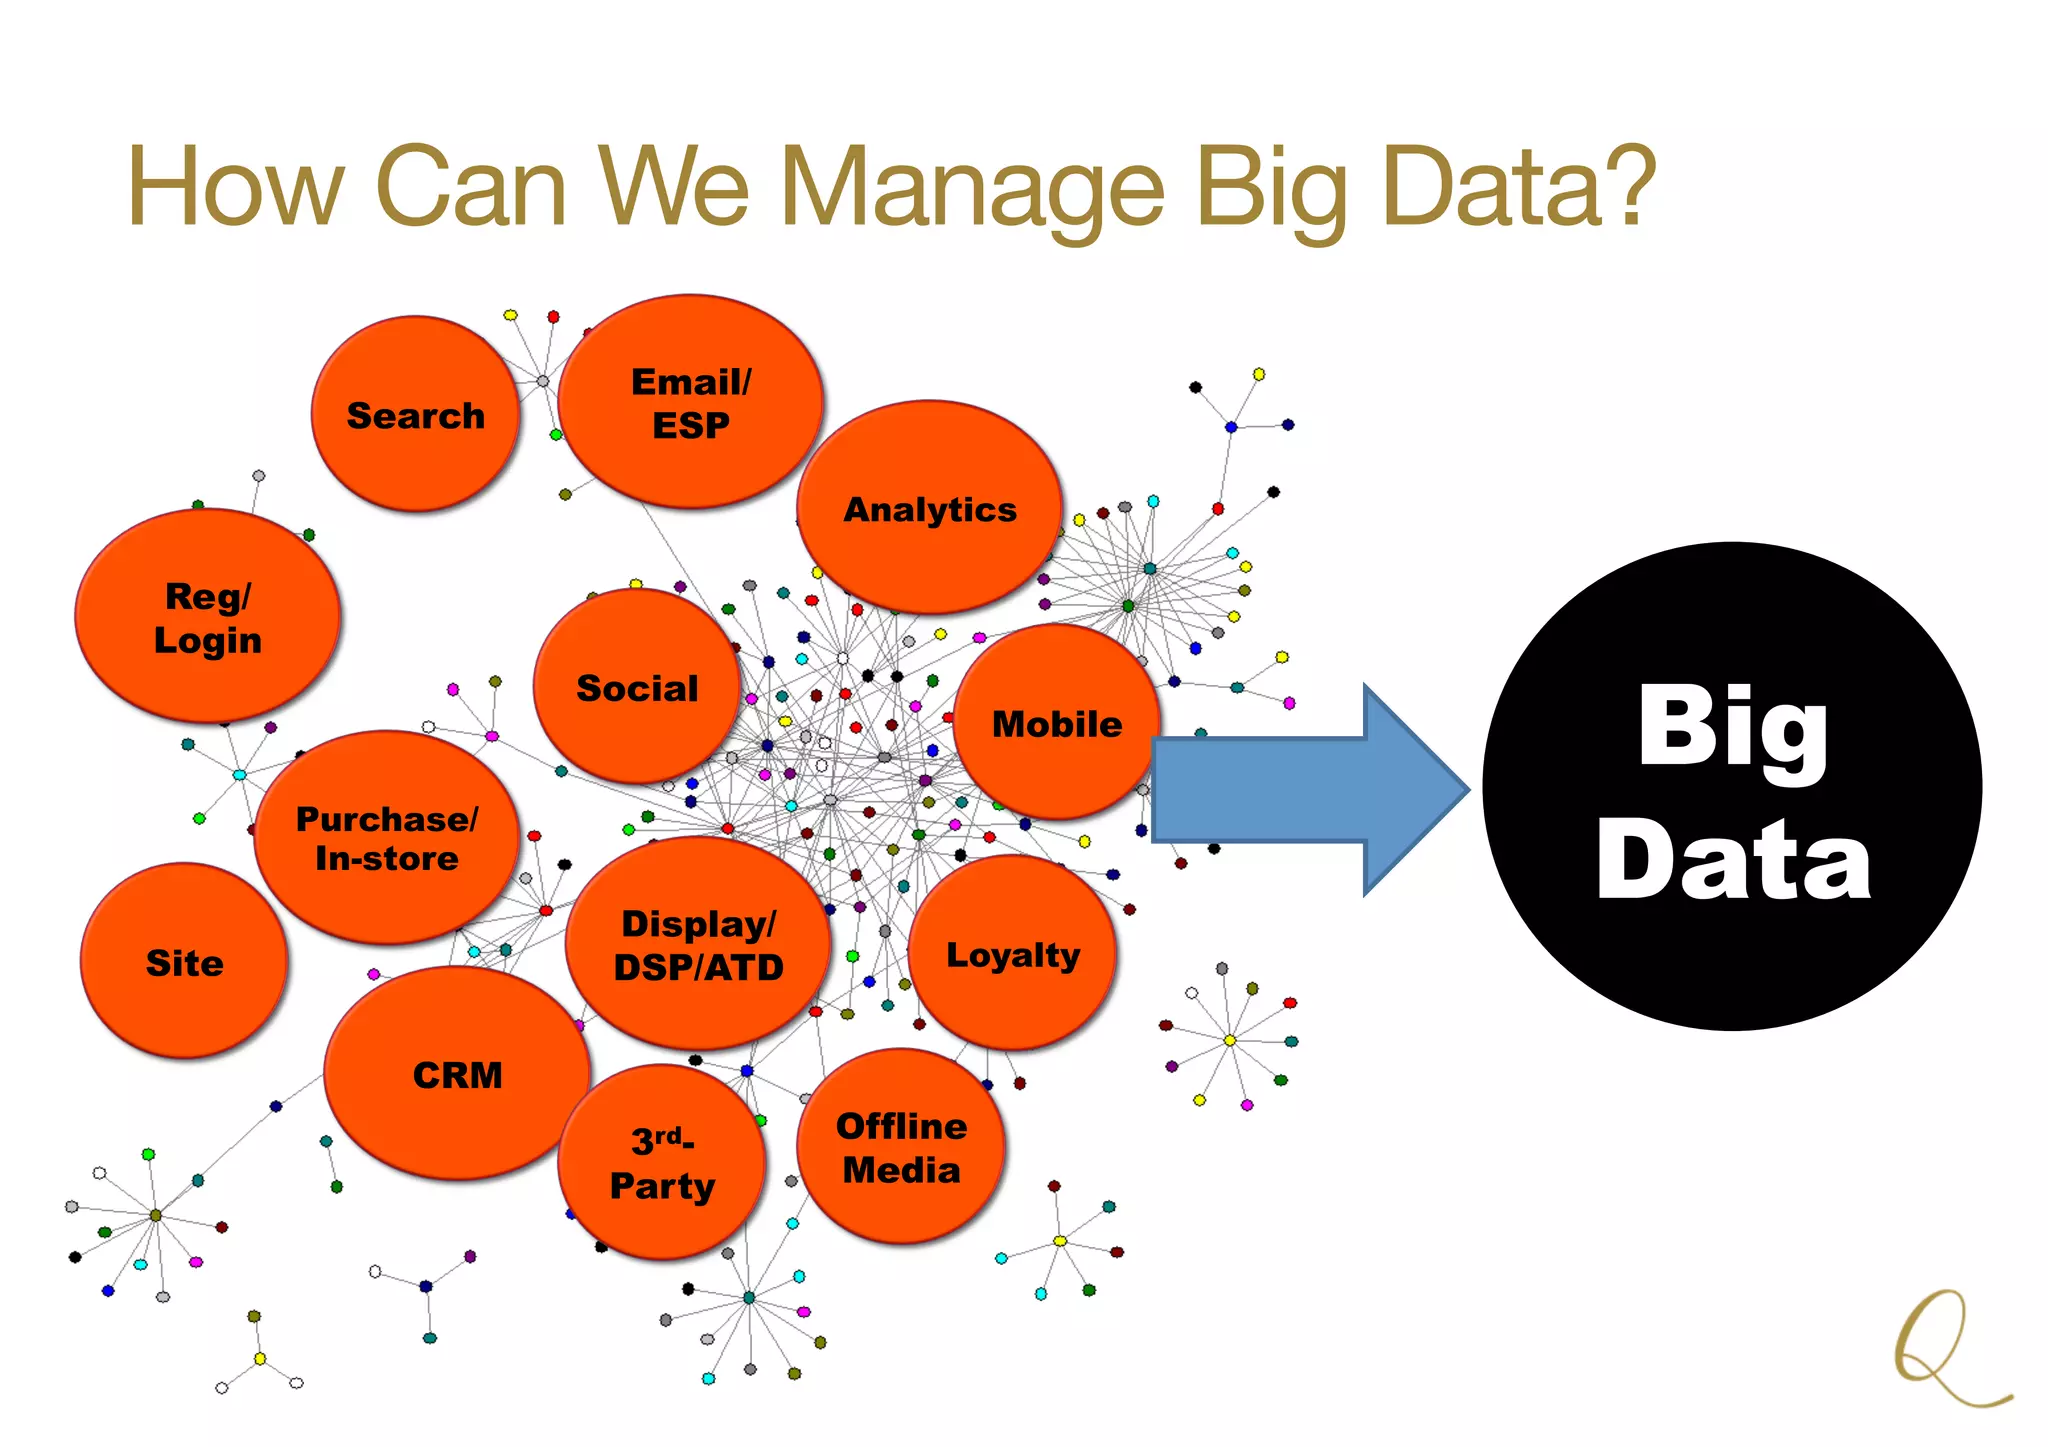
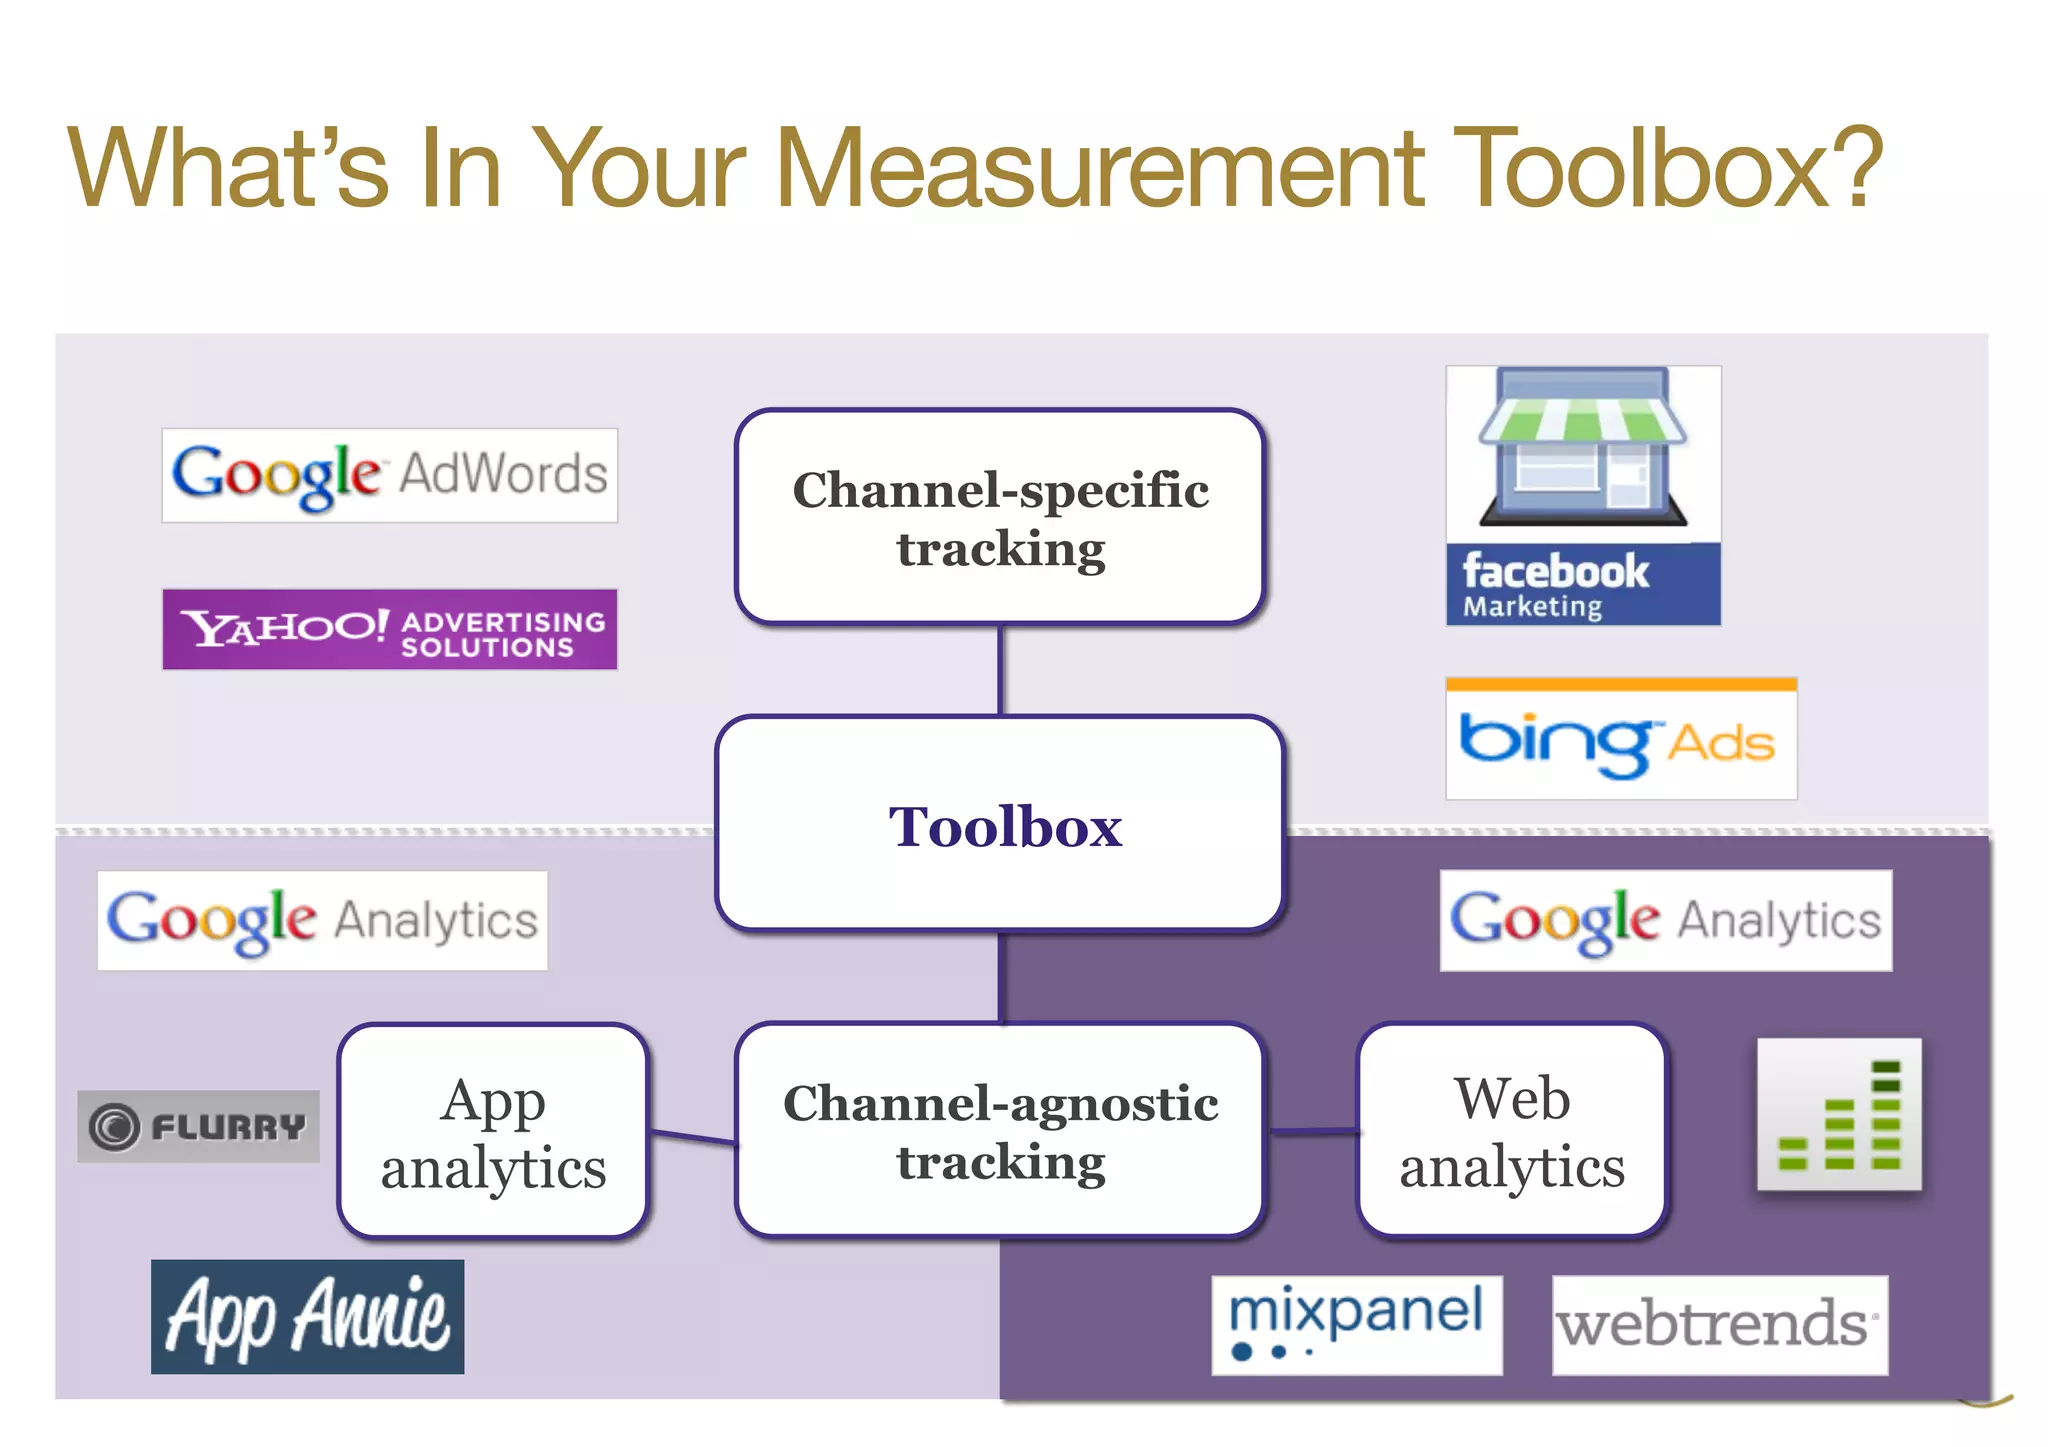
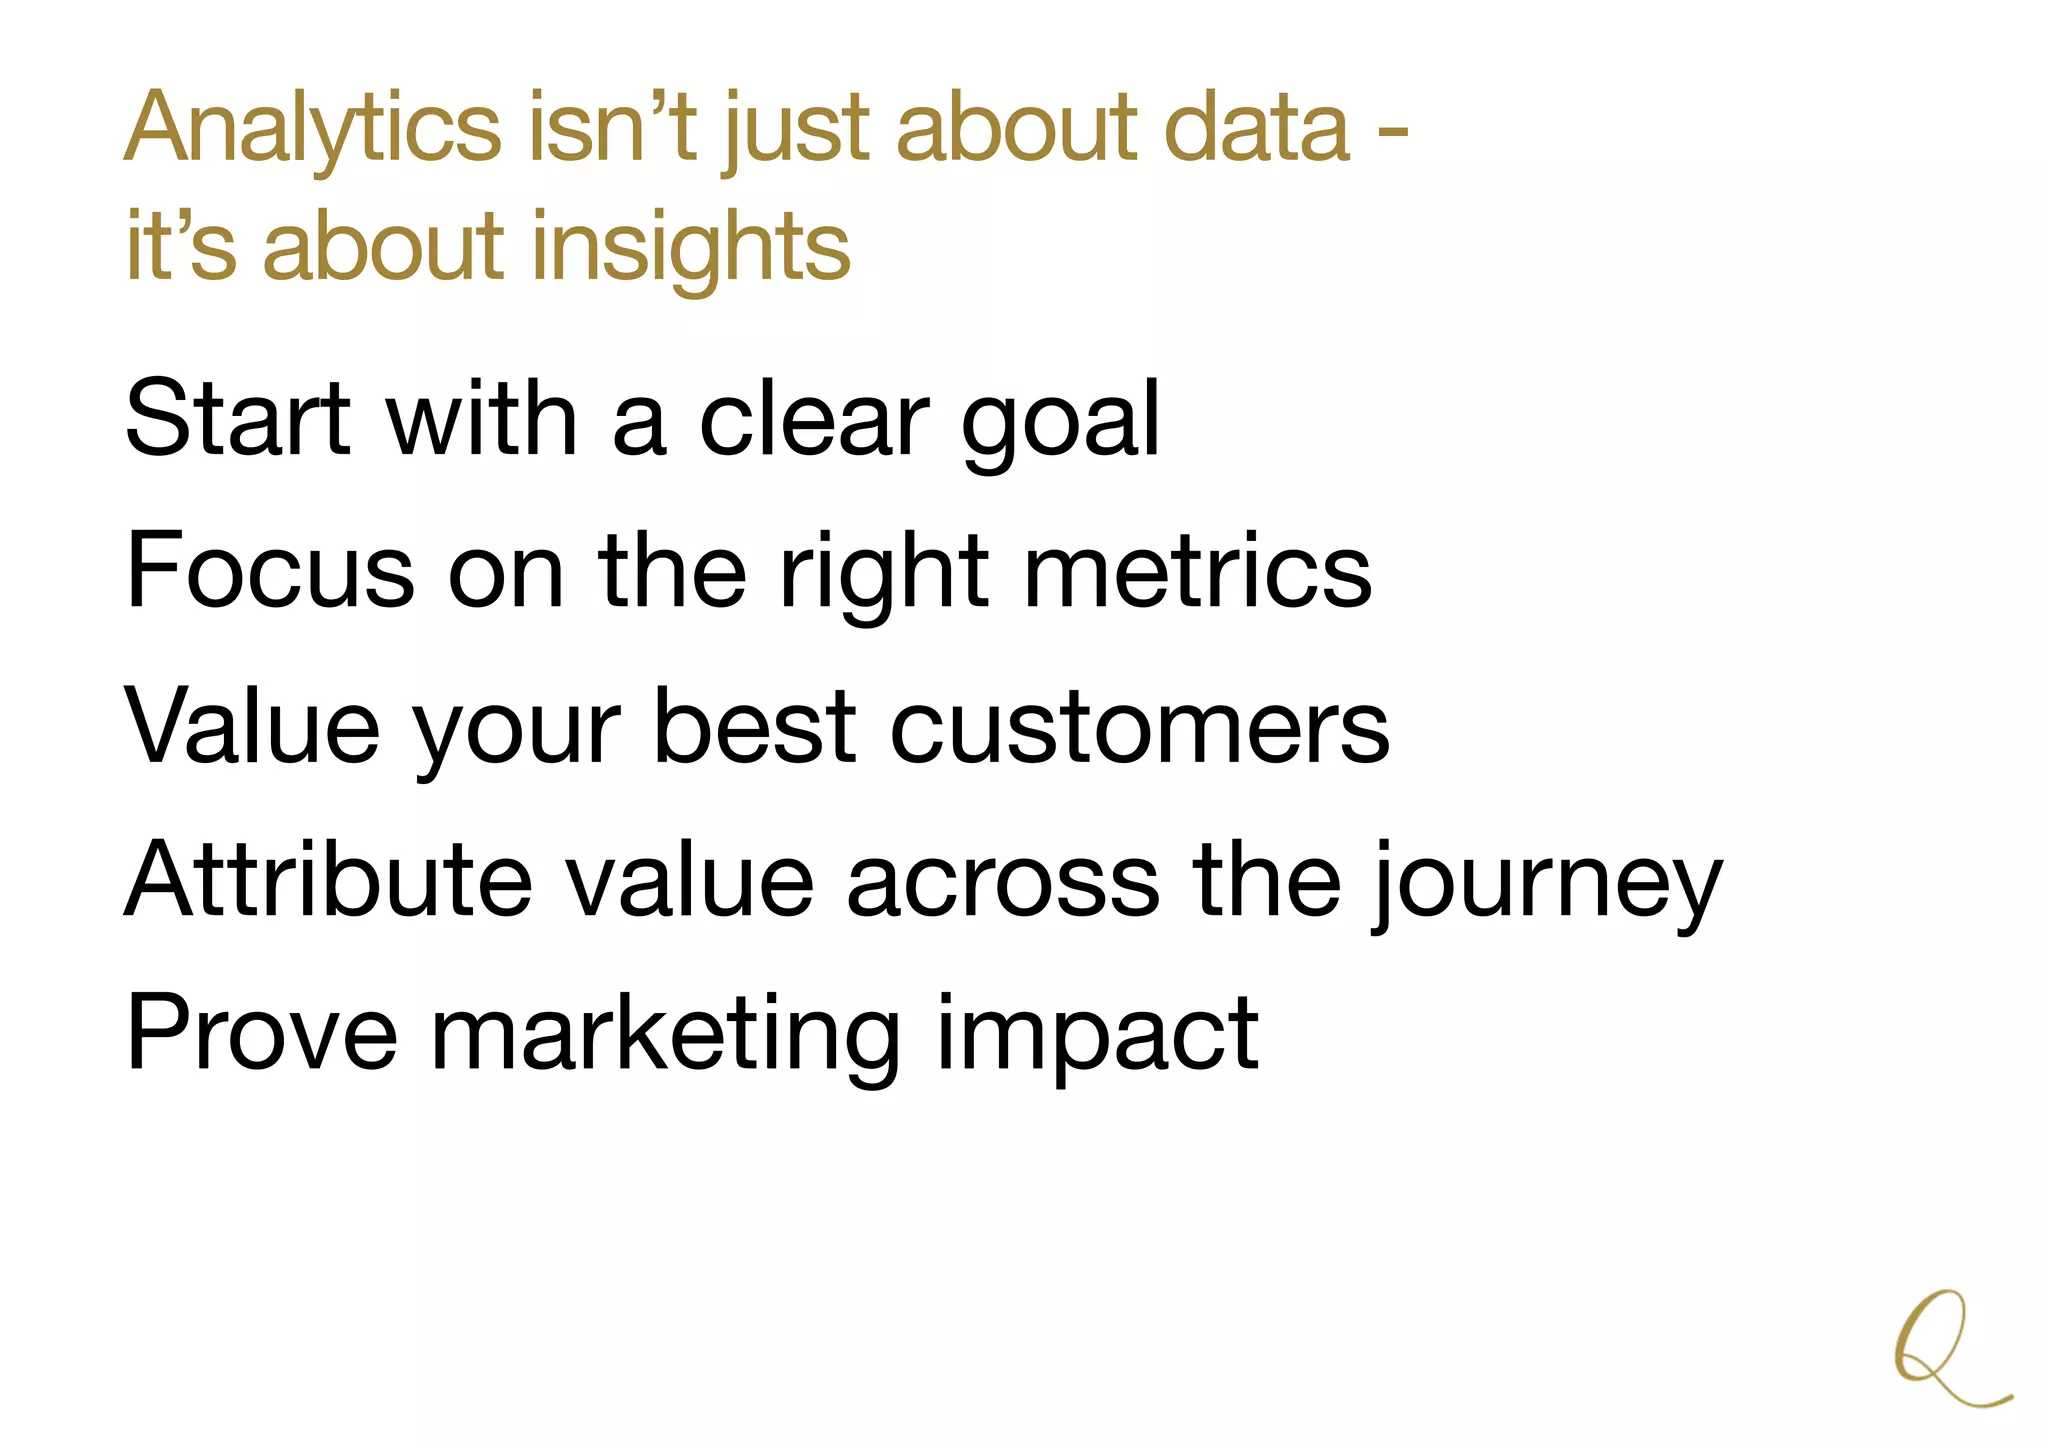
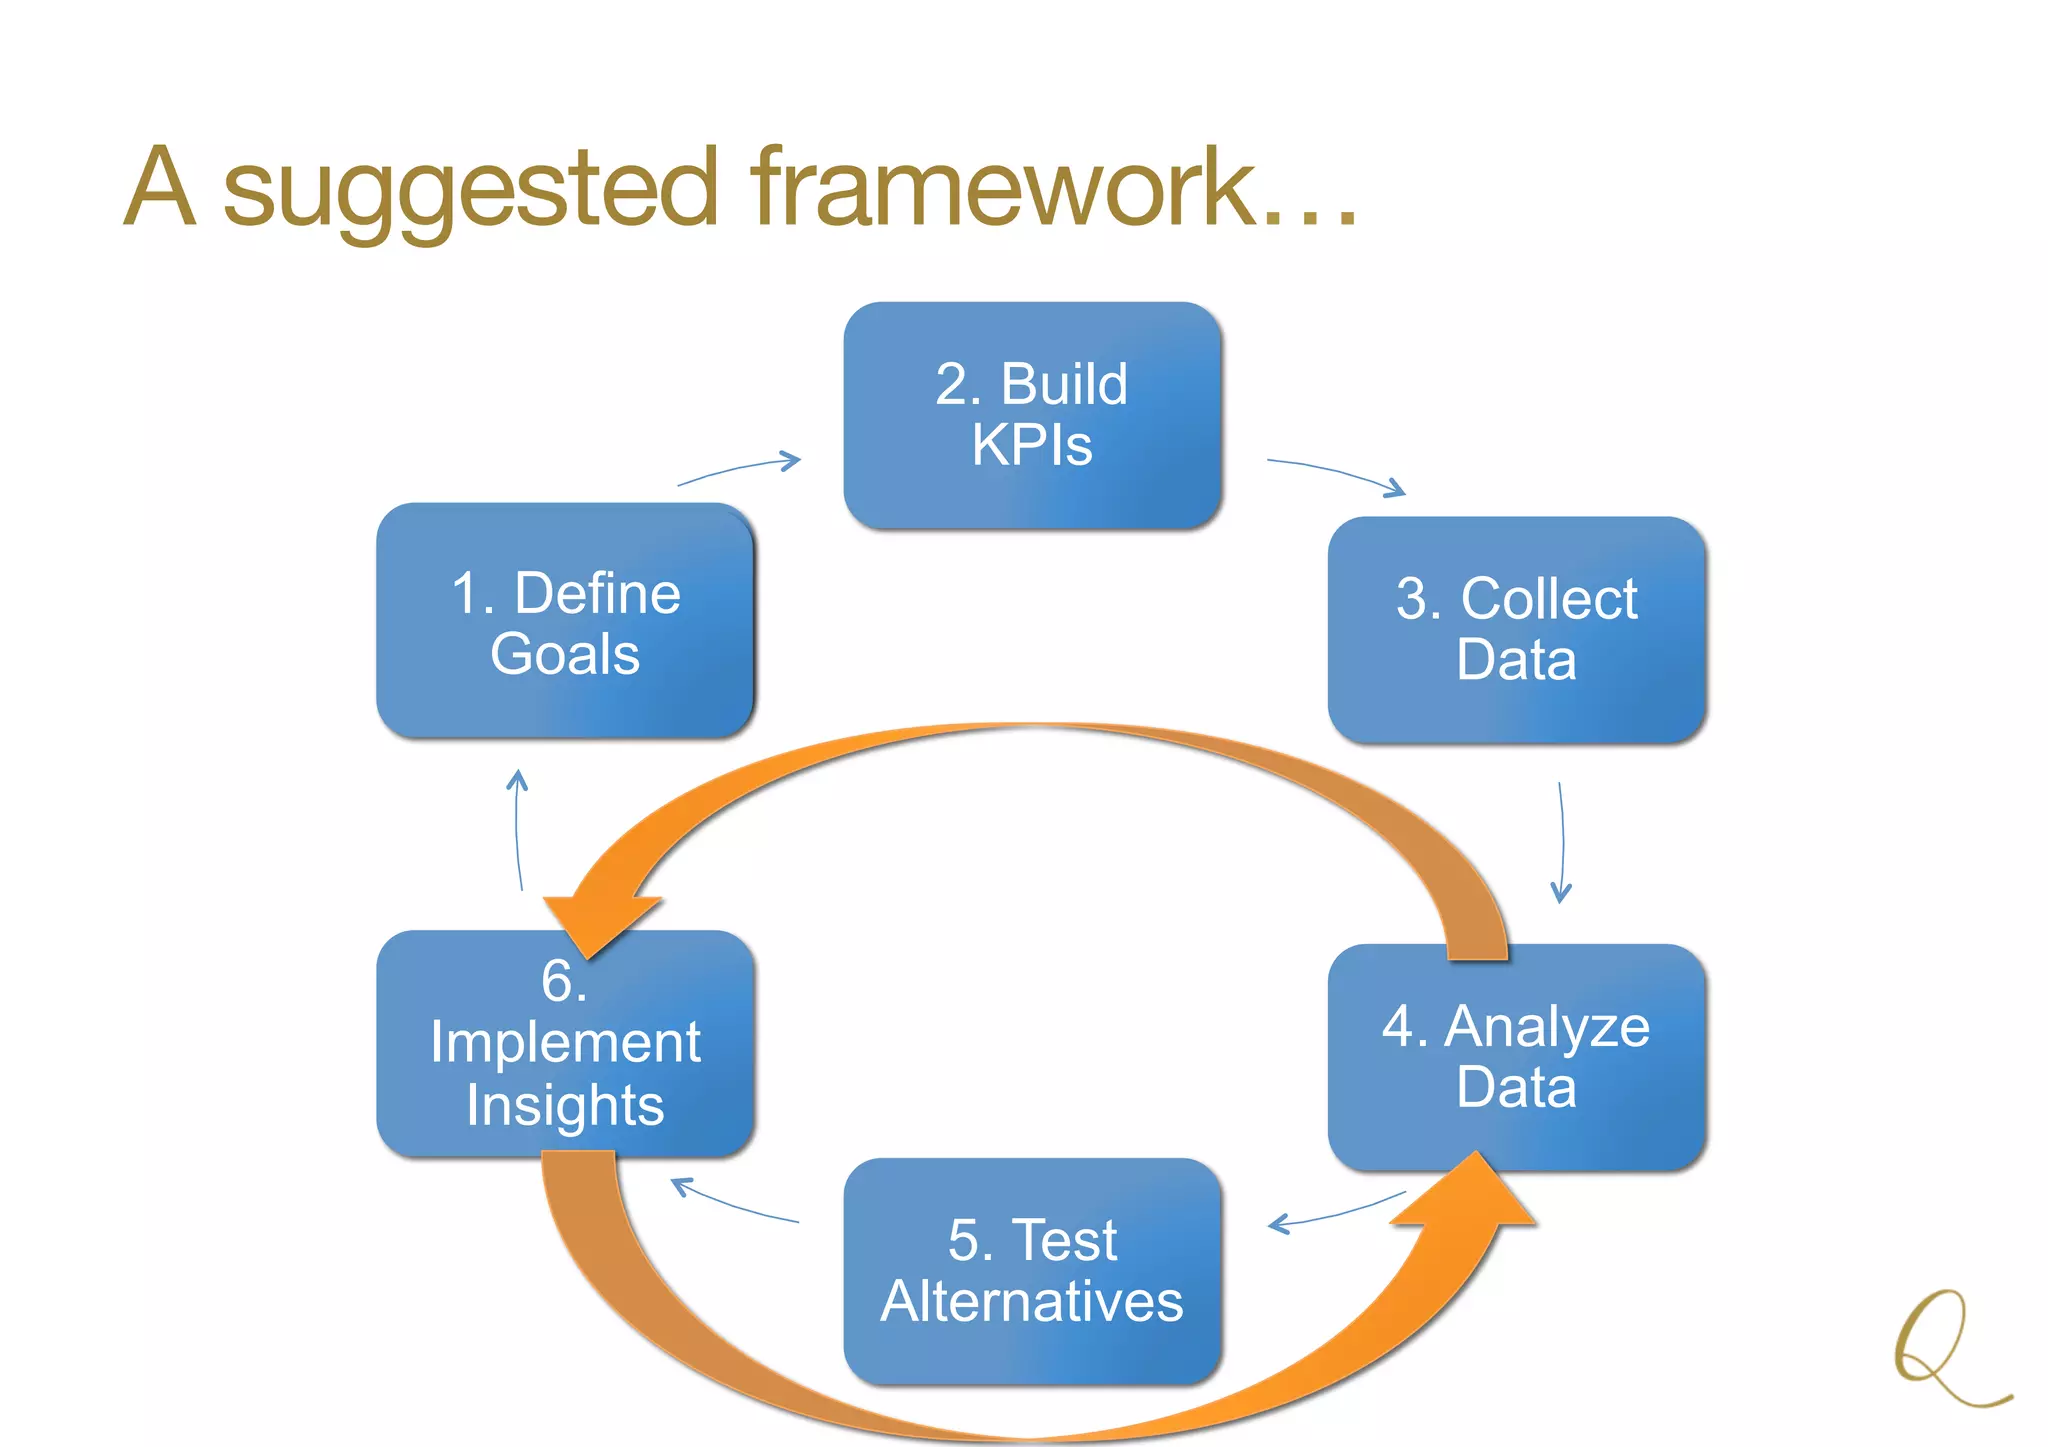
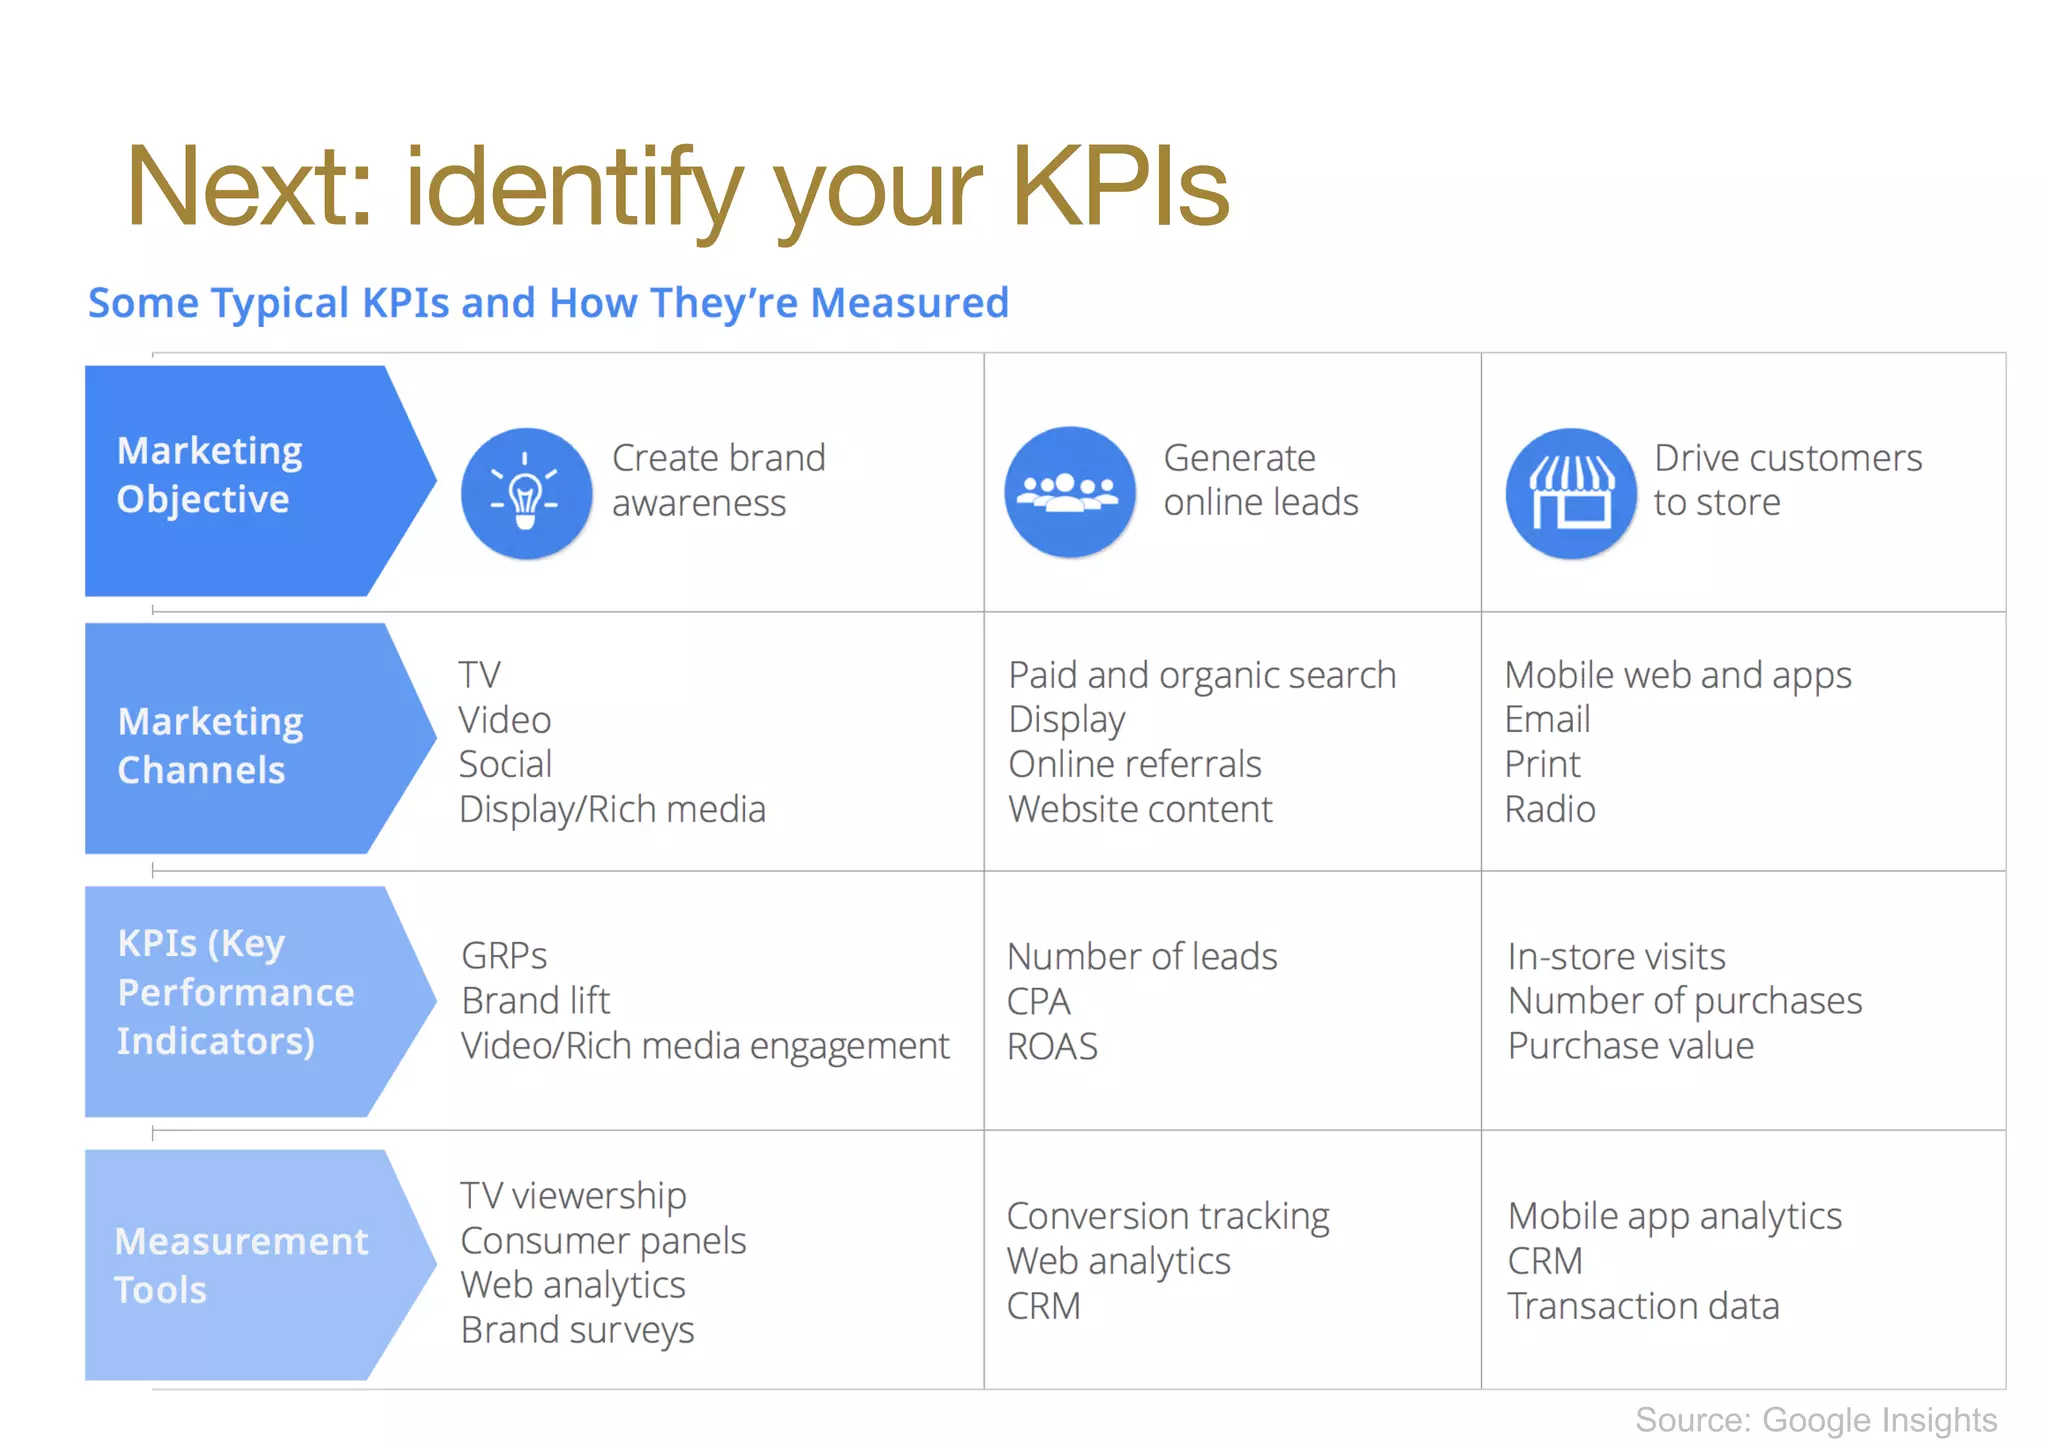
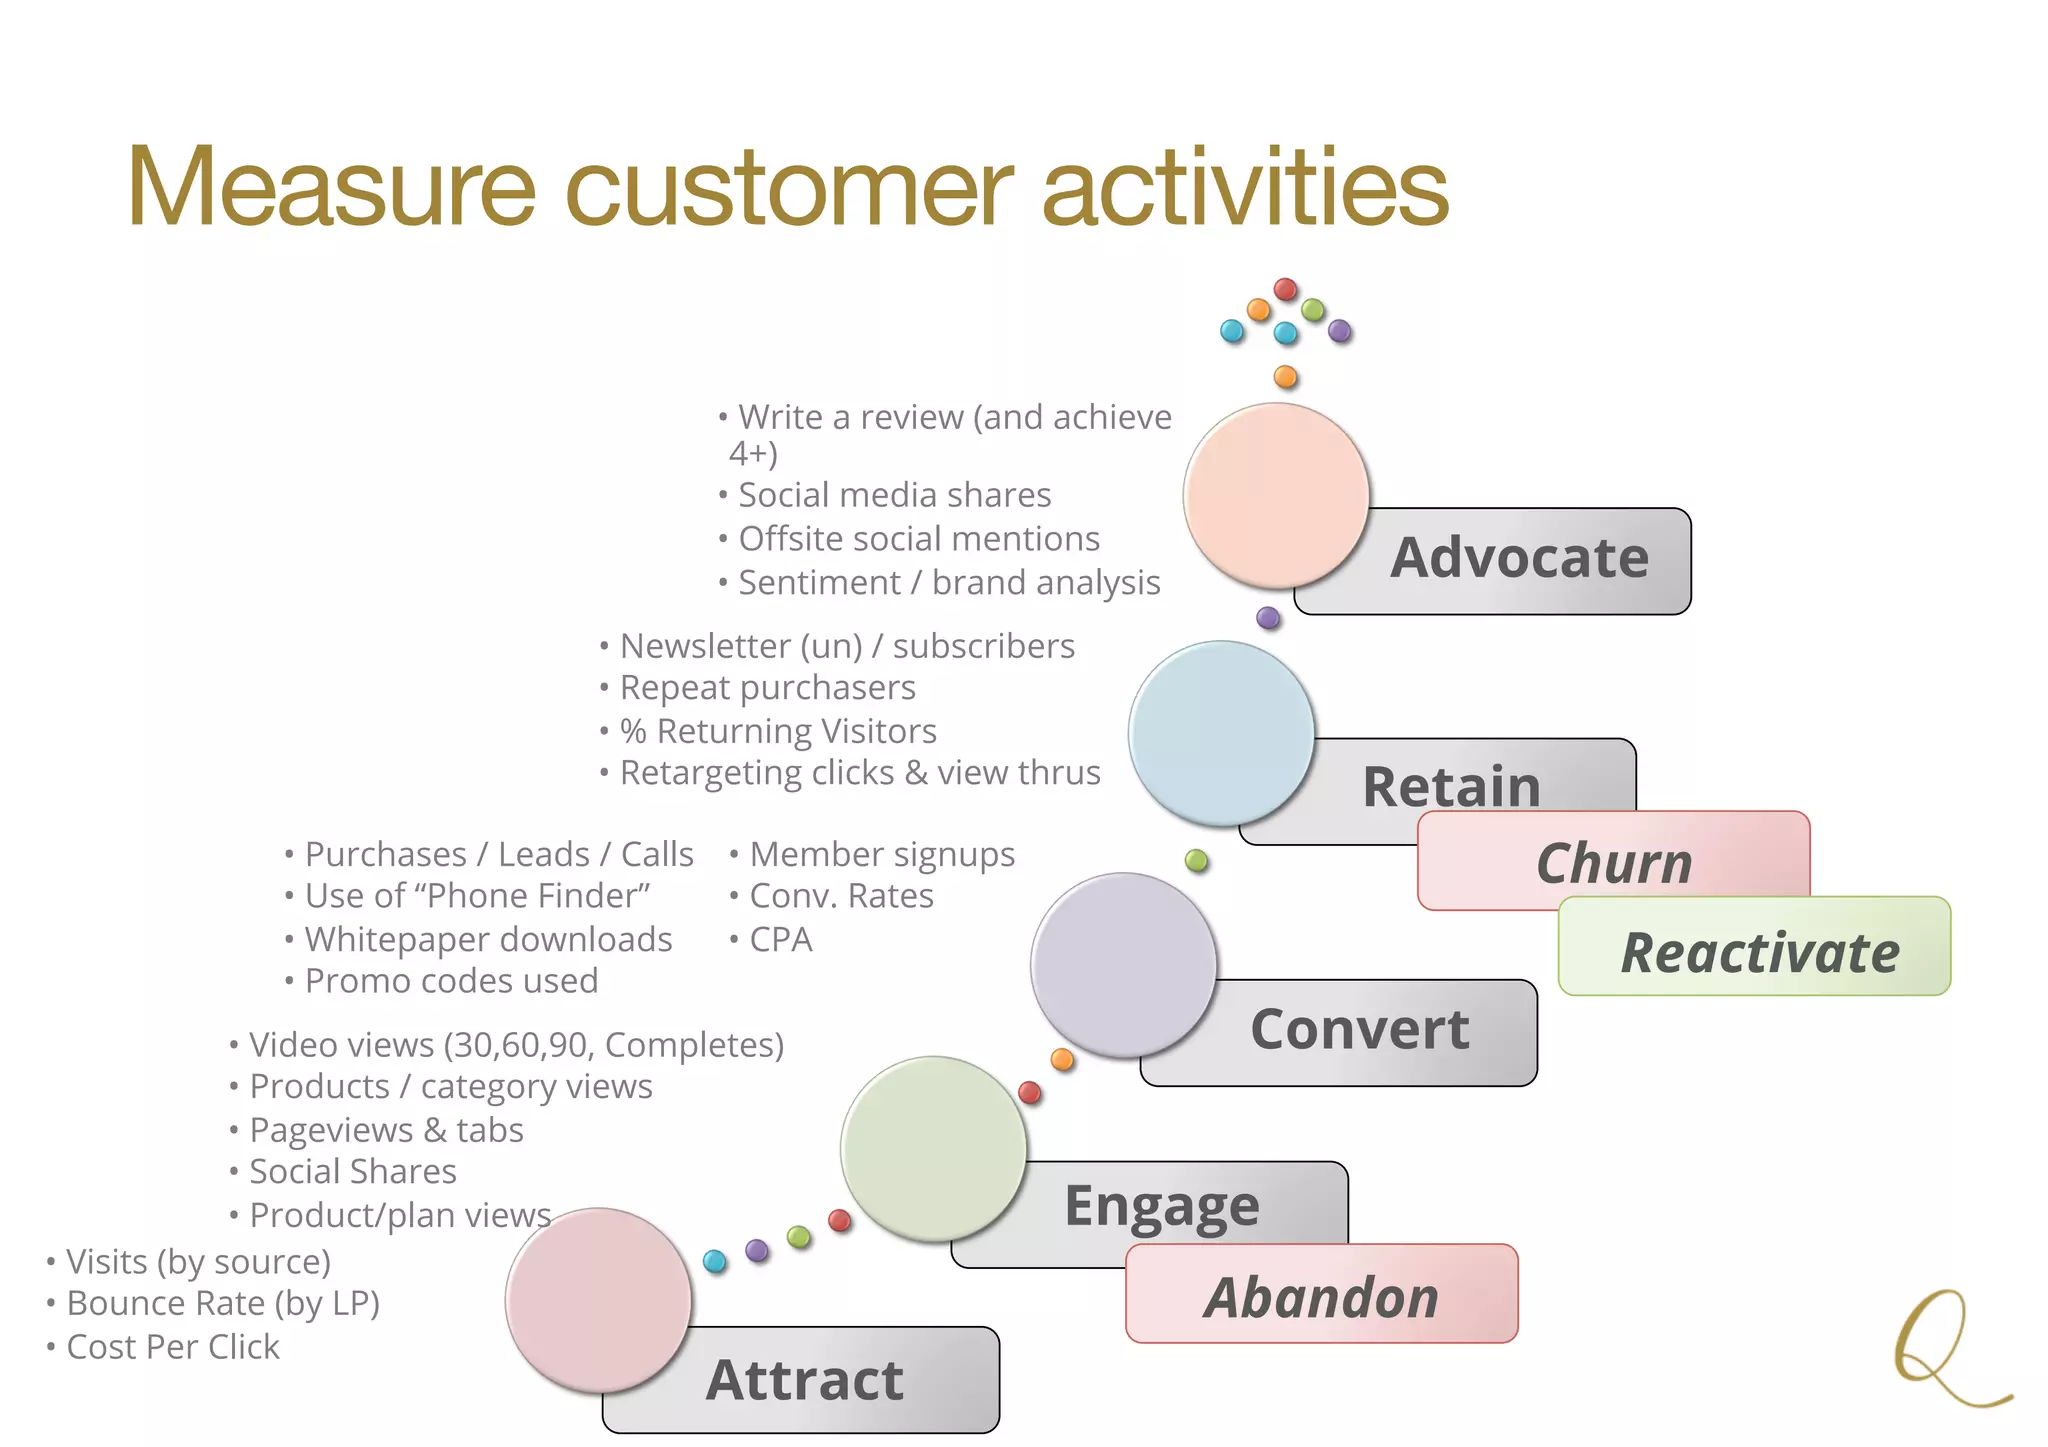
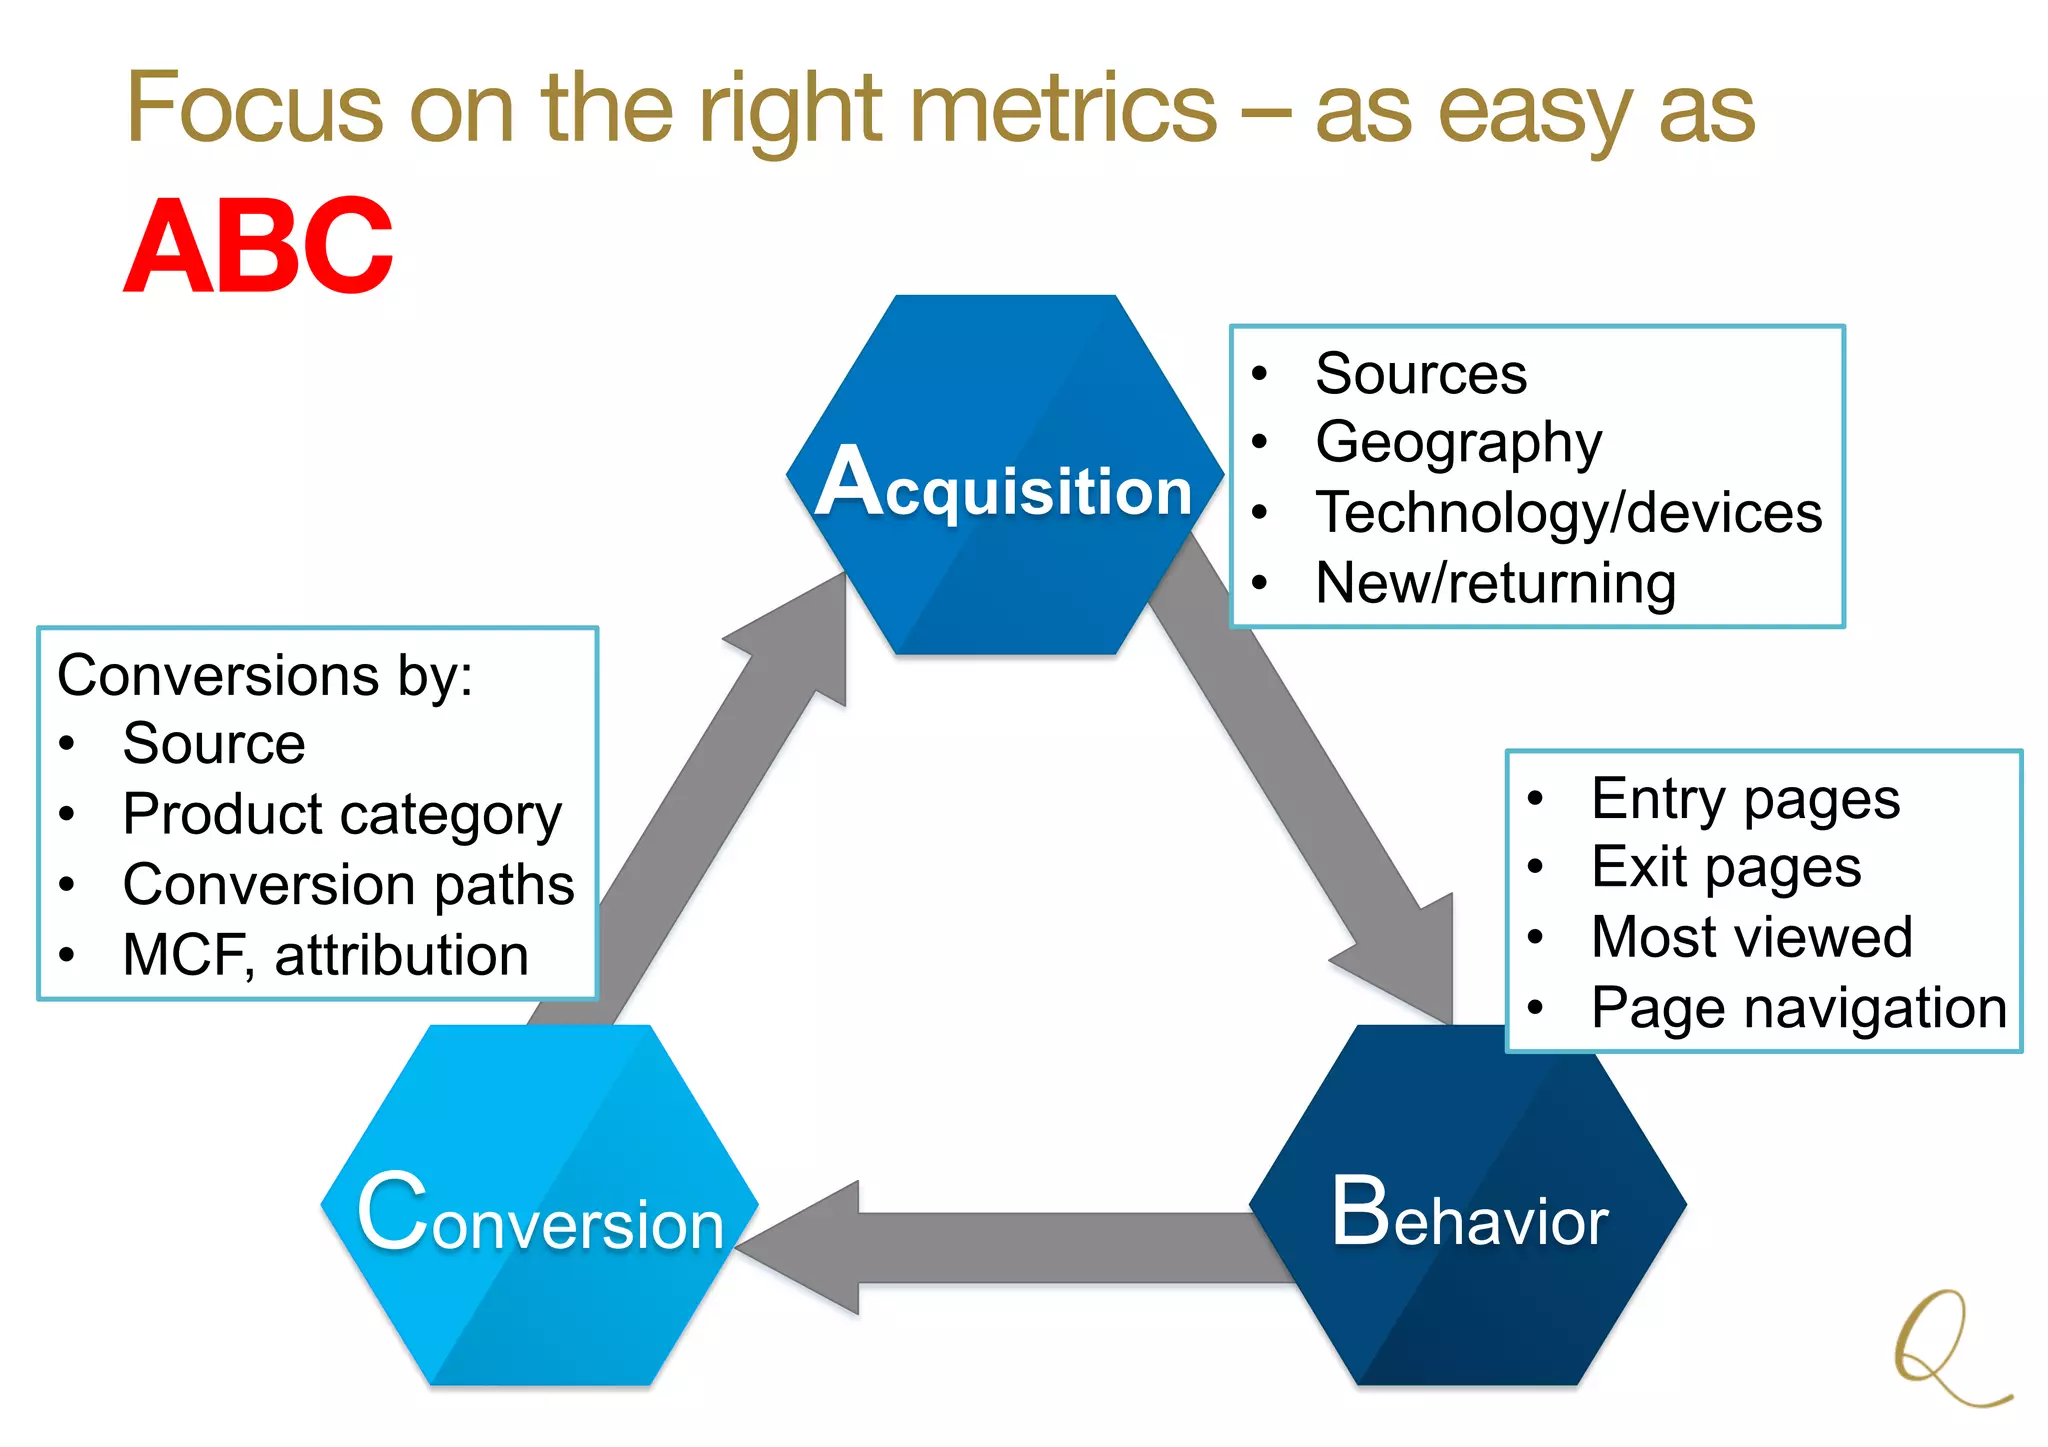
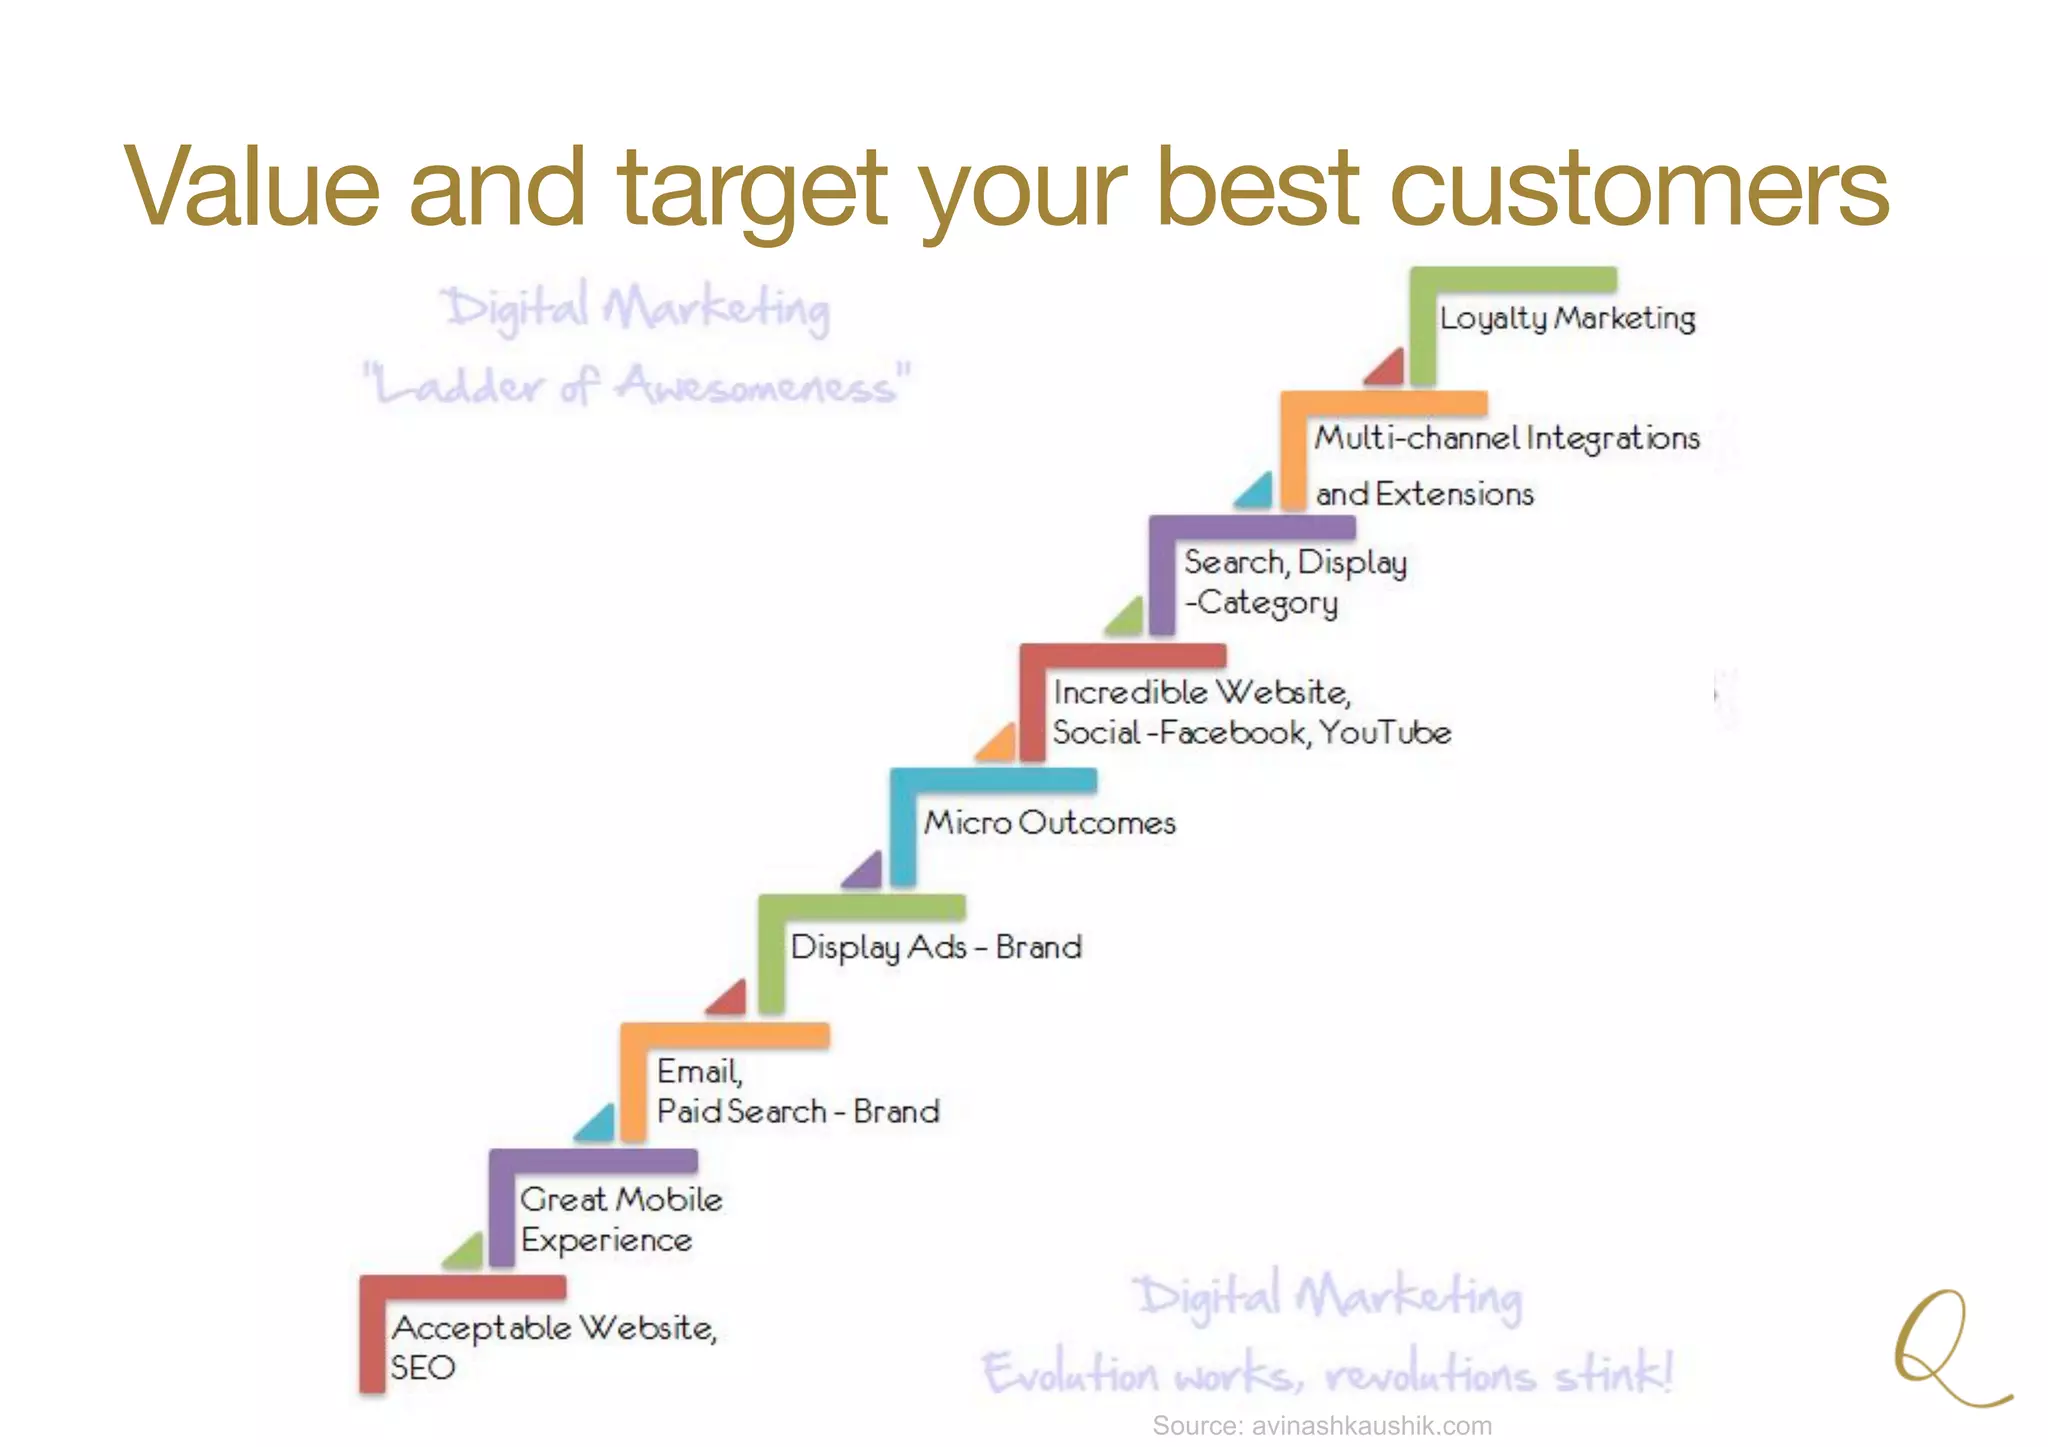
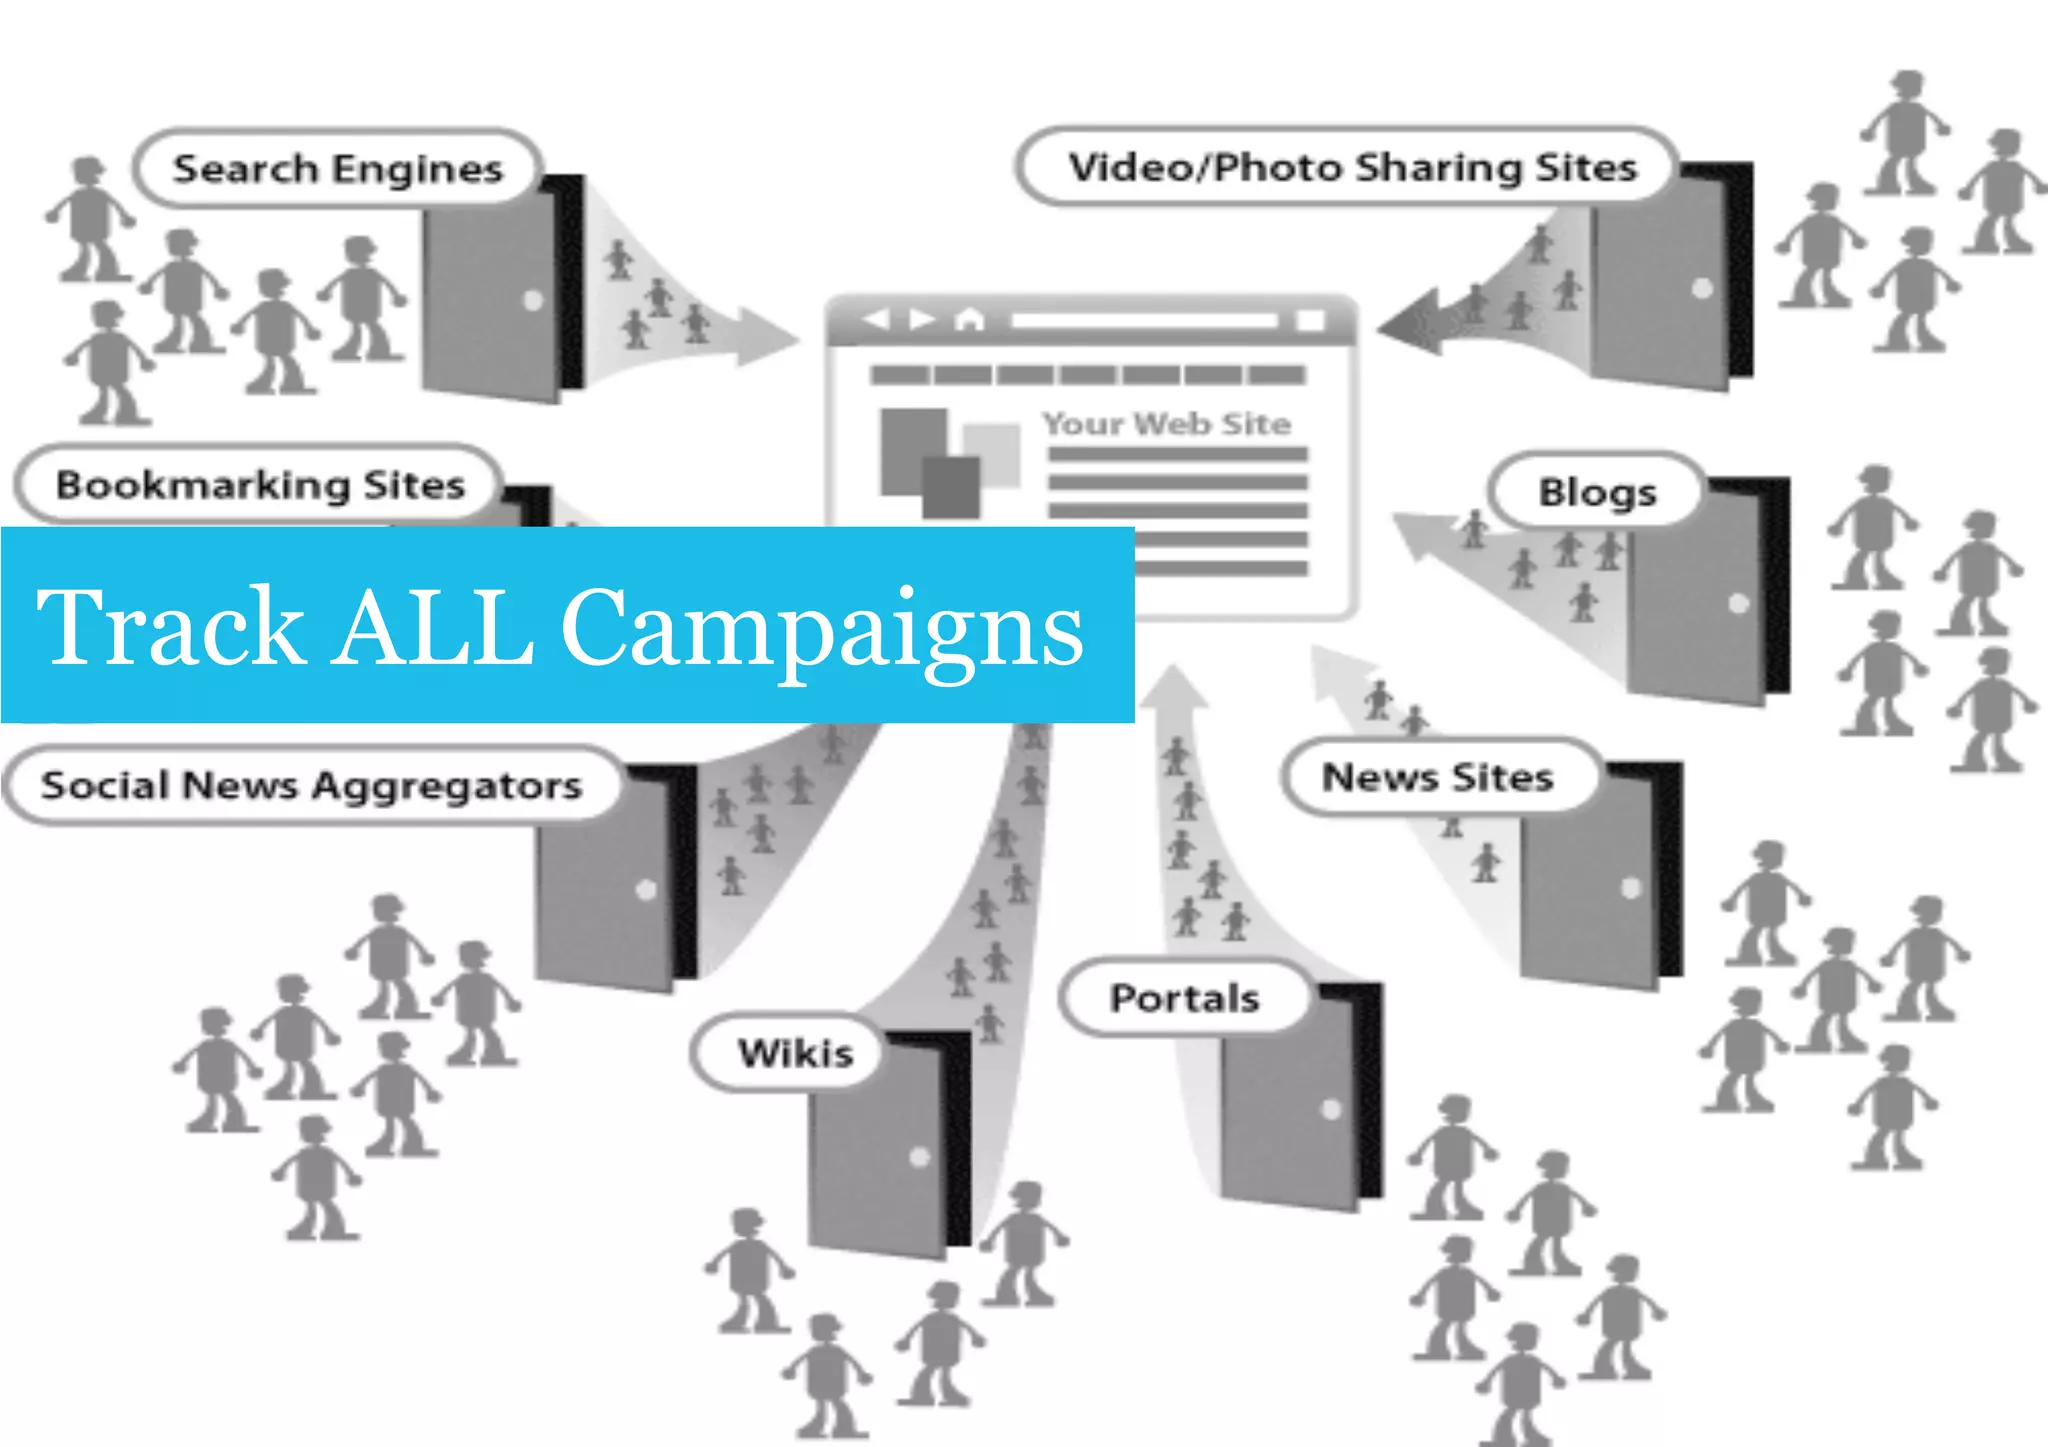
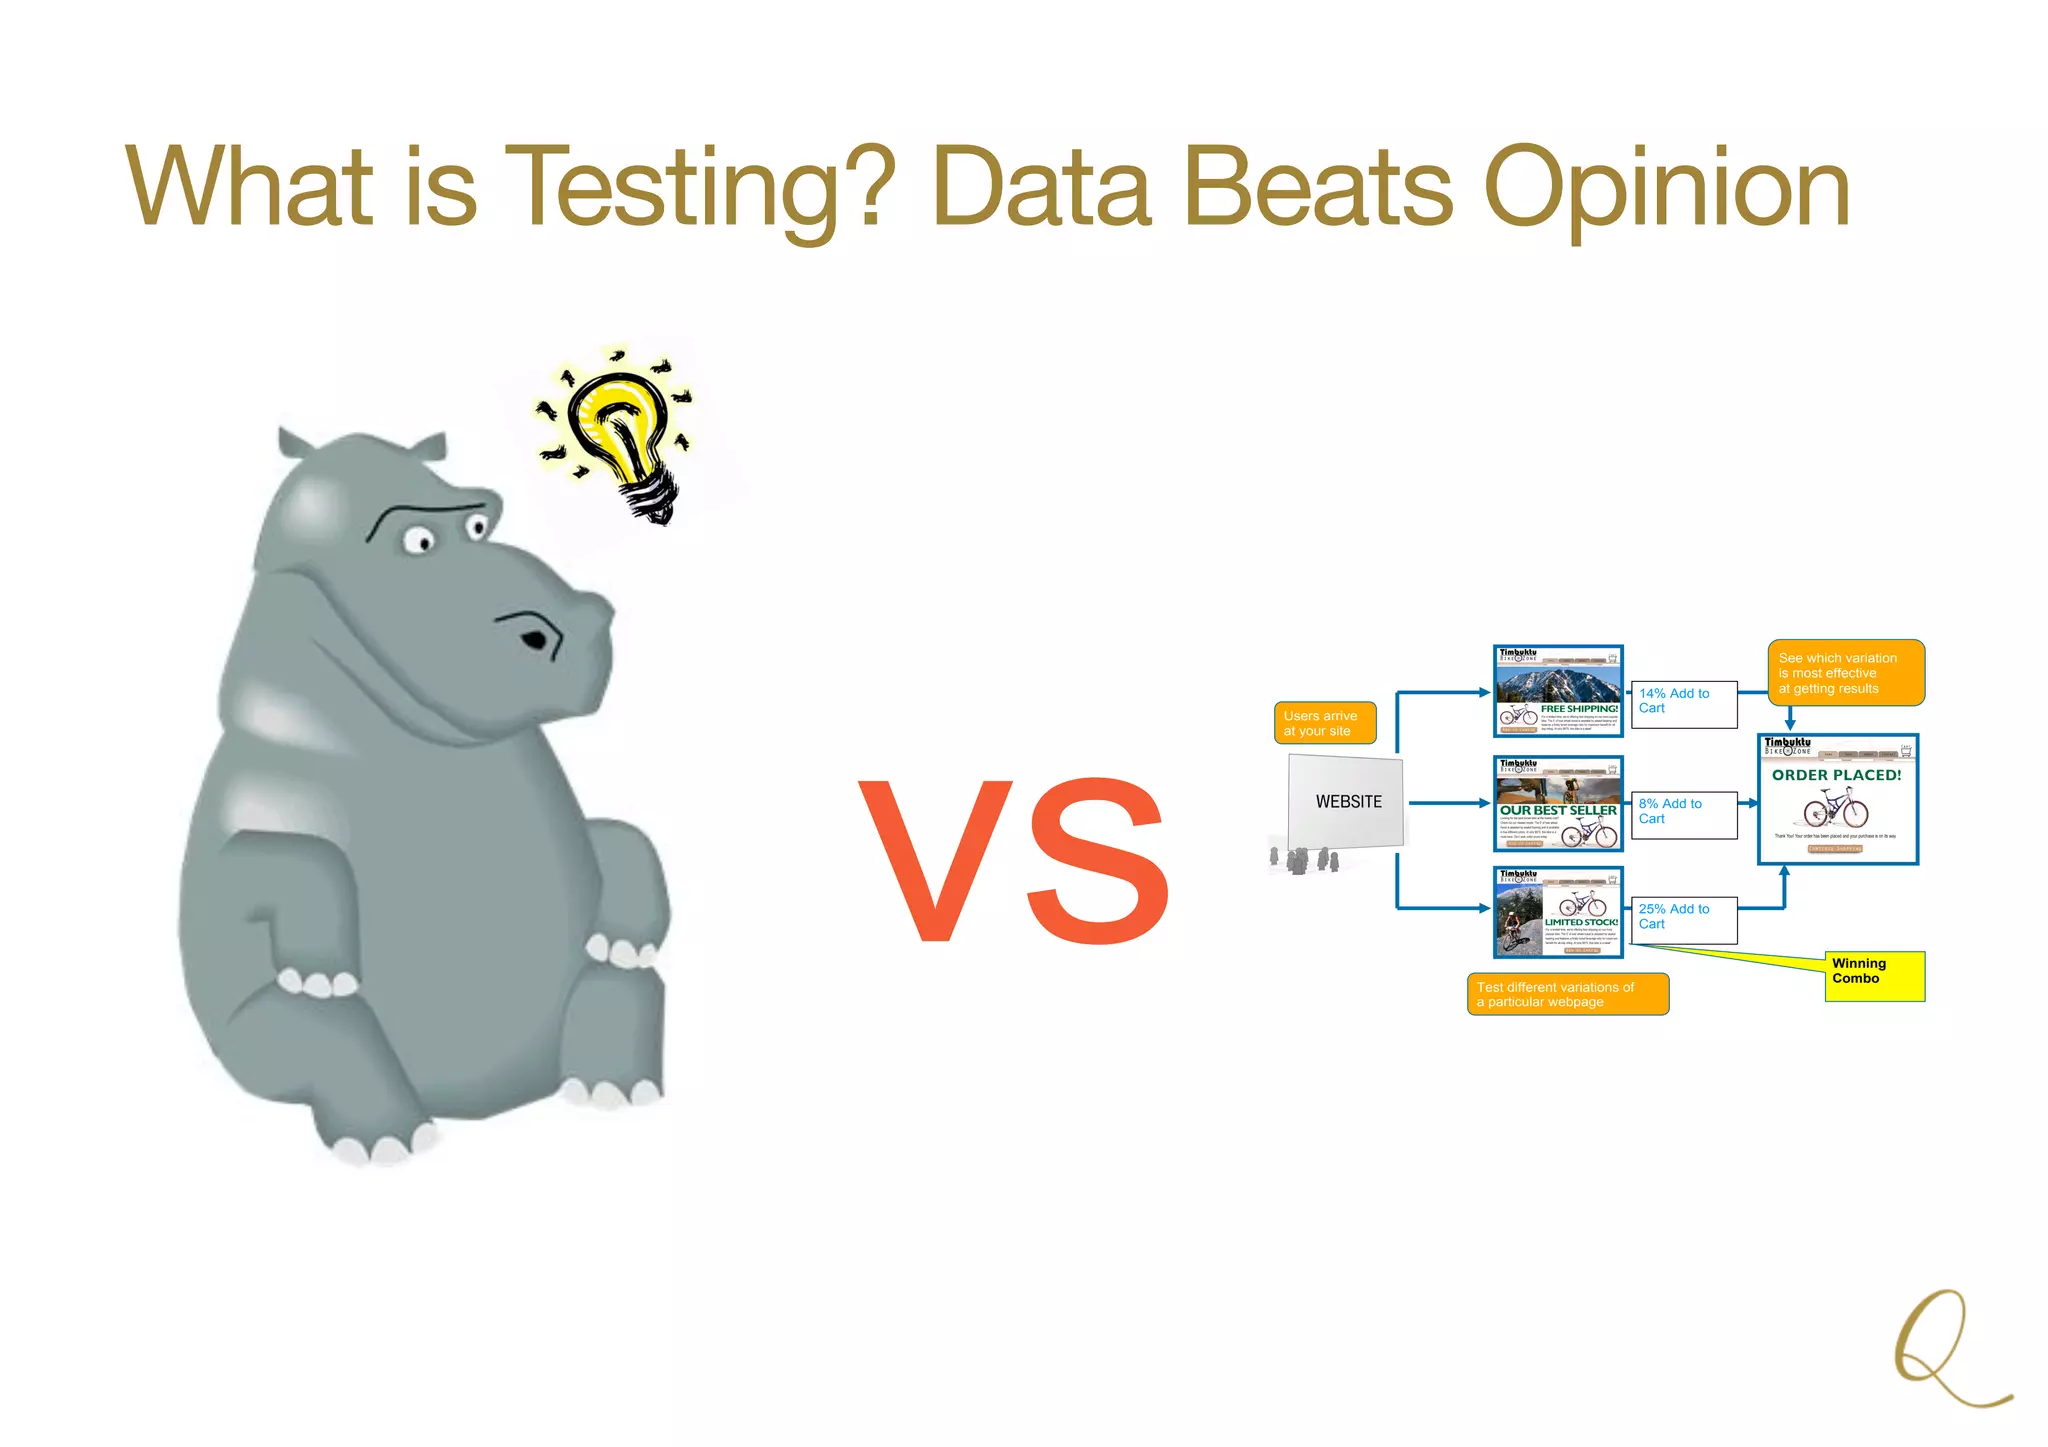
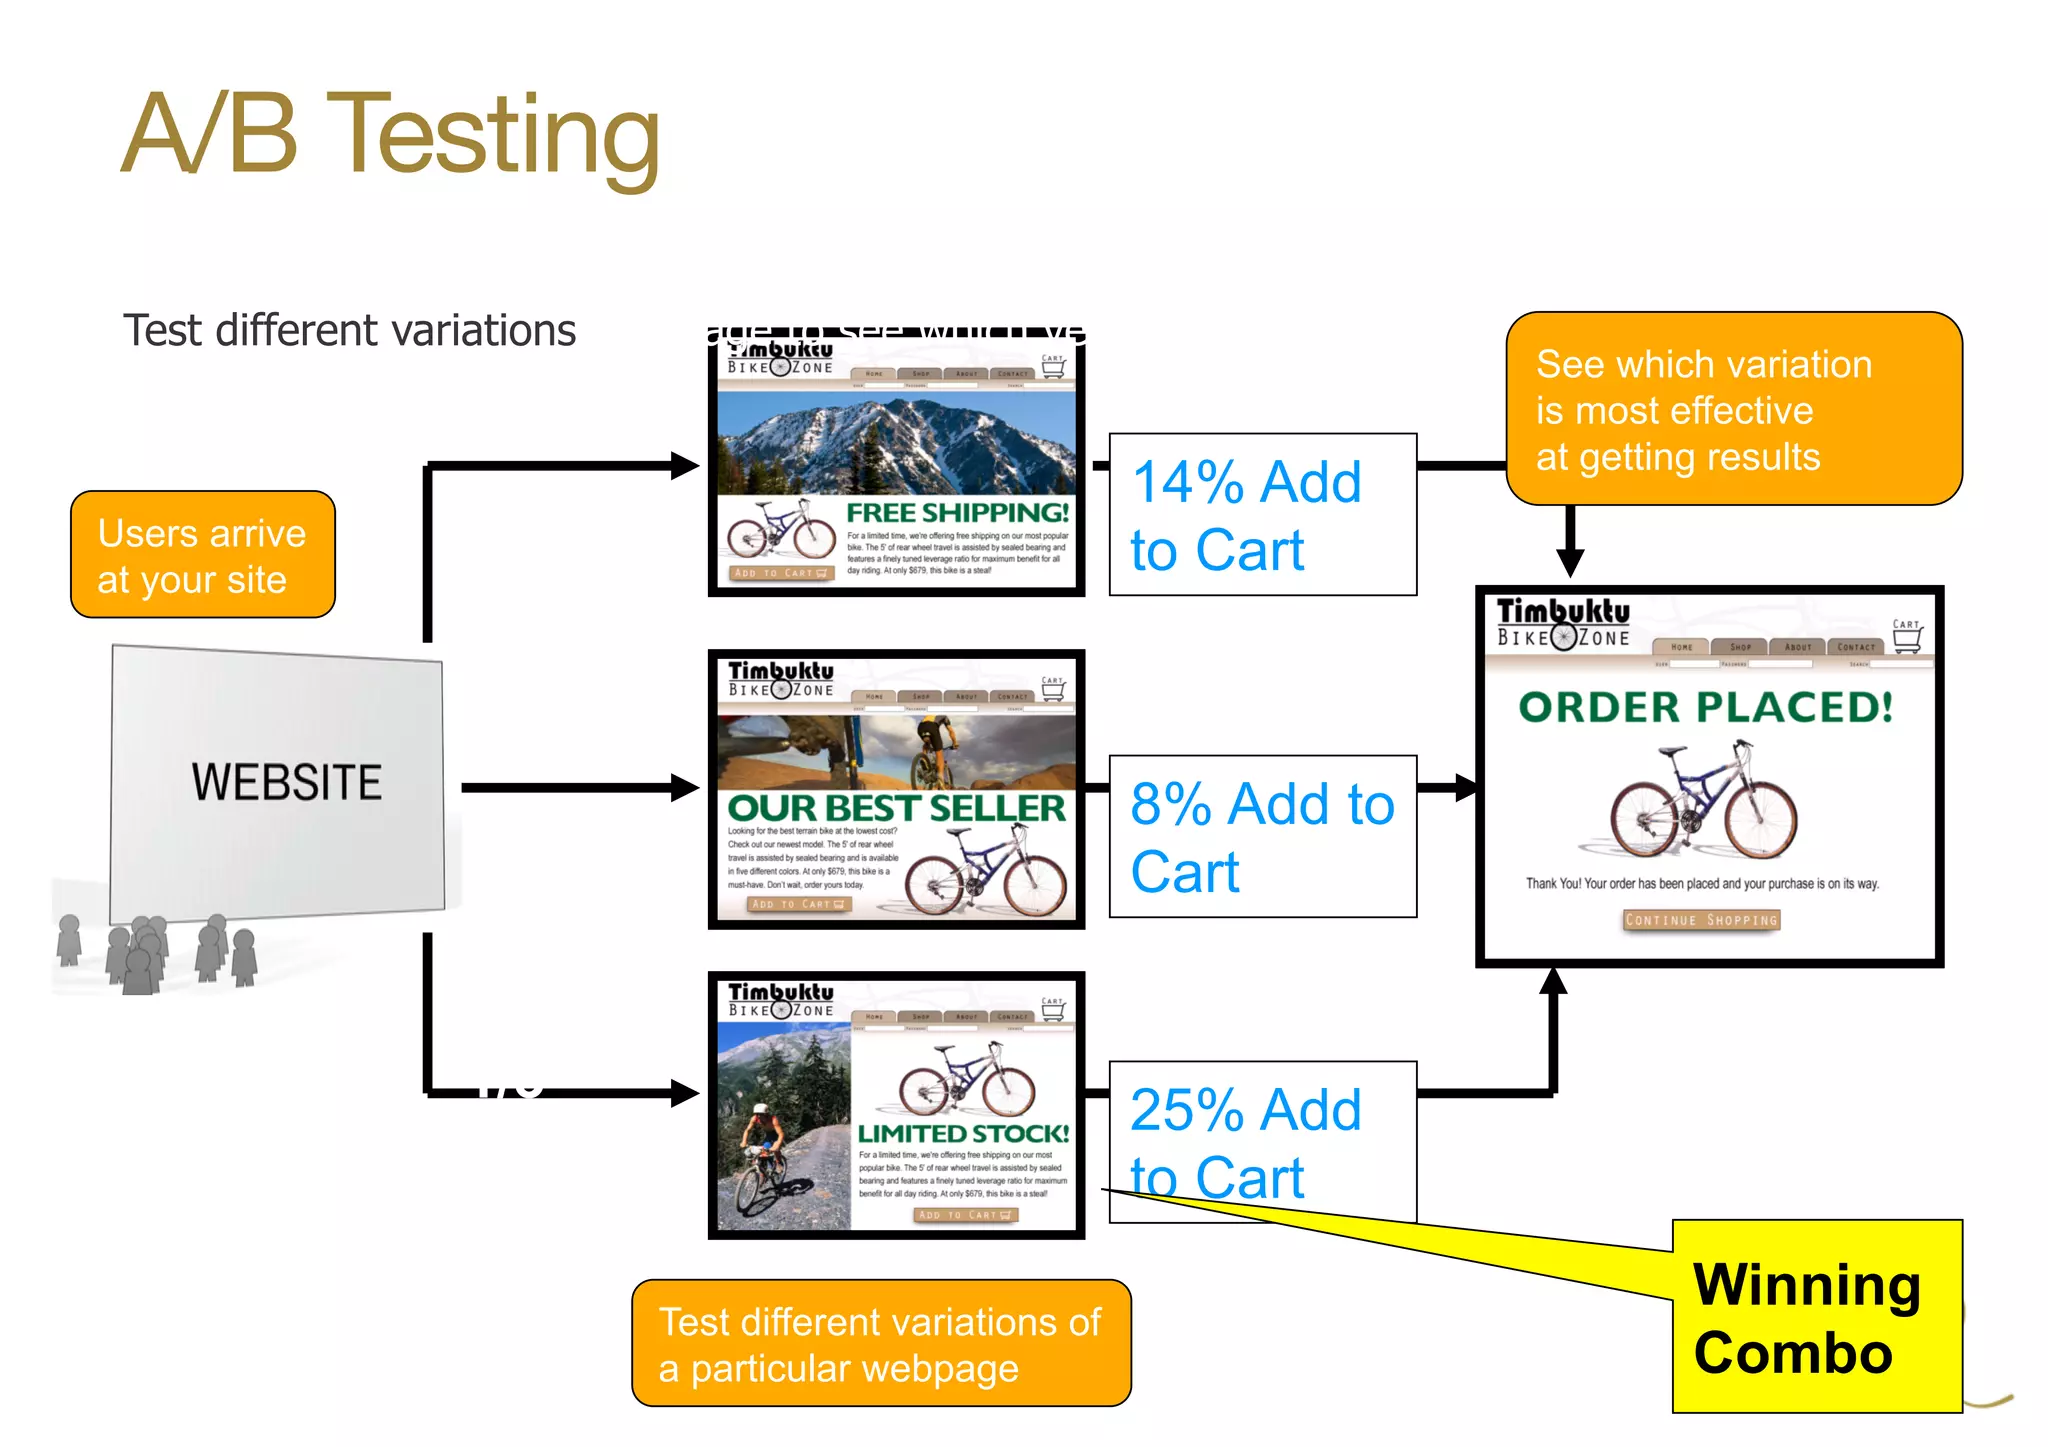
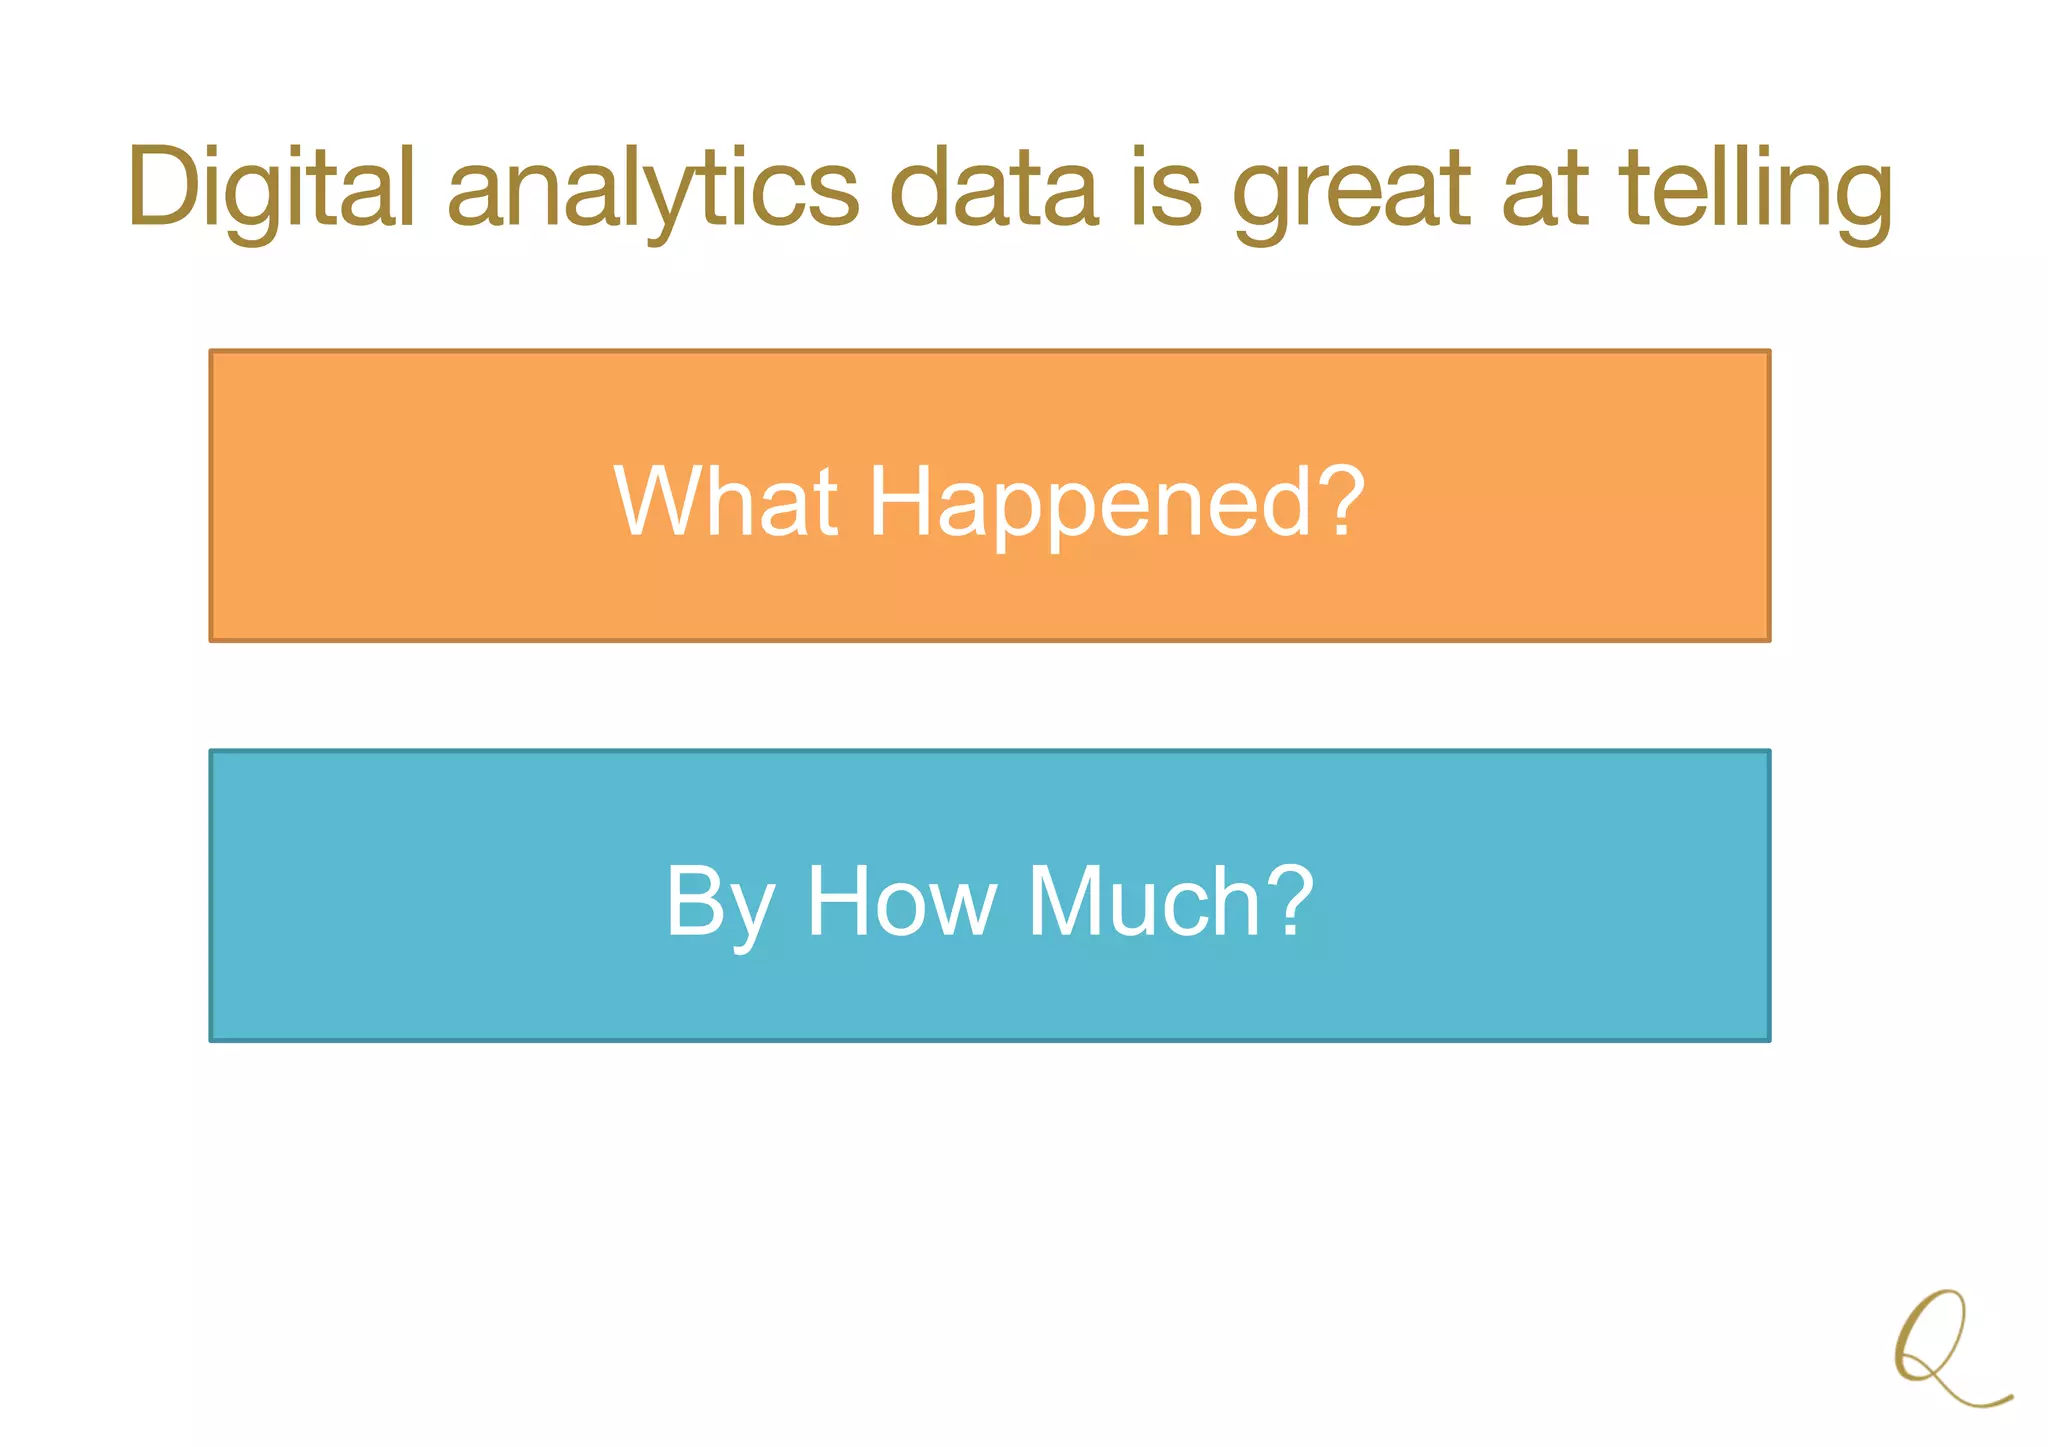
WEB MEASUREMENT &
ANALYTICS
A SingTel/MIS Workshop
Ivan Wong
27 October 2015
 www.qcg.com.sg
Speaker Intro
Ivan Wong
Consultant, Queen Consulting Group
Google Partner Academy Trainer
(AdWords & Analytics)
Digital analytics is the analysis of
qualitative and quantitative data from
your business and the competition to
drive a continual improvement of the
online experience that your customers
and potential customers have which
translates to your desired outcomes (both
online and offline).

Avinash Kaushik
Econsultancy Cross-Channel Marketing Survey 2014
Traditional Budgets Are Shifting To Digital
Source:http://www.ducttapemarketing.com/blog/2015/01/08/inbound-vs-outbound-marketing/
Important Analytics for Understanding
Customers
Key Measurement Goals
Most important growth/profit-related requirements for analytics
Key Effective Areas for Analytics
This year
is TRULY the
year of mobile…
Source: thinkwithgoogle.com
Banner Blindness & Bots
Marketing Systems & Data
You may have seen an eye chart similar to this.
It’s often used to frighten people.
A sample of several hundred different
companies that have built software for
marketers.
To emphasize: this is just a sample of a few
hundred, from a marketing technology
ecosystem of thousands of products.
Source: LUMA Partners LLC 2014
Email/
ESP
Analytics
Display/
DSP/ATD
Purchase/
In-store
Search
Mobile
Loyalty
CRM
Social
Offline
Media
3rd-
Party
Reg/
Login
Site
Big
Data
How Can We Manage Big Data?
What tools do
marketers use to
deliver insights
today?
Web
analytics
Channel-agnostic
tracking
Channel-specific
tracking
What’s In Your Measurement Toolbox?
Toolbox
App
analytics
Analytics isn’t just about data - 

it’s about insights
Start with a clear goal
Focus on the right metrics
Value your best customers
Attribute value across the journey
Prove marketing impact
2. Build
KPIs
3. Collect
Data
4. Analyze
Data
5. Test
Alternatives
6.
Implement
Insights
1. Define
Goals
A suggested framework…
1. Define
Goals
As a start: identify your business goals and
website conversion goals
Next: identify your KPIs
Source: Google Insights
Measure customer activities
• Visits (by source)
• Bounce Rate (by LP)
• Cost Per Click
• Video views (30,60,90, Completes)
• Products / category views
• Pageviews & tabs
• Social Shares
• Product/plan views
• Newsletter (un) / subscribers
• Repeat purchasers
• % Returning Visitors
• Retargeting clicks & view thrus
• Write a review (and achieve
4+)
• Social media shares
• Offsite social mentions
• Sentiment / brand analysis
• Purchases / Leads / Calls
• Use of “Phone Finder”
• Whitepaper downloads
• Promo codes used
• Member signups
• Conv. Rates
• CPA
Attract
Engage
Convert
Retain
Advocate
Abandon
Churn
Reactivate
Focus on the right metrics – as easy as
ABC
Acquisition
Conversion Behavior
•  Sources
•  Geography
•  Technology/devices
•  New/returning
•  Entry pages
•  Exit pages
•  Most viewed
•  Page navigation
Conversions by:
•  Source
•  Product category
•  Conversion paths
•  MCF, attribution
Value and target your best customers
Source: avinashkaushik.com
Track ALL Campaigns
Multi-Attribution Tracking
Source: http://www.kaushik.net/avinash/multi-channel-attribution-modeling-good-bad-ugly-models
Multi-Attribution Tracking
Source: http://www.kaushik.net/avinash/multi-channel-attribution-modeling-good-bad-ugly-models
Multi-Attribution Tracking
Source: http://www.kaushik.net/avinash/multi-channel-attribution-modeling-good-bad-ugly-models
Multi-Attribution Tracking
Source: http://www.kaushik.net/avinash/multi-channel-attribution-modeling-good-bad-ugly-models
What is Testing? Data Beats Opinion
vs
Test different variations of a page to see which version is most effective at achieving results.
8% Add to
Cart
14% Add to
Cart
25% Add to
Cart
Users arrive
at your site
Test different variations of
a particular webpage
See which variation
is most effective
at getting results
Winning
Combo
1/3 users
1/3 users
1/3 users
A/B Testing
Test different variations of a page to see which version is most effective at achieving results.
8% Add to
Cart
14% Add
to Cart
25% Add
to Cart
Users arrive
at your site
Test different variations of
a particular webpage
See which variation
is most effective
at getting results
Winning
Combo
1/3
users
1/3
users
1/3
users
COMMUNICATE RESULTS
Communicate marketing impact to your clients and stakeholders
Digital analytics data is great at telling
What Happened?
By How Much?
Our brains must come up with
Why it happened?
What we learned? What action
can we take?
Develop a report schedule
•  Business and communications planning, long-range
strategy, KPI assessment and goal settingAnnually
•  KPI executive reviews, strategy shifts, problem escalation
and cross-discipline impactQuarterly
•  Campaign reporting, KPI trends and insights, strategy
evaluation, campaign optimization and problem resolutionMonthly
•  Media trends, news synopses, topline opinions
Daily
•  Competitive alerts, service resolution and crisis
managementHourly
Why not just use GA reports &
dashboards?
What about data that doesn’t come from GA?
• Social signals
• Internal sales data
• Customer data
• Cost data
• ???
Solution: use dashboards
KPI Framework Data Table Mapping Dashboard Mockups
Useful Google Analytics intelligence tools
Intelligence Alerts
QuillEngage
Key Takeaways
Start with a clear goal
Focus on the right metrics
Value your best customers
Attribute value across the journey
Prove marketing impact
THANK YOU
QUEEN CONSULTING GROUP
Connect: www.qcg.com.sg

Digital measurement & analytics