Download to read offline


![Co2 Concentration in atmosphere
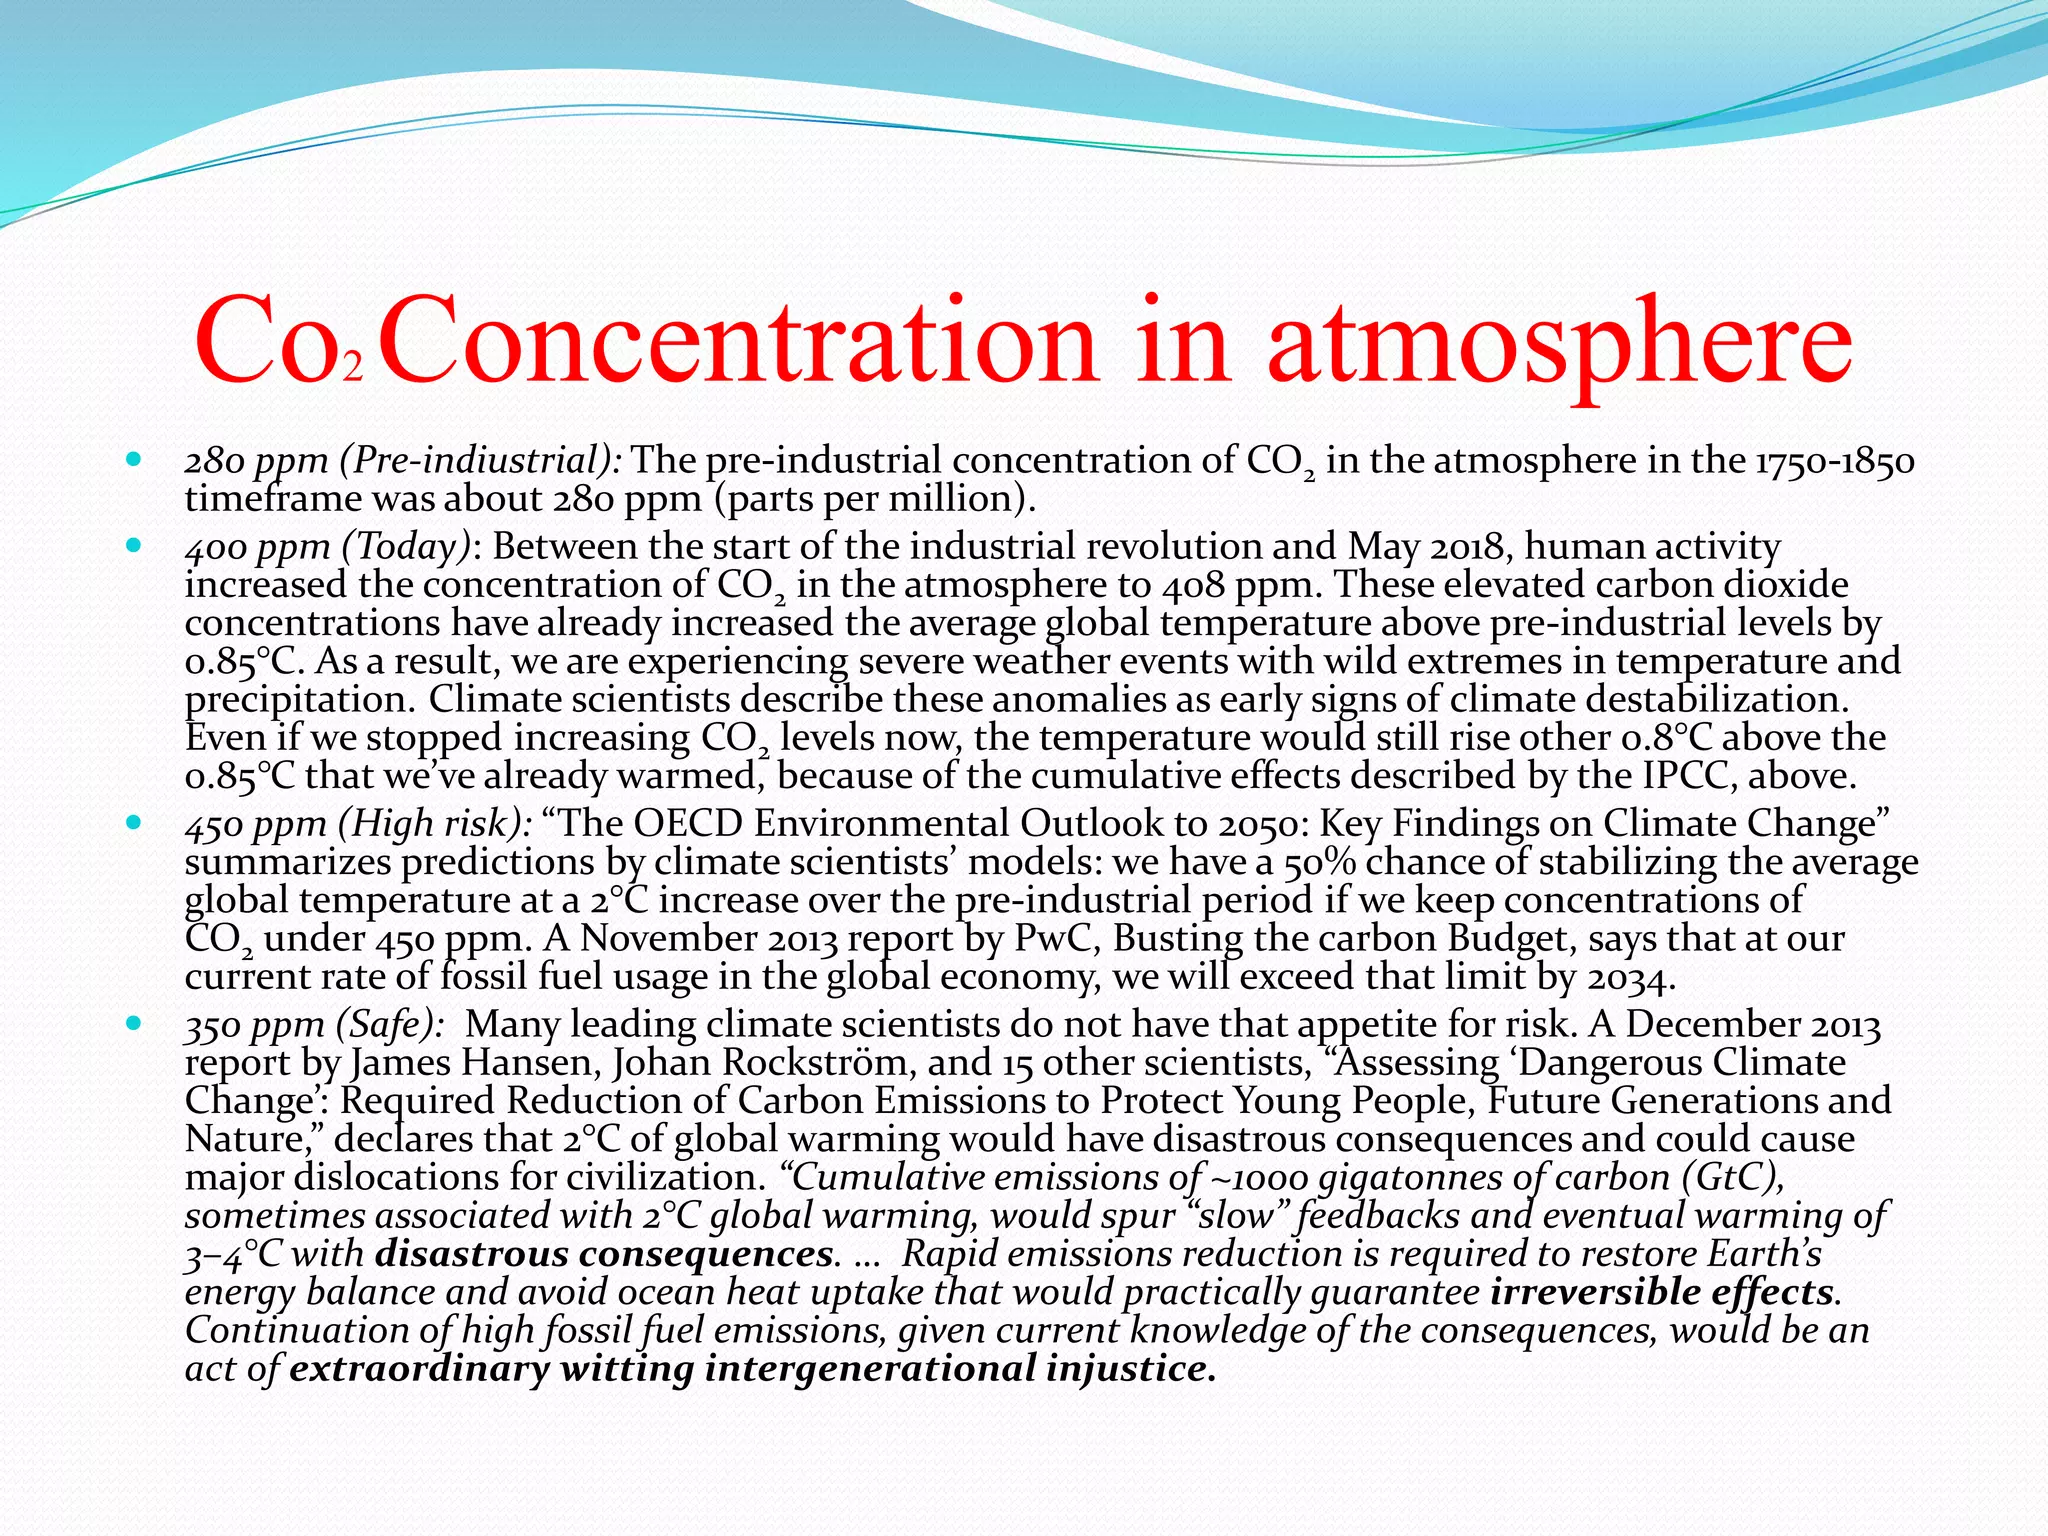
Since 1750, it is estimated that about 2/3rds of anthropogenic
[human] CO2 emissions have come from fossil fuel burning
and about 1/3rd from land use change.
About 45% of this CO2 has remained in the atmosphere, while
about 30% has been taken up by the oceans and the remainder
has been taken up by the terrestrial biosphere.
About half of a CO2 pulse [emission] to the atmosphere is
removed over a time scale of 30 years; a further 30% is
removed within a few centuries; and the remaining 20% will
typically stay in the atmosphere for many thousands of years.”](https://image.slidesharecdn.com/globalwarminganditseffects-180514200304/75/Global-warming-and-its-effects-17-2048.jpg)


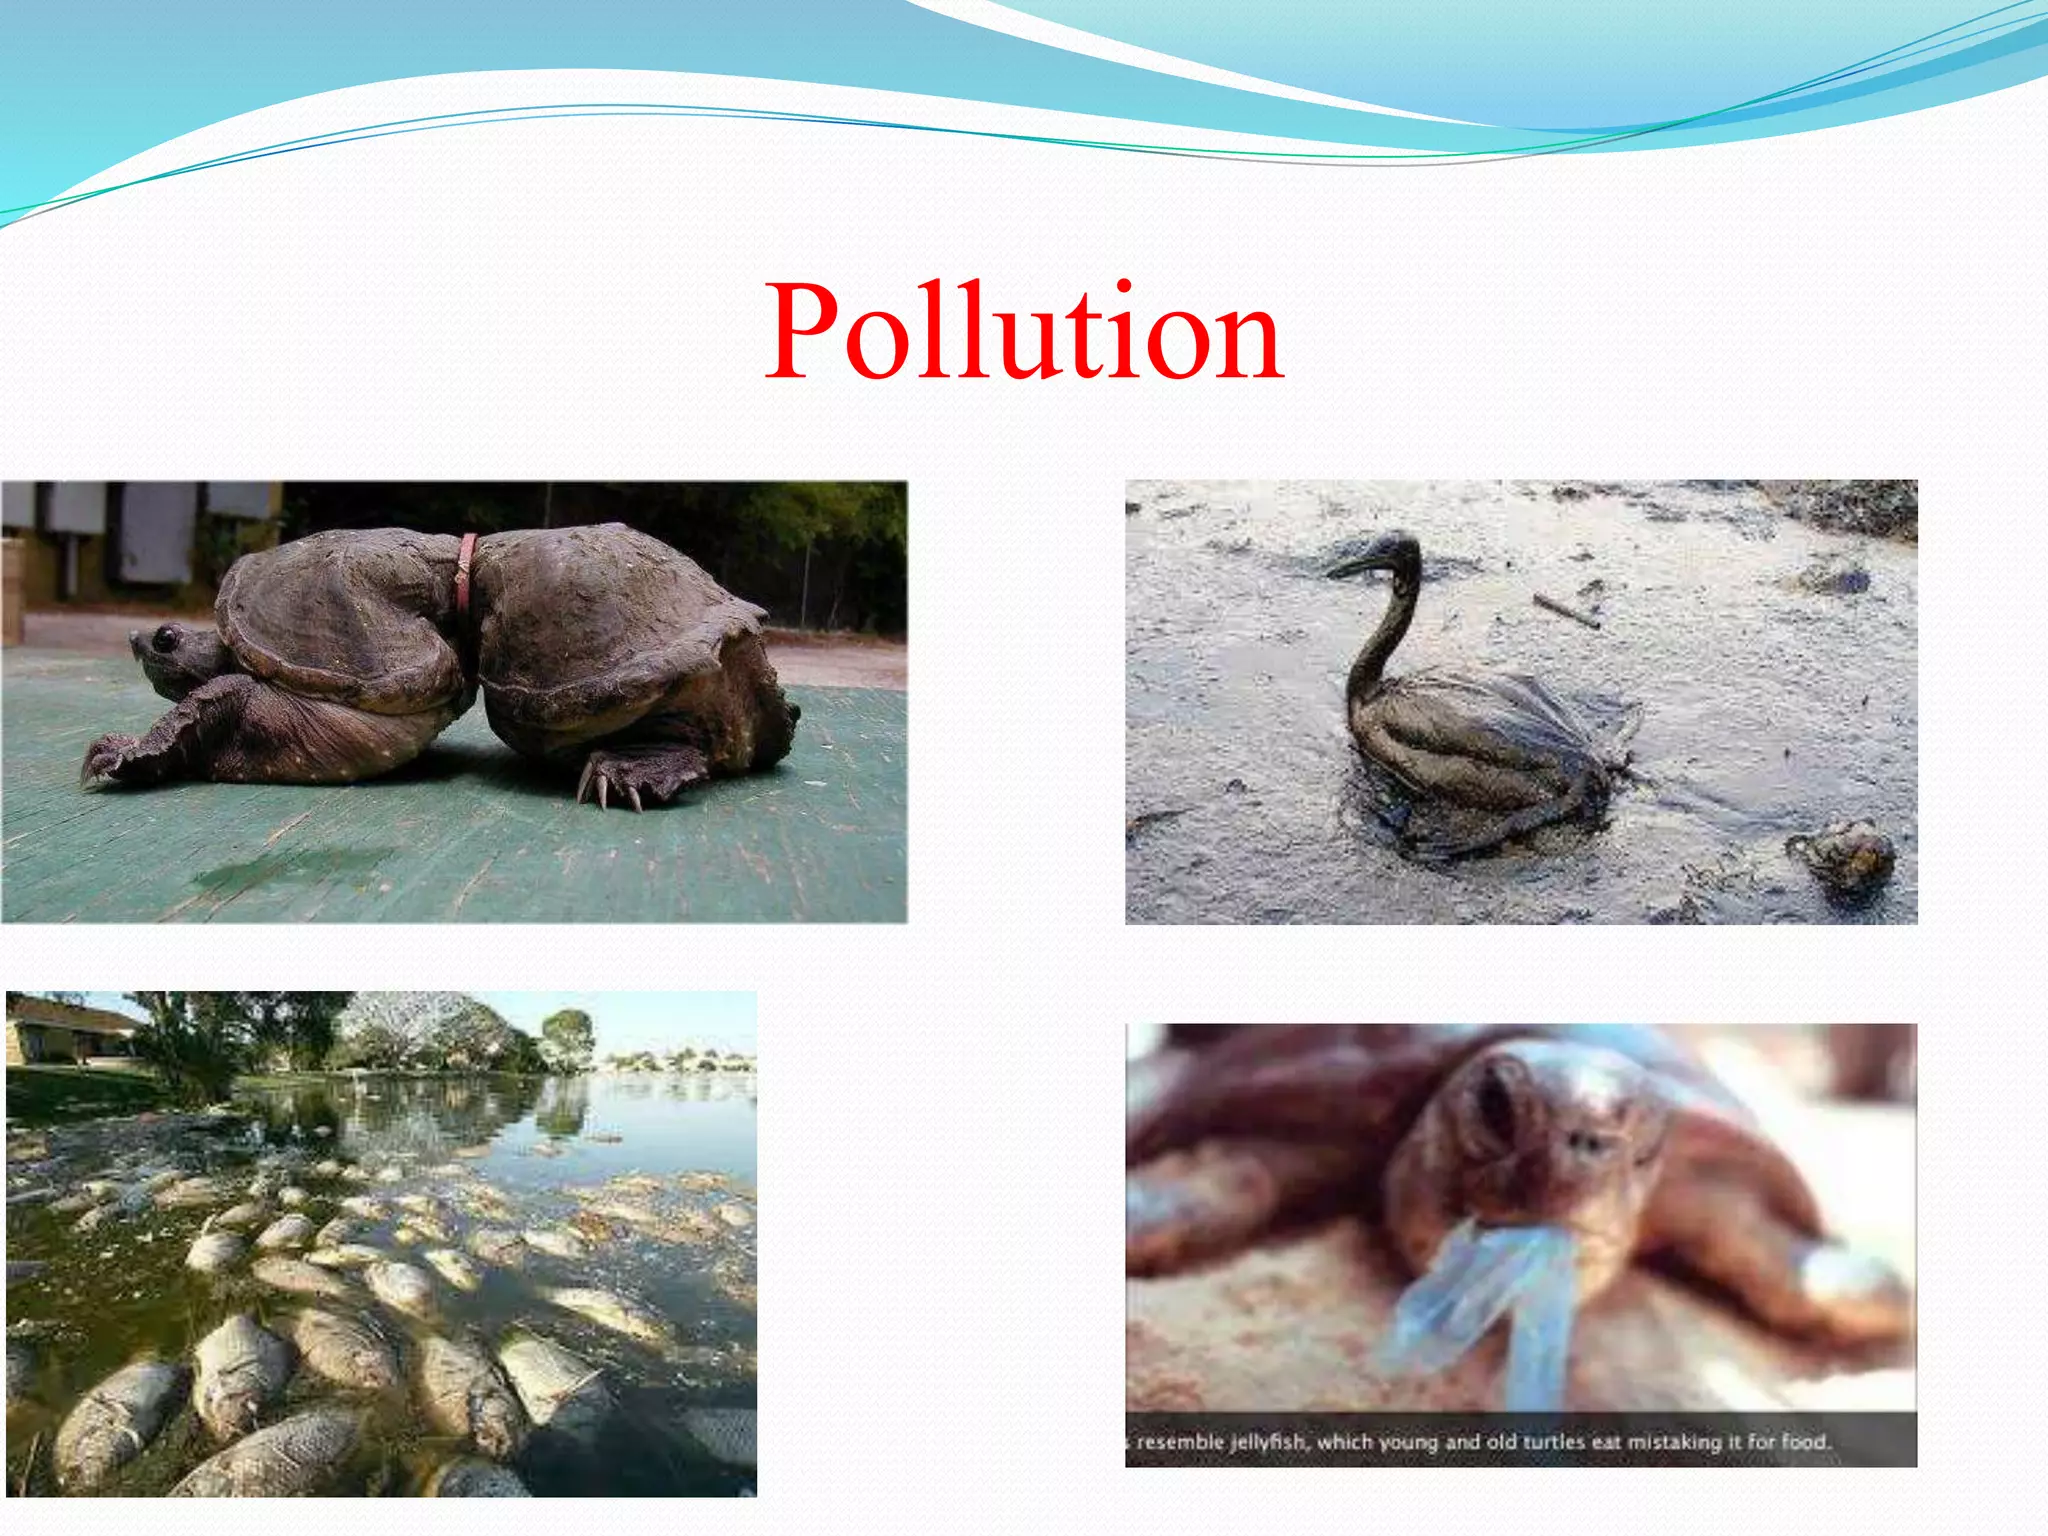
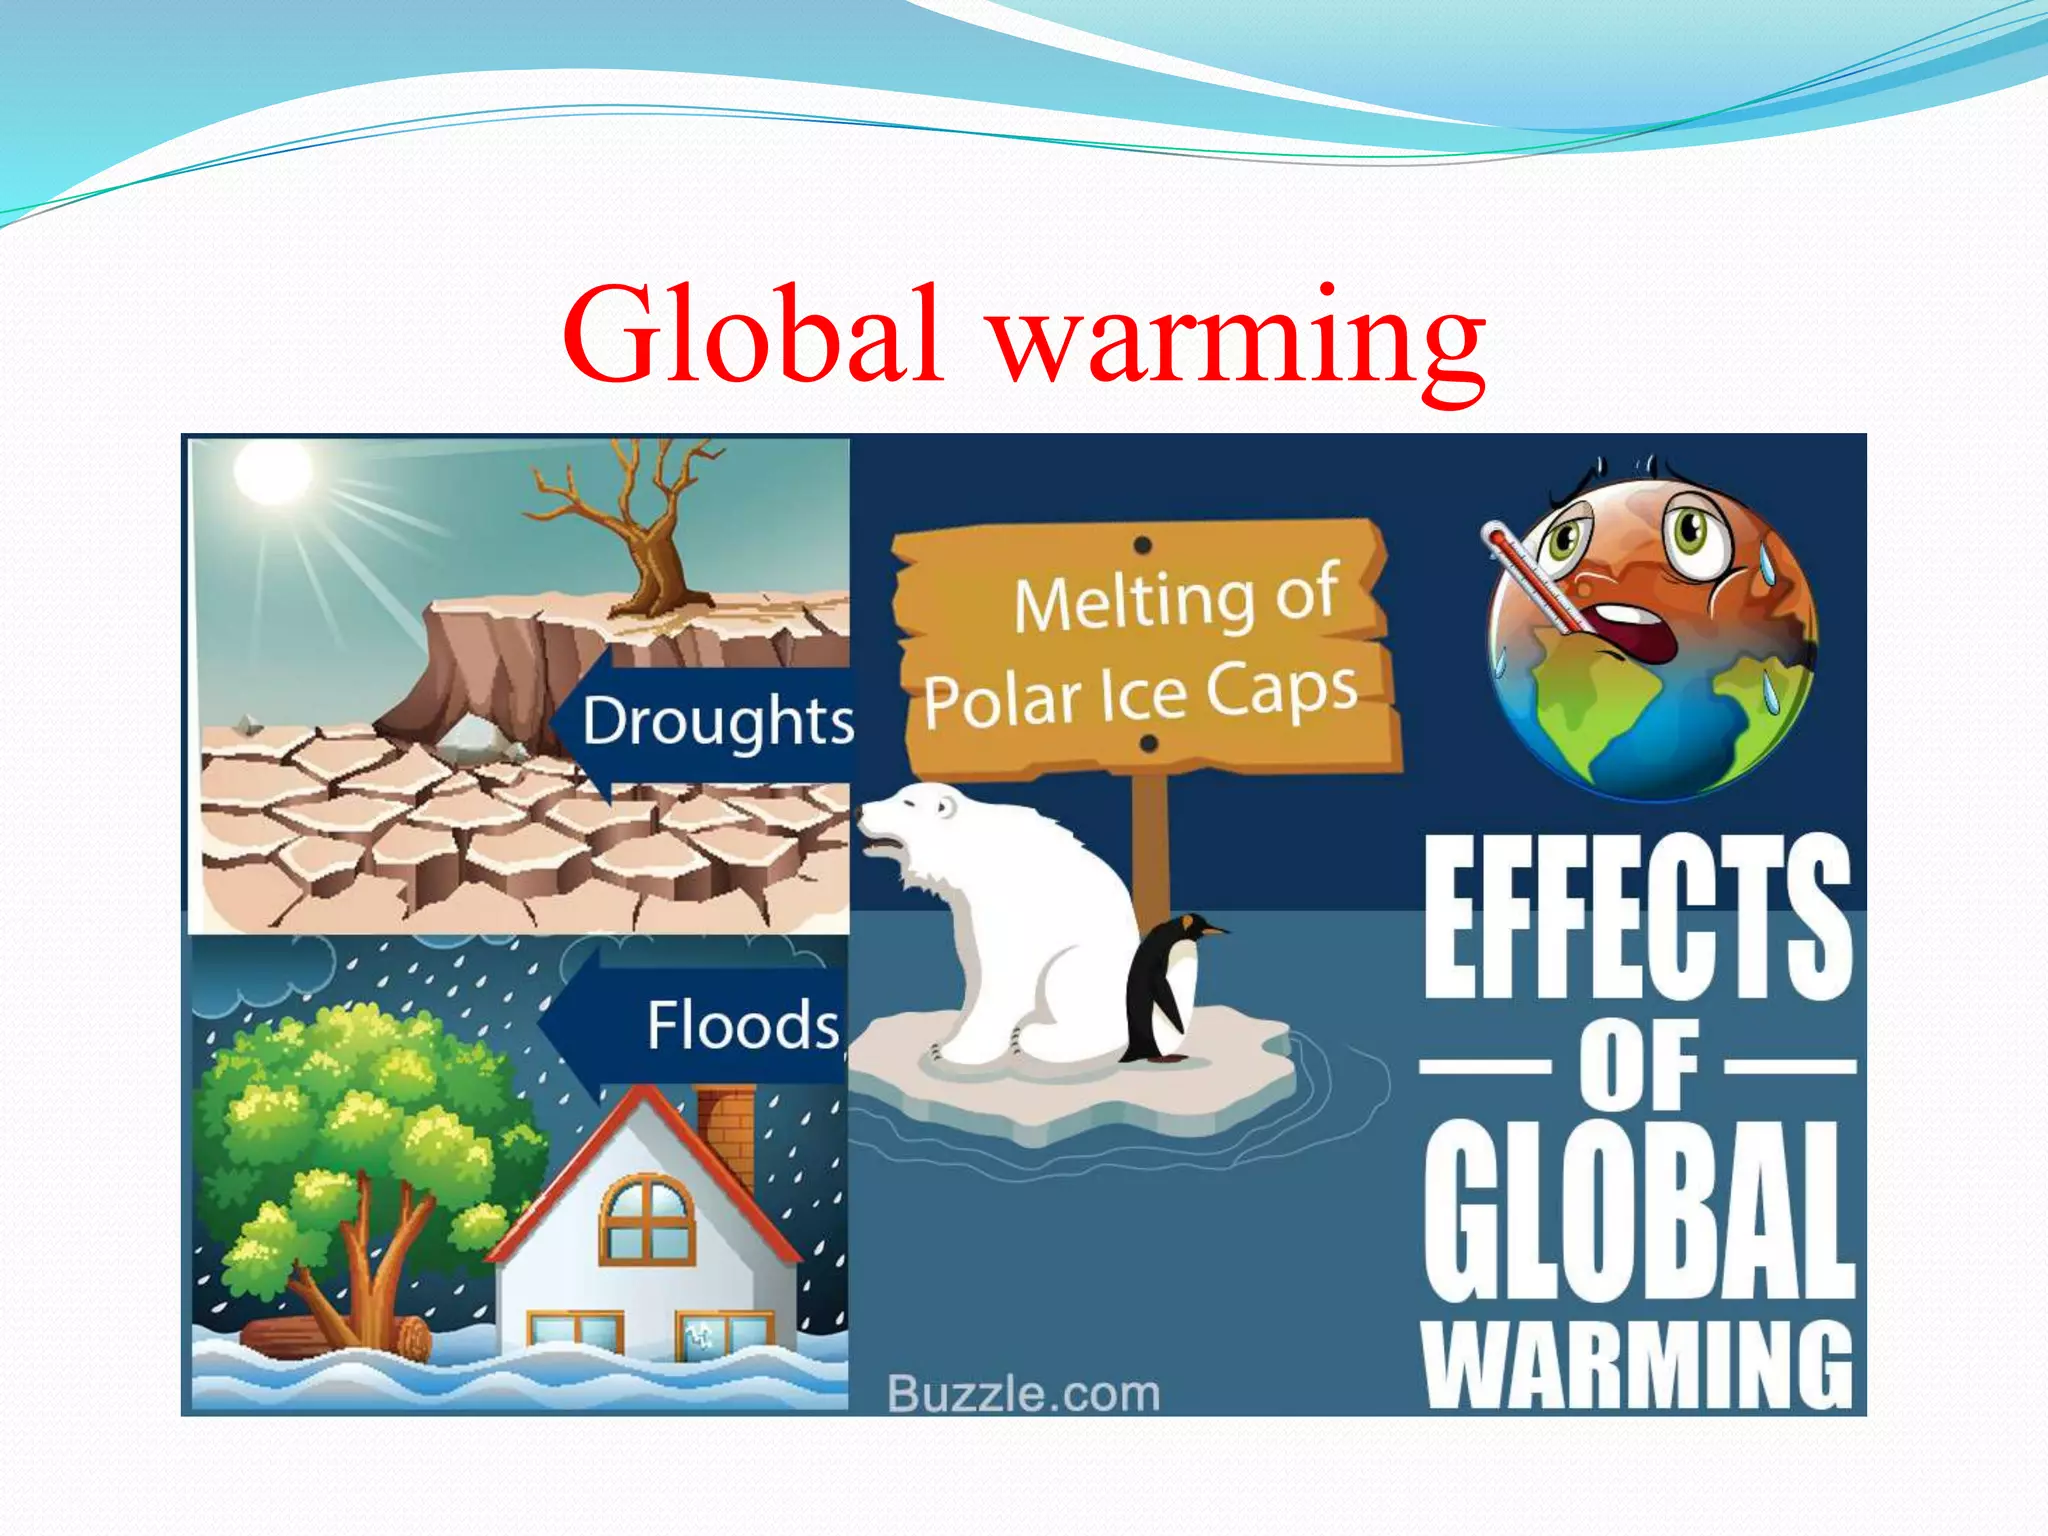
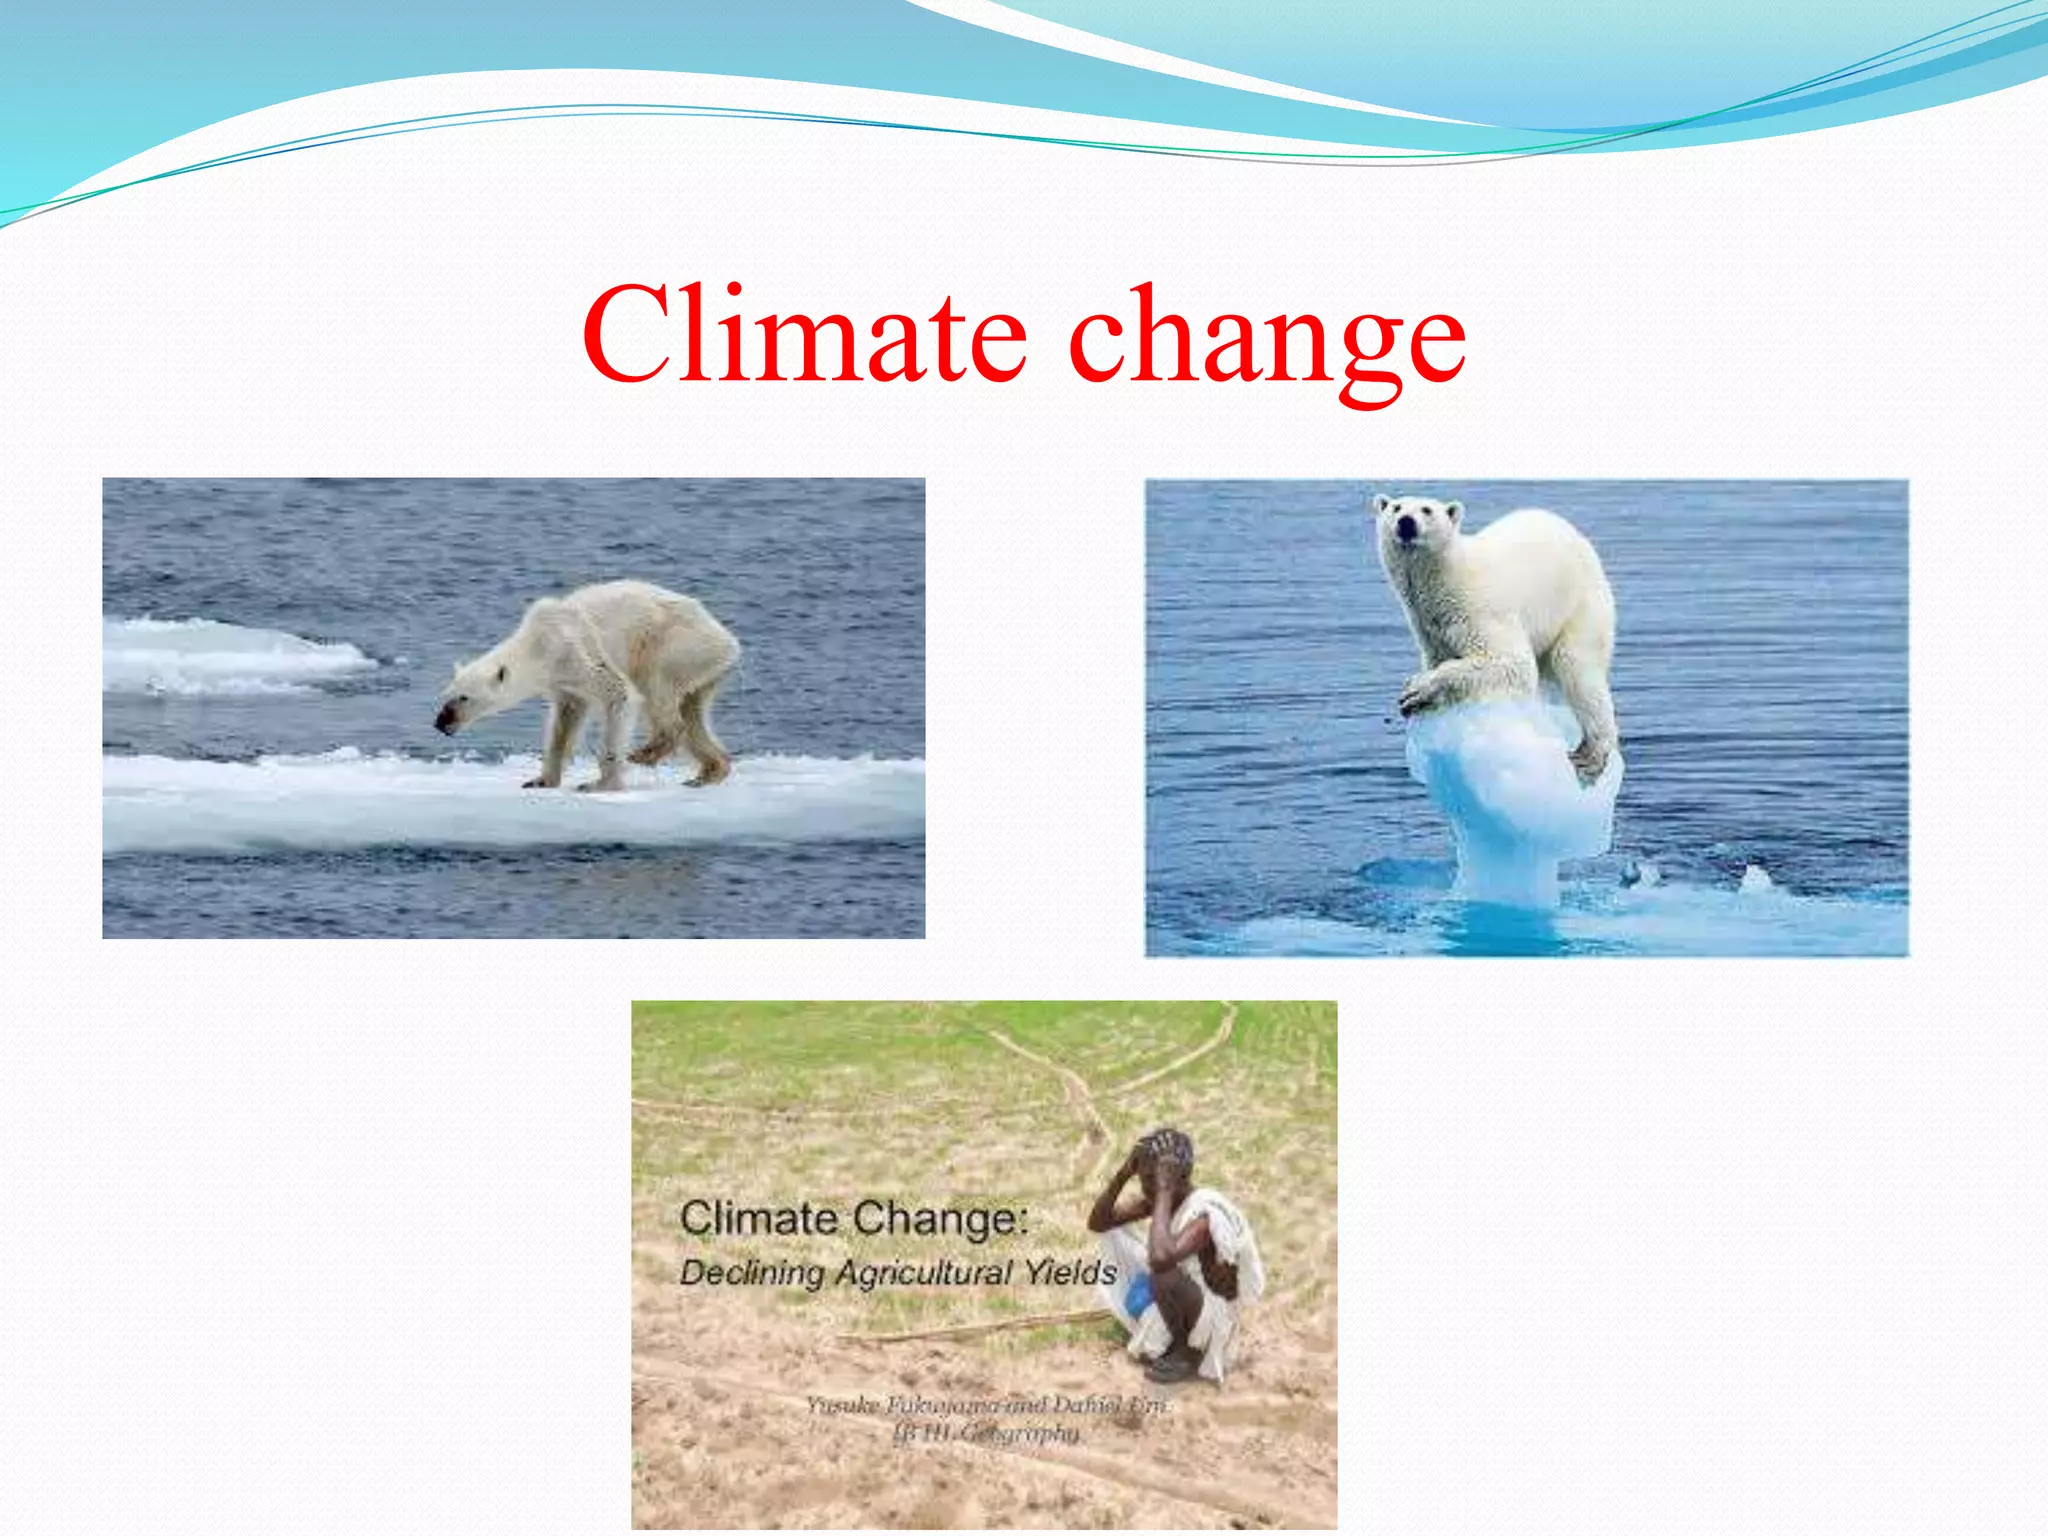
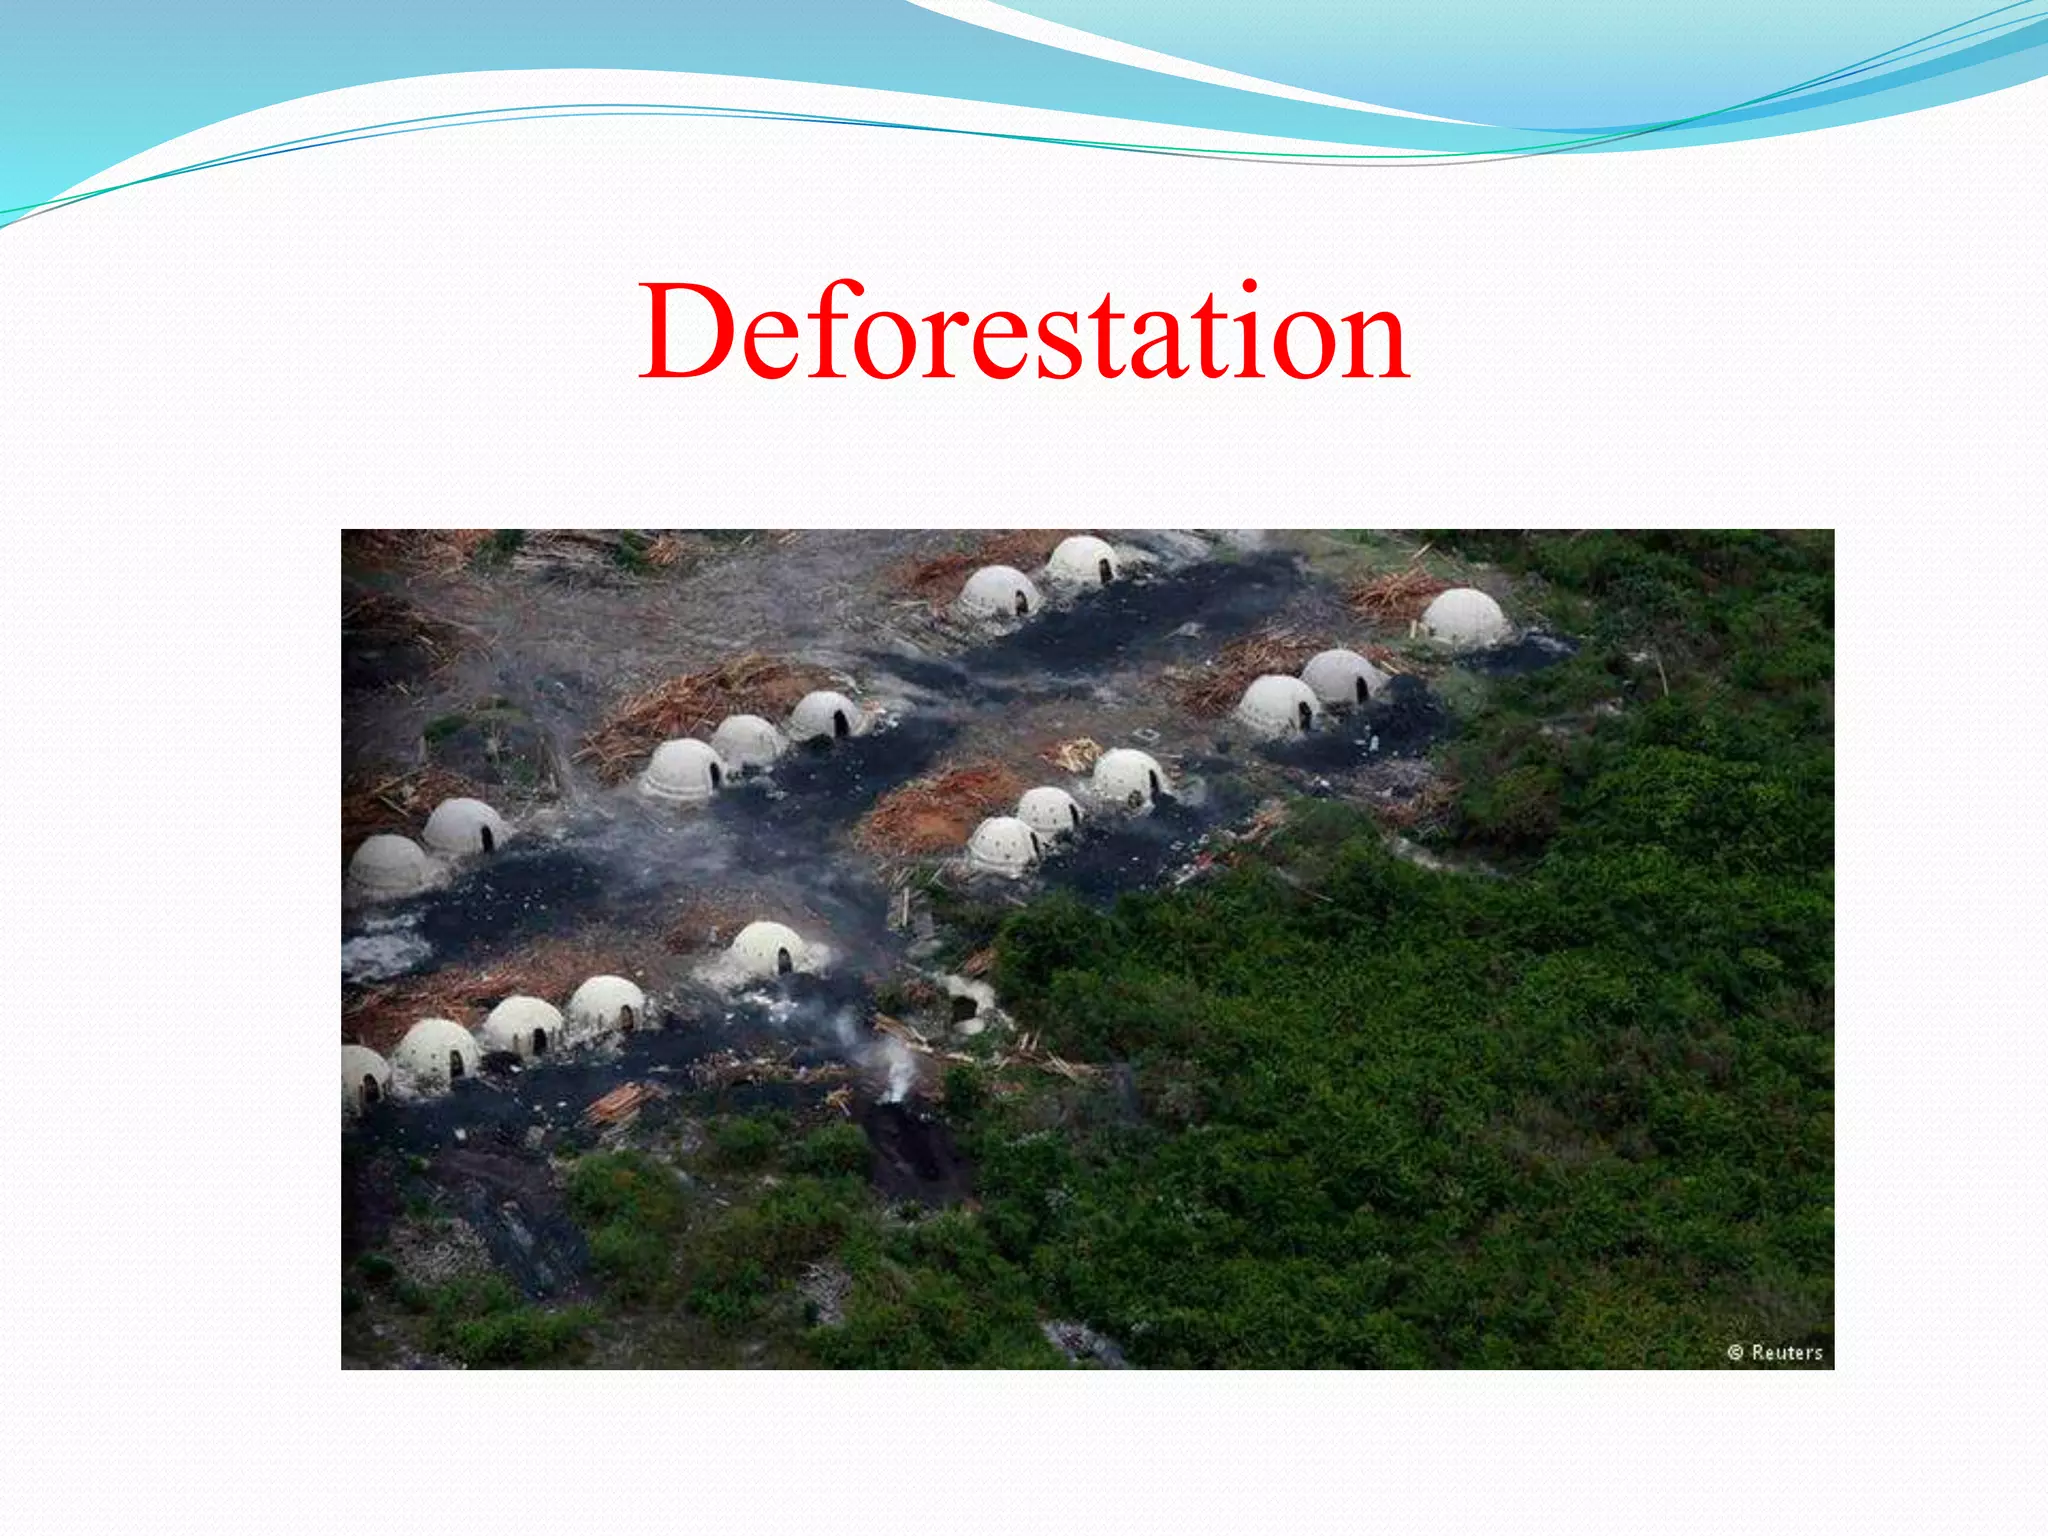
This document discusses several major current environmental issues: 1) Pollution, population growth, global warming, waste disposal, climate change, and other issues are negatively impacting the environment. 2) Increased carbon dioxide in the atmosphere from human activities is causing global warming. As the planet warms, glaciers and ice sheets are melting, sea levels are rising, and extreme weather events are becoming more frequent and severe. 3) Warming is also impacting ecosystems and biodiversity as species struggle to adapt to rapid climate change. Key environmental problems like pollution, overpopulation, and resource depletion exacerbate global warming if left unaddressed. Urgent action is needed to transition to renewable energy and more sustainable practices globally


![Global Warming P P T [97 03]](https://cdn.slidesharecdn.com/ss_thumbnails/globalwarmingppt97-03-090408023255-phpapp02-thumbnail.jpg?width=640&height=640&fit=bounds)


