Downloaded 505 times
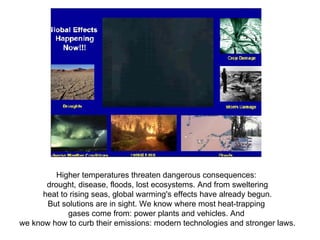
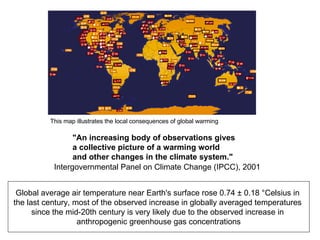
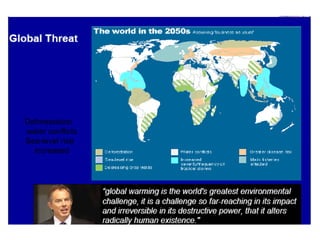
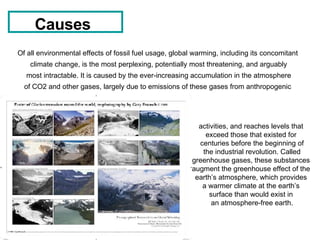
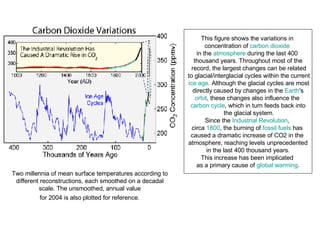
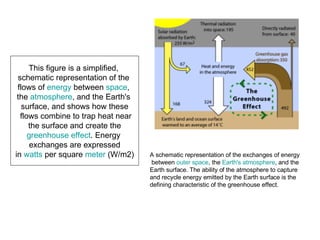
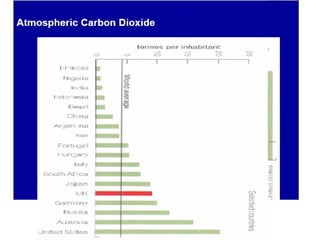
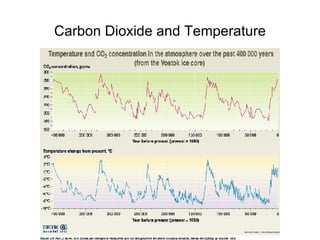
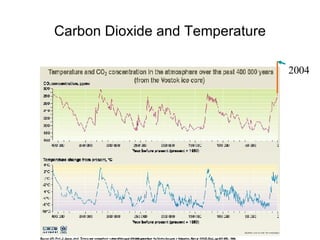
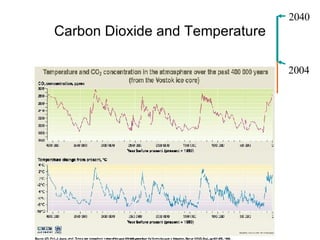
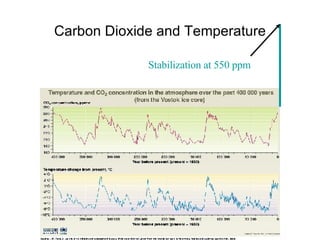
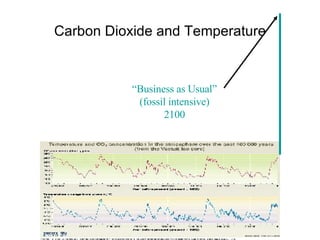
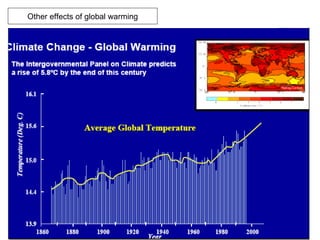

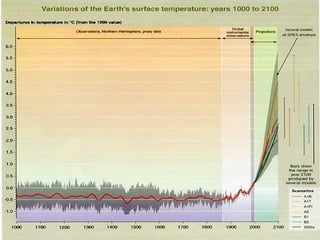
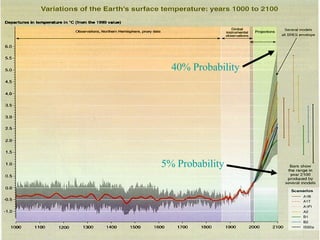
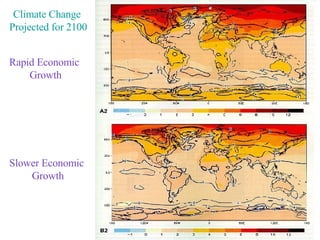


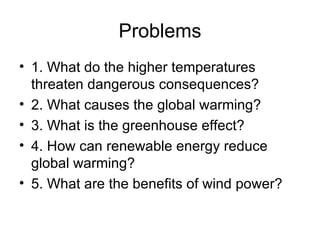

1. Higher temperatures from global warming threaten dangerous consequences like drought, disease, floods, and lost ecosystems. 2. The accumulation of greenhouse gases like CO2 in the atmosphere from human activities like burning fossil fuels is causing global warming by enhancing the greenhouse effect. 3. The greenhouse effect is the rise in temperature that occurs because greenhouse gases in the atmosphere trap heat from the sun, creating a warmer climate than if the Earth's atmosphere was absent.