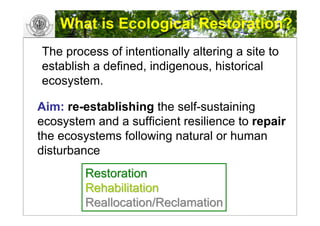
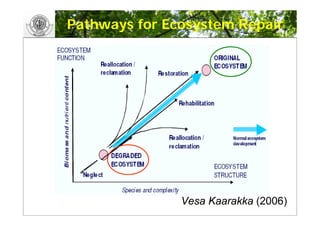
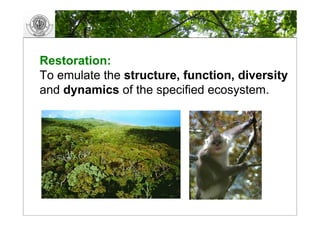
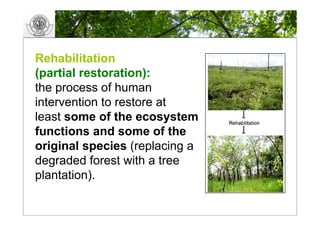
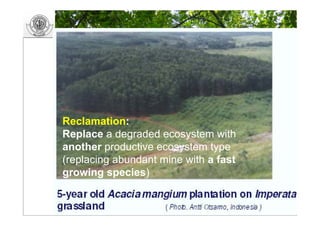
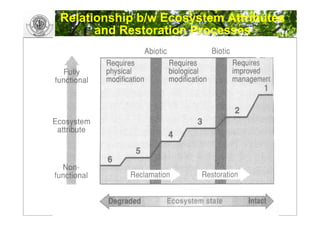
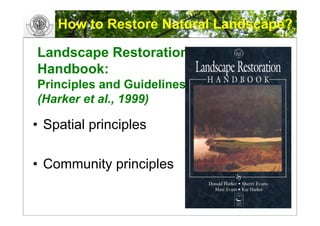
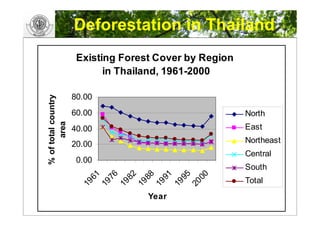
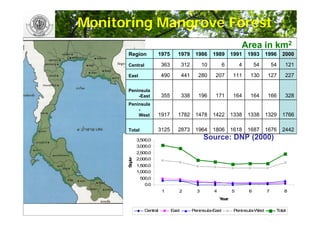
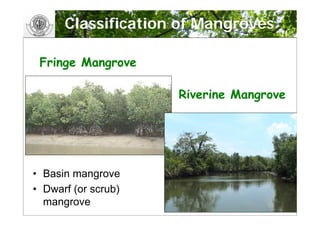
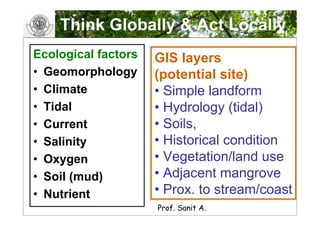
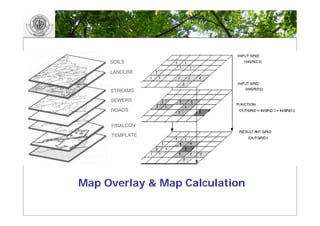
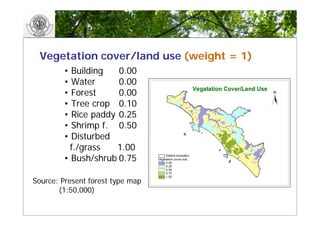
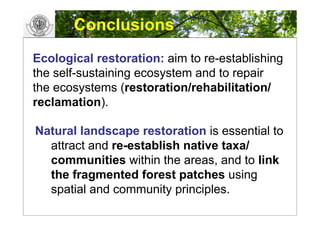
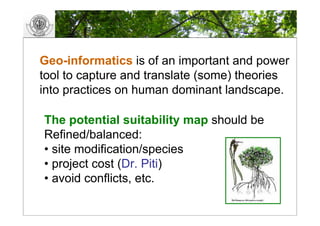
This document proposes a methodology framework for restoring natural mangrove diversity using geo-informatics. It begins by defining ecological restoration, rehabilitation, and reclamation. It then discusses landscape ecology concepts and the importance of restoring natural landscapes. Next, it reviews the decline of mangrove forests in Thailand due to human and natural causes. Finally, it presents a conceptual framework for applying geo-informatics tools like remote sensing, GIS and GPS to monitor mangrove forests and identify suitable sites for restoration based on ecological factors that can be represented as spatial data layers. The goal is to emulate the structure, function and dynamics of the original mangrove ecosystem.
Land Use and Land Cover change monitoring of Surajpur Wetland, Uttar Pradesh:...Arnab Saha
Abstract:
Wetlands are extremely important areas throughout the world for wildlife protection, recreation, sediment control and flood prevention. Wetlands are important bird’s habitats and birds use them for feeding, roosting, nesting and rearing their young. In Surajpur Wetland are mainly used for agriculture, fisheries, reclamation for harboring and irrigation purposes. In this paper an attempt is made to study the changes in land use and land cover in Surajpur wetland area over 11 years’ period (2003-2014). LULC is an important component in understanding the interactions of the human activities with the environment and thus it is necessary to be able to simulate changes. The land cover mapping of study area was attempted using remotely sensed images of Landsat and Google Earth imagery. The study area was classified into five categories on the basis of field study, geographical conditions, and remote sensing data. LULC changes have been detected by image processing method in EDRAS imagine 2014 and ArcGIS 10.3. The eleven years’ time period of 2003-2014 shows the major type of land use change. Vegetation area that occupied about around 60 per cent of the Surajpur wetland area in 2003 has decreased to 34.25 percent in 2014. Wetland is increased 8.17 percent and Urban area, Fallow land and Water body also have experienced change. Finally, through the work it is recommended that the wetlands need detail mapping through the use of advance remote sensing techniques like microwave and LIDAR for restoration and management of wetland.
Keywords: LULC, ArcGIS, Surajpur, ERDAS, Remote Sensing
LAND USE /LAND COVER CLASSIFICATION AND CHANGE DETECTION USING GEOGRAPHICAL I...IAEME Publication
Land use and land cover change has become a central component in current strategies for managing natural resources and monitoring environmental changes. Geographical information system and image processing techniques used for the analysis of land use/land cover and change detection of Sukhana Basin of Aurangabad District, Maharashtra state. The tools used ArcGIS10.1 and ERDAS IMAGINE9.1, landsat images of 1996, 2003and 2014. From land use / land cover change detection it is found that during 1996-2014, water bodies cover have loss of 4 Sq. Km. Barren land have 146 Sq.Km. loss and forest area with 96 Sq.Km. loss. It is found that urbanization area has gain of 51 Sq.Km. and agricultural land cover also have gain of 195 Sq.Km.
Remote Sensing: Normalized Difference Vegetation Index (NDVI)Kamlesh Kumar
The Normalized Difference Vegetation Index (NDVI) is a numerical indicator that uses the visible and near-infrared (NIR) bands of the electromagnetic spectrum to analyze whether the target (image) being observed contains green vegetation or not. Healthy vegetation (chlorophyll) reflects more near-infrared (NIR) and green light compared to other wavelengths. But it absorbs more red and blue light. This is why our eyes see vegetation as the colour green. If we could see near-infrared, then it would be strong for vegetation too.
It is basically measured through the use of Intensity, Hue and saturation of an image and through pixels as well.
The density of vegetation (NDVI) at a certain point on the image is equal to the difference in the intensities of reflected light in the red and infrared range divided by the sum of these intensities.
푁퐷푉퐼=((푁퐼푅−푅퐸퐷))/((푁퐼푅+푅퐸퐷))
The result of this formula generates a value between -1 and +1. If you have low reflectance (low values) in the red band and high reflectance in the NIR, this will yield a high NDVI value. And vice versa.
Making FCC Erdas from AWiFS/LISS-III individual bands dataSonal Aggarwal
This presentation shows how to make False Color composite (FCC) in Erdas from AWiFS/LISS-III individual bands data. AWiFS/LISS-III data can be obtained through NRSC Open EO Data Archive (NOEDA) in Bhuvan website.
Application of remote sensing in forest ecosystemaliya nasir
Established remote sensing systems provide opportunities to develop and apply new measurements of ecosystem function across landscapes, regions and continents.
New efforts to predict the consequences of ecosystem function change, both natural and human- induced, on the regional and global distributions and abundances of species should be a high research priority
REMOTE SENSING A VERY USEFUL TECHNOLOGY TO MANKINDkaushikakumar
Hi! I am Kaushika i have given a clear explanation about remotesensing and its types.I have aso explained about the advantages of remote sensing technology.I hope it will be very useful for u.
The changing geospatial landscape by Lyzi Diamondgarrjacobs
GIS is extremely powerful, but the language of maps can be confusing. Join us to discuss how we can effectively communicate within City Hall to build enthusiasm for mapping. We will explore some of the latest techniques for web mapping and spatial analysis.
The sheer number of tools beyond ArcGISDesktop can be intimidating. Where do you start? By learning the vocabulary and the landscape of geospatial technology, we can start to pick the best tools for the work we're seeking to accomplish and adequately assess which particular one is best for any given job.
The new method of solid 3d modelling presented in this study allows new statistical perspectives for archaeological, geophysical and geochemical records in a 3D GIS environment. The micro-scale analysis investigates archaeological excavation trenches of the West Porticus in Ostia.
Transition of the coastal landscape in Northern Norway: Using landscape approaches and GIS to understand local opposition to wind farms.
A thesis submitted to the Department of Geography, University of Leicester, UK
Master of Science 2006 in Human Geography and GIS
Nechisar park gis based conservation assesmentAsaye Nigussie
ANALYSIS OF LAND AND VEGETATION COVER DYNAMICS
USING REMOTE SENSING & GIS TECHINIQUES,A CASE
STUDY OF NECHISAR NATIONAL PARK
Abstract
The research aims to analyze the trend of land and vegetation cover dynamics over the period from 1976, 1986 2000 and 2007 thus examine the conservation status of the area and generate
up-to-date land cover map. Information is extracted from various Satellite images of multidated Landsat, ASTER and MODIS images. The Landsat images are the basic remote sensing data to generate the thematic maps which are further analyzed to show the cover dynamics in the park for 24years. All datas from the satellite images are processesed and analyzed using digital image processing techniques. Besides, different vector data are extracted from the images as well as other thematic maps. MODIS-NDVI images are analyzed for the different land cover classes and each vegetation cover seasonal response is compared for the year 2000 and 2005.
The land cover classes identified in the study area from 1976, 1986, 2000 and 2007 are water body, riparian and ground water (GW) forest, wood land, dense bush land, bushy shrubbed grass land, open grass land, degraded grass land, cultivated land, swamp vegetation and bare
land. Rate of land cover change and fragmentation of habitat were discussed for the different
land cover classes. Rate of land cover change, fragmentation index and land cover conversion
matrix clearly shows the dynamics of the different cover classes has happened for the past decades and generally the park conservation status is found to be poor. Bush encroachment in the study area is a major challenge to the park particularly for the grass land and overgrazing
on the Nechisar plain has caused expansion of invasive plants erosion and land degradation.
The community livelihood dependency both in the rural and urban setting is concluded and discussed as a challenge to the park from biodiversity conservation point of view.
Key Words: Land cover dynamics, National park, Vegetation cover, Remote sensing and GIS,
Habitat fragmentation, degradation, biodiversity conservation.
Sasumua: linking a landscape and institutional mosaic to climate change in KenyaCIFOR-ICRAF
Presentation by Meine van Noordwijk & Thomas Yatich, ICRAF
Landscape approaches to mitigation and adaptation, Forest Day 3
Sunday, 13 December 2009
Copenhagen, Denmark
Presentation by Dr. Meine van Noordwijk, World Agroforestry Centre (ICRAF) at Forest Day 3, 13 December 2009, Copenhagen. Learning event "Landscape approaches to Adaptation and Mitigation"
This presentation was presented during the Workshop on Soil Cabon Mapping of the Global Soil Partnership (GSP) that took place at FAO headquarters 23 November 2016. The presentation was made by Carlos Cruz-Gaistardo from the National Institute of Statistics and Geography, Mexico
Remote Sensing Methods for operational ET determinations in the NENA region, ...NENAwaterscarcity
Workshop on Operationalizing the Regional Collaborative Platform to Address ‘Water Consumption, Water Productivity and Drought Management’ in Agriculture, 27 - 29 October 2015, Cairo, Egypt
Transcript: Selling digital books in 2024: Insights from industry leaders - T...BookNet Canada
The publishing industry has been selling digital audiobooks and ebooks for over a decade and has found its groove. What’s changed? What has stayed the same? Where do we go from here? Join a group of leading sales peers from across the industry for a conversation about the lessons learned since the popularization of digital books, best practices, digital book supply chain management, and more.
Link to video recording: https://bnctechforum.ca/sessions/selling-digital-books-in-2024-insights-from-industry-leaders/
Presented by BookNet Canada on May 28, 2024, with support from the Department of Canadian Heritage.
UiPath Test Automation using UiPath Test Suite series, part 4DianaGray10
Welcome to UiPath Test Automation using UiPath Test Suite series part 4. In this session, we will cover Test Manager overview along with SAP heatmap.
The UiPath Test Manager overview with SAP heatmap webinar offers a concise yet comprehensive exploration of the role of a Test Manager within SAP environments, coupled with the utilization of heatmaps for effective testing strategies.
Participants will gain insights into the responsibilities, challenges, and best practices associated with test management in SAP projects. Additionally, the webinar delves into the significance of heatmaps as a visual aid for identifying testing priorities, areas of risk, and resource allocation within SAP landscapes. Through this session, attendees can expect to enhance their understanding of test management principles while learning practical approaches to optimize testing processes in SAP environments using heatmap visualization techniques
What will you get from this session?
1. Insights into SAP testing best practices
2. Heatmap utilization for testing
3. Optimization of testing processes
4. Demo
Topics covered:
Execution from the test manager
Orchestrator execution result
Defect reporting
SAP heatmap example with demo
Speaker:
Deepak Rai, Automation Practice Lead, Boundaryless Group and UiPath MVP
The Art of the Pitch: WordPress Relationships and SalesLaura Byrne
Clients don’t know what they don’t know. What web solutions are right for them? How does WordPress come into the picture? How do you make sure you understand scope and timeline? What do you do if sometime changes?
All these questions and more will be explored as we talk about matching clients’ needs with what your agency offers without pulling teeth or pulling your hair out. Practical tips, and strategies for successful relationship building that leads to closing the deal.
Epistemic Interaction - tuning interfaces to provide information for AI supportAlan Dix
Paper presented at SYNERGY workshop at AVI 2024, Genoa, Italy. 3rd June 2024
https://alandix.com/academic/papers/synergy2024-epistemic/
As machine learning integrates deeper into human-computer interactions, the concept of epistemic interaction emerges, aiming to refine these interactions to enhance system adaptability. This approach encourages minor, intentional adjustments in user behaviour to enrich the data available for system learning. This paper introduces epistemic interaction within the context of human-system communication, illustrating how deliberate interaction design can improve system understanding and adaptation. Through concrete examples, we demonstrate the potential of epistemic interaction to significantly advance human-computer interaction by leveraging intuitive human communication strategies to inform system design and functionality, offering a novel pathway for enriching user-system engagements.
Slack (or Teams) Automation for Bonterra Impact Management (fka Social Soluti...Jeffrey Haguewood
Sidekick Solutions uses Bonterra Impact Management (fka Social Solutions Apricot) and automation solutions to integrate data for business workflows.
We believe integration and automation are essential to user experience and the promise of efficient work through technology. Automation is the critical ingredient to realizing that full vision. We develop integration products and services for Bonterra Case Management software to support the deployment of automations for a variety of use cases.
This video focuses on the notifications, alerts, and approval requests using Slack for Bonterra Impact Management. The solutions covered in this webinar can also be deployed for Microsoft Teams.
Interested in deploying notification automations for Bonterra Impact Management? Contact us at sales@sidekicksolutionsllc.com to discuss next steps.
Smart TV Buyer Insights Survey 2024 by 91mobiles.pdf91mobiles
91mobiles recently conducted a Smart TV Buyer Insights Survey in which we asked over 3,000 respondents about the TV they own, aspects they look at on a new TV, and their TV buying preferences.
LF Energy Webinar: Electrical Grid Modelling and Simulation Through PowSyBl -...DanBrown980551
Do you want to learn how to model and simulate an electrical network from scratch in under an hour?
Then welcome to this PowSyBl workshop, hosted by Rte, the French Transmission System Operator (TSO)!
During the webinar, you will discover the PowSyBl ecosystem as well as handle and study an electrical network through an interactive Python notebook.
PowSyBl is an open source project hosted by LF Energy, which offers a comprehensive set of features for electrical grid modelling and simulation. Among other advanced features, PowSyBl provides:
- A fully editable and extendable library for grid component modelling;
- Visualization tools to display your network;
- Grid simulation tools, such as power flows, security analyses (with or without remedial actions) and sensitivity analyses;
The framework is mostly written in Java, with a Python binding so that Python developers can access PowSyBl functionalities as well.
What you will learn during the webinar:
- For beginners: discover PowSyBl's functionalities through a quick general presentation and the notebook, without needing any expert coding skills;
- For advanced developers: master the skills to efficiently apply PowSyBl functionalities to your real-world scenarios.
Dev Dives: Train smarter, not harder – active learning and UiPath LLMs for do...UiPathCommunity
💥 Speed, accuracy, and scaling – discover the superpowers of GenAI in action with UiPath Document Understanding and Communications Mining™:
See how to accelerate model training and optimize model performance with active learning
Learn about the latest enhancements to out-of-the-box document processing – with little to no training required
Get an exclusive demo of the new family of UiPath LLMs – GenAI models specialized for processing different types of documents and messages
This is a hands-on session specifically designed for automation developers and AI enthusiasts seeking to enhance their knowledge in leveraging the latest intelligent document processing capabilities offered by UiPath.
Speakers:
👨🏫 Andras Palfi, Senior Product Manager, UiPath
👩🏫 Lenka Dulovicova, Product Program Manager, UiPath
GDG Cloud Southlake #33: Boule & Rebala: Effective AppSec in SDLC using Deplo...James Anderson
Effective Application Security in Software Delivery lifecycle using Deployment Firewall and DBOM
The modern software delivery process (or the CI/CD process) includes many tools, distributed teams, open-source code, and cloud platforms. Constant focus on speed to release software to market, along with the traditional slow and manual security checks has caused gaps in continuous security as an important piece in the software supply chain. Today organizations feel more susceptible to external and internal cyber threats due to the vast attack surface in their applications supply chain and the lack of end-to-end governance and risk management.
The software team must secure its software delivery process to avoid vulnerability and security breaches. This needs to be achieved with existing tool chains and without extensive rework of the delivery processes. This talk will present strategies and techniques for providing visibility into the true risk of the existing vulnerabilities, preventing the introduction of security issues in the software, resolving vulnerabilities in production environments quickly, and capturing the deployment bill of materials (DBOM).
Speakers:
Bob Boule
Robert Boule is a technology enthusiast with PASSION for technology and making things work along with a knack for helping others understand how things work. He comes with around 20 years of solution engineering experience in application security, software continuous delivery, and SaaS platforms. He is known for his dynamic presentations in CI/CD and application security integrated in software delivery lifecycle.
Gopinath Rebala
Gopinath Rebala is the CTO of OpsMx, where he has overall responsibility for the machine learning and data processing architectures for Secure Software Delivery. Gopi also has a strong connection with our customers, leading design and architecture for strategic implementations. Gopi is a frequent speaker and well-known leader in continuous delivery and integrating security into software delivery.
Software Delivery At the Speed of AI: Inflectra Invests In AI-Powered QualityInflectra
In this insightful webinar, Inflectra explores how artificial intelligence (AI) is transforming software development and testing. Discover how AI-powered tools are revolutionizing every stage of the software development lifecycle (SDLC), from design and prototyping to testing, deployment, and monitoring.
Learn about:
• The Future of Testing: How AI is shifting testing towards verification, analysis, and higher-level skills, while reducing repetitive tasks.
• Test Automation: How AI-powered test case generation, optimization, and self-healing tests are making testing more efficient and effective.
• Visual Testing: Explore the emerging capabilities of AI in visual testing and how it's set to revolutionize UI verification.
• Inflectra's AI Solutions: See demonstrations of Inflectra's cutting-edge AI tools like the ChatGPT plugin and Azure Open AI platform, designed to streamline your testing process.
Whether you're a developer, tester, or QA professional, this webinar will give you valuable insights into how AI is shaping the future of software delivery.
When stars align: studies in data quality, knowledge graphs, and machine lear...
GIS and landscape Restoration
1. APPLICATION OF GEO-INFORMATICS FOR
RESTORING NATURAL MANGROVE DIVERSITY:
A METHODOLOGY FRAMEWORK
Yongyut TRISURAT
Department of Forest Biology
Faculty of Forestry, Kasetsart University
Bangkok, Thailand
http://pirun.ku.ac.th/~fforyyt
3. What is Ecological Restoration?
The process of intentionally altering a site to
establish a defined, indigenous, historical
ecosystem.
Aim: re-establishing the self-sustaining
ecosystem and a sufficient resilience to repair
the ecosystems following natural or human
disturbance
Restoration
Rehabilitation
Reallocation/Reclamation
6. Rehabilitation
(partial restoration):
the process of human
intervention to restore at
least some of the ecosystem
functions and some of the
original species (replacing a
degraded forest with a tree
plantation).
7. Reclamation:
Replace a degraded ecosystem with
another productive ecosystem type
(replacing abundant mine with a fast
growing species)
9. Ecosystem Attributes & Ambition
Attributes Reclam. Rehab. Restor.
Characteristic assemblage of species - - +
Indigenous species - - +
All functional tropic groups - - +
Normal functioning of cycles - + +
Appropriate physical environment + + +
Integrated into a larger landscape + + -
External threats eliminated or reduced + + -
Resilience to perturbation (disturbance) + + -
Self-sustaining + - -
+ Suitable; - Not suitable
10. What is Landscape?
A landscape is an area that is spatially
heterogeneous in at least one factor of
interest.
A landscape is a contiguous area, intermediate
in size between an ecoregion and a site, with a
specific of ecological, cultural and socio-
economic characteristics distinct from its
neighbors.
13. What is landscape ecology?
Emerging science (Ecology + Geography):
• interaction between spatial pattern and
ecological process
• causes and consequent effects of spatial
and heterogeneity across a range of scale
• combined the spatial approach of
geographer with the functional approach
of ecologist
14. Natural Landscape Rest. Matter!
1. Attract and re-establish native animals
within the areas
• Native tree specie will maximize the diversity of
natural communities
2. Current scientific methods do not truly
understand relationships and individual
species (man-made vs natural)
• To ensure that the requirements of individual
species are met.
15. How to Restore Natural Landscape?
Landscape Restoration
Handbook:
Principles and Guidelines
(Harker et al., 1999)
• Spatial principles
• Community principles
16. Spatial Principles
1. Large areas of natural communities
sustain more species than small areas
2. Many small patches of natural
communities in an area will help sustain
regional diversity
3. The shape of a
nature community
patch is as
important as
the size Species – area curve
17. Spatial Principles
4. Fragmentation of habitats, communities
and ecosystems reduces diversity
5. Isolated patches of natural communities
sustain fewer species than closely
associated patches
6. Species diversity in patches of natural
communities connected by corridors is
greater than that of disconnected patches
19. Spatial Principles
7. A heterogeneous mosaic of natural
community types sustains more species
and is more likely to support rare species
than a single homogeneous community
8. Ecotones between natural communities
are natural and support a variety of
species from both communities and
species specific to the ecotone
20. Community Principles
1. Full restoration of native plant
communities sustains divers wildlife
populations
2. An increase in the structural diversity
of vegetation increase species diversity
3. A high diversity of plant species
assures a year-round food supply for the
greatest diversity of wildlife
21. Community Principles
4. Species survival depends on maintaining
minimum (viable) population levels
5. Low intensity land
management sustains
more species and
costs less than high
intensity mgt.
Bighorn sheep
22. Metapopulation
A. clear-cutting
B. New proposed
Practices –
structural diversity
Sink Source
Logging & New Forestry Practice
23. Deforestation in Thailand
Existing Forest Cover by Region
in Thailand, 1961-2000
80.00
% of total country
60.00 North
area
East
40.00
Northeast
20.00
Central
0.00
South
61
76
82
88
91
95
00
Total
19
19
19
19
19
19
20 Year
25. Causes of Deforestation
Human
• Dredging
• Urban development
• Water pollution
• Mariculture
(Shrimp farm)
Natural
•Hurricane
•Tsunami
26. Geo-informatics – 3-S Technologies
For Monitoring Mangrove Forest
Remote Sensing
“Science and art of obtaining
information about an object,
area, or phenomenon
through the analysis of data
acquired by a device that is
not in contact with the
object, area, or phenomenon
under investigation”
28. Global Positioning
System (GPS)
A satellite-based system +
that provides locational
information anytime,
anywhere.
• Space component
• Control component
• User component
29. Monitoring Mangrove Forest
Area in km2
Region 1975 1979 1986 1989 1991 1993 1996 2000
363 312 10 6 4 54 54 121
Central
490 441 280 207 111 130 127 227
East
Peninsula
355 338 196 171 164 164 166 328
-East
Peninsula
-
1917 1782 1478 1422 1338 1338 1329 1766
West
3125 2873 1964 1806 1618 1687 1676 2442
Total
Source: DNP (2000)
3,500.0
3,000.0
2,500.0
Sq.km
2,000.0
1,500.0
1,000.0
500.0
0.0
1 2 3 4 5 6 7 8
Year
Central East Peninsula-East Peninsula-West Total
30. Geo-informatics Application
for Landscape Restoration
1. Landscape modeling for Everglades Ecosystem
Restoration (DeAngelis et al., 1998) Ecosystem
2. Modeling the suitability of potential wetland
mitigation sites with a geographic information
system (Lonkhuyzen et al., 2004) Env. Mgt.
3. A landscape connectivity index for assessing
desertification: a case study of Minqin Country,
China (Sun et al., 2006) Landscape Ecology
31. Translating Theories to Practices
Restoring Degraded Mangrove
Forest, Chataburi Province
1975
1990
34. Define Objectives
Processes of
Grid-Based Modeling Develop GIS Database
ArcView 3.2 & Convert Vector to Raster
Spatial Analyst
Spatial Analysis Function
Map Reclassify/Coding
Map Calculate
MAP OUTPUT Map Reclassify
35. Weighted Geometric Analysis
wi) 1/∑wi
Suit. = (∑ SIi
Where
SIi = Suitability index score for variable I
(0.00 – 1.00)
wi = Weight given to variable i
(1 – 3)
Experts judgments
38. Hydroperiod
Type (Weight = 3) Suit
Inundated by all high tide
(<2.0 m) 1.00
Inundated by medium tide
(2 - 3 m) 0.75
Inundated by normal high
tide (3-4 m) 0.50
Inundated by spring tide or
equinoctial tide (4-5 m) 0.25
0.10
Upland
Source: Topo. map (1:50,000)
47. Conclusions
Ecological restoration: aim to re-establishing
the self-sustaining ecosystem and to repair
the ecosystems (restoration/rehabilitation/
reclamation).
Natural landscape restoration is essential to
attract and re-establish native taxa/
communities within the areas, and to link
the fragmented forest patches using
spatial and community principles.
48. Geo-informatics is of an important and power
tool to capture and translate (some) theories
into practices on human dominant landscape.
The potential suitability map should be
Refined/balanced:
• site modification/species
• project cost (Dr. Piti)
• avoid conflicts, etc.
49. Recommended Readings
1. Harker, D., Evans, S., Evans M., and Haeker, K.
1999. Landscape Restoration Handbook (2nd Ed.)
Lewis Publishers, London.
2. Theobald, D.M. 2005. GIS Concepts and ArcGIS
Methods (2nd Ed.). Environmental Systems
Research Institute, Inc., Colorado.