
Download as PDF, PPTX

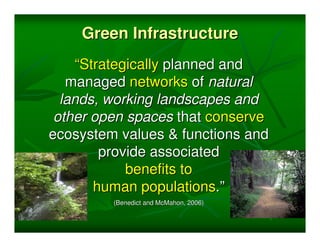
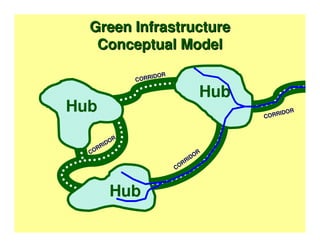
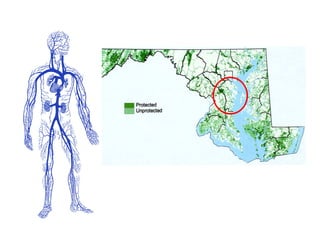
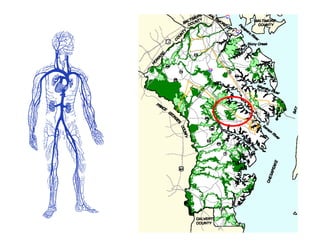
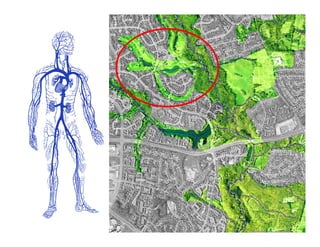
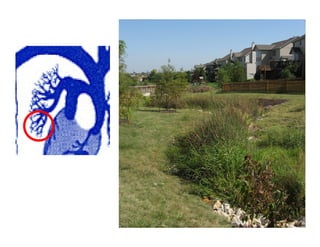
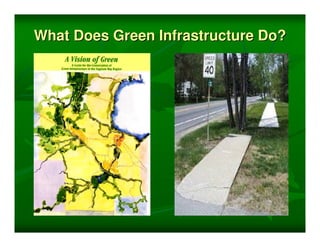
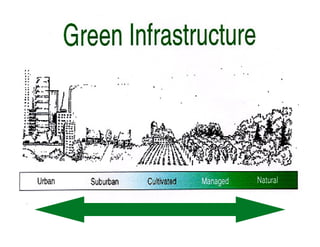
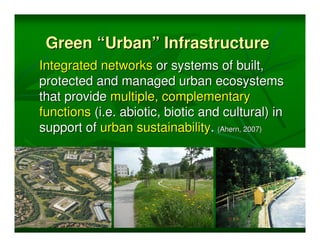
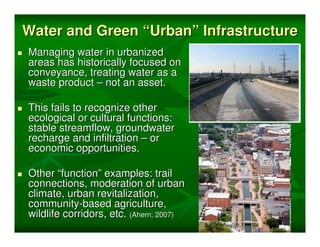
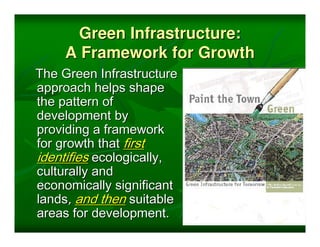
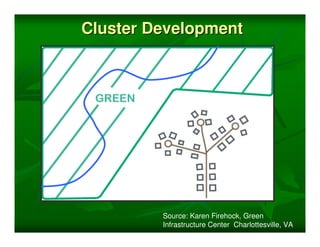
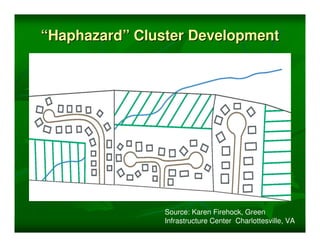
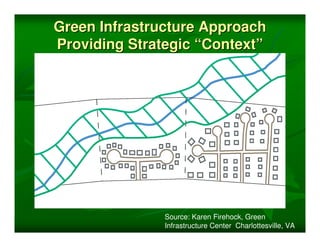
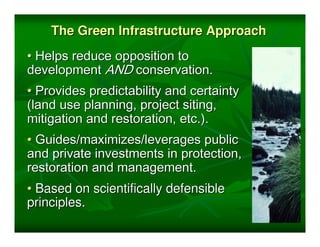
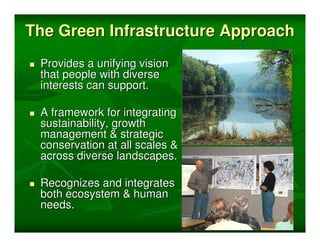
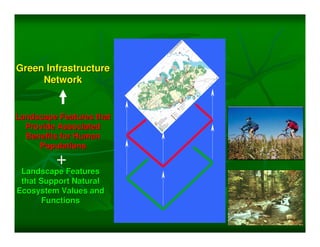


This document discusses green infrastructure and its role in creating sustainable communities. It defines green infrastructure as strategically planned and managed networks of natural lands, working landscapes and other open spaces that conserve ecosystem values and functions while providing benefits to human populations. These networks help guide development, protect important natural areas, and maintain ecological processes at a landscape scale. The green infrastructure approach provides a framework that considers both environmental and human needs and can help integrate conservation and growth.


