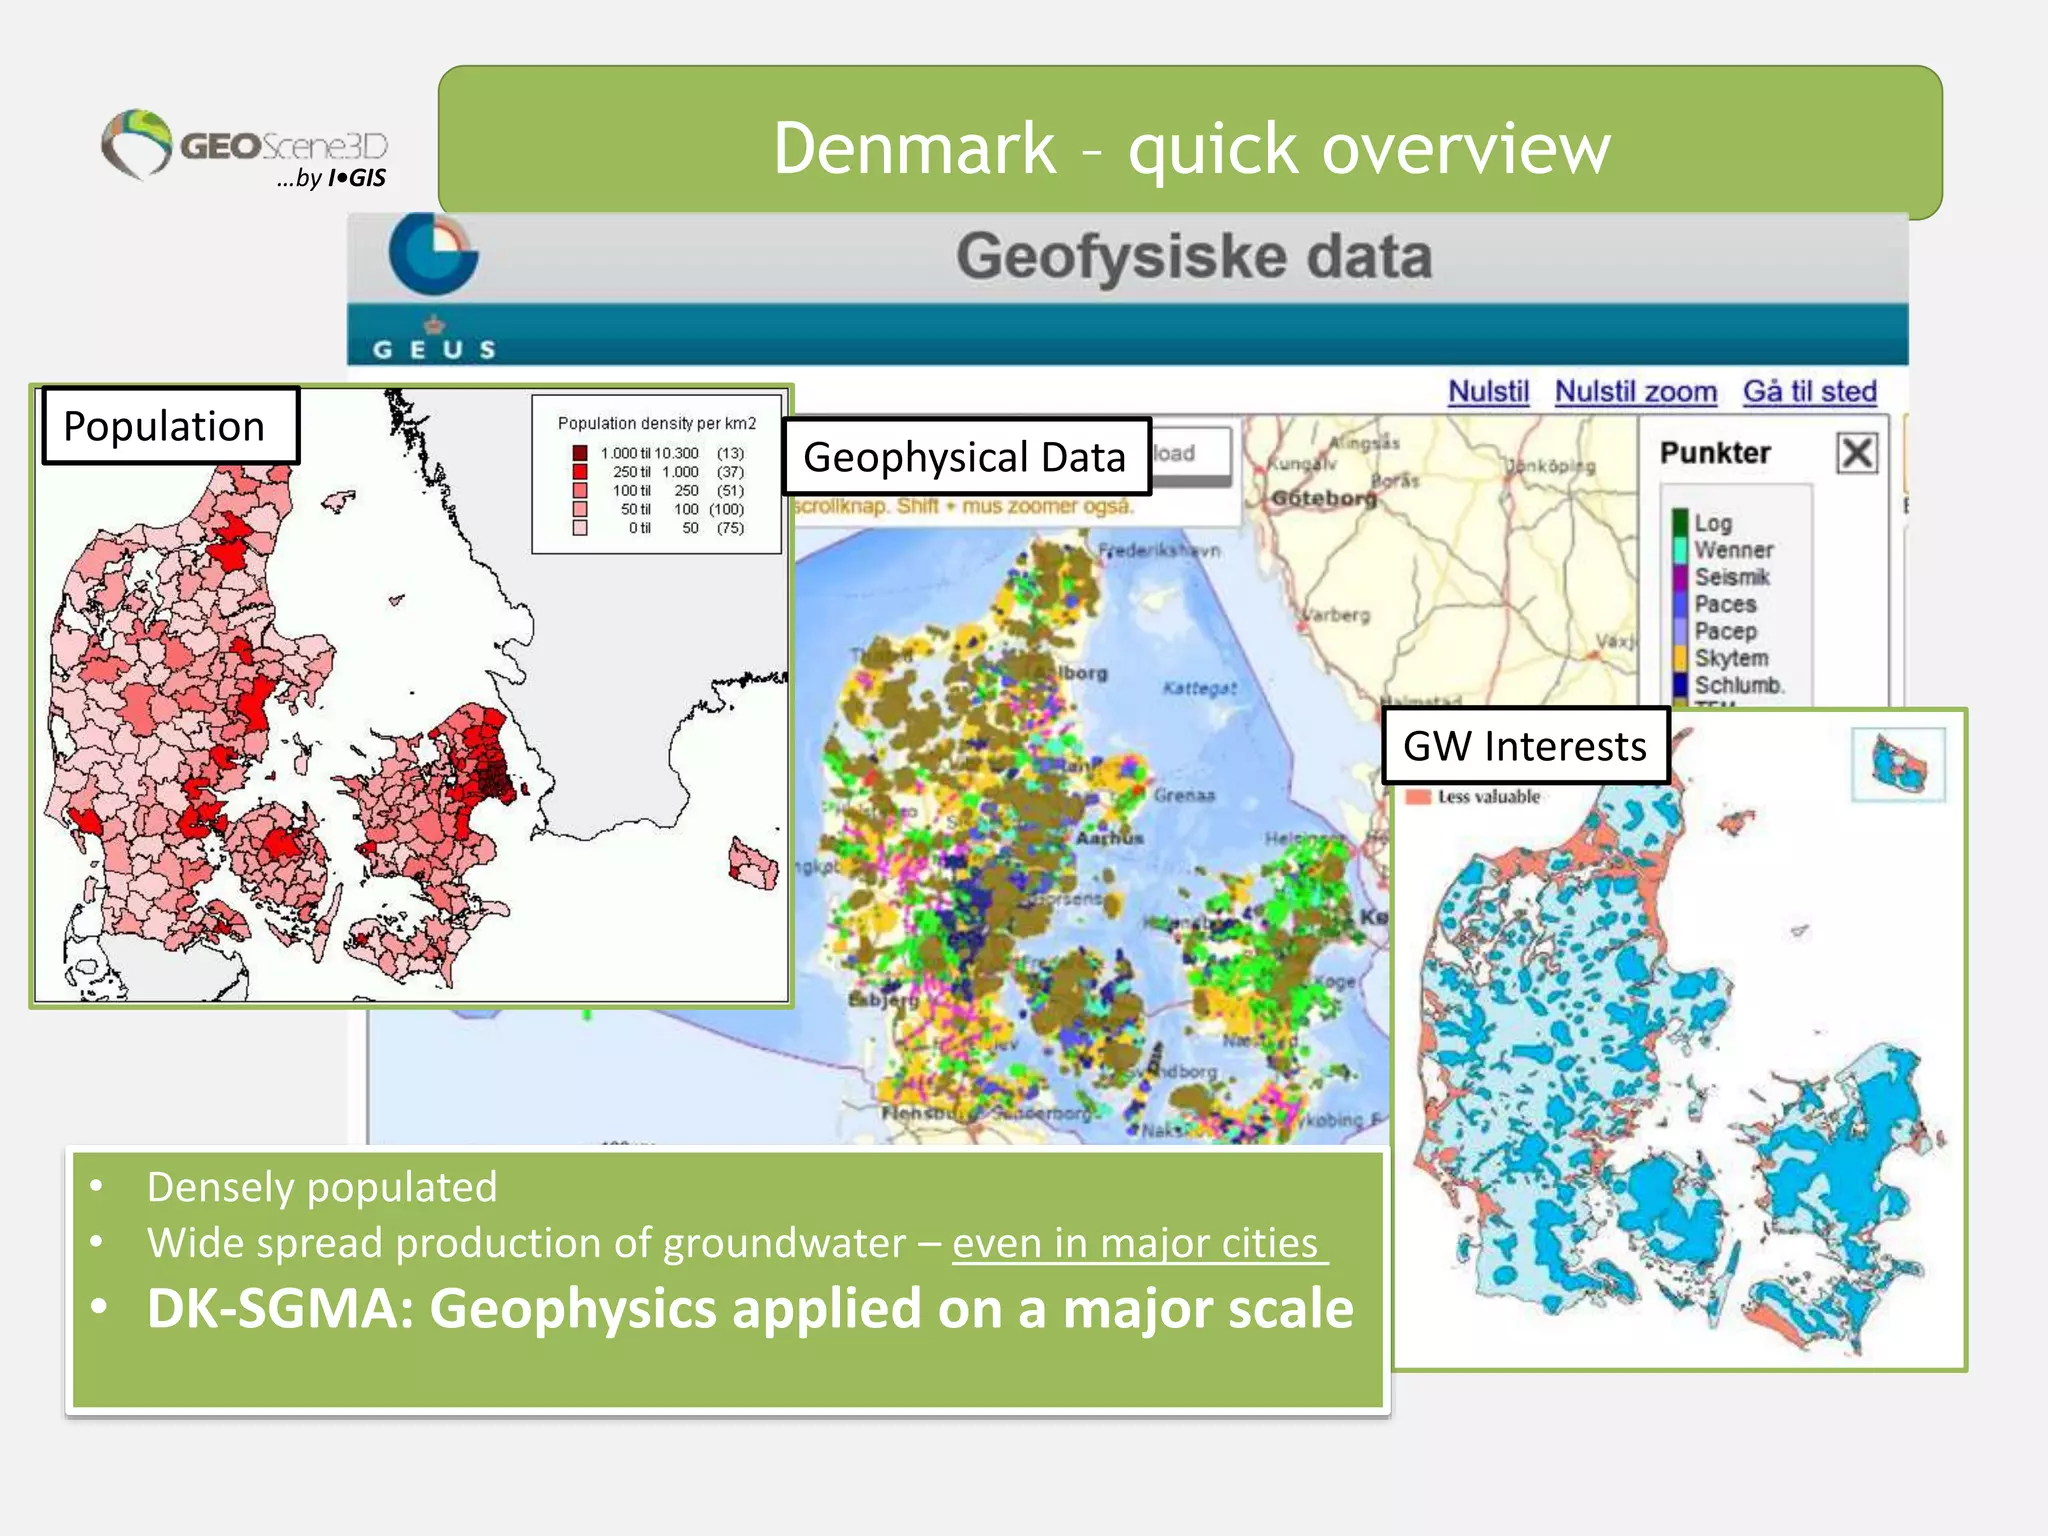
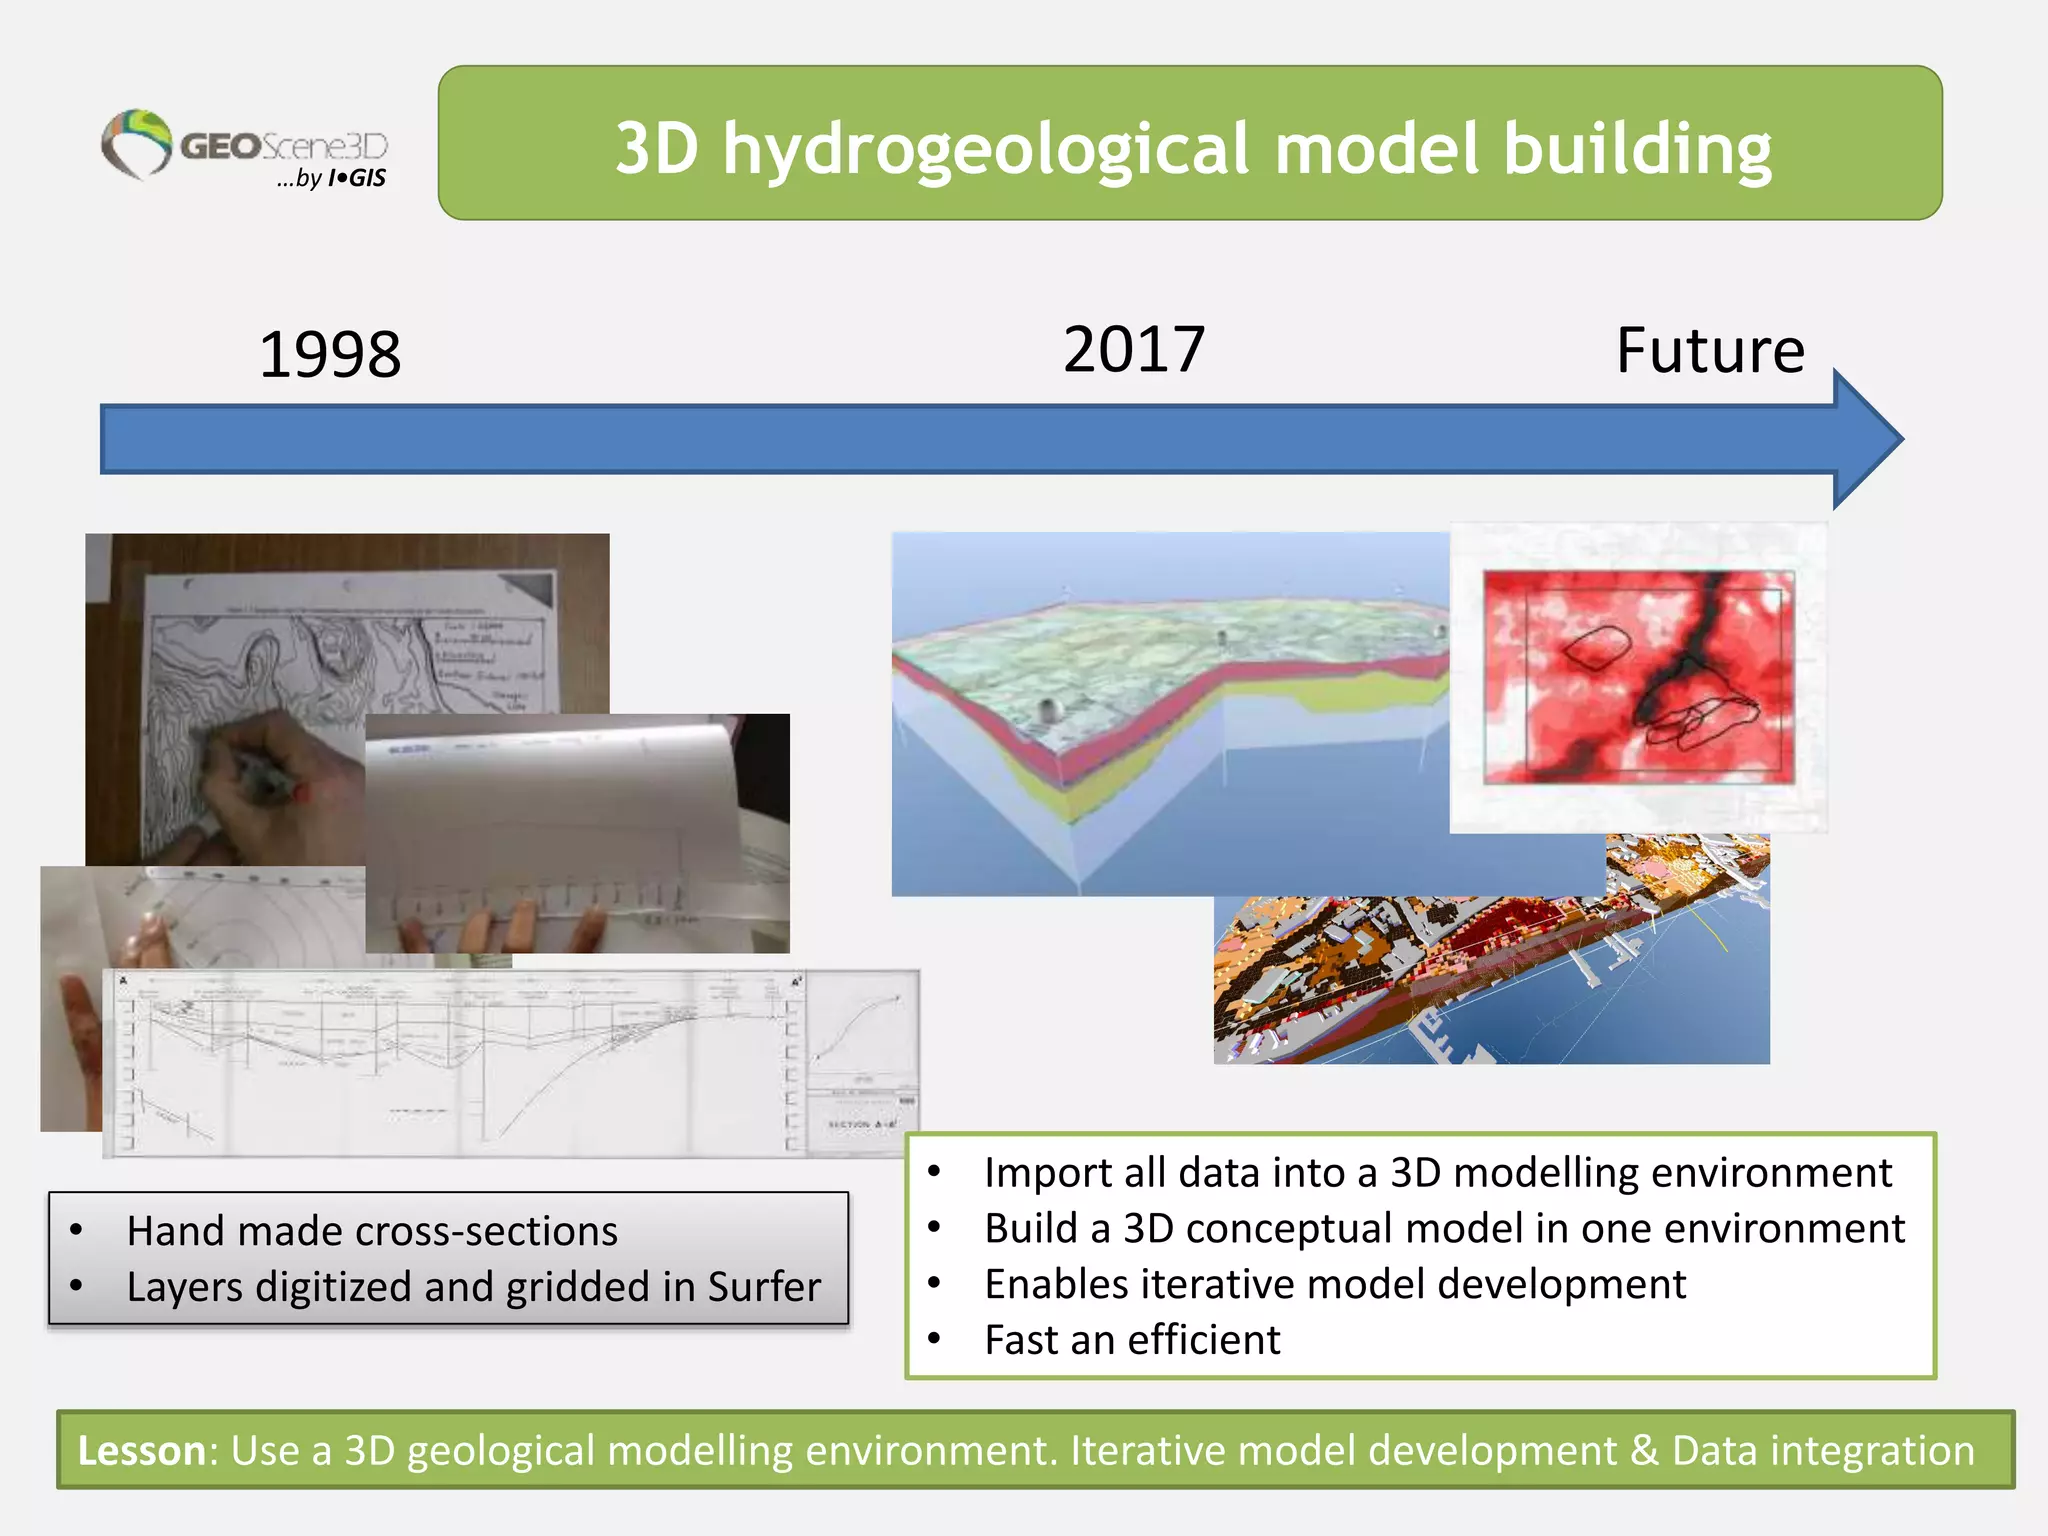
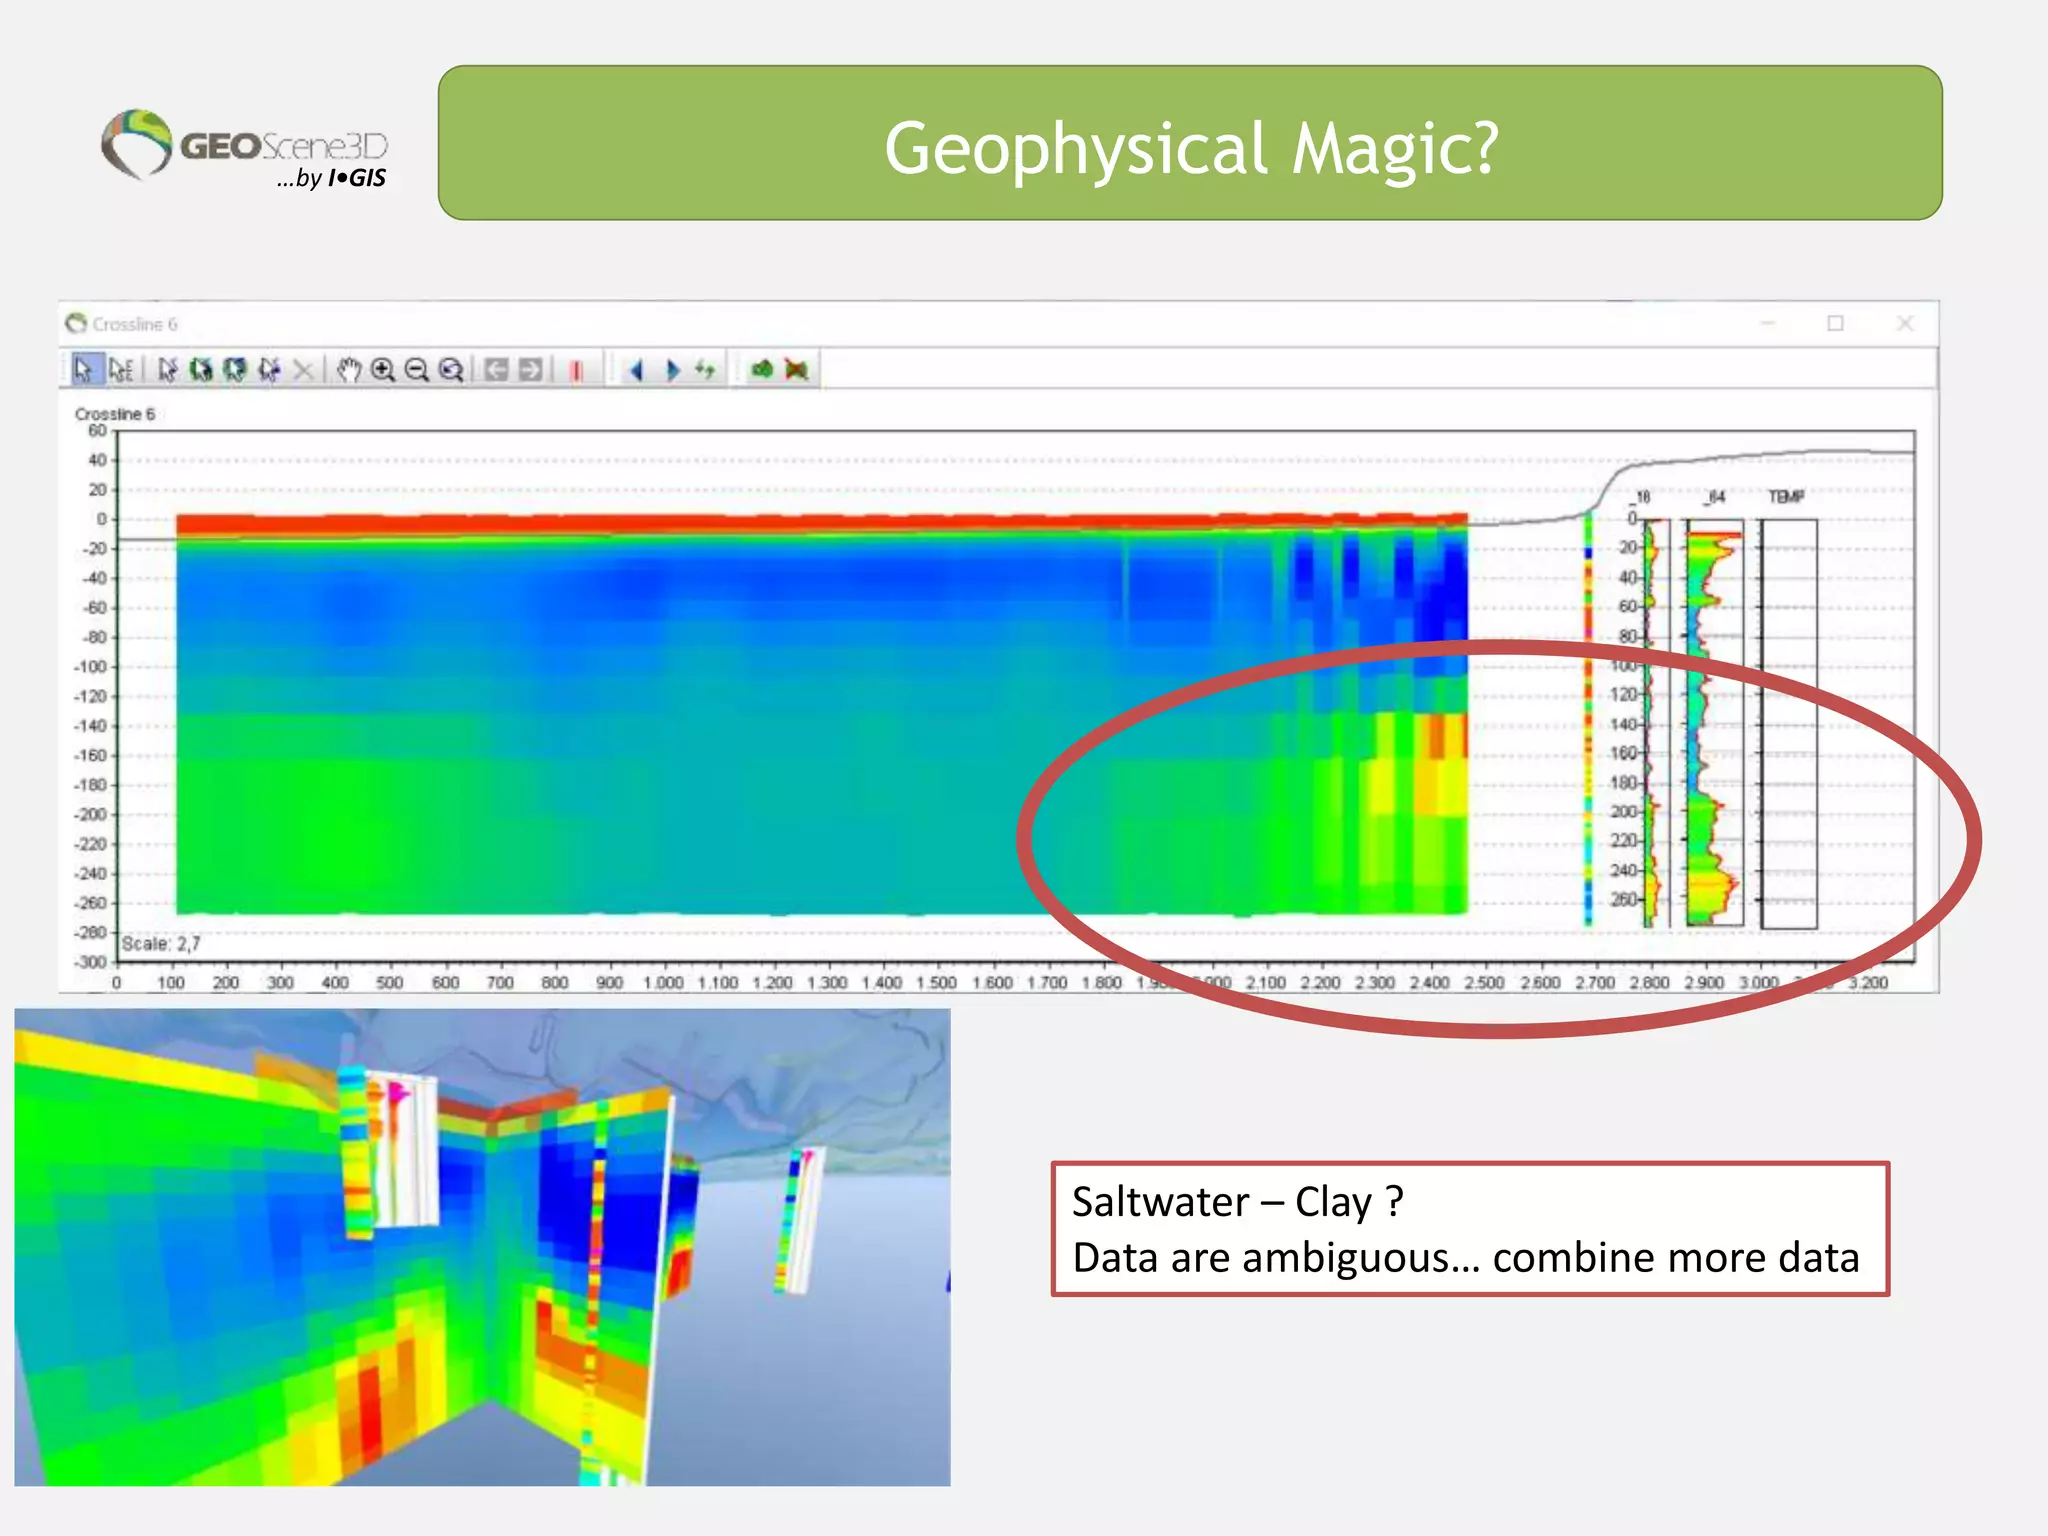
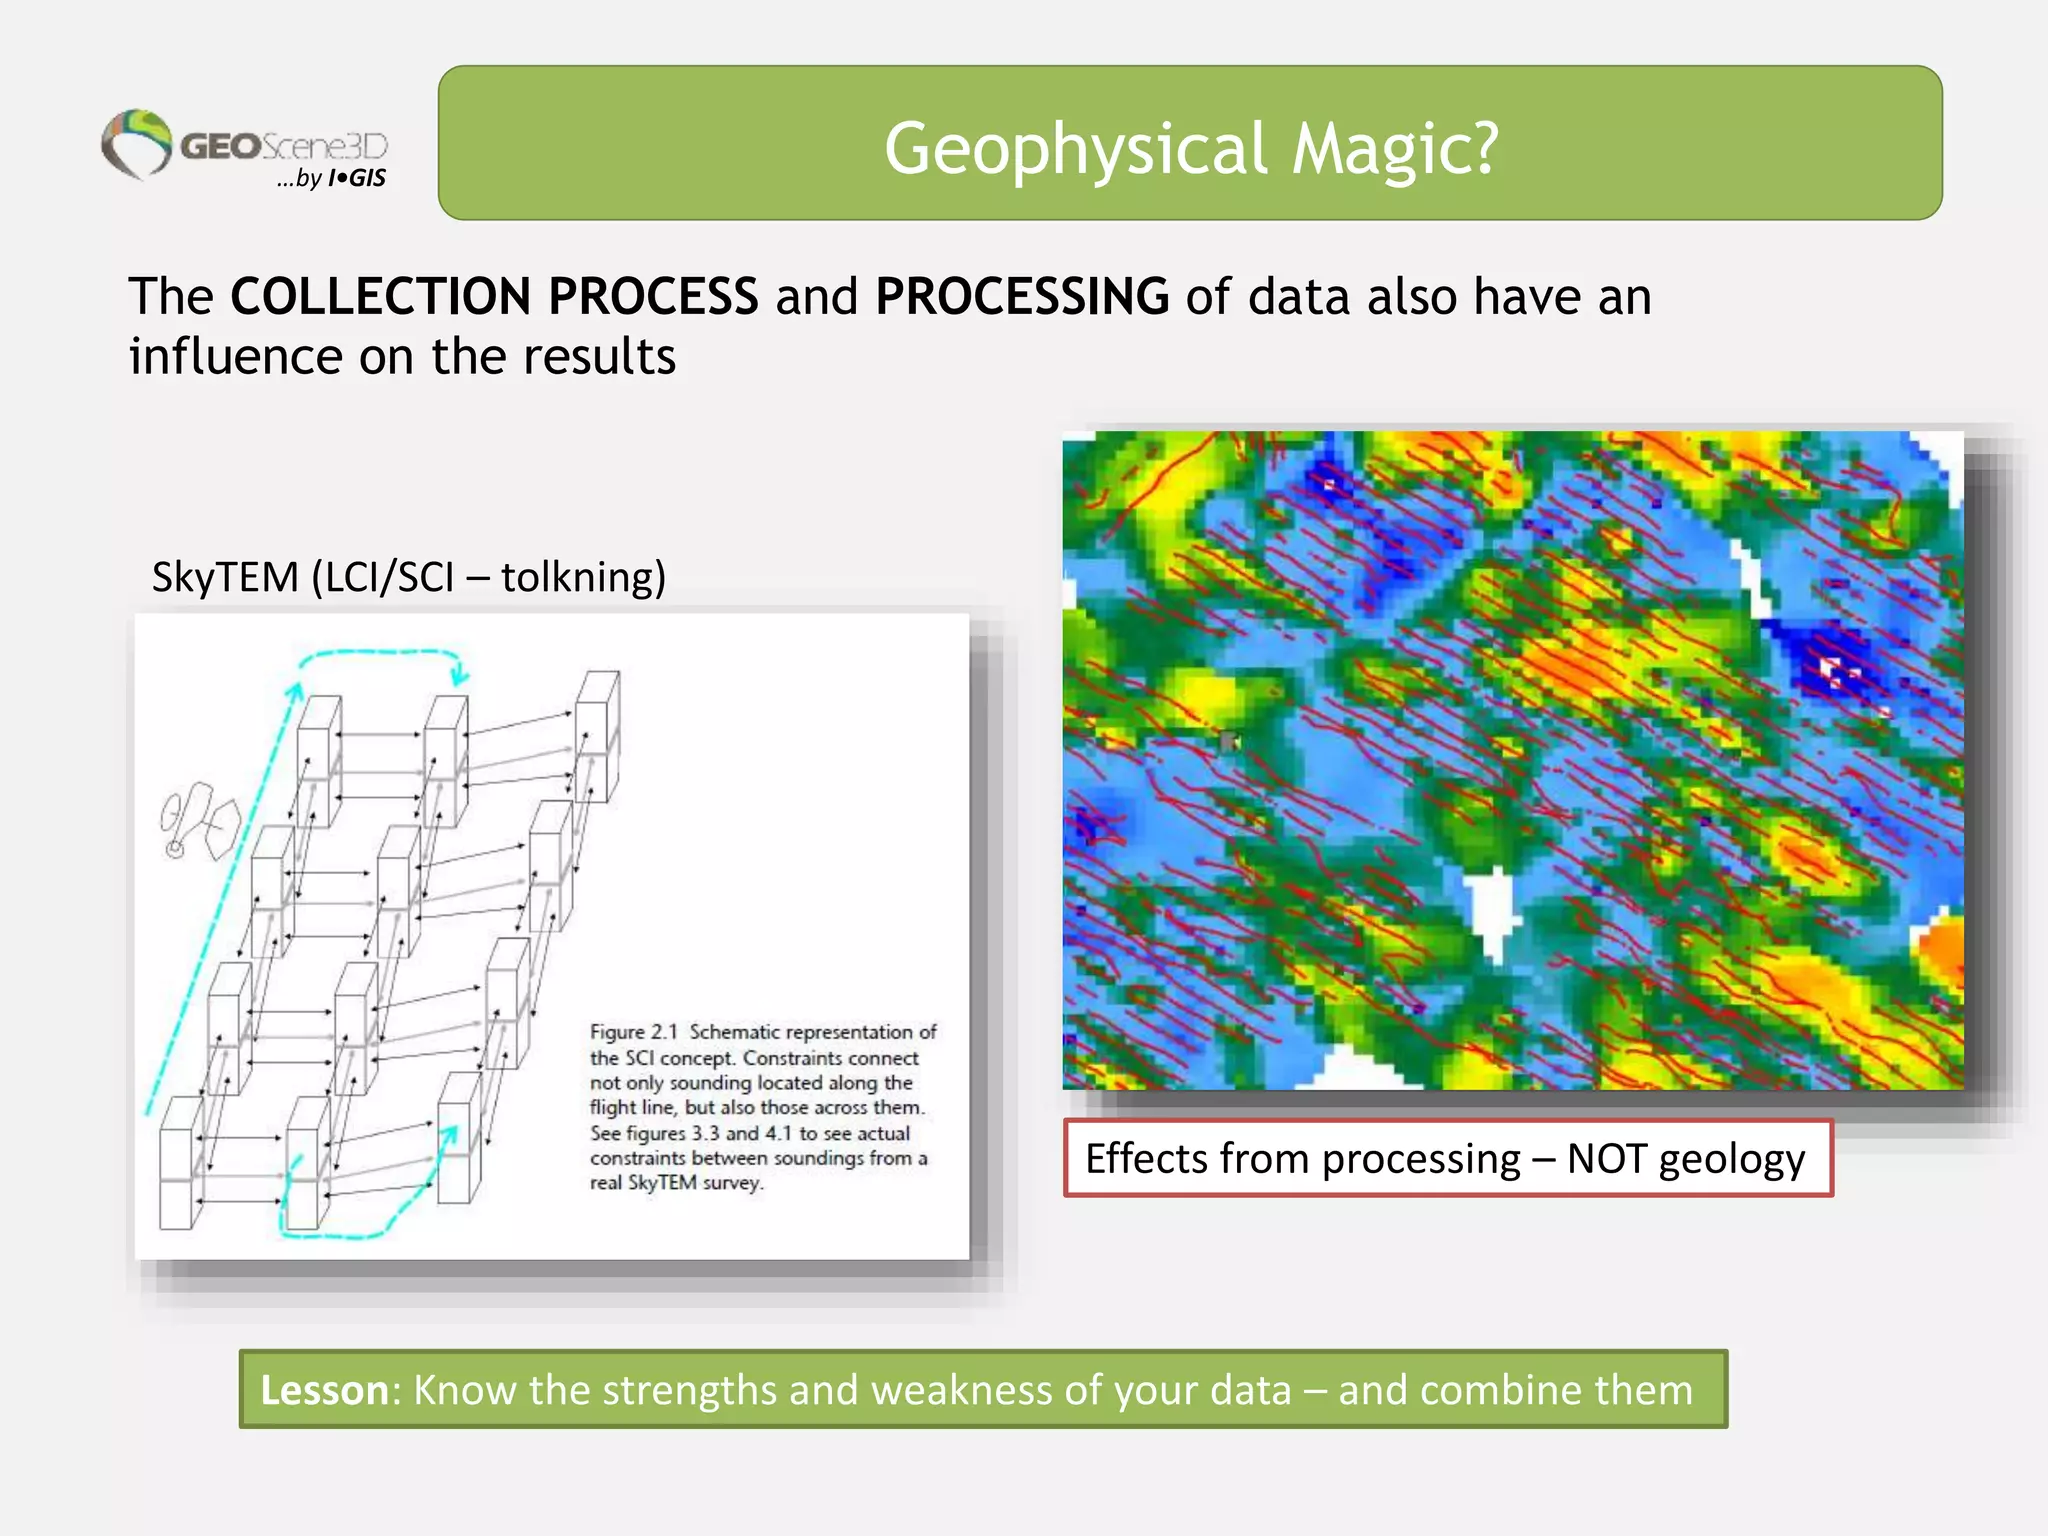
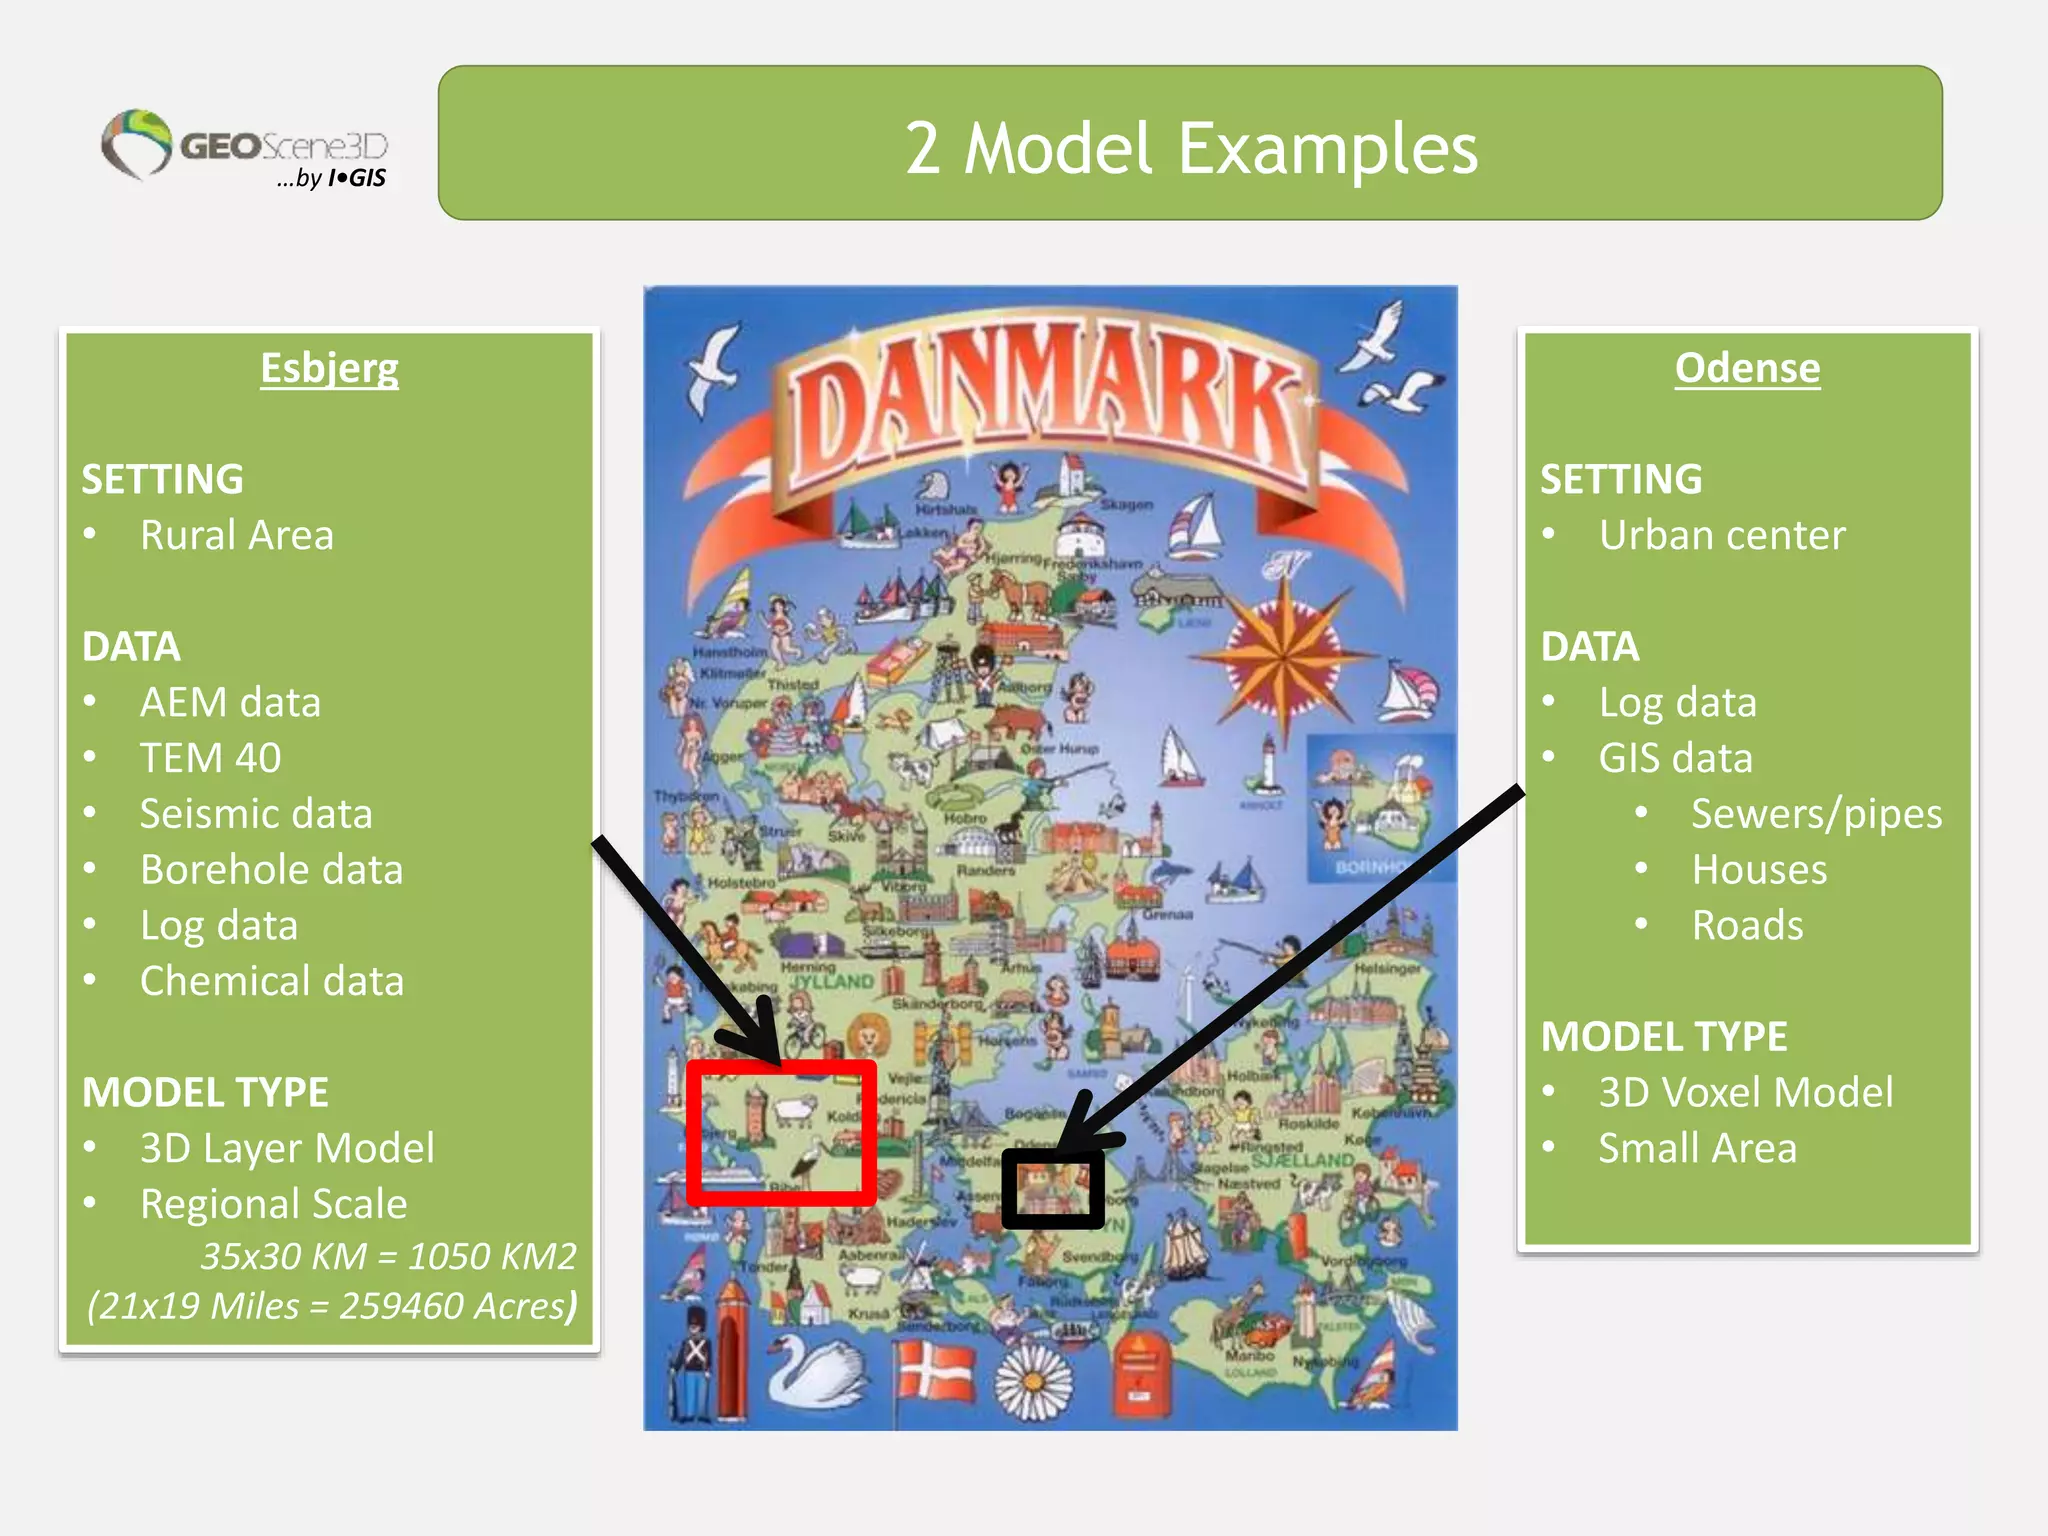
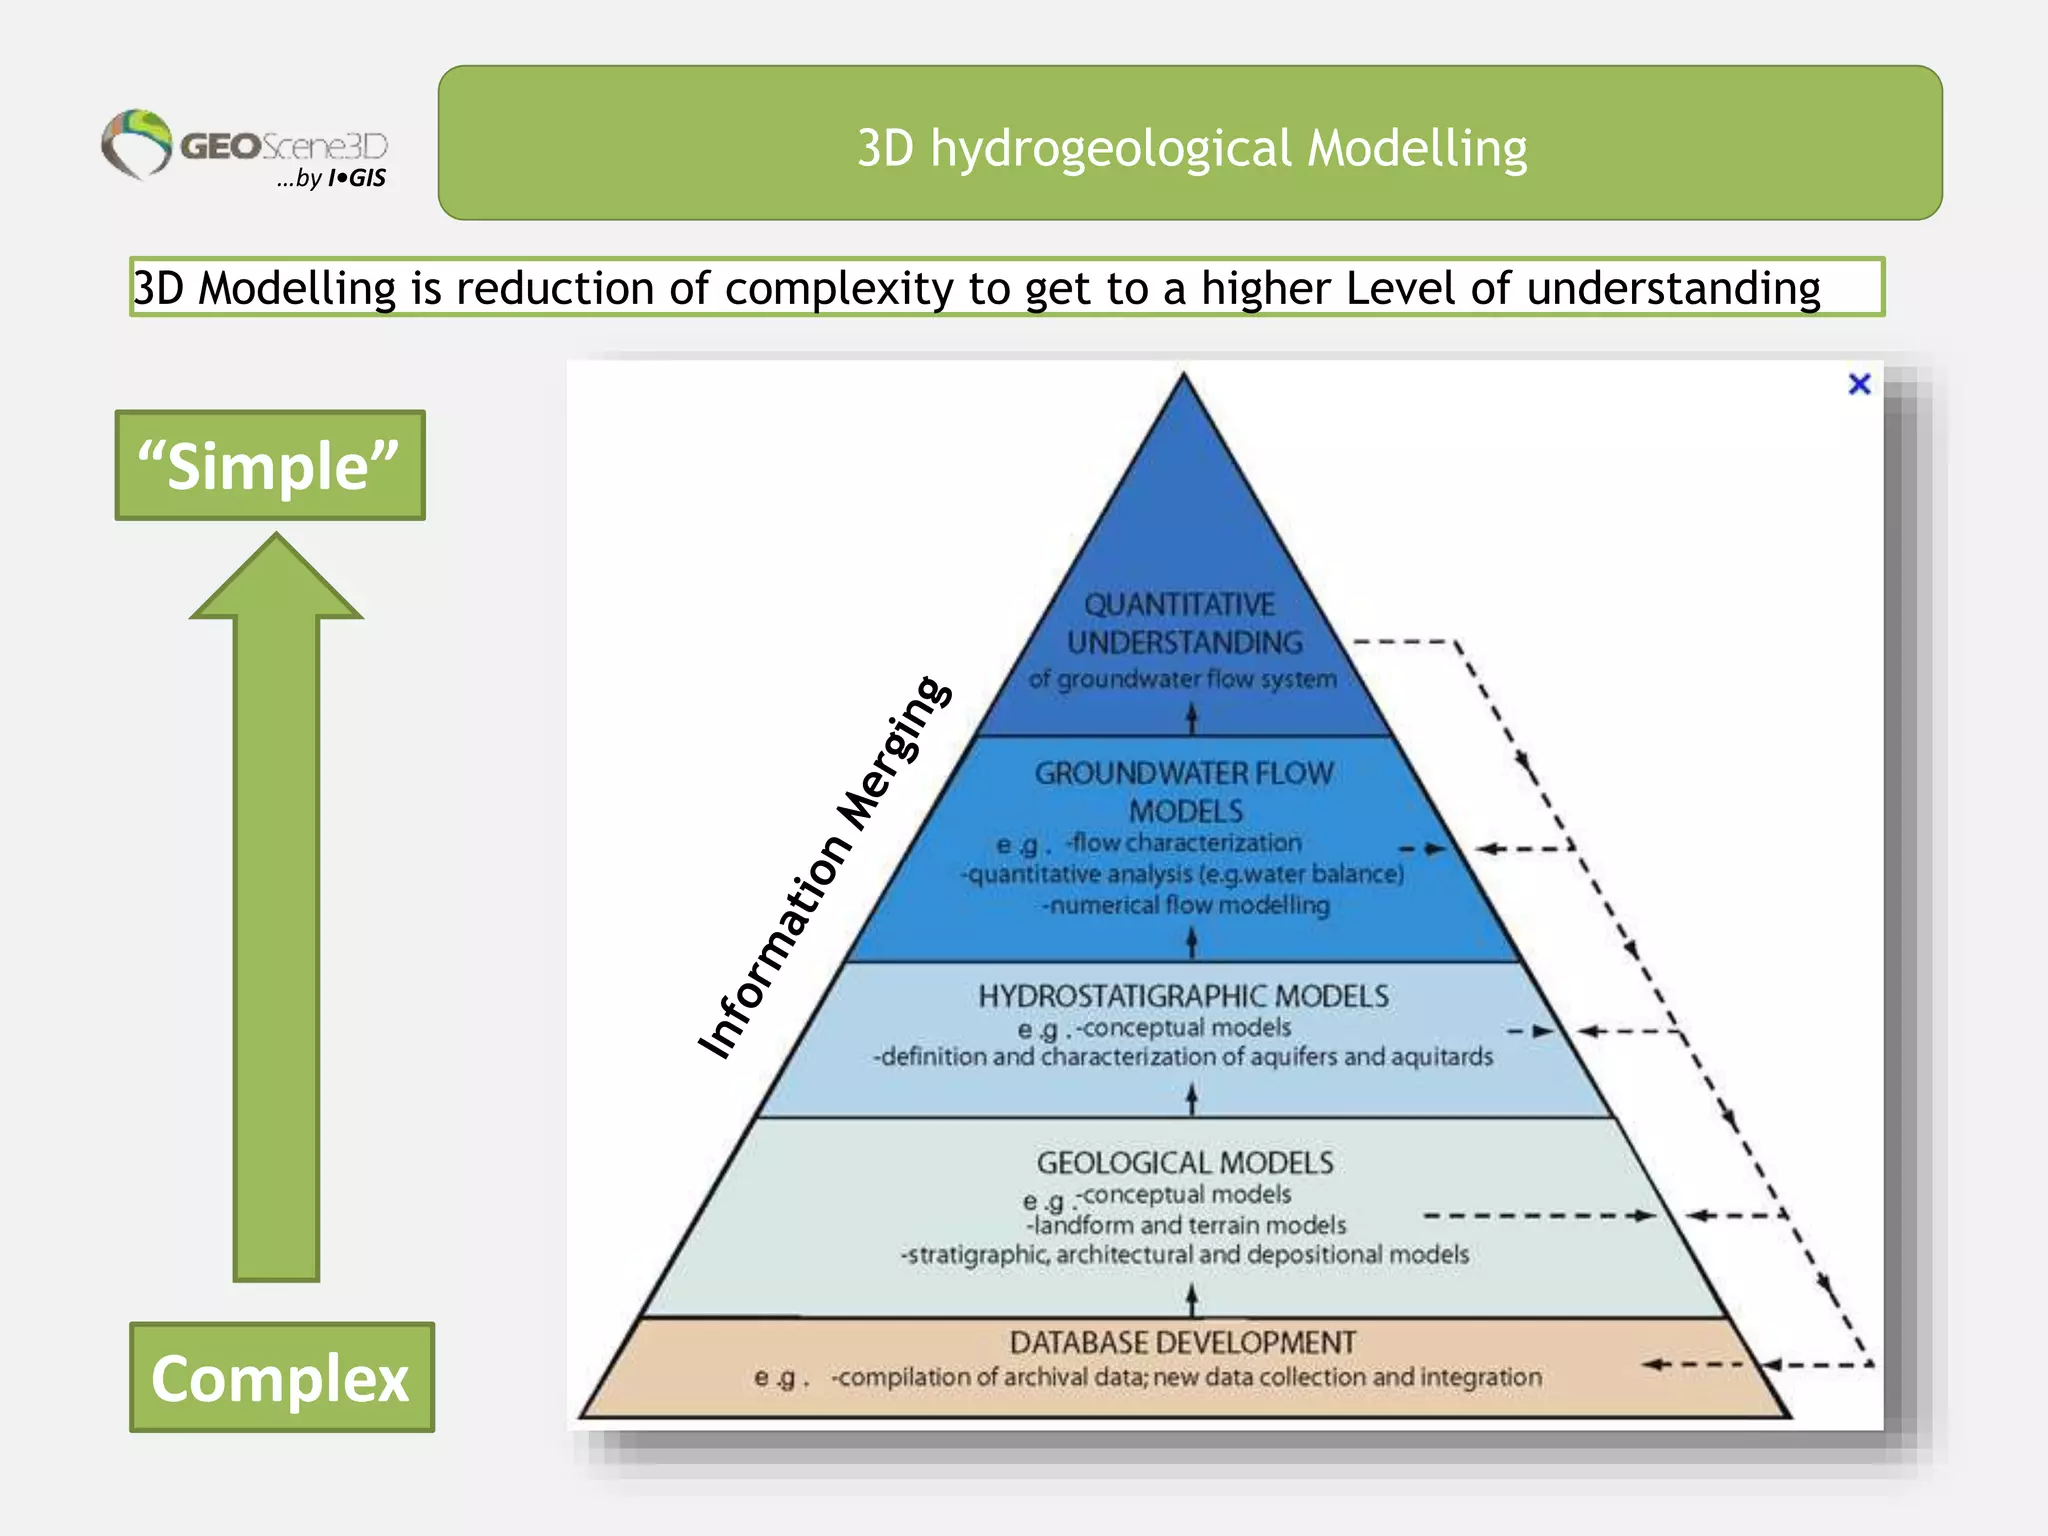
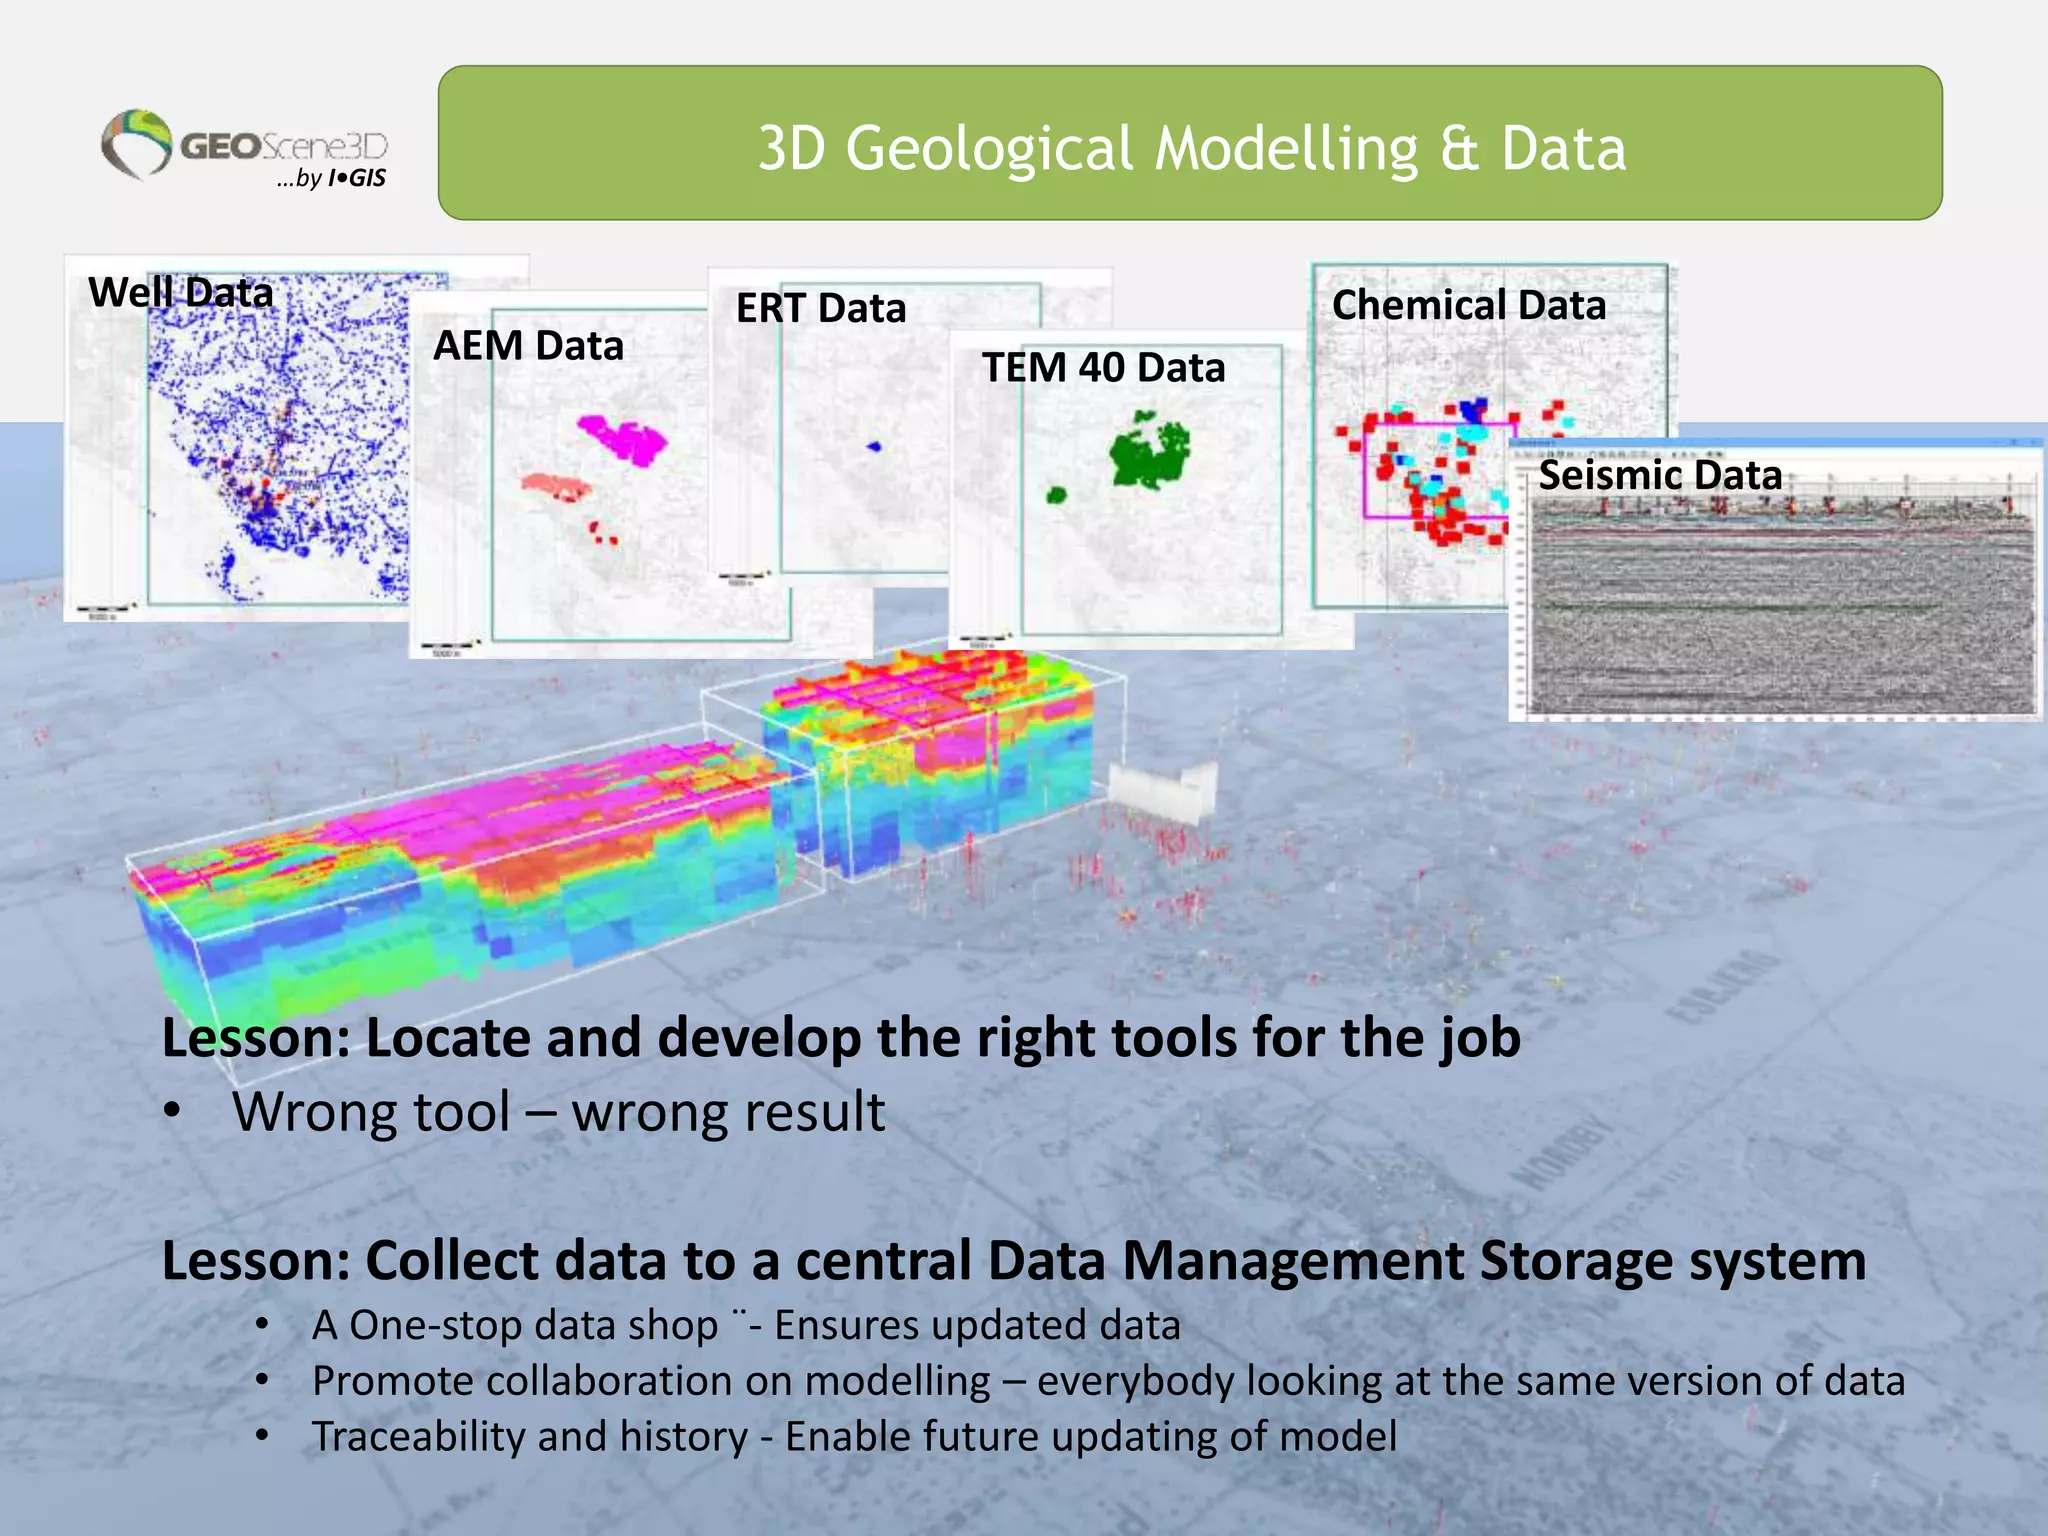
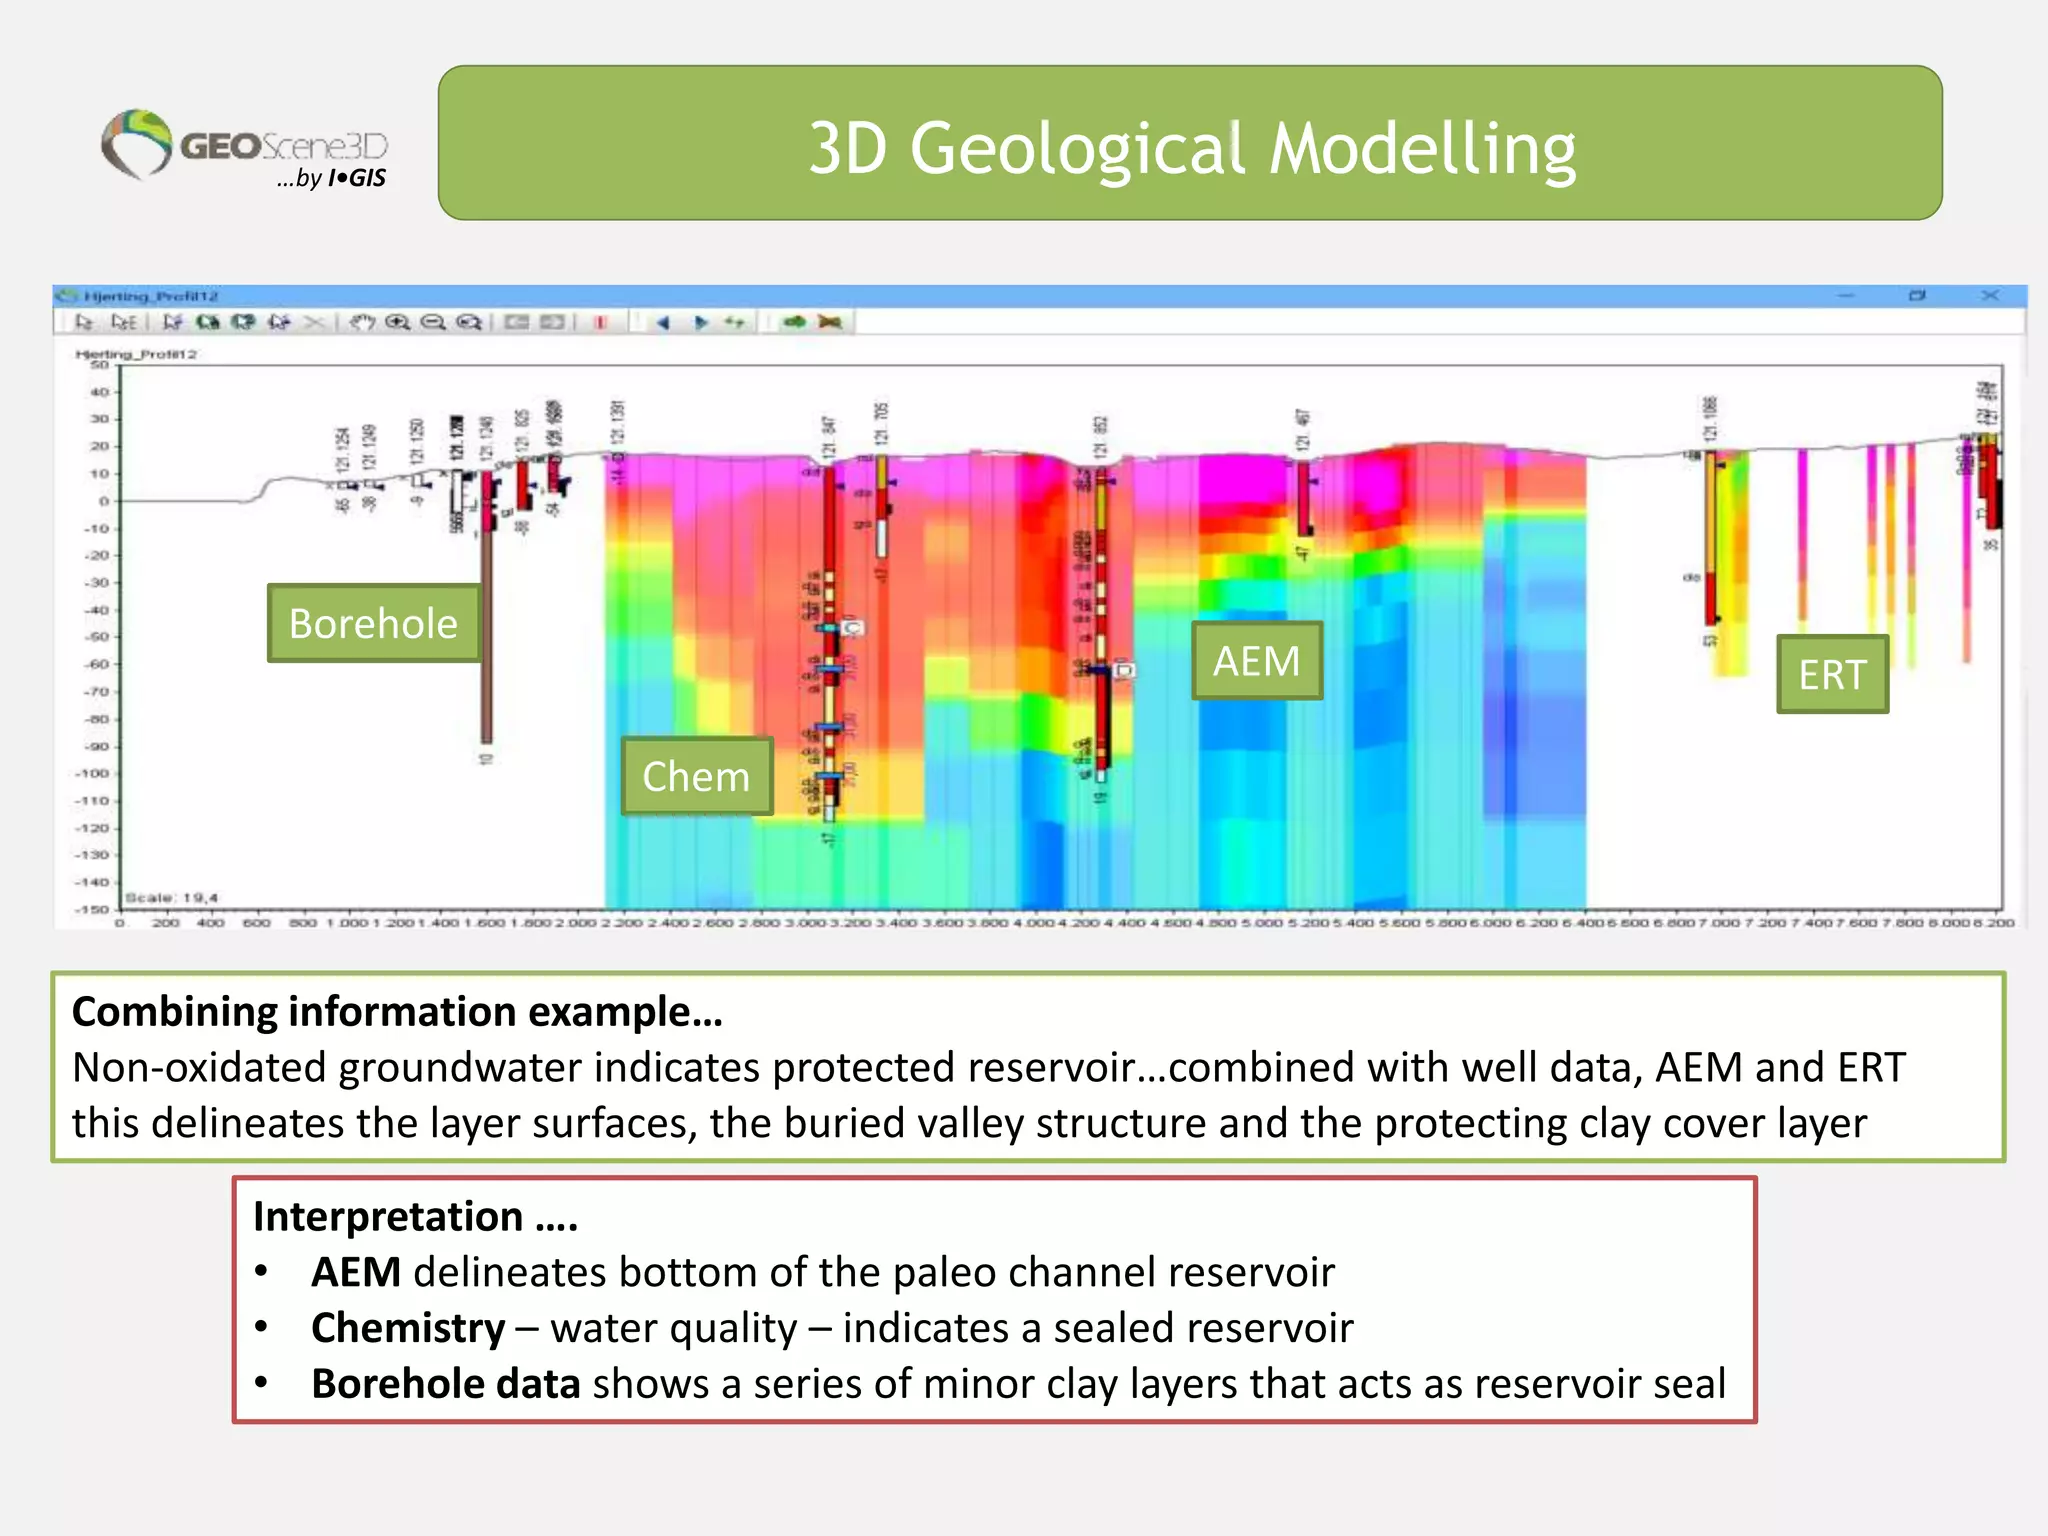
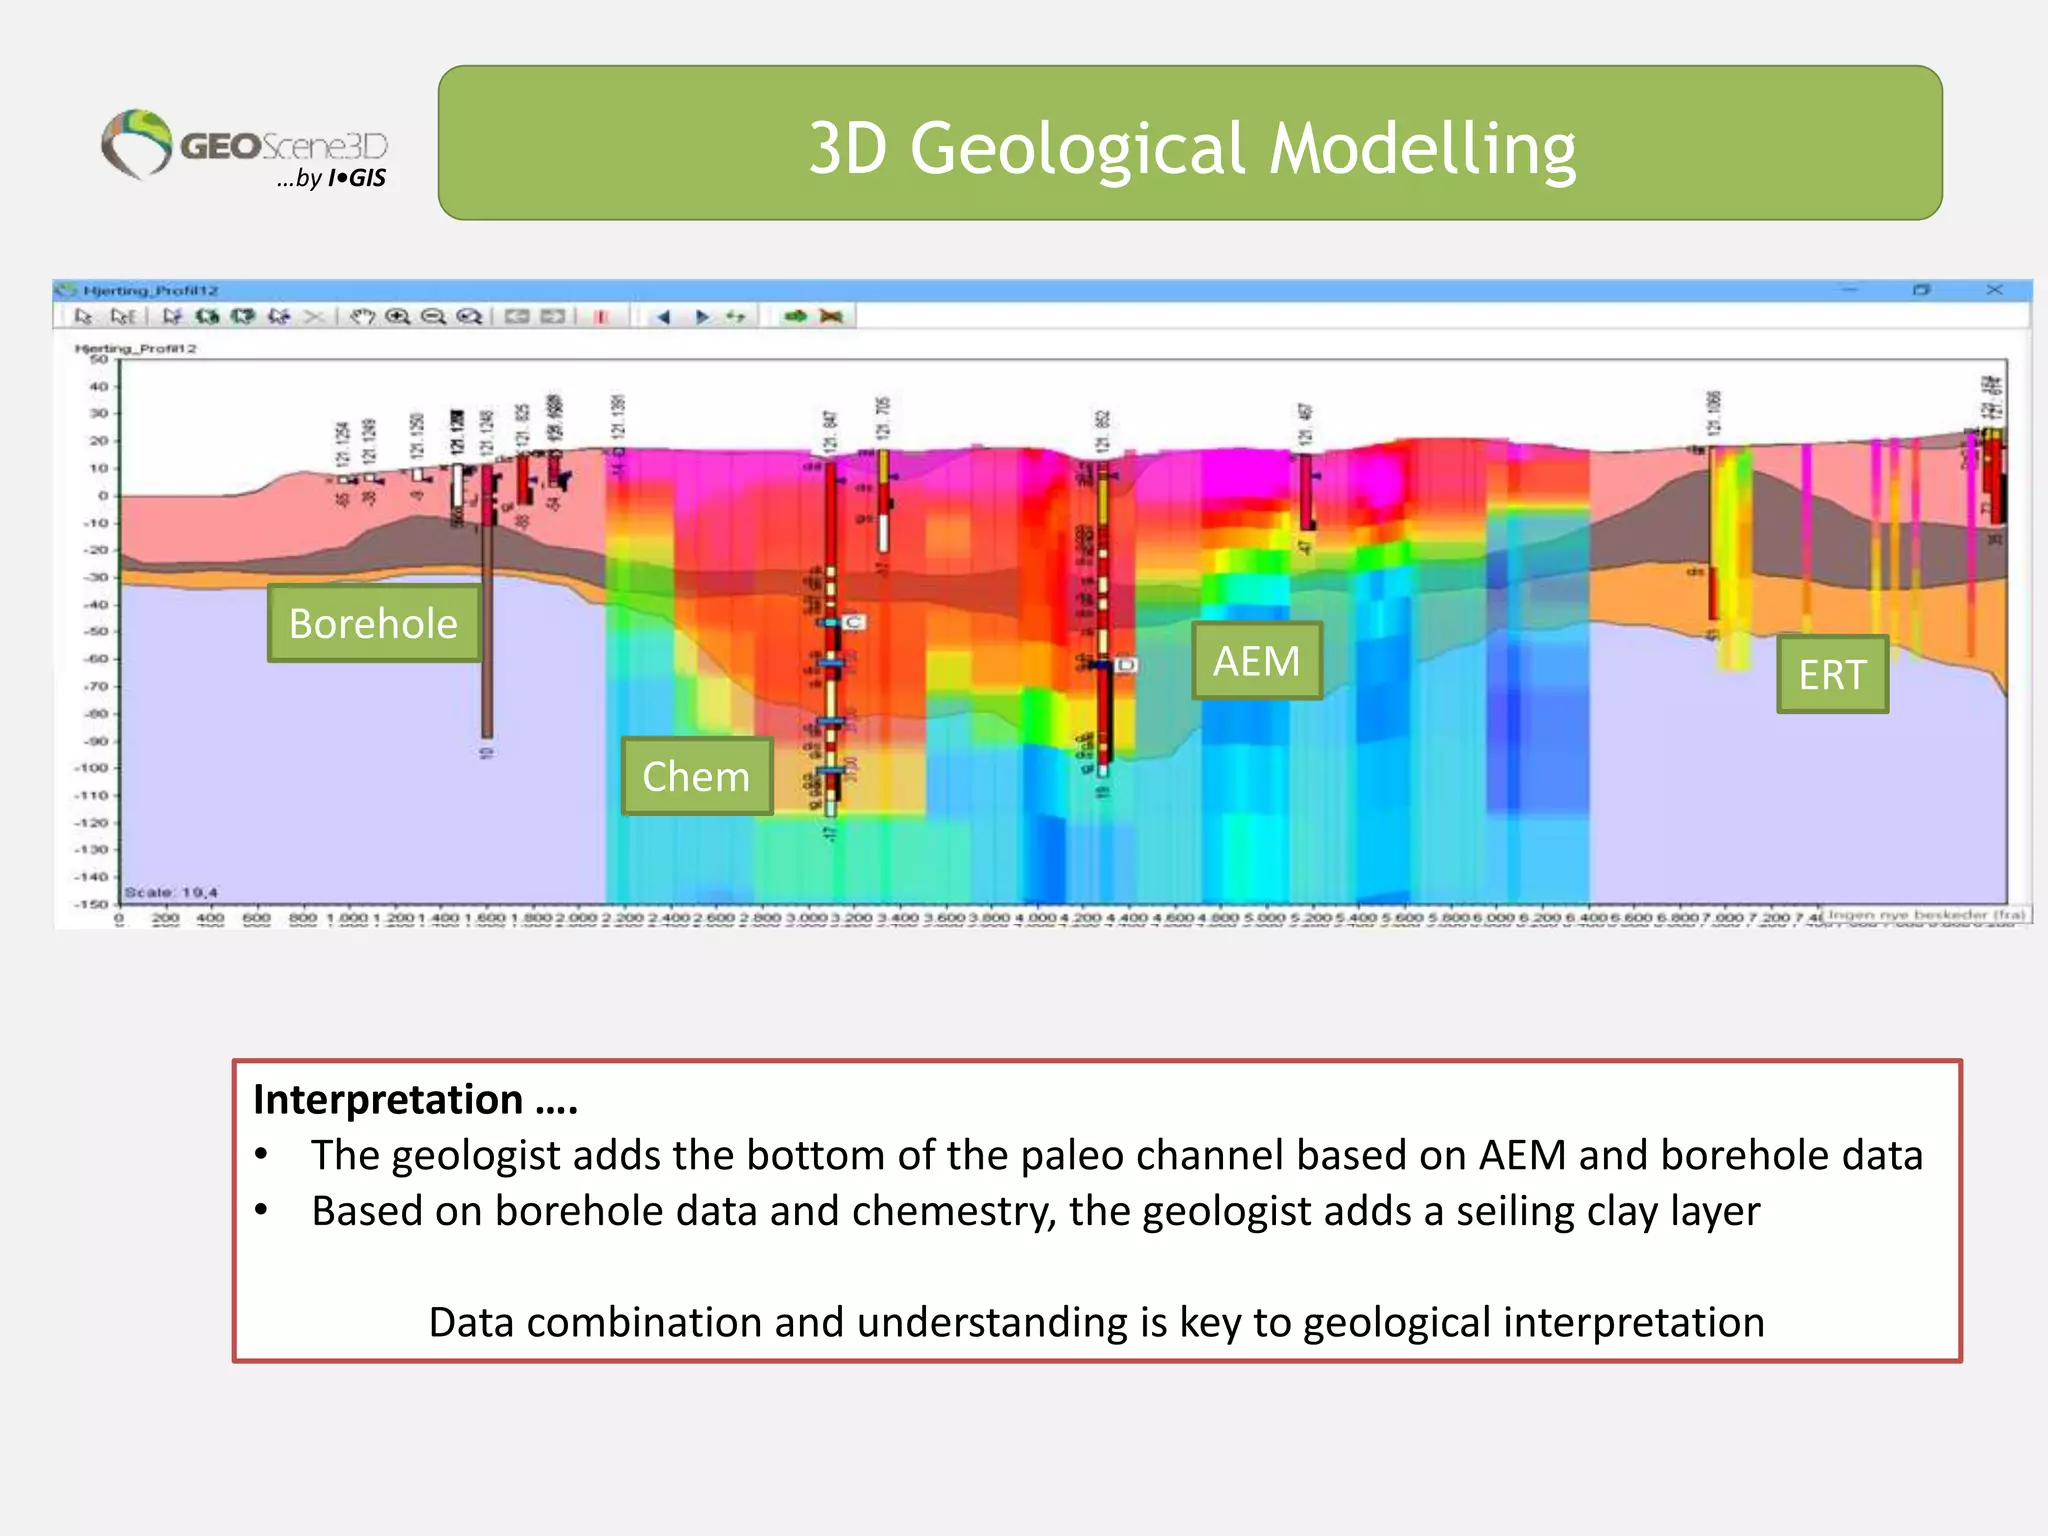
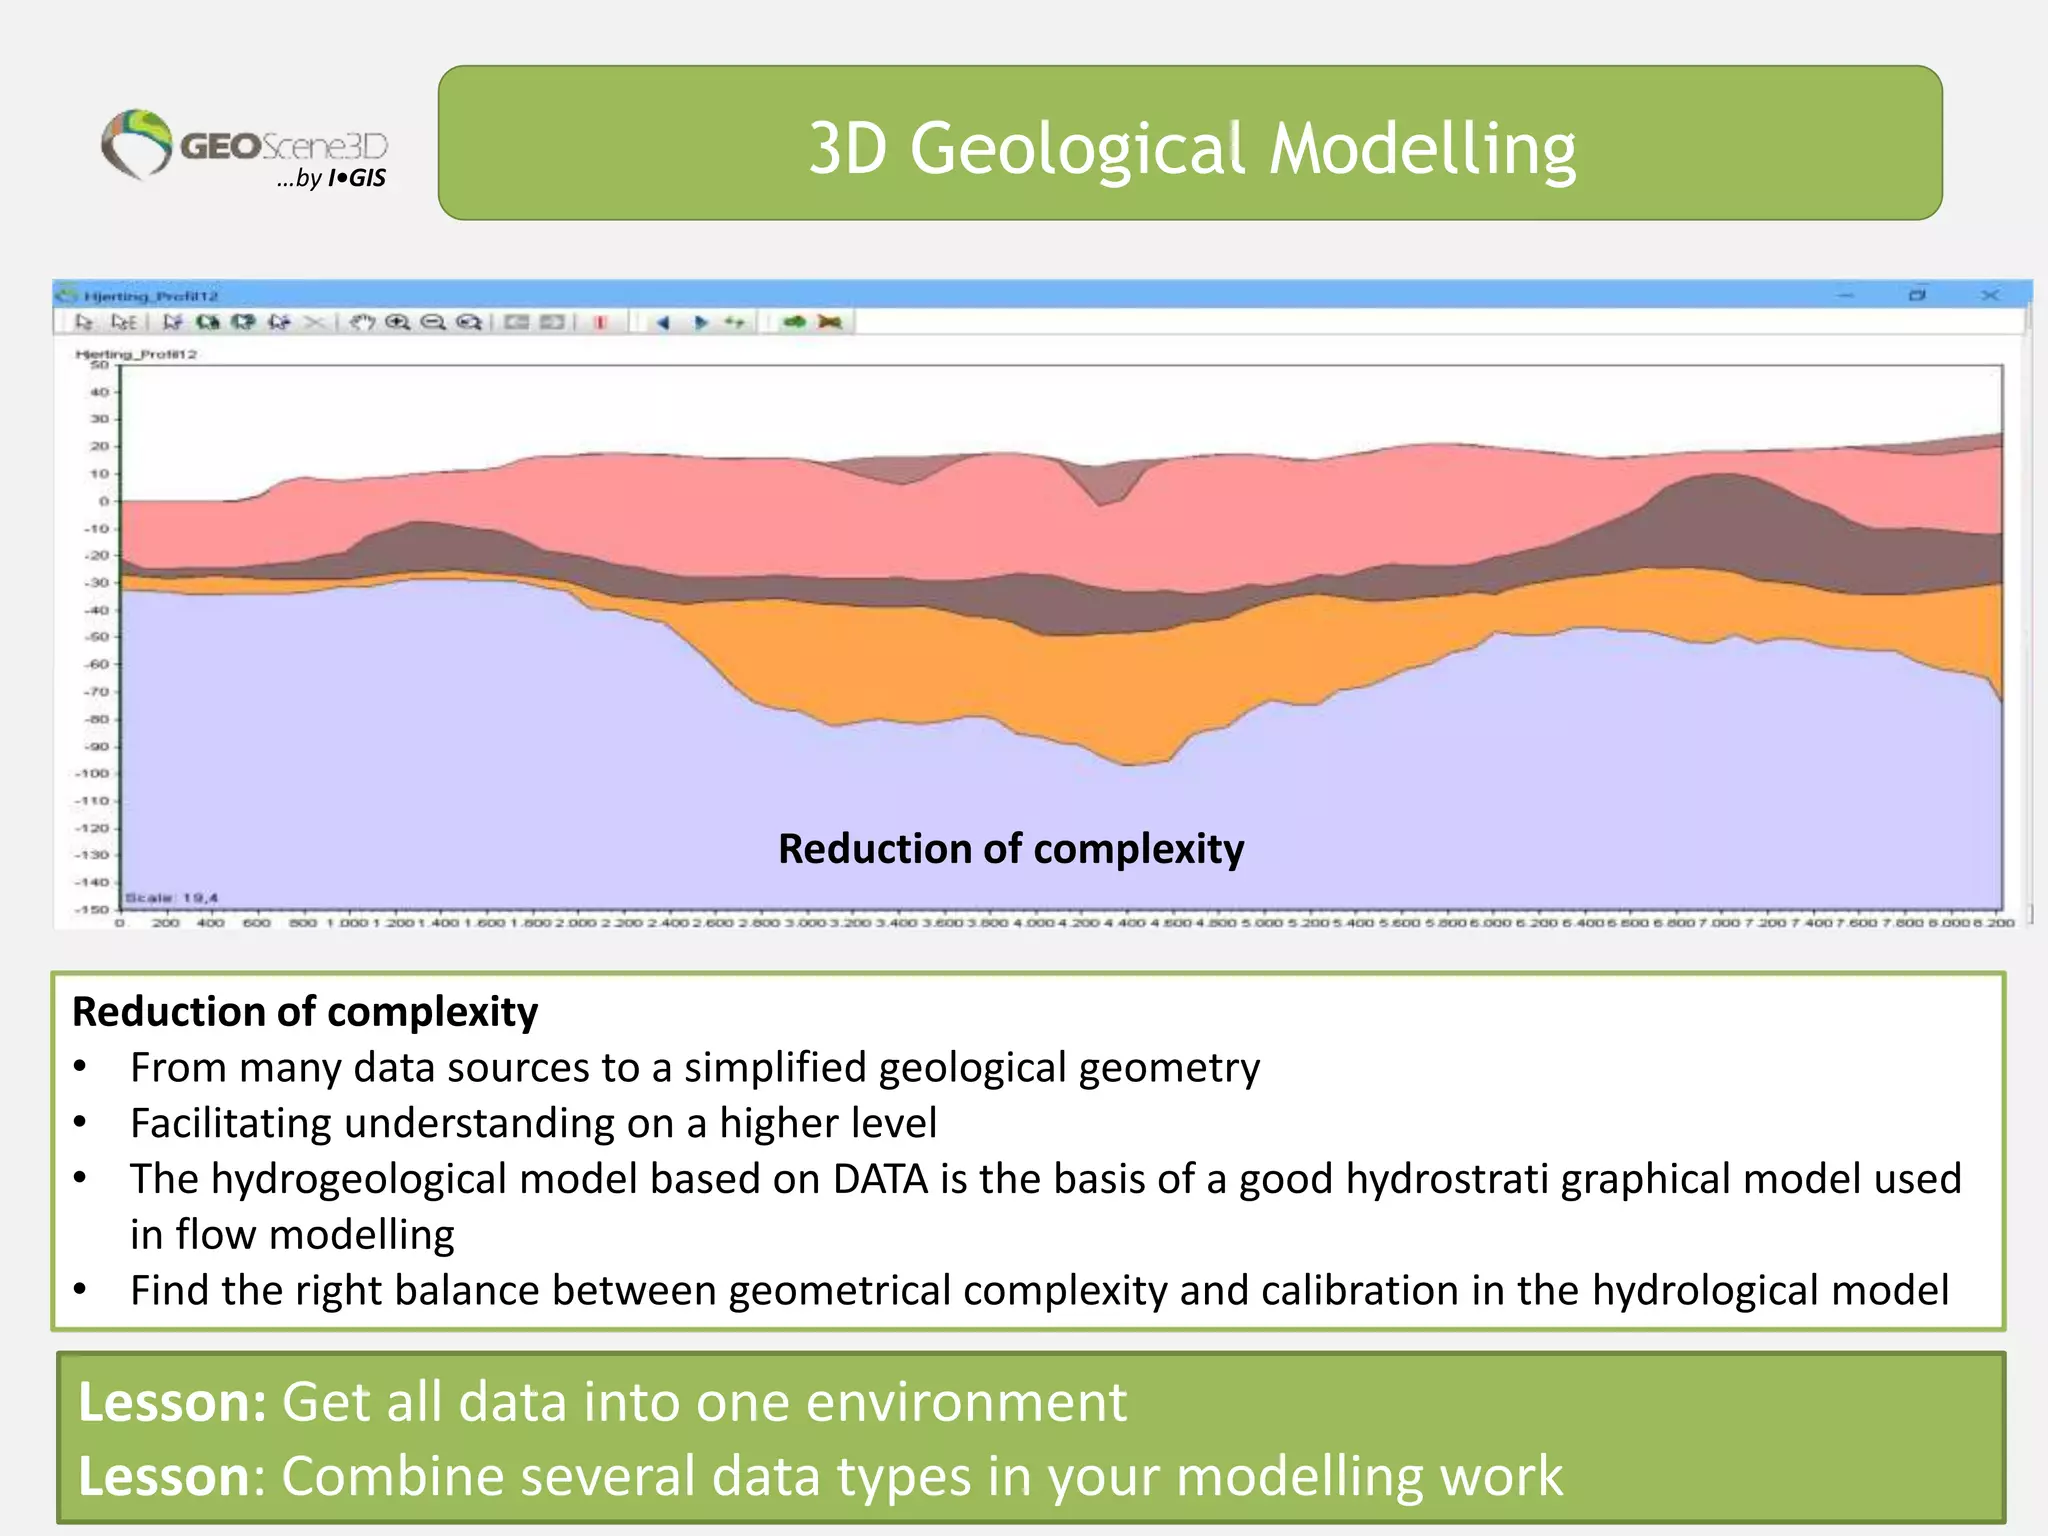
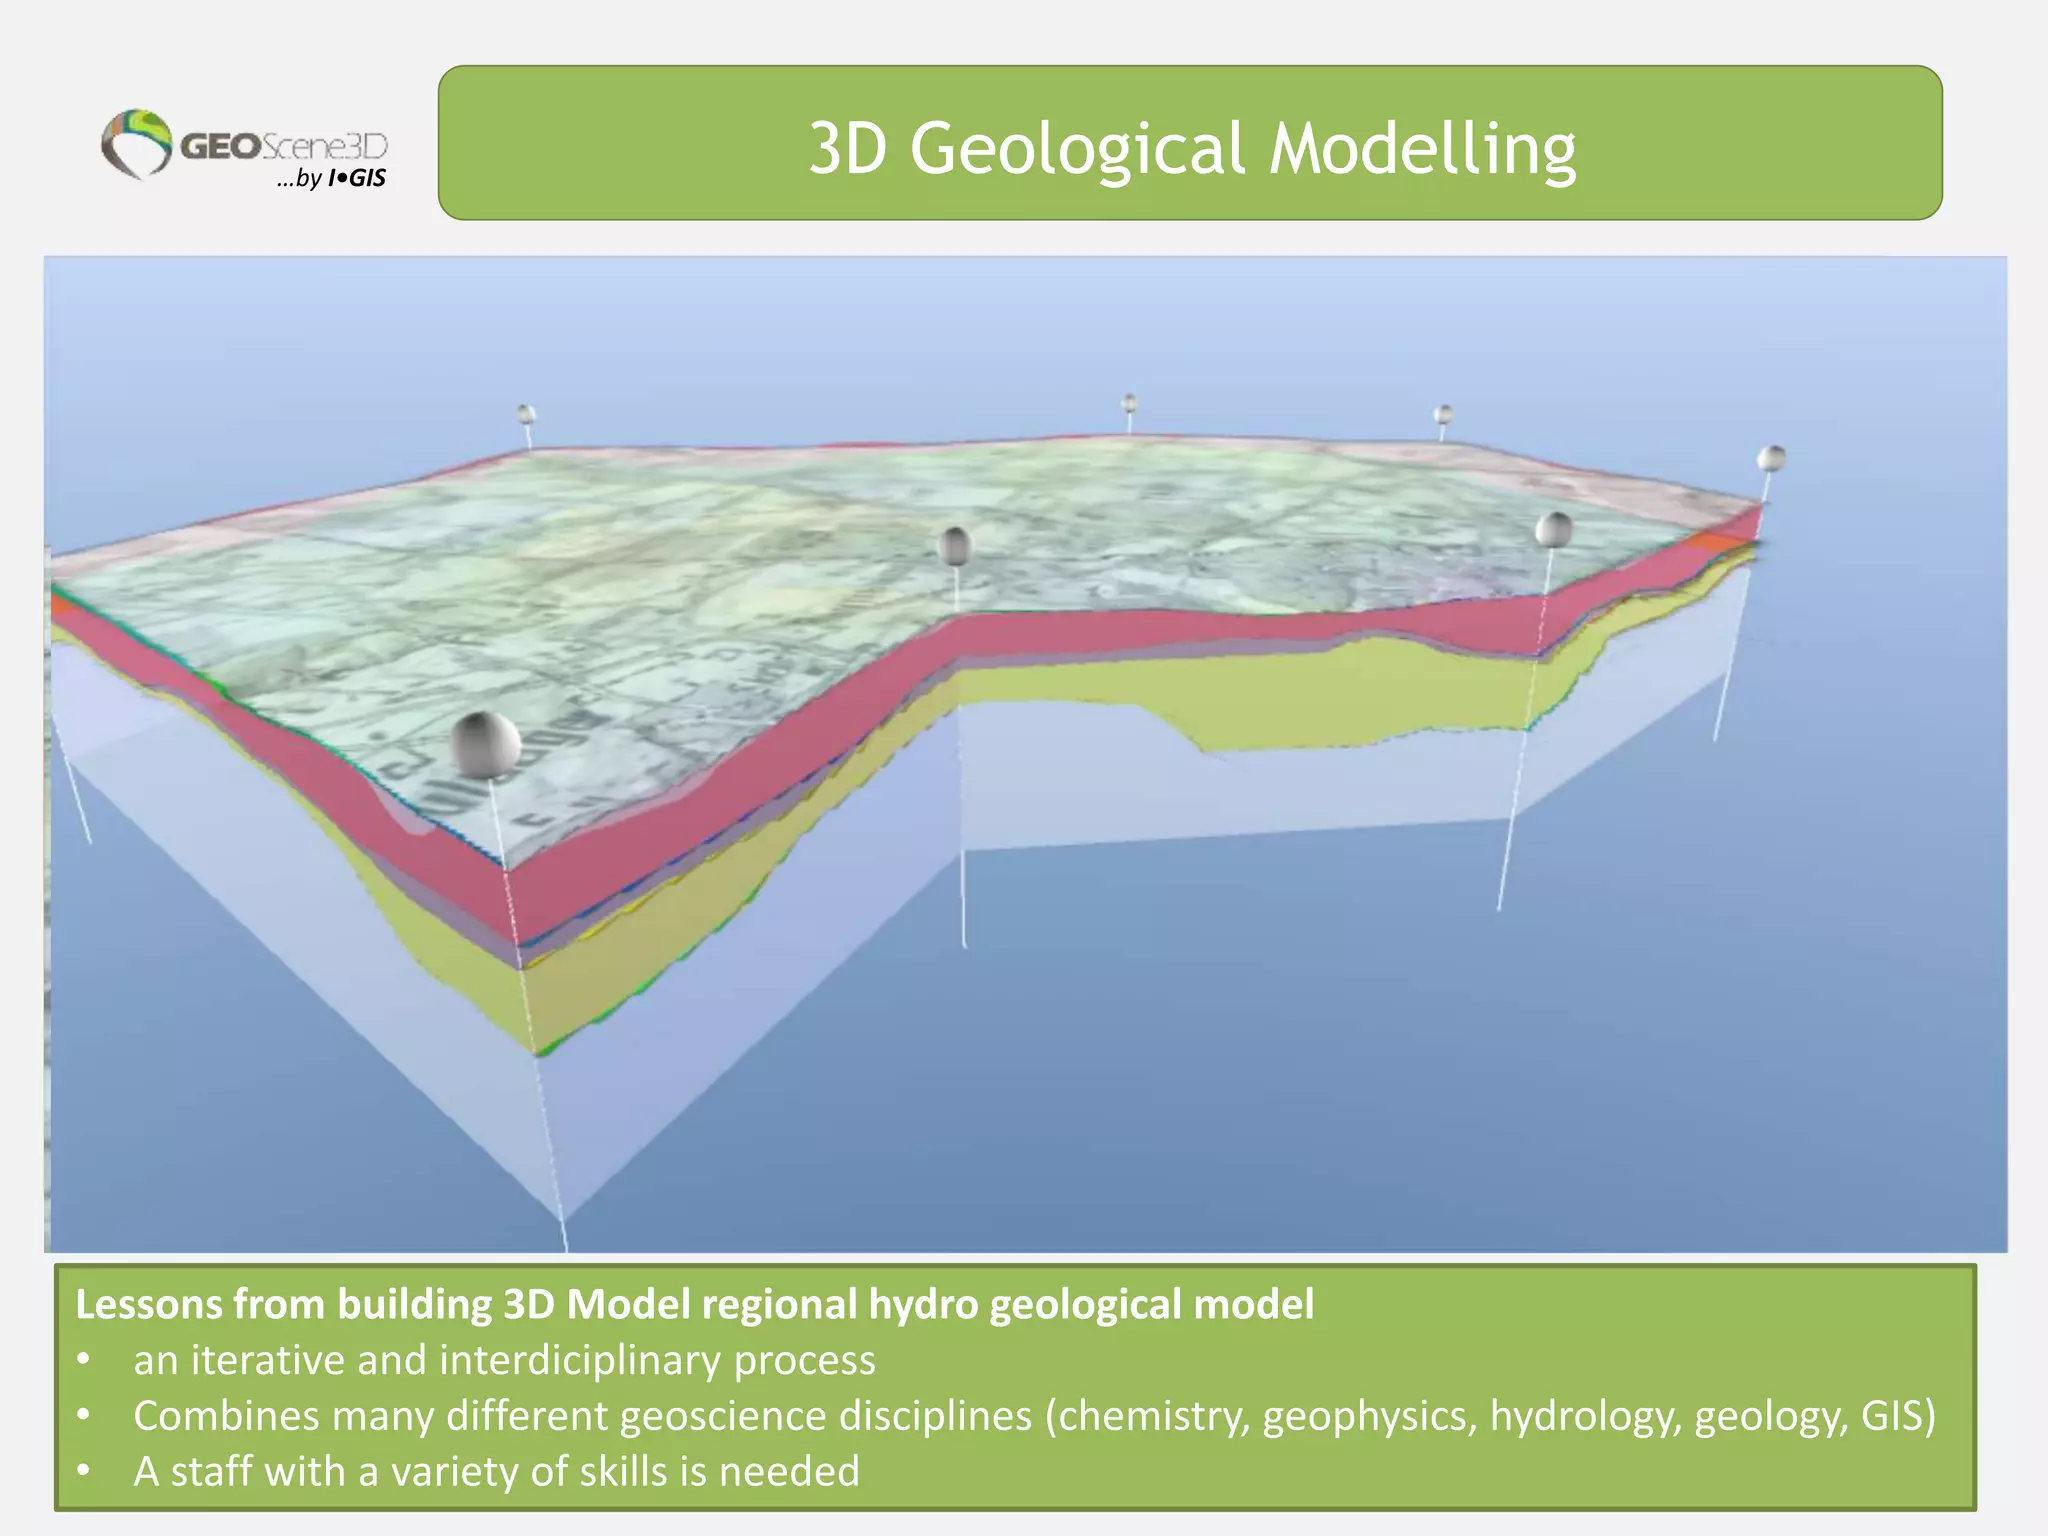
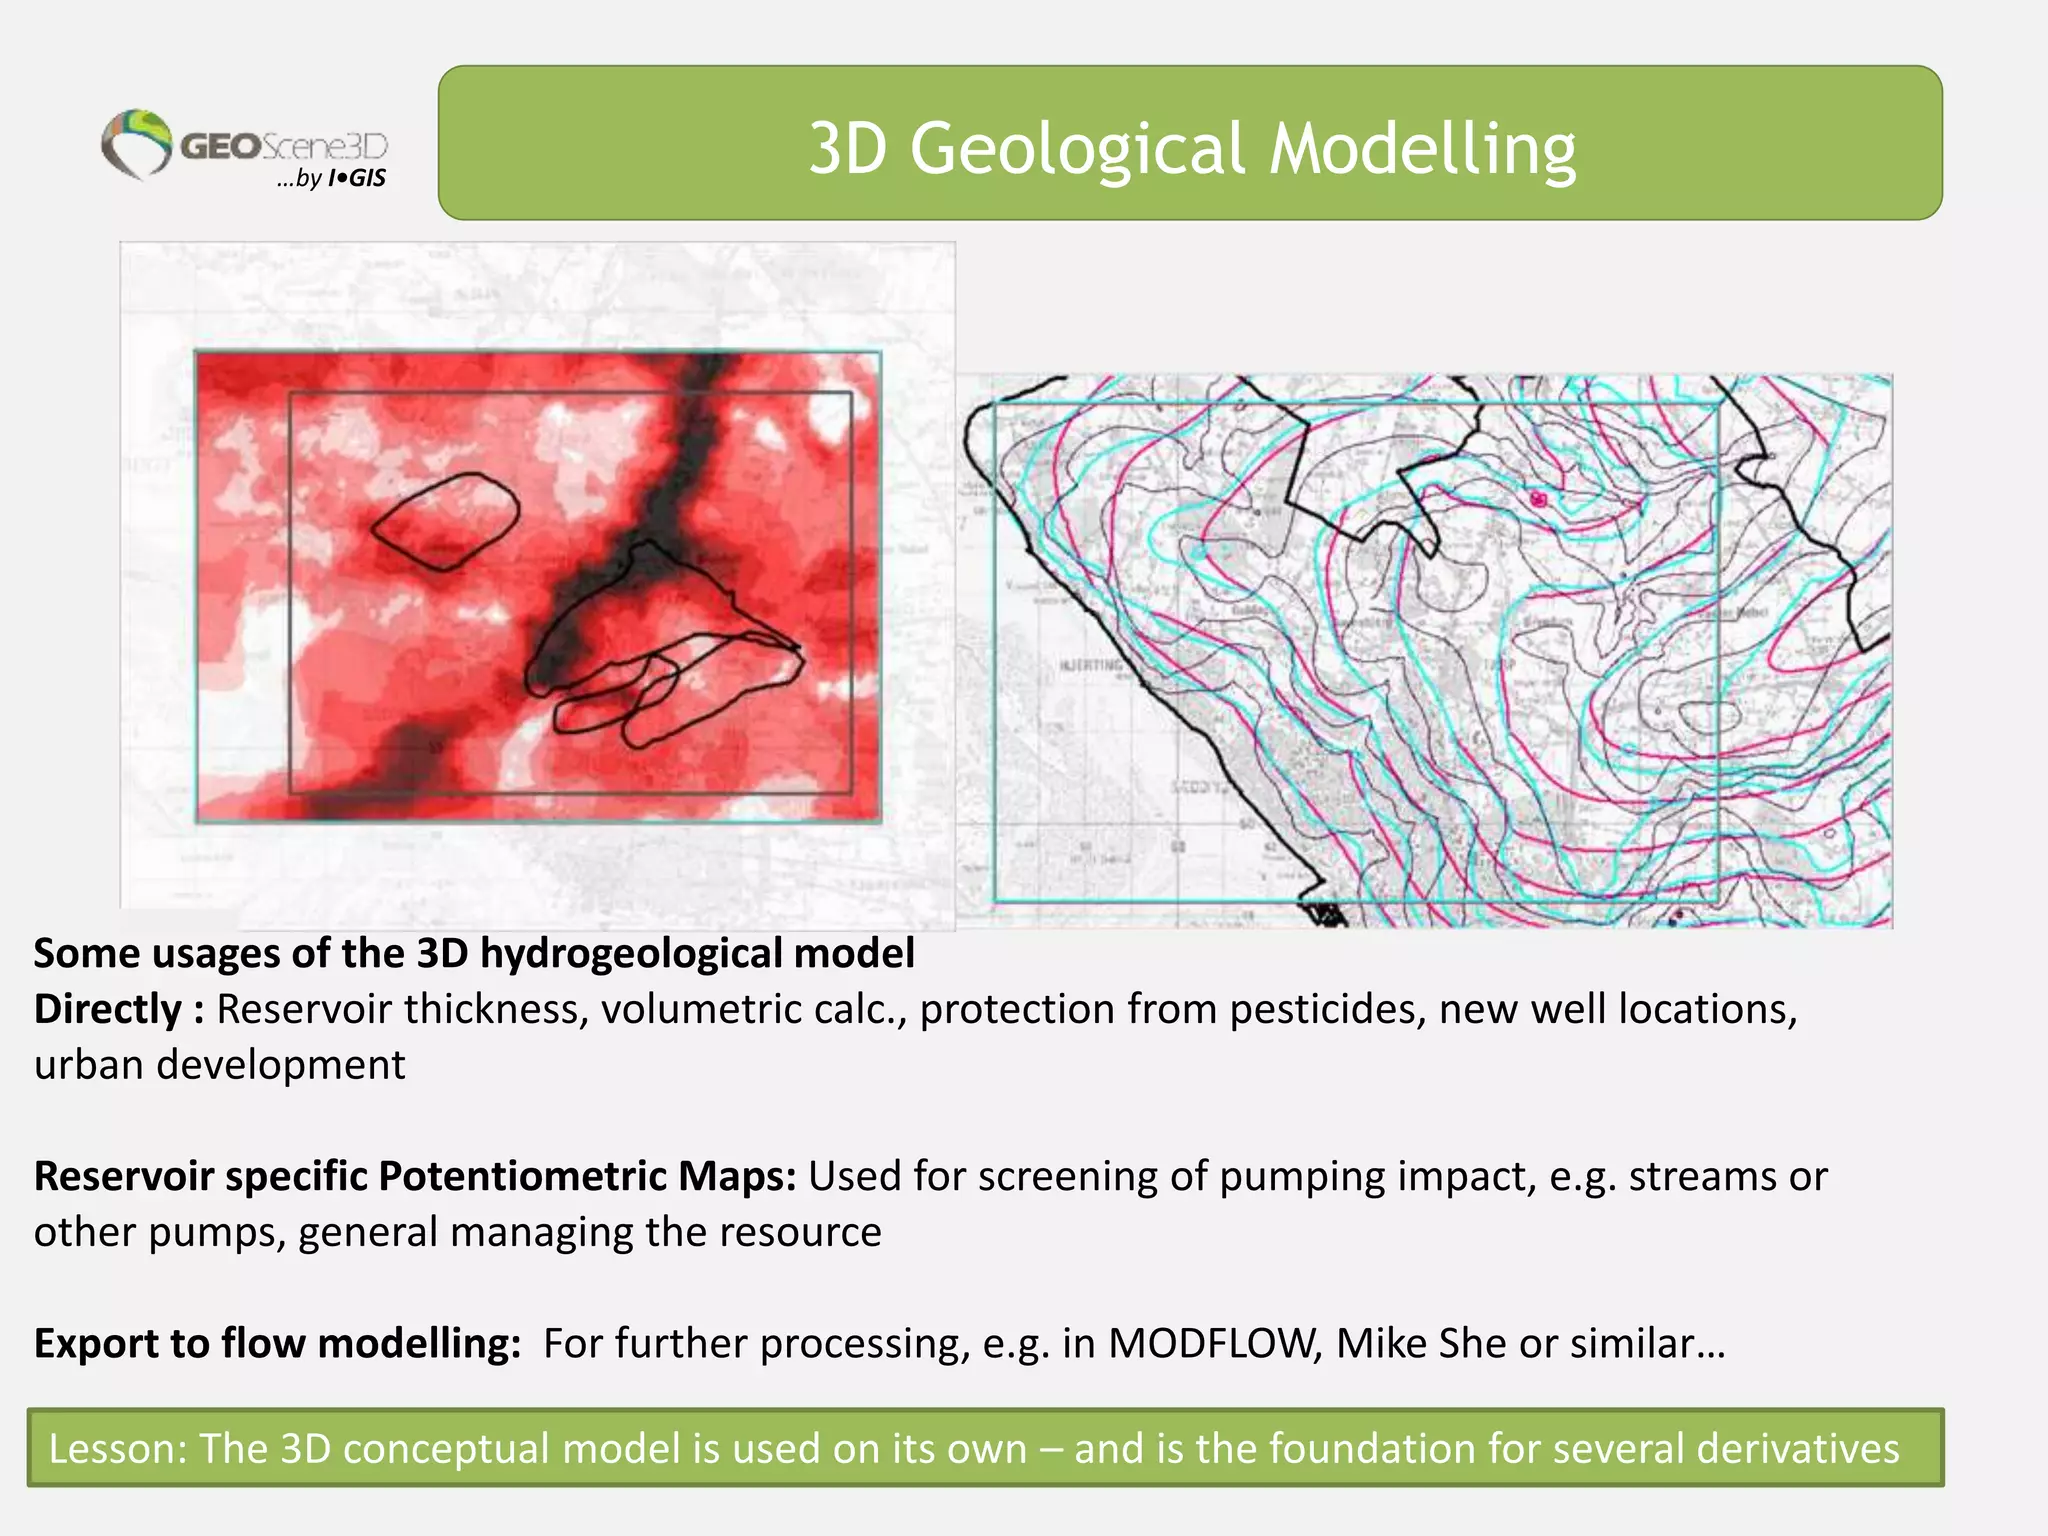
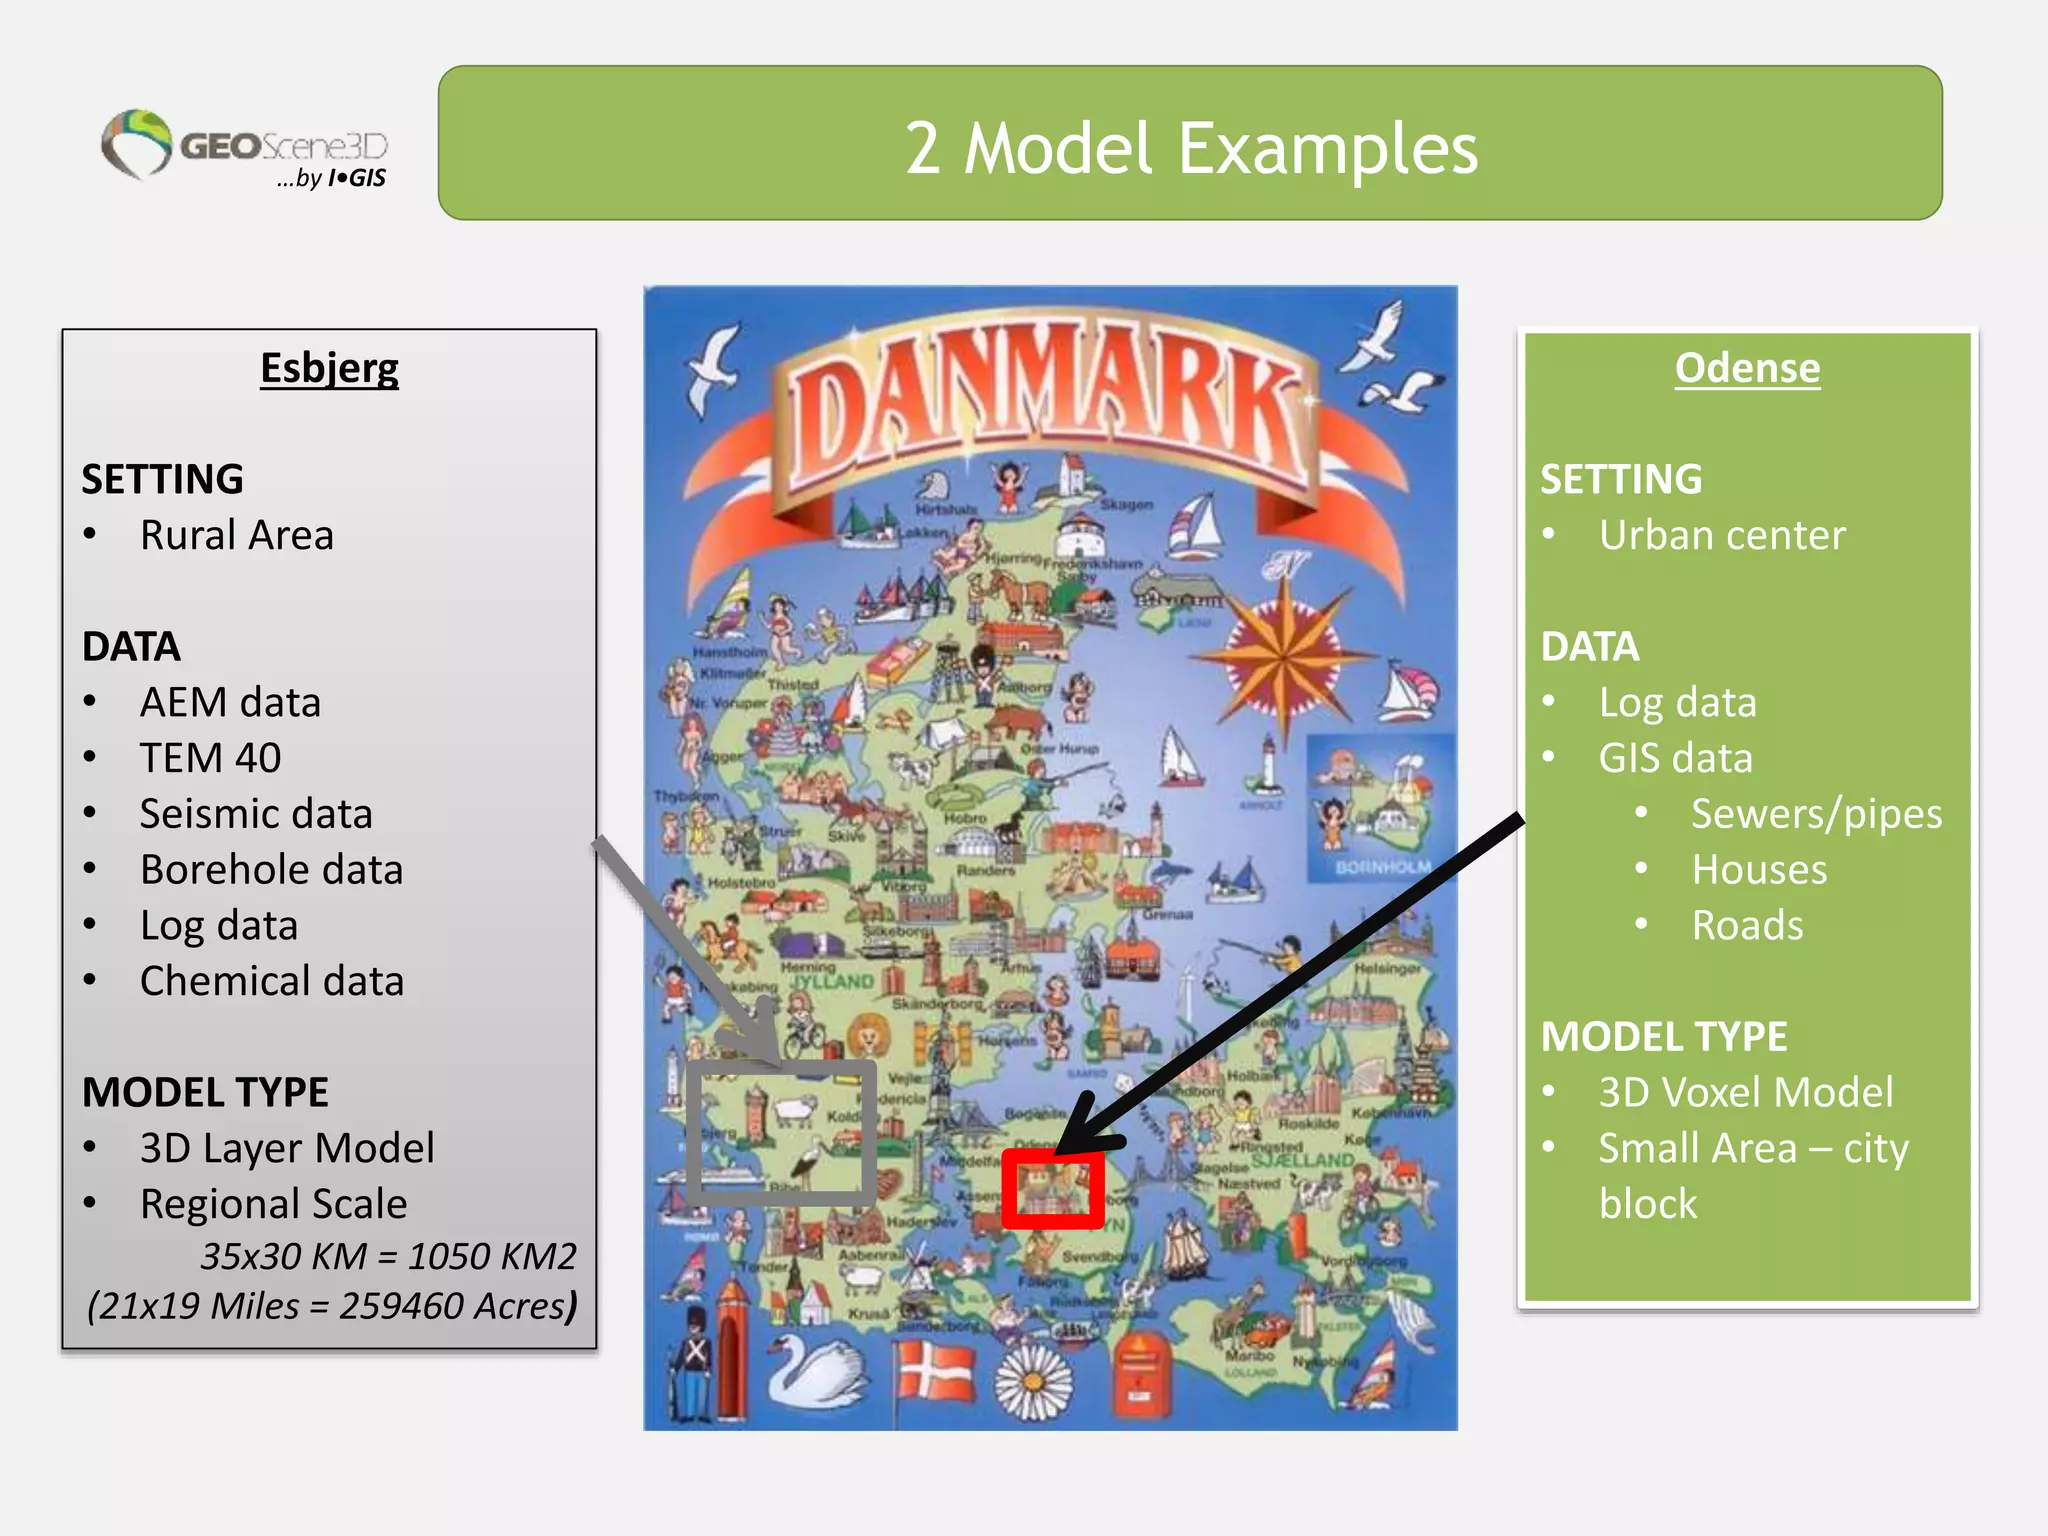
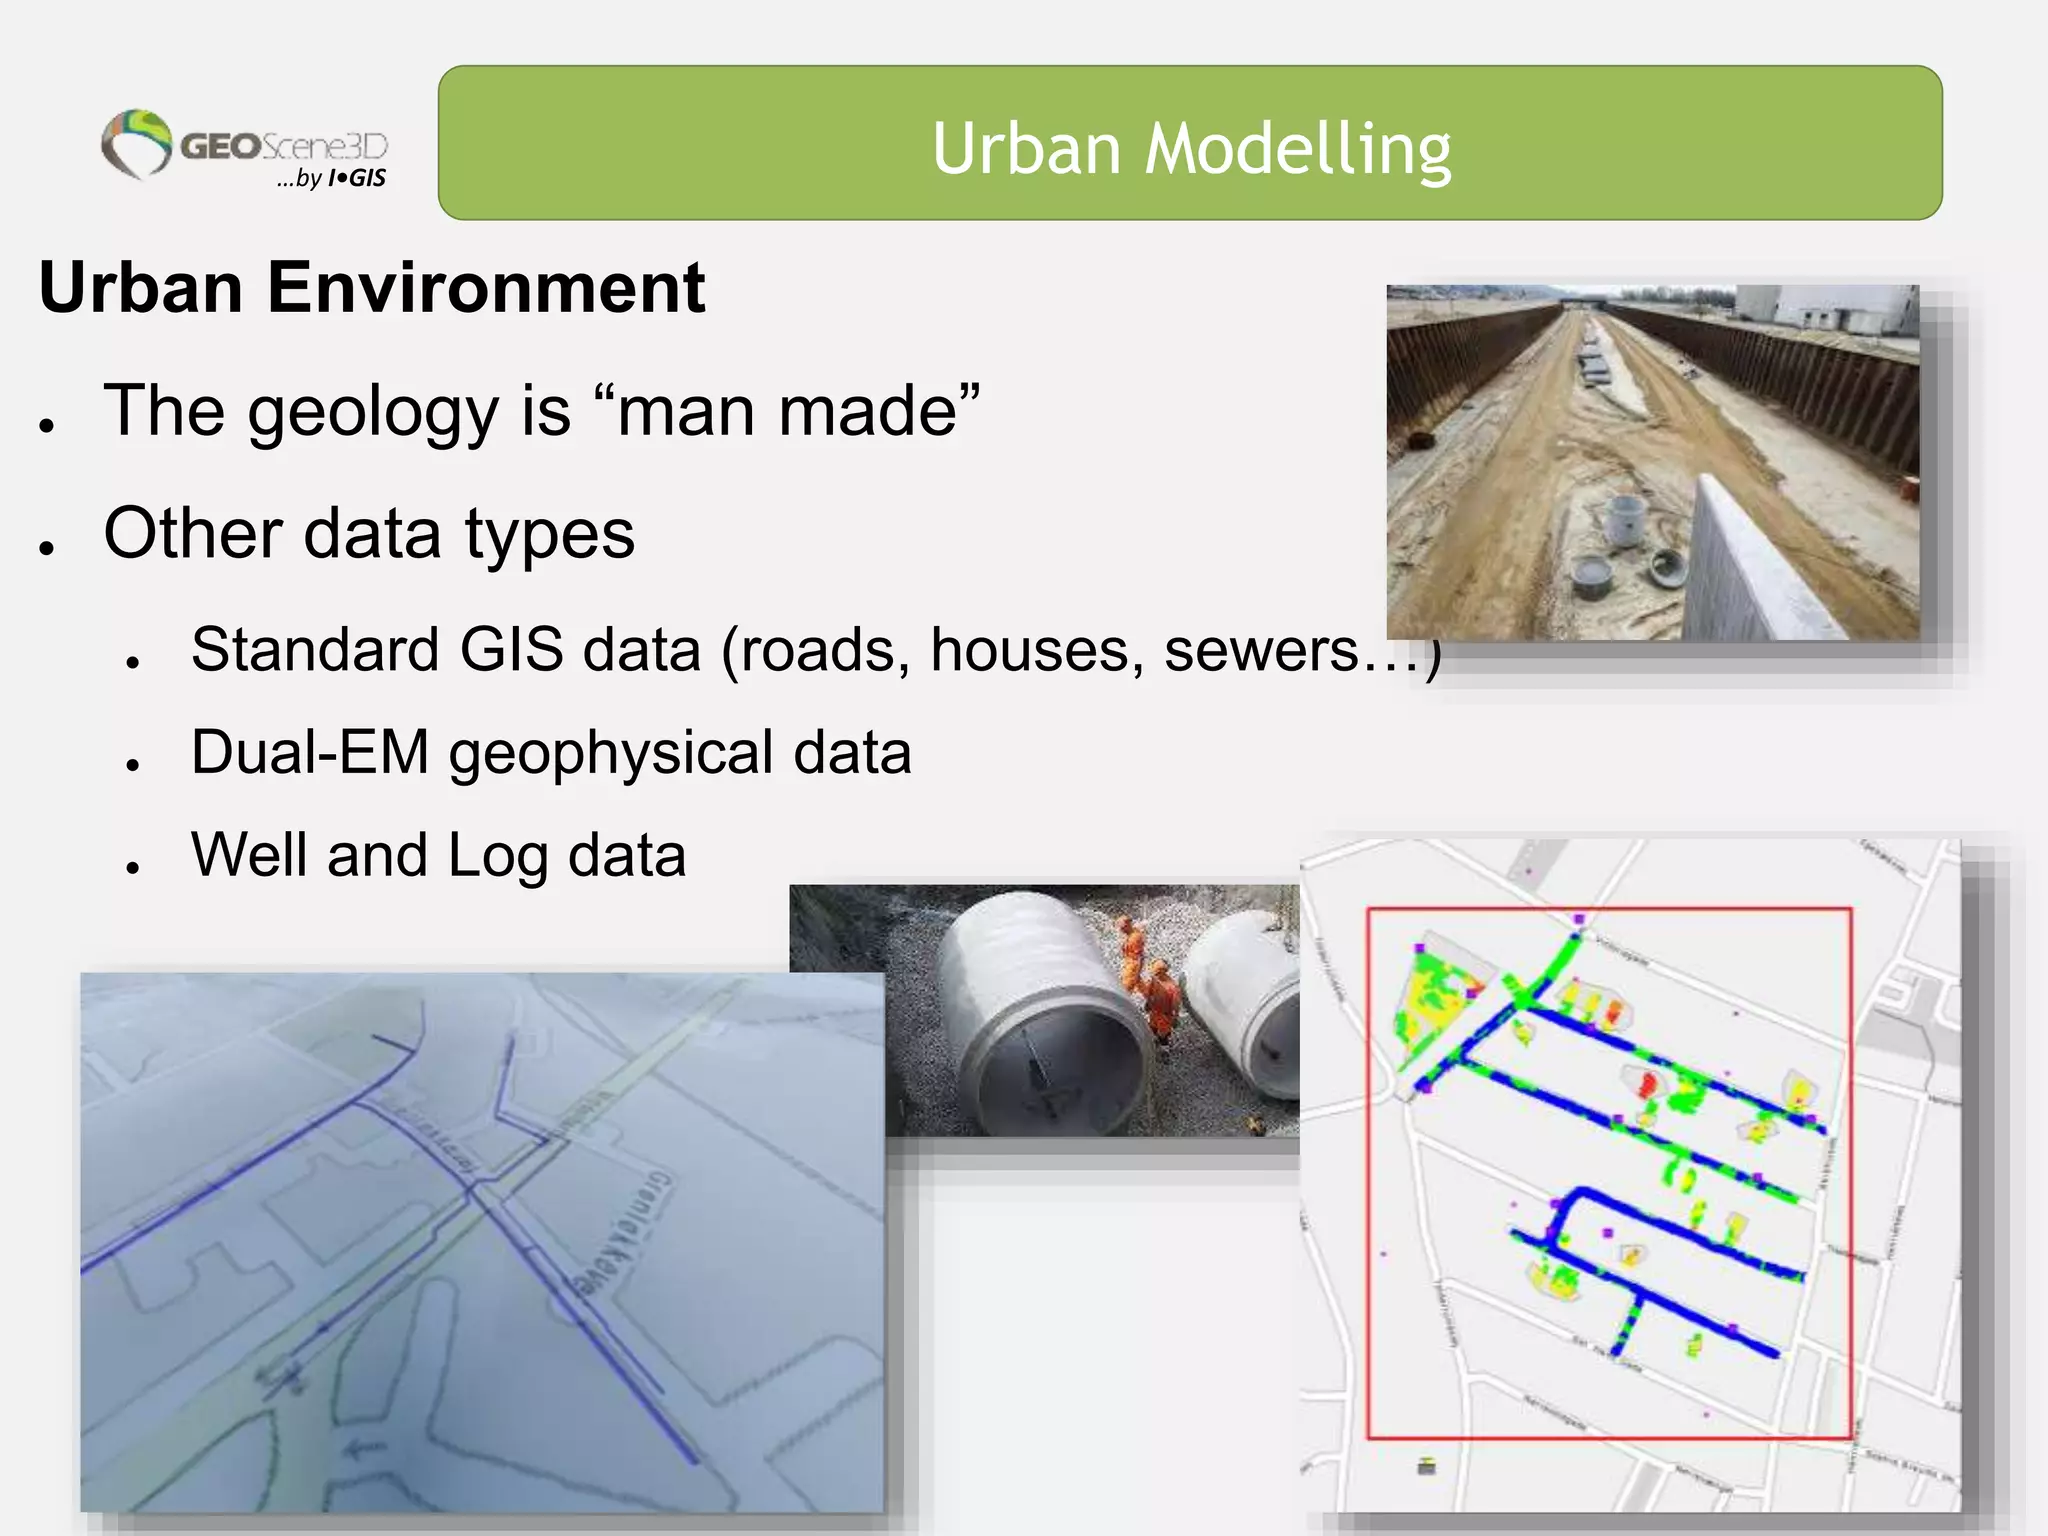
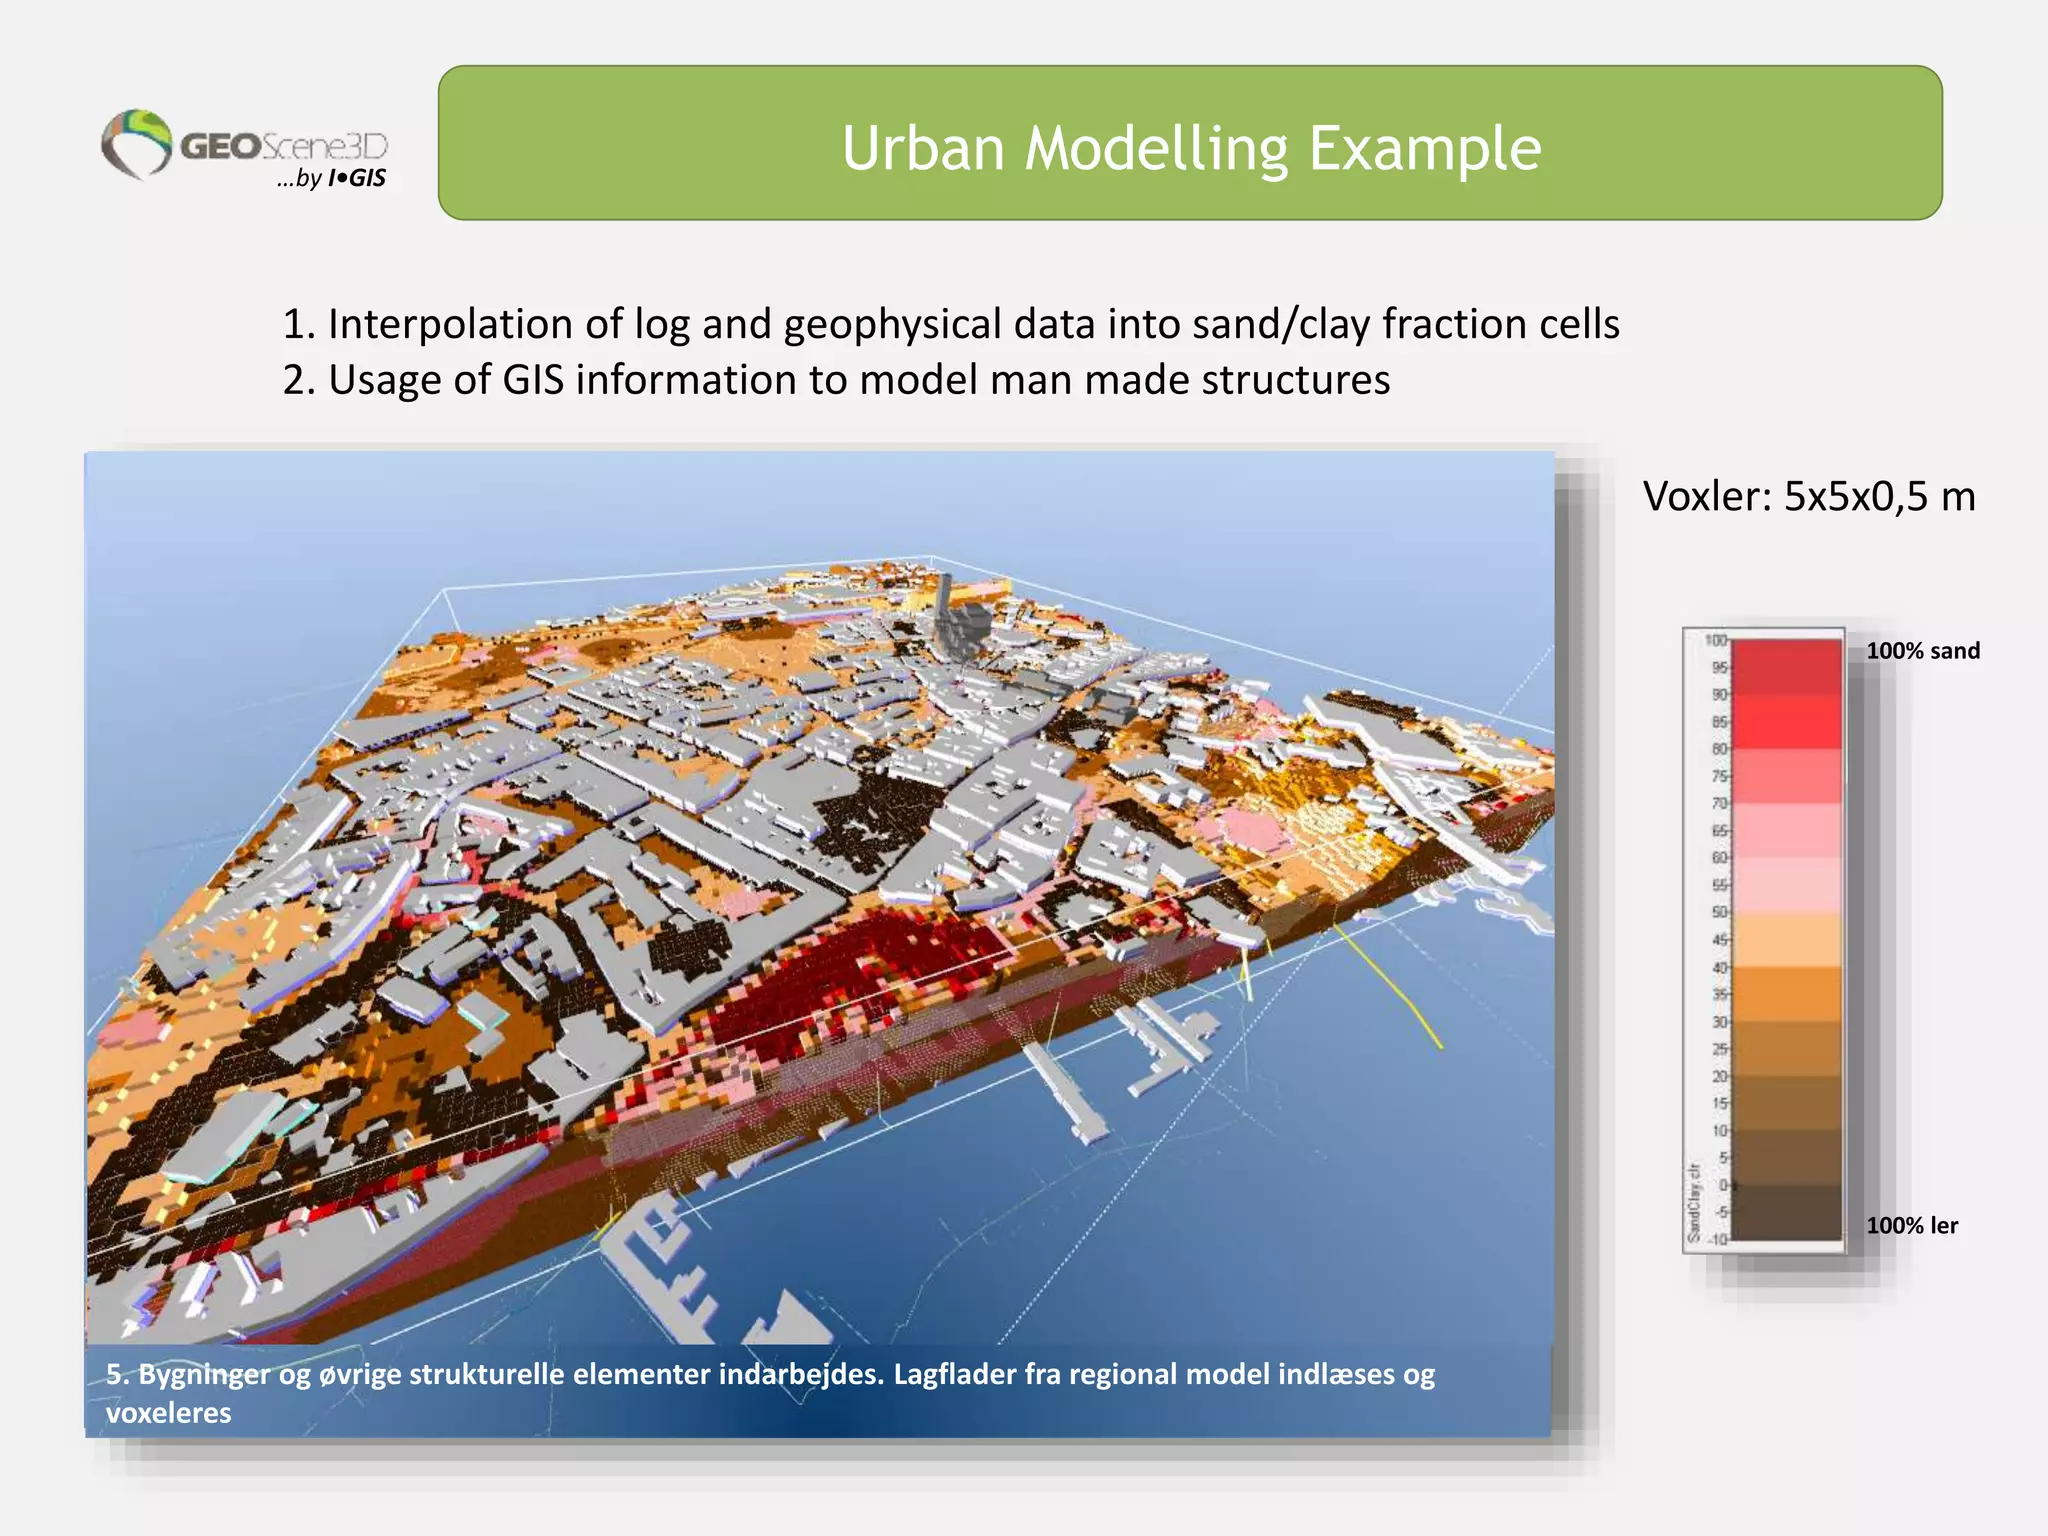
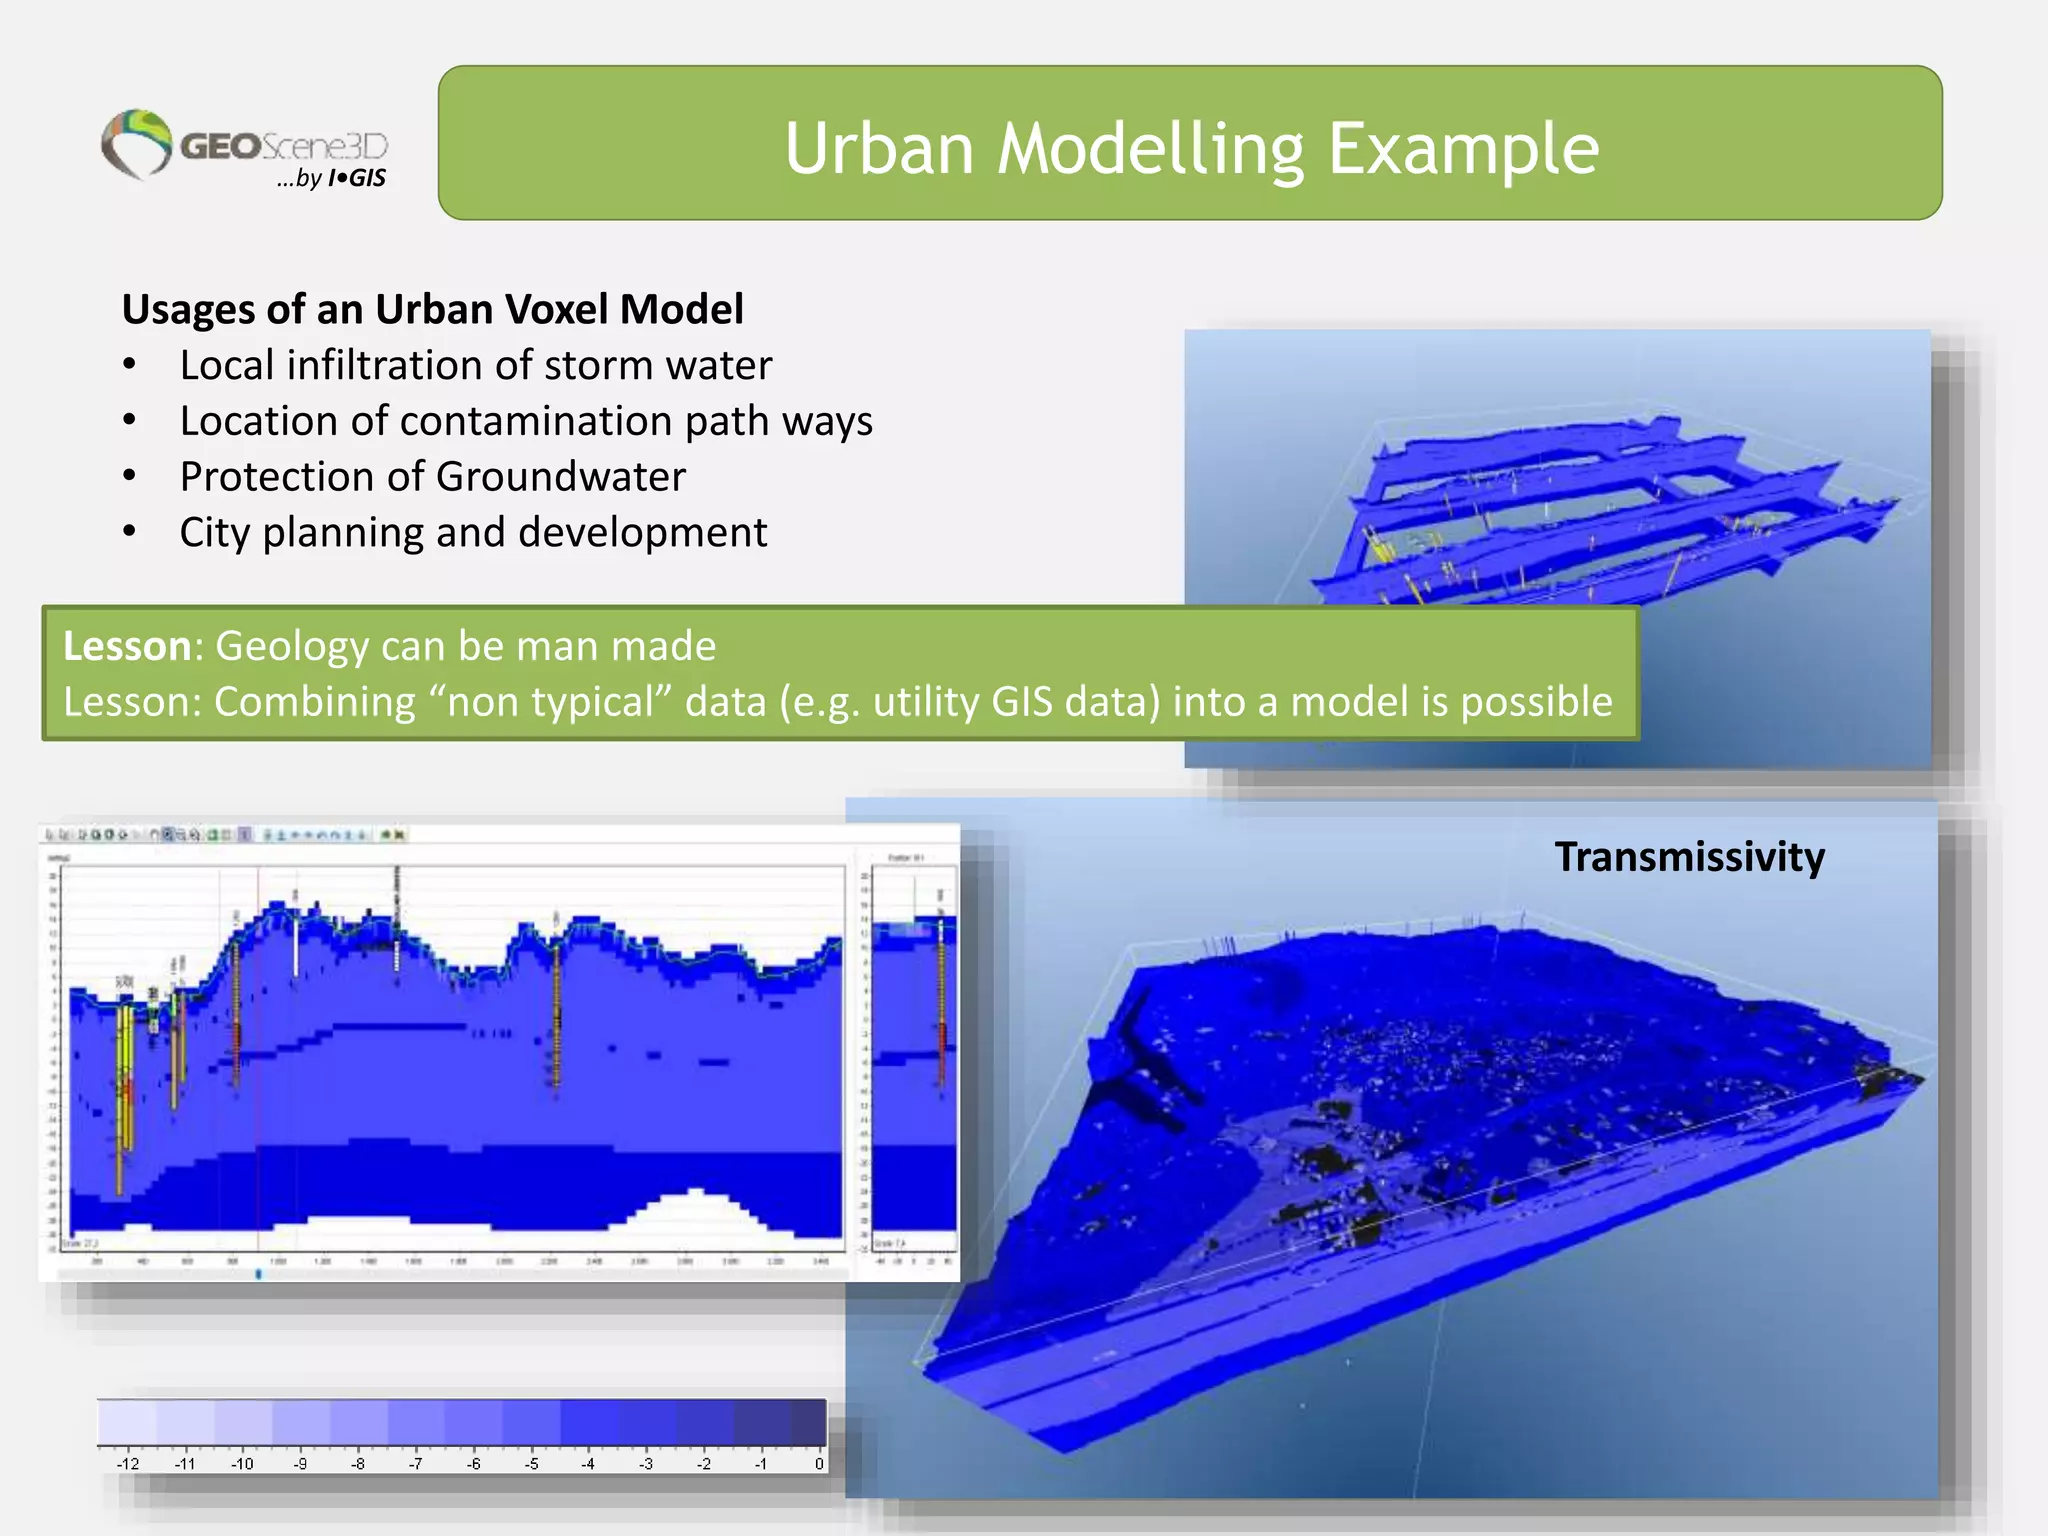
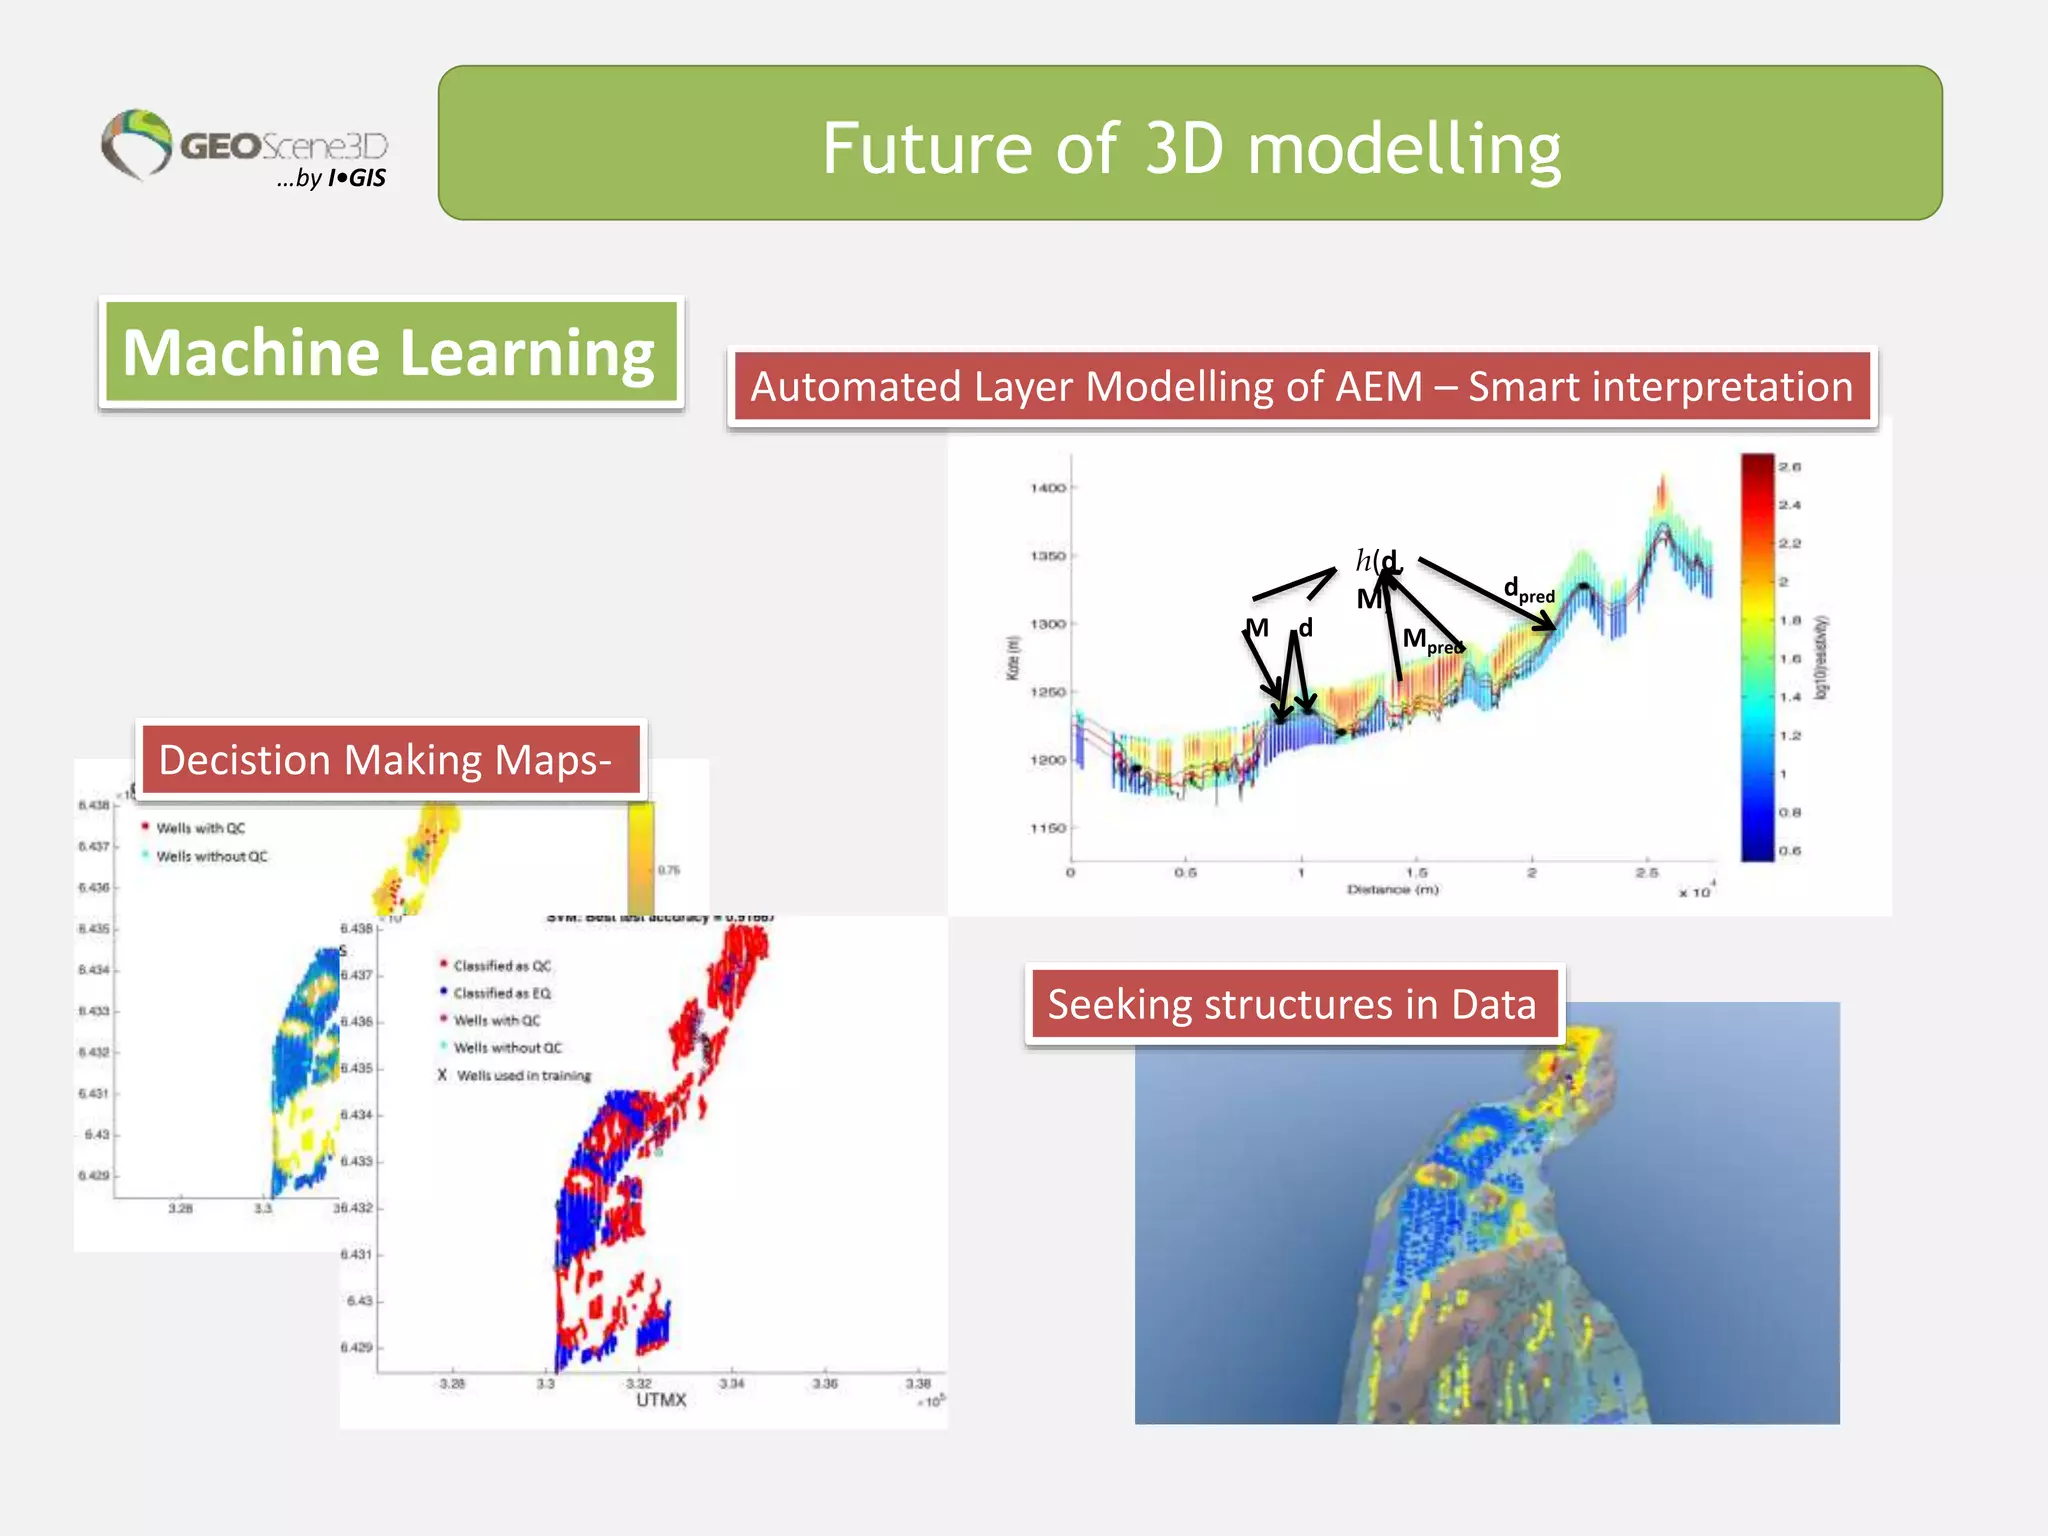
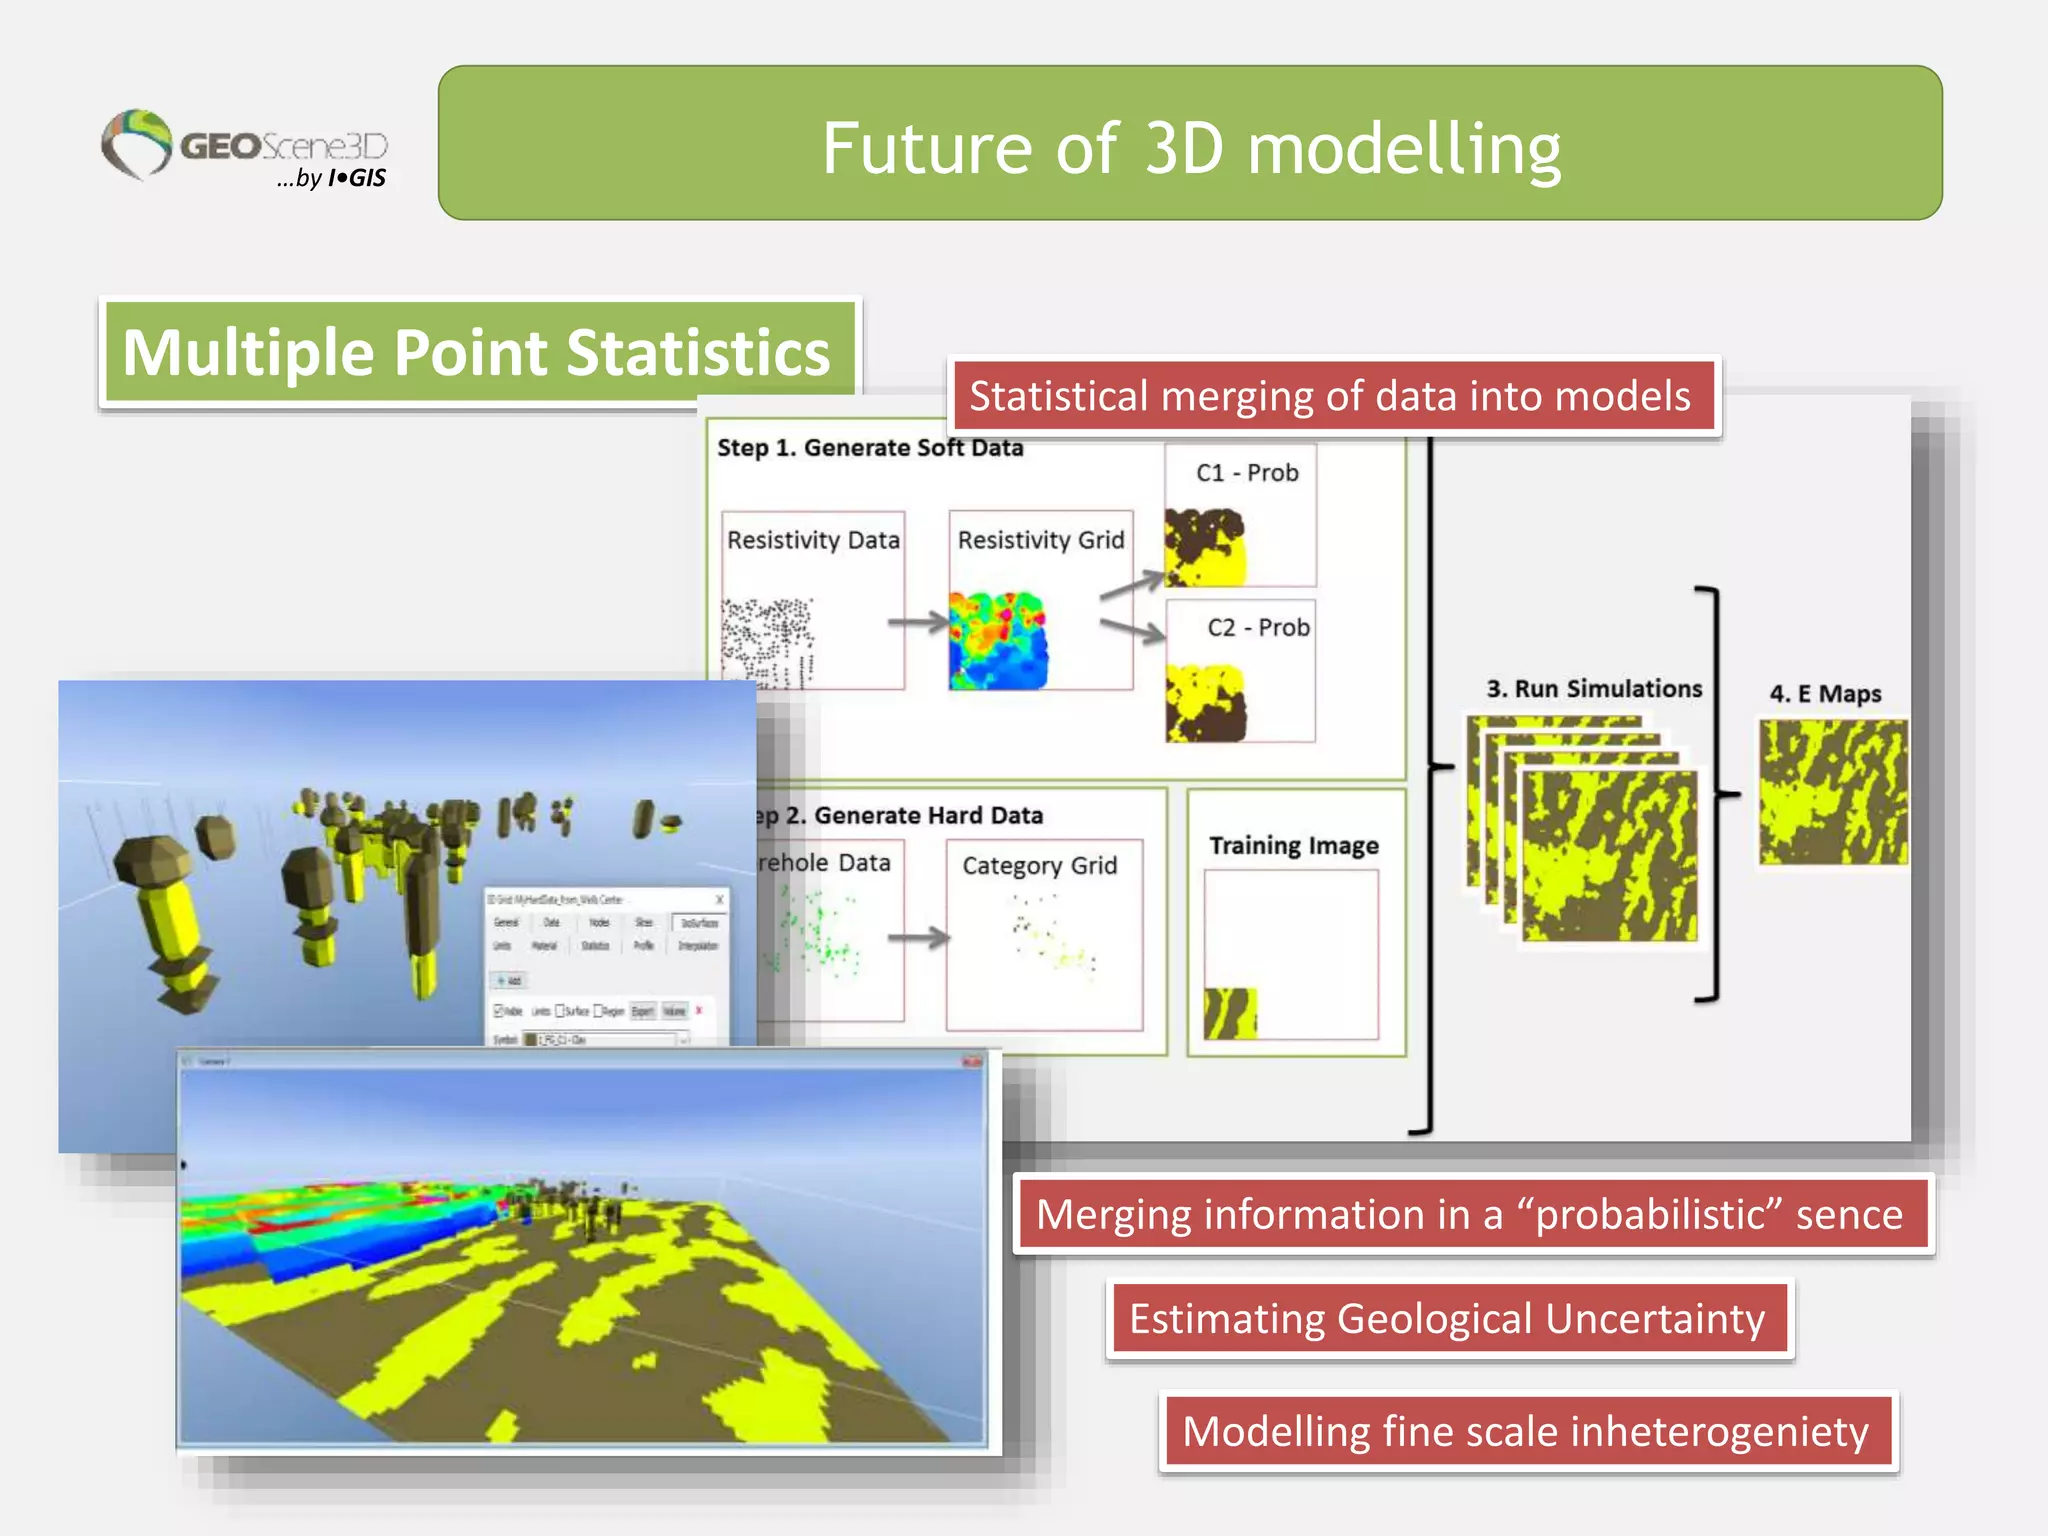
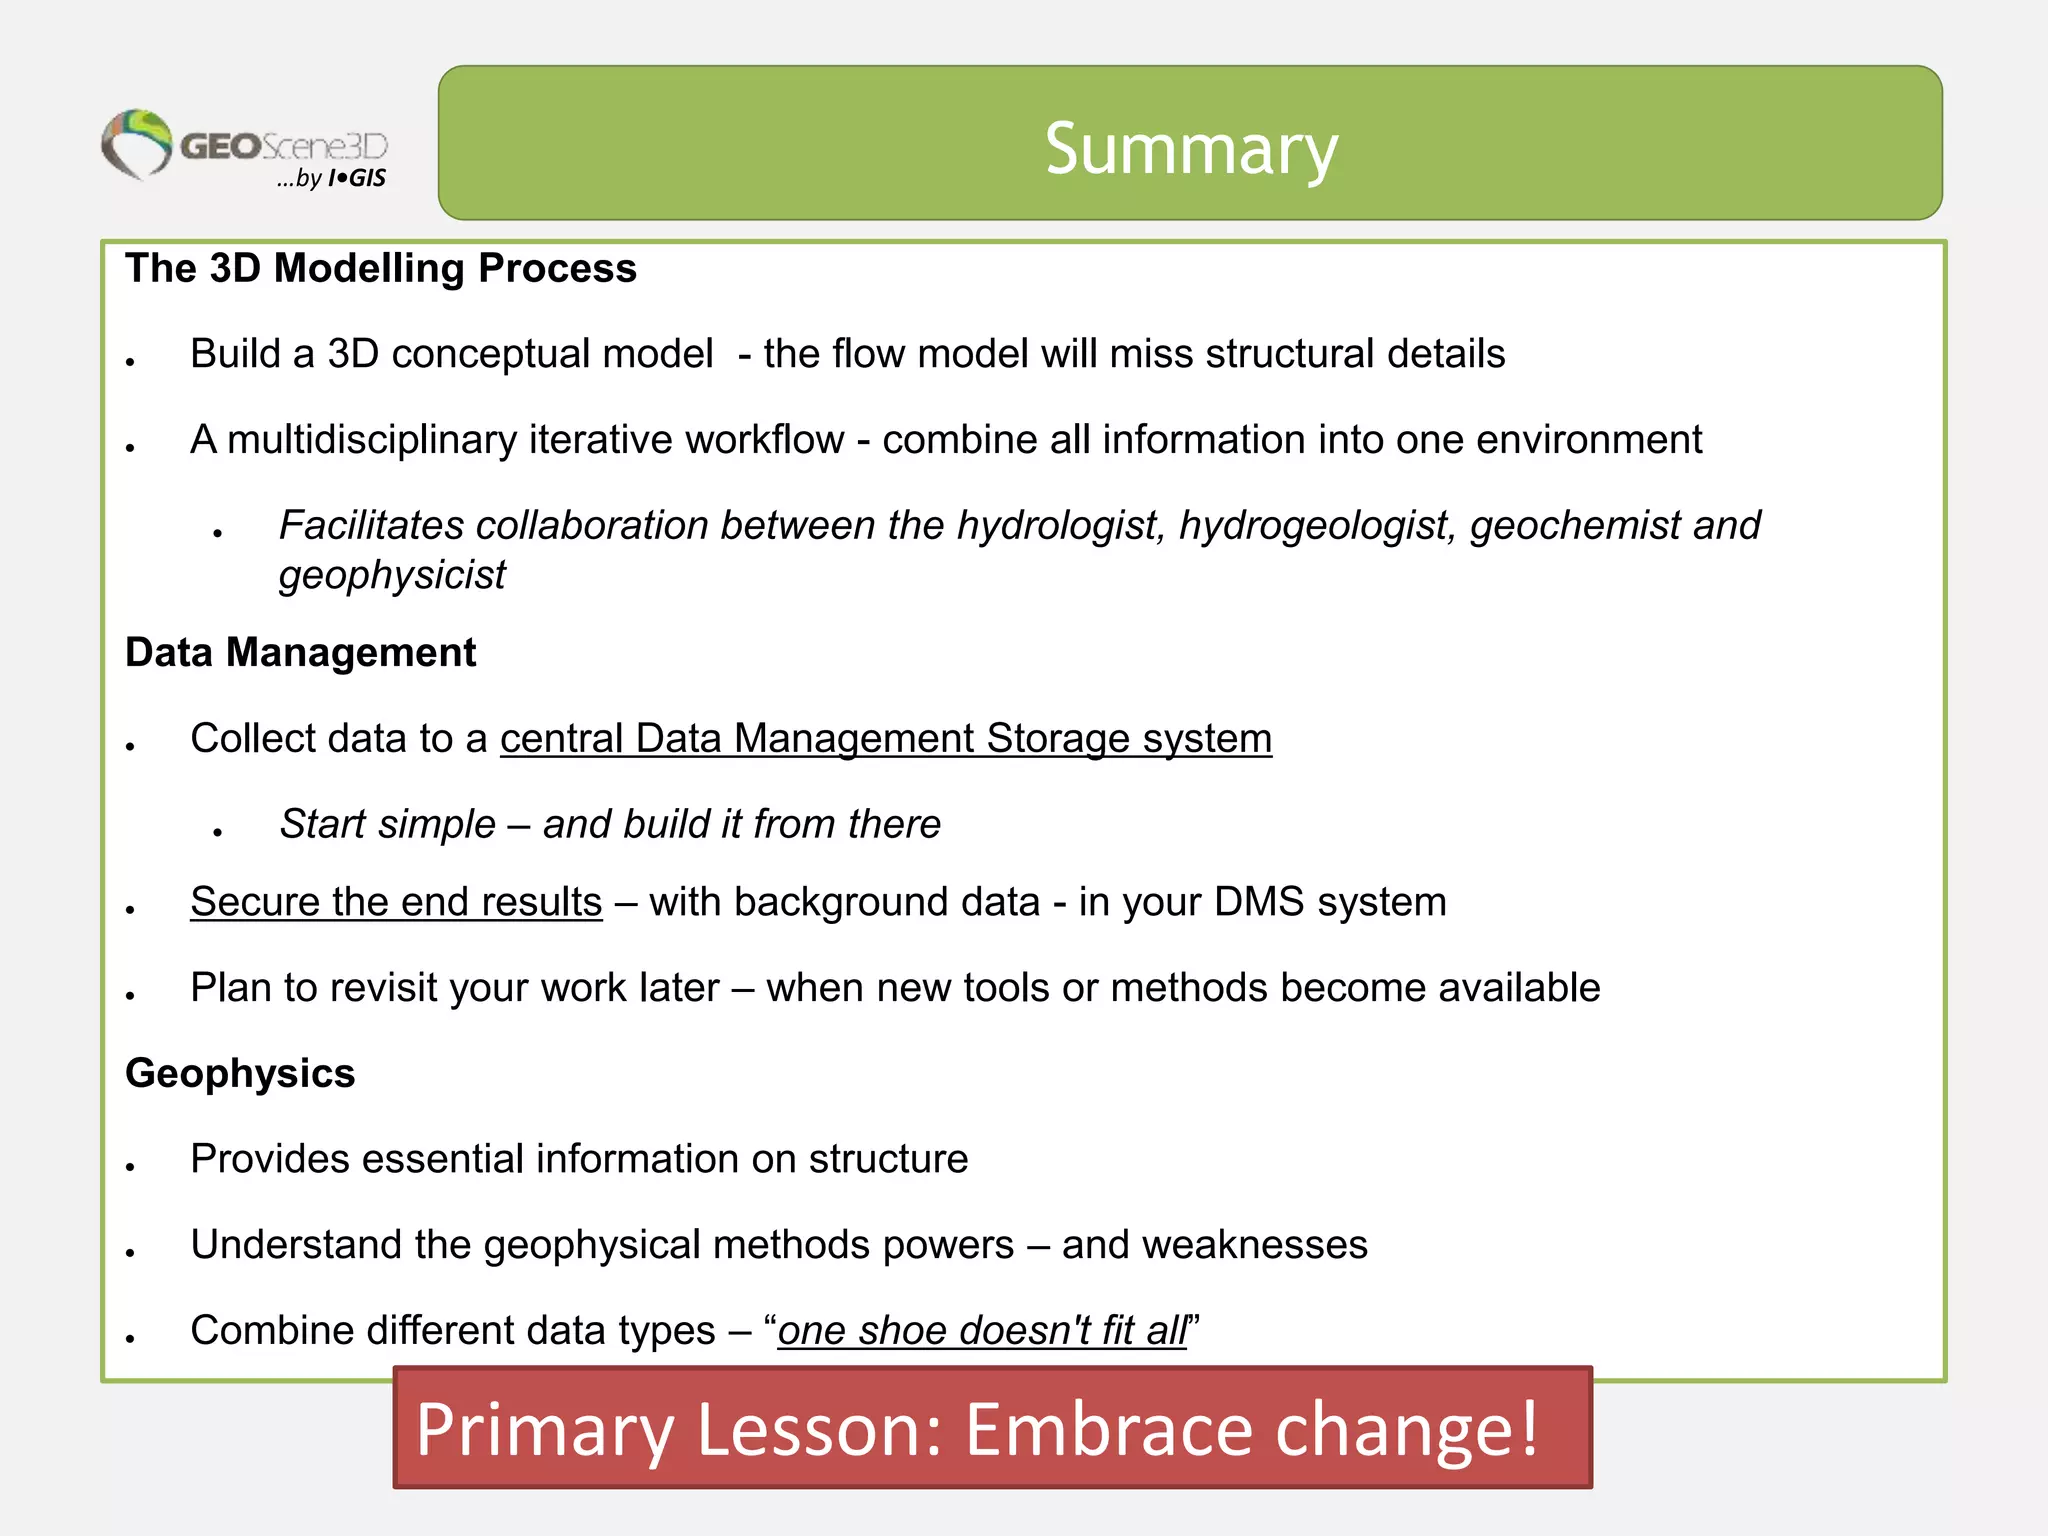
…by I•GIS
3D hydrogeological conceptual model building in Denmark
Lessons learned from the Danish groundwater mapping campaign
Torben Bach – tob@geoscene3d.com - www.geoscene3d.com – www.geoscene3d.com/youtube
Presented at the 2017 GRA meeting in Sacramento, CA
…by I•GIS
3D hydrogeological conceptual model building in Denmark
Presentation outline
• Lessons learned working with groundwater mapping and 3D modelling
• 2 examples of 3D model conceptual models
• Rural area, regional model
• Urban area
• Future trends in 3D modelling approaches
• Summary – lessons learned as seen from IGIS
Torben Bach1 (presenter), Tom Martlev Pallesen1, Mats Lundh Gulbrandsen1
1I•GIS, Voldbjergvej 14, 1st, 8240 Risskov, Denmark
…by I•GIS mid 90’s - Pre DK-SGMA
Map based on 518 boreholes Map based on 1,400 TEM soundings
• Flow model adds up … but does not correspond to what is experienced in the field
• We needed a better geometrical 3D understanding and more data
Wells Only Geophysics Added
Lesson: Geophysics provides spatial information and is fast and cost efficient
Lesson: Build a detailed hydrogeological model, flow models alone will lack detail.
…by I•GIS Denmark – quick overview
• Densely populated
• Wide spread production of groundwater – even in major cities
• DK-SGMA: Geophysics applied on a major scale
Population
Geophysical Data
GW Interests
…by I•GIS 3D hydrogeological model building
1998 Future2017
• Hand made cross-sections
• Layers digitized and gridded in Surfer
• Import all data into a 3D modelling environment
• Build a 3D conceptual model in one environment
• Enables iterative model development
• Fast an efficient
Lesson: Use a 3D geological modelling environment. Iterative model development & Data integration
…by I•GIS Fairytale Magic ?
?? Geophysics = Magic = No hard work  ??
Not So !
…by I•GIS Geophysical Magic?
Saltwater – Clay ?
Data are ambiguous… combine more data
…by I•GIS Geophysical Magic?
The COLLECTION PROCESS and PROCESSING of data also have an
influence on the results
SkyTEM (LCI/SCI – tolkning)
Lesson: Know the strengths and weakness of your data – and combine them
Effects from processing – NOT geology
…by I•GIS 2 Model Examples
Odense
SETTING
• Urban center
DATA
• Log data
• GIS data
• Sewers/pipes
• Houses
• Roads
MODEL TYPE
• 3D Voxel Model
• Small Area
Esbjerg
SETTING
• Rural Area
DATA
• AEM data
• TEM 40
• Seismic data
• Borehole data
• Log data
• Chemical data
MODEL TYPE
• 3D Layer Model
• Regional Scale
35x30 KM = 1050 KM2
(21x19 Miles = 259460 Acres)
…by I•GIS
3D hydrogeological Modelling
3D Modelling is reduction of complexity to get to a higher Level of understanding
Complex
“Simple”
…by I•GIS
3D Geological Modelling & Data
Well Data
AEM Data
ERT Data
TEM 40 Data
Chemical Data
Lesson: Locate and develop the right tools for the job
• Wrong tool – wrong result
Lesson: Collect data to a central Data Management Storage system
• A One-stop data shop ¨- Ensures updated data
• Promote collaboration on modelling – everybody looking at the same version of data
• Traceability and history - Enable future updating of model
Seismic Data
…by I•GIS 3D Geological Modelling
AEM ERT
Borehole
Chem
Combining information example…
Non-oxidated groundwater indicates protected reservoir…combined with well data, AEM and ERT
this delineates the layer surfaces, the buried valley structure and the protecting clay cover layer
Interpretation ….
• AEM delineates bottom of the paleo channel reservoir
• Chemistry – water quality – indicates a sealed reservoir
• Borehole data shows a series of minor clay layers that acts as reservoir seal
…by I•GIS 3D Geological Modelling
AEM ERT
Borehole
Chem
Interpretation ….
• The geologist adds the bottom of the paleo channel based on AEM and borehole data
• Based on borehole data and chemestry, the geologist adds a seiling clay layer
Data combination and understanding is key to geological interpretation
…by I•GIS 3D Geological Modelling
AEM ERT
Borehole
Chem
Reduction of complexity
• From many data sources to a simplified geological geometry
• Facilitating understanding on a higher level
• The hydrogeological model based on DATA is the basis of a good hydrostrati graphical model used
in flow modelling
• Find the right balance between geometrical complexity and calibration in the hydrological model
Reduction of complexity
Lesson: Get all data into one environment
Lesson: Combine several data types in your modelling work
…by I•GIS 3D Geological Modelling
Lessons from building 3D Model regional hydro geological model
• an iterative and interdiciplinary process
• Combines many different geoscience disciplines (chemistry, geophysics, hydrology, geology, GIS)
• A staff with a variety of skills is needed
…by I•GIS 3D Geological Modelling
Some usages of the 3D hydrogeological model
Directly : Reservoir thickness, volumetric calc., protection from pesticides, new well locations,
urban development
Reservoir specific Potentiometric Maps: Used for screening of pumping impact, e.g. streams or
other pumps, general managing the resource
Export to flow modelling: For further processing, e.g. in MODFLOW, Mike She or similar…
Lesson: The 3D conceptual model is used on its own – and is the foundation for several derivatives
…by I•GIS 2 Model Examples
Odense
SETTING
• Urban center
DATA
• Log data
• GIS data
• Sewers/pipes
• Houses
• Roads
MODEL TYPE
• 3D Voxel Model
• Small Area – city
block
Esbjerg
SETTING
• Rural Area
DATA
• AEM data
• TEM 40
• Seismic data
• Borehole data
• Log data
• Chemical data
MODEL TYPE
• 3D Layer Model
• Regional Scale
35x30 KM = 1050 KM2
(21x19 Miles = 259460 Acres)
…by I•GIS Urban Modelling
Urban Environment
● The geology is “man made”
● Other data types
● Standard GIS data (roads, houses, sewers…)
● Dual-EM geophysical data
● Well and Log data
…by I•GIS
Urban Modelling Example
1. Boringer samt drikkevand- og spildevandsledninger indlæst og vist i forhold til diameter2. Bund af fyldlaget og fyld-kategorier indlæses3. Fyldet interpoleres i 3D.4. Resten af fyldlaget udfyldes med anslået ”gennemsnits fyld” (genindbygget moræneler).
5. Bygninger og øvrige strukturelle elementer indarbejdes. Lagflader fra regional model indlæses og
voxeleres
100% sand
100% ler
Voxler: 5x5x0,5 m
1. Interpolation of log and geophysical data into sand/clay fraction cells
2. Usage of GIS information to model man made structures
…by I•GIS Urban Modelling Example
Usages of an Urban Voxel Model
• Local infiltration of storm water
• Location of contamination path ways
• Protection of Groundwater
• City planning and development
Transmissivity
Lesson: Geology can be man made
Lesson: Combining “non typical” data (e.g. utility GIS data) into a model is possible
…by I•GIS Future of 3D modelling
M d
h(d,
M)
Mpred
dpred
Statistical
Model
h(d,M)
Machine Learning Automated Layer Modelling of AEM – Smart interpretation
Decistion Making Maps-
Seeking structures in Data
…by I•GIS Future of 3D modelling
Multiple Point Statistics Statistical merging of data into models
Estimating Geological Uncertainty
Merging information in a “probabilistic” sence
Modelling fine scale inheterogeniety
…by I•GIS Summary
The 3D Modelling Process
● Build a 3D conceptual model - the flow model will miss structural details
● A multidisciplinary iterative workflow - combine all information into one environment
● Facilitates collaboration between the hydrologist, hydrogeologist, geochemist and
geophysicist
Data Management
● Collect data to a central Data Management Storage system
● Start simple – and build it from there
● Secure the end results – with background data - in your DMS system
● Plan to revisit your work later – when new tools or methods become available
Geophysics
● Provides essential information on structure
● Understand the geophysical methods powers – and weaknesses
● Combine different data types – “one shoe doesn't fit all”
Primary Lesson: Embrace change!

3d hydrogeological conceptual model building in denmark

  • 1.
    …by I•GIS 3D hydrogeologicalconceptual model building in Denmark Lessons learned from the Danish groundwater mapping campaign Torben Bach – tob@geoscene3d.com - www.geoscene3d.com – www.geoscene3d.com/youtube Presented at the 2017 GRA meeting in Sacramento, CA
  • 2.
    …by I•GIS 3D hydrogeologicalconceptual model building in Denmark Presentation outline • Lessons learned working with groundwater mapping and 3D modelling • 2 examples of 3D model conceptual models • Rural area, regional model • Urban area • Future trends in 3D modelling approaches • Summary – lessons learned as seen from IGIS Torben Bach1 (presenter), Tom Martlev Pallesen1, Mats Lundh Gulbrandsen1 1I•GIS, Voldbjergvej 14, 1st, 8240 Risskov, Denmark
  • 3.
    …by I•GIS mid90’s - Pre DK-SGMA Map based on 518 boreholes Map based on 1,400 TEM soundings • Flow model adds up … but does not correspond to what is experienced in the field • We needed a better geometrical 3D understanding and more data Wells Only Geophysics Added Lesson: Geophysics provides spatial information and is fast and cost efficient Lesson: Build a detailed hydrogeological model, flow models alone will lack detail.
  • 4.
    …by I•GIS Denmark– quick overview • Densely populated • Wide spread production of groundwater – even in major cities • DK-SGMA: Geophysics applied on a major scale Population Geophysical Data GW Interests
  • 5.
    …by I•GIS 3Dhydrogeological model building 1998 Future2017 • Hand made cross-sections • Layers digitized and gridded in Surfer • Import all data into a 3D modelling environment • Build a 3D conceptual model in one environment • Enables iterative model development • Fast an efficient Lesson: Use a 3D geological modelling environment. Iterative model development & Data integration
  • 6.
    …by I•GIS FairytaleMagic ? ?? Geophysics = Magic = No hard work  ?? Not So !
  • 7.
    …by I•GIS GeophysicalMagic? Saltwater – Clay ? Data are ambiguous… combine more data
  • 8.
    …by I•GIS GeophysicalMagic? The COLLECTION PROCESS and PROCESSING of data also have an influence on the results SkyTEM (LCI/SCI – tolkning) Lesson: Know the strengths and weakness of your data – and combine them Effects from processing – NOT geology
  • 9.
    …by I•GIS 2Model Examples Odense SETTING • Urban center DATA • Log data • GIS data • Sewers/pipes • Houses • Roads MODEL TYPE • 3D Voxel Model • Small Area Esbjerg SETTING • Rural Area DATA • AEM data • TEM 40 • Seismic data • Borehole data • Log data • Chemical data MODEL TYPE • 3D Layer Model • Regional Scale 35x30 KM = 1050 KM2 (21x19 Miles = 259460 Acres)
  • 10.
    …by I•GIS 3D hydrogeologicalModelling 3D Modelling is reduction of complexity to get to a higher Level of understanding Complex “Simple”
  • 11.
    …by I•GIS 3D GeologicalModelling & Data Well Data AEM Data ERT Data TEM 40 Data Chemical Data Lesson: Locate and develop the right tools for the job • Wrong tool – wrong result Lesson: Collect data to a central Data Management Storage system • A One-stop data shop ¨- Ensures updated data • Promote collaboration on modelling – everybody looking at the same version of data • Traceability and history - Enable future updating of model Seismic Data
  • 12.
    …by I•GIS 3DGeological Modelling AEM ERT Borehole Chem Combining information example… Non-oxidated groundwater indicates protected reservoir…combined with well data, AEM and ERT this delineates the layer surfaces, the buried valley structure and the protecting clay cover layer Interpretation …. • AEM delineates bottom of the paleo channel reservoir • Chemistry – water quality – indicates a sealed reservoir • Borehole data shows a series of minor clay layers that acts as reservoir seal
  • 13.
    …by I•GIS 3DGeological Modelling AEM ERT Borehole Chem Interpretation …. • The geologist adds the bottom of the paleo channel based on AEM and borehole data • Based on borehole data and chemestry, the geologist adds a seiling clay layer Data combination and understanding is key to geological interpretation
  • 14.
    …by I•GIS 3DGeological Modelling AEM ERT Borehole Chem Reduction of complexity • From many data sources to a simplified geological geometry • Facilitating understanding on a higher level • The hydrogeological model based on DATA is the basis of a good hydrostrati graphical model used in flow modelling • Find the right balance between geometrical complexity and calibration in the hydrological model Reduction of complexity Lesson: Get all data into one environment Lesson: Combine several data types in your modelling work
  • 15.
    …by I•GIS 3DGeological Modelling Lessons from building 3D Model regional hydro geological model • an iterative and interdiciplinary process • Combines many different geoscience disciplines (chemistry, geophysics, hydrology, geology, GIS) • A staff with a variety of skills is needed
  • 16.
    …by I•GIS 3DGeological Modelling Some usages of the 3D hydrogeological model Directly : Reservoir thickness, volumetric calc., protection from pesticides, new well locations, urban development Reservoir specific Potentiometric Maps: Used for screening of pumping impact, e.g. streams or other pumps, general managing the resource Export to flow modelling: For further processing, e.g. in MODFLOW, Mike She or similar… Lesson: The 3D conceptual model is used on its own – and is the foundation for several derivatives
  • 17.
    …by I•GIS 2Model Examples Odense SETTING • Urban center DATA • Log data • GIS data • Sewers/pipes • Houses • Roads MODEL TYPE • 3D Voxel Model • Small Area – city block Esbjerg SETTING • Rural Area DATA • AEM data • TEM 40 • Seismic data • Borehole data • Log data • Chemical data MODEL TYPE • 3D Layer Model • Regional Scale 35x30 KM = 1050 KM2 (21x19 Miles = 259460 Acres)
  • 18.
    …by I•GIS UrbanModelling Urban Environment ● The geology is “man made” ● Other data types ● Standard GIS data (roads, houses, sewers…) ● Dual-EM geophysical data ● Well and Log data
  • 19.
    …by I•GIS Urban ModellingExample 1. Boringer samt drikkevand- og spildevandsledninger indlæst og vist i forhold til diameter2. Bund af fyldlaget og fyld-kategorier indlæses3. Fyldet interpoleres i 3D.4. Resten af fyldlaget udfyldes med anslået ”gennemsnits fyld” (genindbygget moræneler). 5. Bygninger og øvrige strukturelle elementer indarbejdes. Lagflader fra regional model indlæses og voxeleres 100% sand 100% ler Voxler: 5x5x0,5 m 1. Interpolation of log and geophysical data into sand/clay fraction cells 2. Usage of GIS information to model man made structures
  • 20.
    …by I•GIS UrbanModelling Example Usages of an Urban Voxel Model • Local infiltration of storm water • Location of contamination path ways • Protection of Groundwater • City planning and development Transmissivity Lesson: Geology can be man made Lesson: Combining “non typical” data (e.g. utility GIS data) into a model is possible
  • 21.
    …by I•GIS Futureof 3D modelling M d h(d, M) Mpred dpred Statistical Model h(d,M) Machine Learning Automated Layer Modelling of AEM – Smart interpretation Decistion Making Maps- Seeking structures in Data
  • 22.
    …by I•GIS Futureof 3D modelling Multiple Point Statistics Statistical merging of data into models Estimating Geological Uncertainty Merging information in a “probabilistic” sence Modelling fine scale inheterogeniety
  • 23.
    …by I•GIS Summary The3D Modelling Process ● Build a 3D conceptual model - the flow model will miss structural details ● A multidisciplinary iterative workflow - combine all information into one environment ● Facilitates collaboration between the hydrologist, hydrogeologist, geochemist and geophysicist Data Management ● Collect data to a central Data Management Storage system ● Start simple – and build it from there ● Secure the end results – with background data - in your DMS system ● Plan to revisit your work later – when new tools or methods become available Geophysics ● Provides essential information on structure ● Understand the geophysical methods powers – and weaknesses ● Combine different data types – “one shoe doesn't fit all” Primary Lesson: Embrace change!