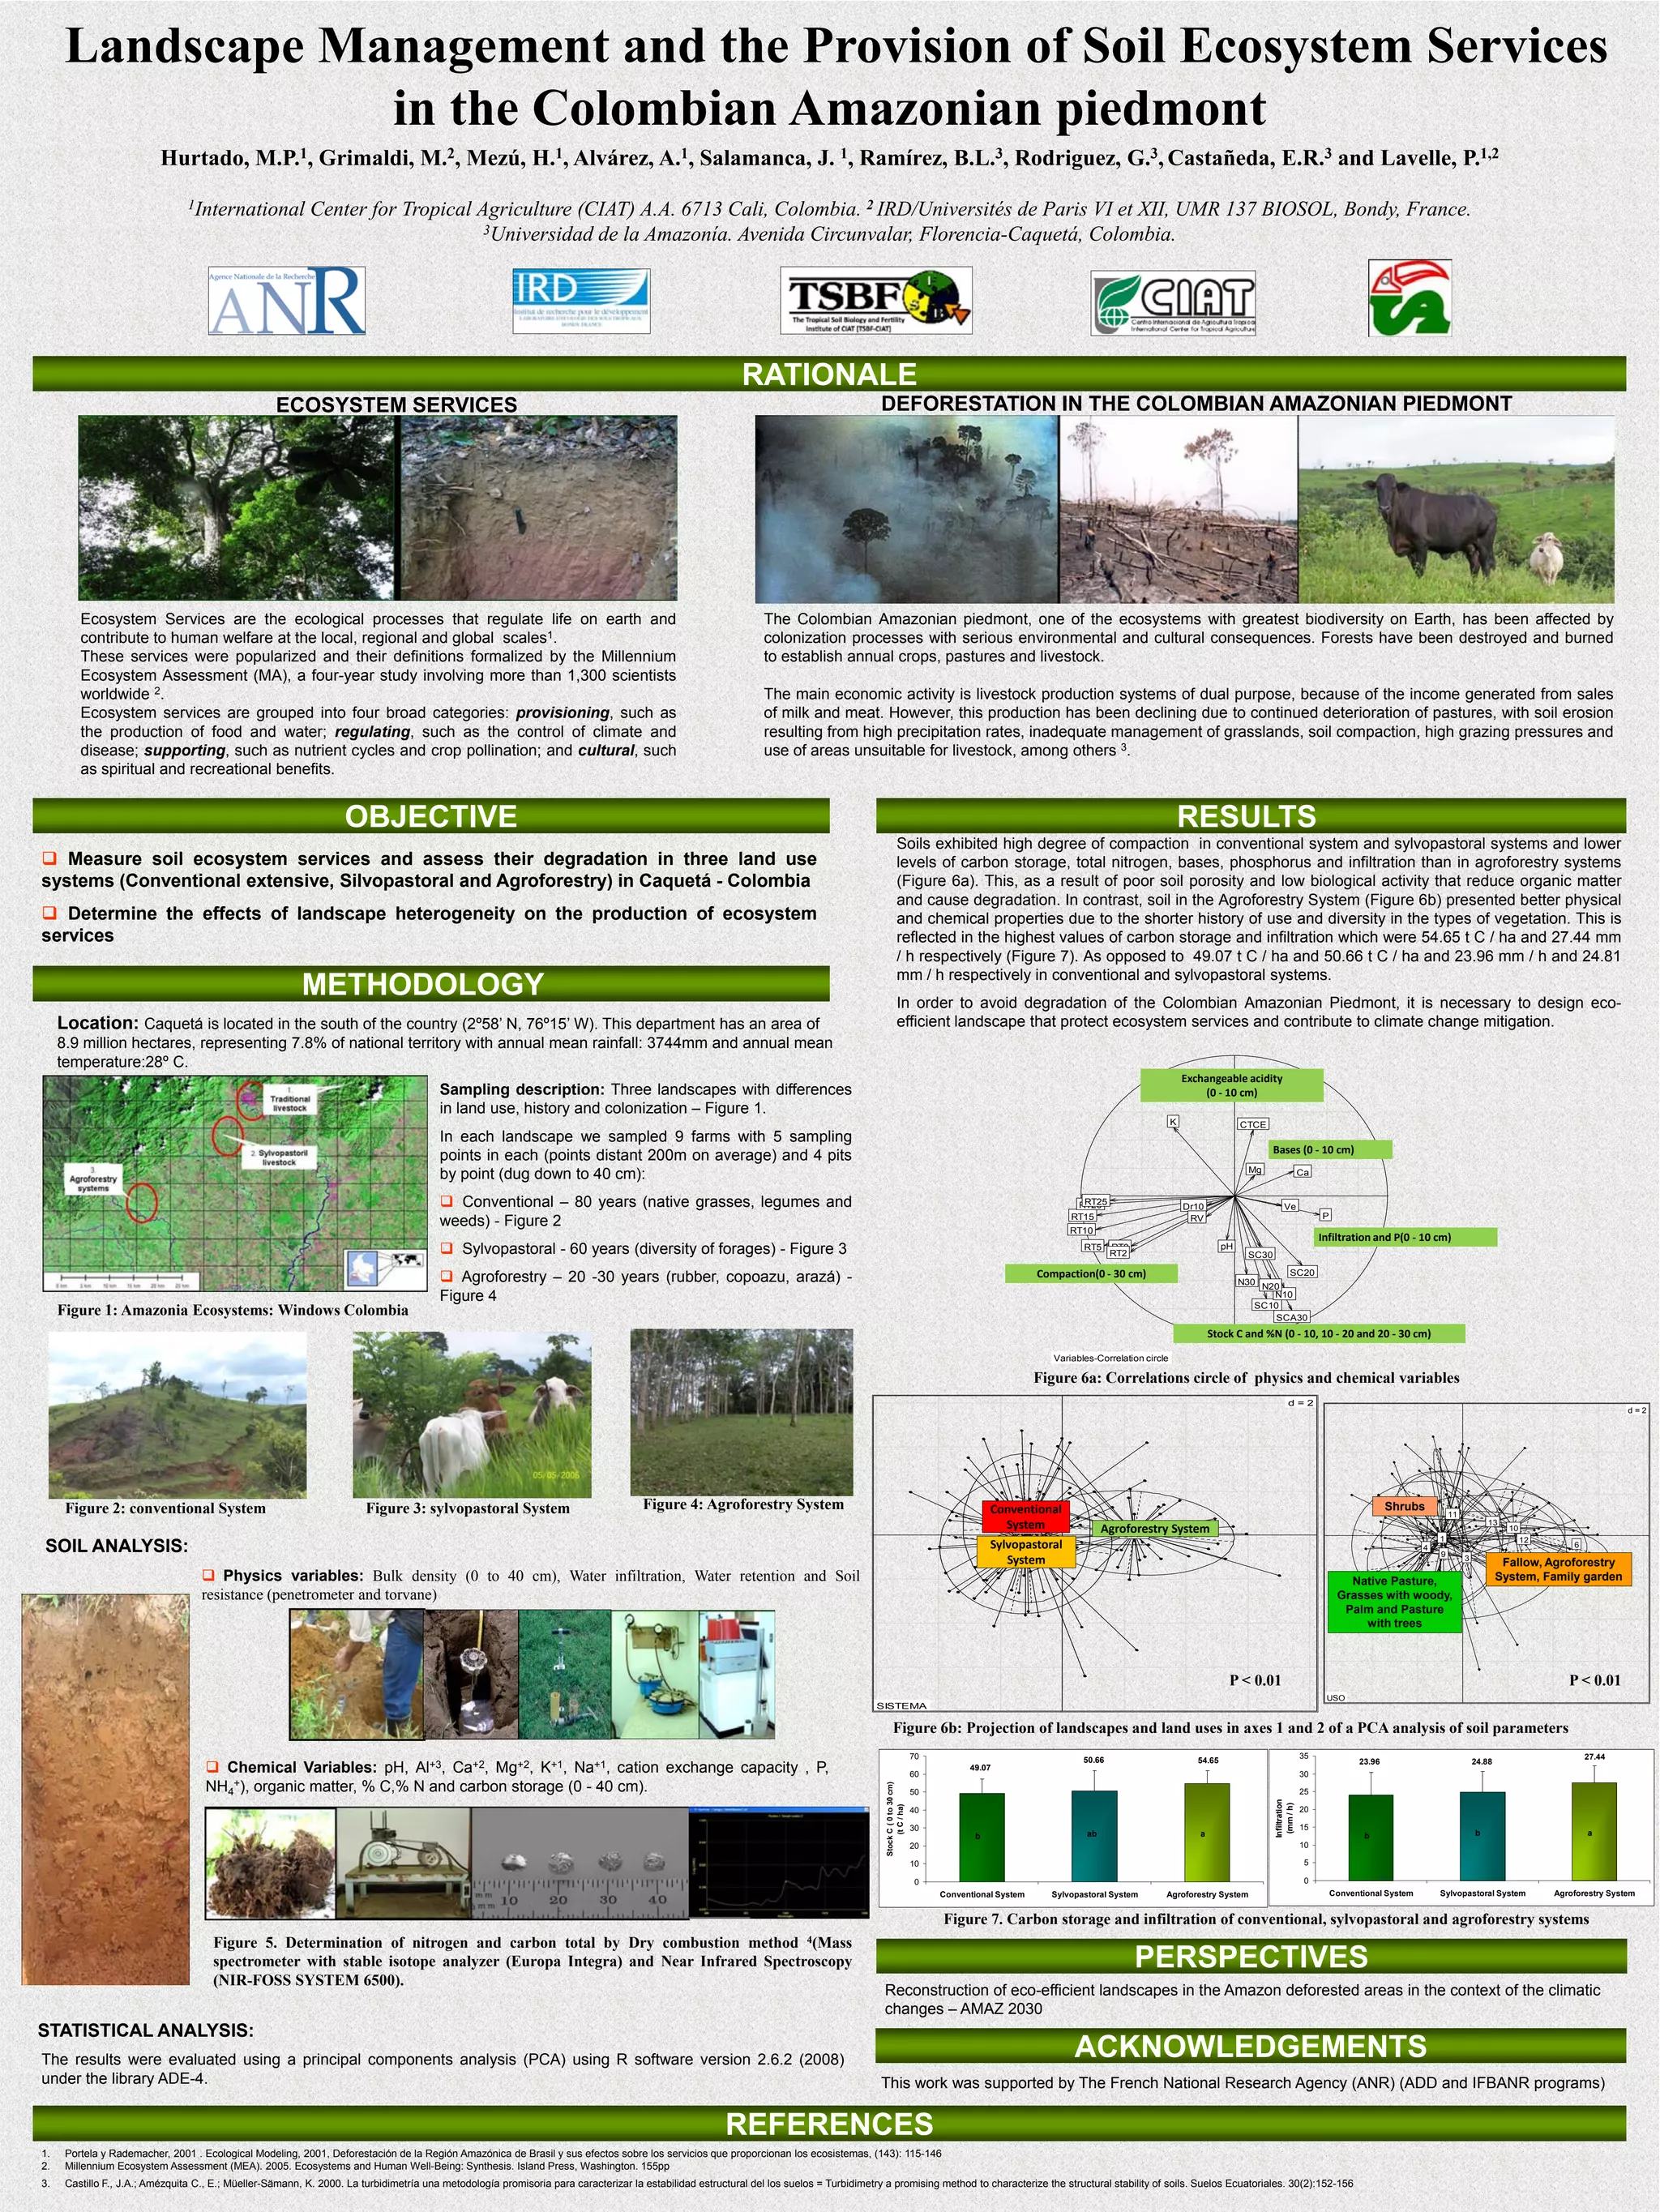
Landscape Management and the Provision of Soil Ecosystem Services
                  in the Colombian Amazonian piedmont
                           Hurtado, M.P.1, Grimaldi, M.2, Mezú, H.1, Alvárez, A.1, Salamanca, J. 1, Ramírez, B.L.3, Rodriguez, G.3, Castañeda, E.R.3 and Lavelle, P.1,2
                                 1International             Center for Tropical Agriculture (CIAT) A.A. 6713 Cali, Colombia. 2 IRD/Universités de Paris VI et XII, UMR 137 BIOSOL, Bondy, France.
                                                                                 3Universidad de la Amazonía. Avenida Circunvalar, Florencia-Caquetá, Colombia.


                                                                                                                                                           RATIONALE
                                                    ECOSYSTEM SERVICES                                                                                                                    DEFORESTATION IN THE COLOMBIAN AMAZONIAN PIEDMONT


         Ecosystem Services are the ecological processes that regulate life on earth and                                                                        The Colombian Amazonian piedmont, one of the ecosystems with greatest biodiversity on Earth, has been affected by
         contribute to human welfare at the local, regional and global scales1.                                                                                 colonization processes with serious environmental and cultural consequences. Forests have been destroyed and burned
         These services were popularized and their definitions formalized by the Millennium                                                                     to establish annual crops, pastures and livestock.
         Ecosystem Assessment (MA), a four-year study involving more than 1,300 scientists
         worldwide 2.                                                                                                                                           The main economic activity is livestock production systems of dual purpose because of the income generated from sales
                                                                                                                                                                                                                                   purpose,
         Ecosystem services are grouped into four broad categories: provisioning, such as                                                                       of milk and meat. However, this production has been declining due to continued deterioration of pastures, with soil erosion
         the production of food and water; regulating, such as the control of climate and                                                                       resulting from high precipitation rates, inadequate management of grasslands, soil compaction, high grazing pressures and
         disease; supporting, such as nutrient cycles and crop pollination; and cultural, such                                                                  use of areas unsuitable for livestock, among others 3.
         as spiritual and recreational benefits.


                                                                   OBJECTIVE                                                                                                                                                                                                        RESULTS
                                                                                                                                                                                                      Soils exhibited high degree of compaction in conventional system and sylvopastoral systems and lower
 Measure soil ecosystem services and assess their degradation in three land use                                                                                                                      levels of carbon storage, total nitrogen, bases, phosphorus and infiltration than in agroforestry systems
systems (Conventional extensive, Silvopastoral and Agroforestry) in Caquetá - Colombia                                                                                                                (Figure 6a). This, as a result of poor soil porosity and low biological activity that reduce organic matter
                                                                                                                                                                                                      and cause degradation. In contrast, soil in the Agroforestry System (Figure 6b) presented better physical
 Determine the effects of landscape heterogeneity on the production of ecosystem                                                                                                                     and chemical properties due to the shorter history of use and diversity in the types of vegetation. This is
services                                                                                                                                                                                              reflected in the highest values of carbon storage and infiltration which were 54.65 t C / ha and 27.44 mm
                                                                                                                                                                                                      / h respectively (Figure 7). As opposed to 49.07 t C / ha and 50.66 t C / ha and 23.96 mm / h and 24.81
                                                                                                                                                                                                      mm / h respectively in conventional and sylvopastoral systems.
                                                          METHODOLOGY                                                                                                                                 In order to avoid degradation of the Colombian Amazonian Piedmont, it is necessary to design eco-
     Location: Caquetá is located in the south of the country (2º58’ N, 76º15’ W). This department has an area of                                                                                     efficient landscape that protect ecosystem services and contribute to climate change mitigation.
     8.9 million hectares, representing 7.8% of national territory with annual mean rainfall: 3744mm and annual mean
     temperature:28º C.
                                                                                                                                                                                                                                                                                    Exchangeable acidity
                                                                                        Sampling description: Three landscapes with differences                                                                                                                                         (0 ‐ 10 cm)
                                                                                        in land use history and colonization – Figure 1
                                                                                                use,                                  1.
                                                                                                                                                                                                                                                                                K                   CTCE
                                                                                        In each landscape we sampled 9 farms with 5 sampling
                                                                                                                                                                                                                                                                                                            Bases (0 ‐ 10 cm)
                                                                                        points in each (points distant 200m on average) and 4 pits
                                                                                                                                                                                                                                                                                                     Mg
                                                                                        by point (dug down to 40 cm):                                                                                                                                                                                                      Ca


                                                                                         Conventional – 80 years (native grasses, legumes and                                                                                                         RT25
                                                                                                                                                                                                                                                      RT20                          Dr10                         Ve
                                                                                                                                                                                                                                                     RT15                                                                       P
                                                                                        weeds) - Figure 2                                                                                                                                           RT10
                                                                                                                                                                                                                                                                                     RV

                                                                                                                                                                                                                                                                                                                                Infiltration and P(0 ‐ 10 cm)
                                                                                         S l
                                                                                          Sylvopastoral - 60 years (di
                                                                                                  t l              (diversity of f
                                                                                                                          it f forages) - Fi
                                                                                                                                      ) Figure 3                                                                                                        RT5
                                                                                                                                                                                                                                                        RT      RT0
                                                                                                                                                                                                                                                                RT2
                                                                                                                                                                                                                                                                                               pH
                                                                                                                                                                                                                                                                                                H
                                                                                                                                                                                                                                                                                                     SC30

                                                                                         Agroforestry – 20 -30 years (rubber, copoazu, arazá) -                                                                                              Compaction(0 ‐ 30 cm)
                                                                                                                                                                                                                                                                                                    N30
                                                                                                                                                                                                                                                                                                       N20
                                                                                                                                                                                                                                                                                                                     SC20

                                                                                        Figure 4                                                                                                                                                                                                         N10
                                                                                                                                                                                                                                                                                                      SC10
     Figure 1: Amazonia Ecosystems: Windows Colombia                                                                                                                                                                                                                                                      SCA30
                                                                                                                                                                                                                                                                                           Stock C and %N (0 ‐ 10, 10 ‐ 20 and 20 ‐ 30 cm)

                                                                                                                                                                                                                                                 Variables-Correlation circle

                                                                                                                                                                                                                                              Figure 6a: Correlations circle of physics and chemical variables
                                                                                                                                                                                                                                                                                                                   d=2
                                                                                                                                                                                                                                                                                                                                                                                                                d=2


      Figure 2: conventional System                                     Figure 3: sylvopastoral System                               Figure 4: Agroforestry System                                                                 Conventional                                                                                                   Shrubs
                                                                                                                                                                                                                                                                                                                                                                  11
                                                                                                                                                                                                                                     System
                                                                                                                                                                                                                                       CTR                    Agroforestry System
                                                                                                                                                                                                                                                                                                                                                                               13
                                                                                                                                                                                                                                                                                                                                                                                     10
                                                                                                                                                                                                                                                                 CAF
                                                                                                                                                                                                                                                                                                                                                              1                           12
SOIL ANALYSIS:                                                                                                                                                                                                                     Sylvopastoral 
                                                                                                                                                                                                                                       CSP                                                                                                                4                                        6
                                                                                                                                                                                                                                                                                                                                                              9
                                                                                                                                                                                                                                      System                                                                                                                           3
                                                                                                                                                                                                                                                                                                                                                                                    Fallow, Agroforestry
                                     Physics variables: Bulk density (0 to 40 cm), Water infiltration, Water retention and Soil                                                                                                                                                                                                       Native Pasture,                             System, Family garden
                                    resistance (penetrometer and torvane)                                                                                                                                                                                                                                                            Grasses with woody,
                                                                                                                                                                                                                                                                                                                                      Palm and Pasture
                                                                                                                                                                                                                                                                                                                                          with trees


                                                                                                                                                                                                                                                                                                P < 0.01                                                                                          P < 0.01
                                                                                                                                                                                                                                                                                                                                 USO
                                                                                                                                                                                         SISTEMA

                                                                                                                                                                                                  Figure 6b: Projection of landscapes and land uses in axes 1 and 2 of a PCA analysis of soil parameters
                                                                                                                                                                                                                   70                                   50.66                                                              35                                                                          27.44
                                                                                                                                                                                                                                                                                       54.65                                              23.96                            24.88
                                      Chemical Variables: pH, Al+3, Ca+2, Mg+2, K+1, Na+1, cation exchange capacity , P,                                                                                          60
                                                                                                                                                                                                                              49.07
                                                                                                                                                                                                                                                                                                                           30
                                     NH4+), organic matter, % C,% N and carbon storage (0 - 40 cm).
                                                                                                                                                                                           Stock C ( 0 to 30 cm)


                                                                                                                                                                                                                   50                                                                                                      25
                                                                                                                                                                                                                                                                                                            Infiltration
                                                                                                                                                                                                                                                                                                             (mm / h)
                                                                                                                                                                                                (t C / ha)


                                                                                                                                                                                                                   40                                                                                                      20

                                                                                                                                                                                                                   30                                                                                                      15
                                                                                                                                                                                                                               b                         ab                            a                                                   b                               b                           a
                                                                                                                                                                                                                   20                                                                                                      10

                                                                                                                                                                                                                   10                                                                                                       5

                                                                                                                                                                                                                    0                                                                                                       0
                                                                                                                                                                                                                        Conventional System     Sylvopastoral System        Agroforestry System                                     Conventional System       Sylvopastoral System             Agroforestry System


                                                                                                                                                                                                                        Figure 7. Carbon storage and infiltration of conventional, sylvopastoral and agroforestry systems
                                      Figure 5. Determination of nitrogen and carbon total by Dry combustion method 4(Mass
                                      spectrometer with stable isotope analyzer (Europa Integra) and Near Infrared Spectroscopy                                                                                                                                       PERSPECTIVES
                                      (NIR-FOSS SYSTEM 6500).
                                                                                                                                                                                           Reconstruction of eco-efficient landscapes in the Amazon deforested areas in the context of the climatic
                                                                                                                                                                                           changes – AMAZ 2030
STATISTICAL ANALYSIS:
The results were evaluated using a principal components analysis (PCA) using R software version 2.6.2 (2008)                                                                                                                                          ACKNOWLEDGEMENTS
under th lib
  d the library ADE 4
                ADE-4.                                                                                                                                                                    This work was supported by The French National Research Agency (ANR) (ADD and IFBANR programs)


                                                                                                                                                        REFERENCES
1.    Portela y Rademacher, 2001 . Ecological Modeling, 2001, Deforestación de la Región Amazónica de Brasil y sus efectos sobre los servicios que proporcionan los ecosistemas, (143): 115-146
2.    Millennium Ecosystem Assessment (MEA). 2005. Ecosystems and Human Well-Being: Synthesis. Island Press, Washington. 155pp
3.    Castillo F., J.A.; Amézquita C., E.; Müeller-Sämann, K. 2000. La turbidimetría una metodología promisoria para caracterizar la estabilidad estructural del los suelos = Turbidimetry a promising method to characterize the structural stability of soils. Suelos Ecuatoriales. 30(2):152-156

Poster65: Landscape management and the provision of soil ecosystem services in the Colombian Amazonian piedmont

  • 1.
    Landscape Management andthe Provision of Soil Ecosystem Services in the Colombian Amazonian piedmont Hurtado, M.P.1, Grimaldi, M.2, Mezú, H.1, Alvárez, A.1, Salamanca, J. 1, Ramírez, B.L.3, Rodriguez, G.3, Castañeda, E.R.3 and Lavelle, P.1,2 1International Center for Tropical Agriculture (CIAT) A.A. 6713 Cali, Colombia. 2 IRD/Universités de Paris VI et XII, UMR 137 BIOSOL, Bondy, France. 3Universidad de la Amazonía. Avenida Circunvalar, Florencia-Caquetá, Colombia. RATIONALE ECOSYSTEM SERVICES DEFORESTATION IN THE COLOMBIAN AMAZONIAN PIEDMONT Ecosystem Services are the ecological processes that regulate life on earth and The Colombian Amazonian piedmont, one of the ecosystems with greatest biodiversity on Earth, has been affected by contribute to human welfare at the local, regional and global scales1. colonization processes with serious environmental and cultural consequences. Forests have been destroyed and burned These services were popularized and their definitions formalized by the Millennium to establish annual crops, pastures and livestock. Ecosystem Assessment (MA), a four-year study involving more than 1,300 scientists worldwide 2. The main economic activity is livestock production systems of dual purpose because of the income generated from sales purpose, Ecosystem services are grouped into four broad categories: provisioning, such as of milk and meat. However, this production has been declining due to continued deterioration of pastures, with soil erosion the production of food and water; regulating, such as the control of climate and resulting from high precipitation rates, inadequate management of grasslands, soil compaction, high grazing pressures and disease; supporting, such as nutrient cycles and crop pollination; and cultural, such use of areas unsuitable for livestock, among others 3. as spiritual and recreational benefits. OBJECTIVE RESULTS Soils exhibited high degree of compaction in conventional system and sylvopastoral systems and lower  Measure soil ecosystem services and assess their degradation in three land use levels of carbon storage, total nitrogen, bases, phosphorus and infiltration than in agroforestry systems systems (Conventional extensive, Silvopastoral and Agroforestry) in Caquetá - Colombia (Figure 6a). This, as a result of poor soil porosity and low biological activity that reduce organic matter and cause degradation. In contrast, soil in the Agroforestry System (Figure 6b) presented better physical  Determine the effects of landscape heterogeneity on the production of ecosystem and chemical properties due to the shorter history of use and diversity in the types of vegetation. This is services reflected in the highest values of carbon storage and infiltration which were 54.65 t C / ha and 27.44 mm / h respectively (Figure 7). As opposed to 49.07 t C / ha and 50.66 t C / ha and 23.96 mm / h and 24.81 mm / h respectively in conventional and sylvopastoral systems. METHODOLOGY In order to avoid degradation of the Colombian Amazonian Piedmont, it is necessary to design eco- Location: Caquetá is located in the south of the country (2º58’ N, 76º15’ W). This department has an area of efficient landscape that protect ecosystem services and contribute to climate change mitigation. 8.9 million hectares, representing 7.8% of national territory with annual mean rainfall: 3744mm and annual mean temperature:28º C. Exchangeable acidity Sampling description: Three landscapes with differences (0 ‐ 10 cm) in land use history and colonization – Figure 1 use, 1. K CTCE In each landscape we sampled 9 farms with 5 sampling Bases (0 ‐ 10 cm) points in each (points distant 200m on average) and 4 pits Mg by point (dug down to 40 cm): Ca  Conventional – 80 years (native grasses, legumes and RT25 RT20 Dr10 Ve RT15 P weeds) - Figure 2 RT10 RV Infiltration and P(0 ‐ 10 cm)  S l Sylvopastoral - 60 years (di t l (diversity of f it f forages) - Fi ) Figure 3 RT5 RT RT0 RT2 pH H SC30  Agroforestry – 20 -30 years (rubber, copoazu, arazá) - Compaction(0 ‐ 30 cm) N30 N20 SC20 Figure 4 N10 SC10 Figure 1: Amazonia Ecosystems: Windows Colombia SCA30 Stock C and %N (0 ‐ 10, 10 ‐ 20 and 20 ‐ 30 cm) Variables-Correlation circle Figure 6a: Correlations circle of physics and chemical variables d=2 d=2 Figure 2: conventional System Figure 3: sylvopastoral System Figure 4: Agroforestry System Conventional  Shrubs 11 System CTR Agroforestry System 13 10 CAF 1 12 SOIL ANALYSIS: Sylvopastoral  CSP 4 6 9 System 3 Fallow, Agroforestry  Physics variables: Bulk density (0 to 40 cm), Water infiltration, Water retention and Soil Native Pasture, System, Family garden resistance (penetrometer and torvane) Grasses with woody, Palm and Pasture with trees P < 0.01 P < 0.01 USO SISTEMA Figure 6b: Projection of landscapes and land uses in axes 1 and 2 of a PCA analysis of soil parameters 70 50.66 35 27.44 54.65 23.96 24.88  Chemical Variables: pH, Al+3, Ca+2, Mg+2, K+1, Na+1, cation exchange capacity , P, 60 49.07 30 NH4+), organic matter, % C,% N and carbon storage (0 - 40 cm). Stock C ( 0 to 30 cm) 50 25 Infiltration (mm / h) (t C / ha) 40 20 30 15 b ab a b b a 20 10 10 5 0 0 Conventional System Sylvopastoral System Agroforestry System Conventional System Sylvopastoral System Agroforestry System Figure 7. Carbon storage and infiltration of conventional, sylvopastoral and agroforestry systems Figure 5. Determination of nitrogen and carbon total by Dry combustion method 4(Mass spectrometer with stable isotope analyzer (Europa Integra) and Near Infrared Spectroscopy PERSPECTIVES (NIR-FOSS SYSTEM 6500). Reconstruction of eco-efficient landscapes in the Amazon deforested areas in the context of the climatic changes – AMAZ 2030 STATISTICAL ANALYSIS: The results were evaluated using a principal components analysis (PCA) using R software version 2.6.2 (2008) ACKNOWLEDGEMENTS under th lib d the library ADE 4 ADE-4. This work was supported by The French National Research Agency (ANR) (ADD and IFBANR programs) REFERENCES 1. Portela y Rademacher, 2001 . Ecological Modeling, 2001, Deforestación de la Región Amazónica de Brasil y sus efectos sobre los servicios que proporcionan los ecosistemas, (143): 115-146 2. Millennium Ecosystem Assessment (MEA). 2005. Ecosystems and Human Well-Being: Synthesis. Island Press, Washington. 155pp 3. Castillo F., J.A.; Amézquita C., E.; Müeller-Sämann, K. 2000. La turbidimetría una metodología promisoria para caracterizar la estabilidad estructural del los suelos = Turbidimetry a promising method to characterize the structural stability of soils. Suelos Ecuatoriales. 30(2):152-156