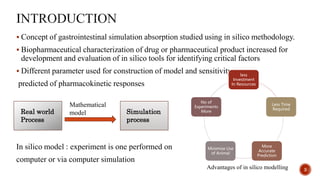
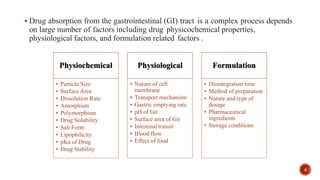
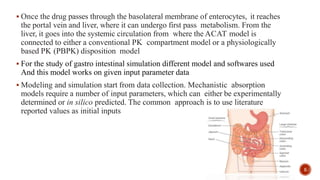
This document discusses the in silico methods used for simulating gastrointestinal absorption and biopharmaceutical characterization to enhance drug development. It details the complexity of drug absorption influenced by physicochemical properties, physiological conditions, and formulations, alongside various computational models and software available for these simulations. The findings stress the importance of accurate input data for meaningful modeling, as well as the impact of food on drug absorption rates.
Concept ofgastrointestinal simulation absorption studied using in silico methodology.
Biopharmaceutical characterization of drug or pharmaceutical product increased for
development and evaluation of in silico tools for identifying critical factors
Different parameter used for construction of model and sensitivity
predicted of pharmacokinetic responses
In silico model : experiment is one performed on
computer or via computer simulation
less
Investment
In Resources
Less Time
Required
More
Accurate
Prediction
Minimize Use
of Animal
No of
Experiments
More
Real world
Process
Simulation
process
Mathematical
model
Advantages of in silico modelling 3
4.
Drug absorptionfrom the gastrointestinal (GI) tract is a complex process depends
on large number of factors including drug physicochemical properties,
physiological factors, and formulation related factors .
Physiochemical
• Particle Size
• Surface Area
• Dissolution Rate
• Amorphism
• Polymorphism
• Drug Solubility
• Salt Form
• Lipophilicity
• pKa of Drug
• Drug Stability
Physiological
• Nature of cell
membrane
• Transport mechanism
• Gastric emptying rate
• pH of Git
• Surface area of Git
• Intestinal transit
• Blood flow
• Effect of food
Formulation
• Disintegration time
• Method of preparation
• Nature and type of
dosage
• Pharmaceutical
ingredients
• Storage conditions
4
5.
Once thedrug passes through the basolateral membrane of enterocytes, it reaches
the portal vein and liver, where it can undergo first pass metabolism. From the
liver, it goes into the systemic circulation from where the ACAT model is
connected to either a conventional PK compartment model or a physiologically
based PK (PBPK) disposition model
For the study of gastro intestinal simulation different model and softwares used
And this model works on given input parameter data
Modeling and simulation start from data collection. Mechanistic absorption
models require a number of input parameters, which can either be experimentally
determined or in silico predicted. The common approach is to use literature
reported values as initial inputs
5
6.
Dynamic modelsthat represent GI tract physiology in view of drug transit,
dissolution, and absorption.
Among these are the Advanced Dissolution, Absorption and Metabolism
(ADAM) model,
Compartmental Absorption Transit model
Grass model,
GI-Transit-Absorption (GITA) model,
Advanced CAT (ACAT) model
ADAM
ACAT
CAT
Grass
GITA
6
7.
Available commercial softwarepackages, for modelling such as
GastroPlus™ version 9.8.2,
SimCYP,
PK-Sim
®
,
IDEA™
Cloe
®
PK,
INTELLIPHARM
®
PKCR
www.Simulator.plus.com; www.Symcyp.com;
7
8.
Original CATmodel is semi-physiological absorption model is based on the
concept of the Biopharmaceutics Classification System (BCS). And prior
knowledge of GI physiology, and is modeled by a system of coupled linear and
nonlinear rate equations used to simulate the effect of physiological conditions on
drug absorption as it transits through successive GI compartments .
ACAT model of the human GI tract consists of NINE compartments linked in
series, each of them representing a different segment of the GI tract (stomach,
duodenum, two jejunum compartments, three ileum compartments, caecum, and
ascending colon).
These compartments are further subdivided into Unreleased Undissolved
Dissolved Absorbed
compartment
8
9.
Fig no. 1ACAT model interpretation of in vivo drug behavior 9
GastroPlus ACATmodelling requires a number of input parameters
• PK parameters
Clearance (CL),
Volume of distribution
Percentage of drug extracted in the oral
cavity, gut or liver, etc.),
• Formulation characteristics
Particle size distribution and
Density,
Drug release profiles for controlled-
release formulations
• Physicochemical properties
Solubility
Permeability
logP
pKa
Diffusion coefficient)
• Physiology parameters
Transit time
pH
Volume
Lenth
Radii of the
corresponding GI region
12
13.
The rateof change of dissolved drug concentration in each GI compartment depends on
ten processes:
I. transit of drug into the compartment
II. transit of drug out of the compartment
III. release of drug from the formulation into the compartment
IV. dissolution of drug particles
V. precipitation of drug
VI. luminal degradation of drug
VII. absorption of drug into the enterocytes
VIII. exsorption of drug from the enterocytes back into the lumen
IX. absorption of drug into portal vein via paracellular pathway
X. exsorption of drug from portal vein via paracellular pathway.
13
14.
GI simulation:general modeling and simulation strategy
Fig no. model construction and model exploration 14
15.
RATE CONSTANT
Transferrate constant (kt)
Associated with luminal transit, is determined from the mean transit time within each
compartment.
Dissolution rate constant (kd)
For each compartment at each time step is calculated based on the relevant
formulation parameters and the conditions (pH, drug concentration, % fluid, and bile
salt concentration) in the compartment at that time.
Absorption rate constant (ka)
Depends on drug effective permeability multiplied by an absorption scale factor
(ASF) for each compartment
According to this model, as the ionized fraction of a compound increases, the
effective permeability decreases
15
16.
Fig no. parameterand graph of comparison between model 1 and model 2
Case study
Nimesulide drug absorption
16
17.
According tothe obtained data, both Models 1 and 2 gave accurate predictions of
Nimesulide average plasma profile after oral administration
In both models , the percentage prediction errors for Cmax and area under the curve (AUC)
values were less than 10%
The largest deviation was observed for tmax
(PE of 21.25a/a and 15% in Model 1 and Model 2, respectively). Nevertheless, the predicted
values of 3.15 h (Model 1) and 3.4 h (Model 2)
Model 1 outcomes indicated involvement of influx transporters in nimesulide absorption,
while according to the Model 2 outcomes, the pH-surfactant induced increase in drug
solubility was a predominant factor leading to relatively rapid absorption in the proximal
intestine.
Conclusion :
17
18.
Interpretation ofthe obtained data indicated that the approach applied in
Model 2 might be considered as more realistic, signifying that the related
absorption model more likely reflects nimesulide in vivo absorption. It was
also stressed that, in order to obtain meaningful in silico modeling, the
necessary input data have to be carefully selected and/or experimentally
verified.
Biowaiver :
the situations in which in vivo BE studies can be substituted with the relevant
in vitro data
biowaivers for IR drug products may be requested solely in the cases of highly
soluble and highly permeable substances (BCS class I) when the drug product
is (very) rapidly dissolving and exhibits similar dissolution profile to the
reference product
BCS class II drugs (eligible for biowaiver if the dose-to-solubility ratio at pH
6.8 is 250 mL or less and high permeability is at 85% absorbed)
18
19.
Inter-subject variabilitymay influence oral drug absorption is determined using
virtual trails
Virtual trials were performed on virtual 12 subjects (equal to the number of
subjects used in the clinical study), and the results were presented as mean Cp
vs. time profile with 90% confidence intervals
The Virtual Trial mode can also be used to conduct virtual BE studies on 25
subjects
values of the selected variables are randomly sampled from predetermined
distributions (defined as means with coefficients of variation (CV%) in
absolute or log space).
CV % values are usually estimated on the basis of previous knowledge or
analysis of literature data
results of the simulations are expressed as means and coefficients of variation
for the fraction of drug absorbed, bioavailability, t max, C max, and AUC
values
19
20.
The presenceof food may affect drug absorption via a variety of mechanisms ; By impacting
I. GI tract physiology (e.g. food- induced changes in gastric emptying time, gastric pH,
intestinal fluid composition, hepatic blood flow).
II. Drug solubility and dissolution
III. Drug permeation
For example lipophilic drugs often show increased systemic exposure with food due to
Improved solubilization in higher bile salt and lipid concentrations
To simulate food effect in human describes the kinetics of drug transit, dissolution, and
absorption on the basis of drug specific features such as permeability, biorelevant solubility,
ionization constant(s), dose, metabolism and distribution data, etc.
20
21.
Dynamic modelsare able to predict both the fraction of dose absorbed and
the rate of drug absorption from gastrointestinal track .
Models can be utilized to explore mechanistic hypotheses and to help
define a formulation strategy
The effect of food on drug absorption or possible impact of intestinal
transporters and intestinal metabolism aslo explored
21
22.
Abuasal, B.S.,Bolger, M.B., Walker, D.K., and Kaddoumi, A. (2012) ‘In silico modeling for
the nonlinear absorption kinetics of UK-343,664: a P-gp and CYP3A4 substrate’, Mol.
Pharm., 9(3): 492–504.
Davis, T.M., Daly, F., Walsh, J.P., Ilett, K.F., Beilby, J.P., et al. (2000) ‘Pharmacokinetics and
pharmacodynamics of gliclazide in Caucasians and Australian Aborigines with type 2
diabetes’, Br. J. Clin. Pharmacol., 49(3): 223–30.
Norris, D.A., Leesman, G.D., Sinko, P.J., and Grass, G.M. (2000) ‘Development of
predictive pharmacokinetic simulation models for drug discovery’, J. Control Release, 65(1–
2): 55–62.
Welling, P.G. (1996) ‘Effects of food on drug absorption’, Annu. Rev. Nutr., 16:
383–415.
22