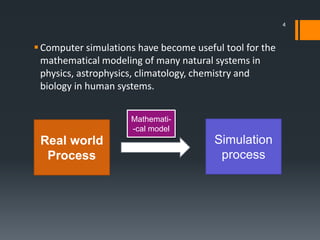
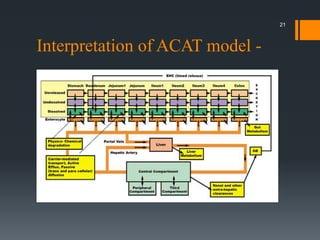
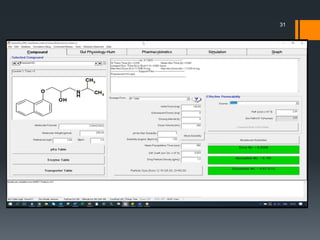
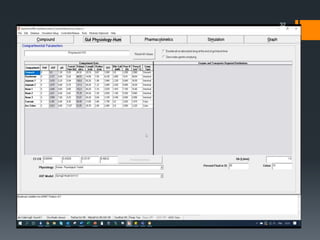
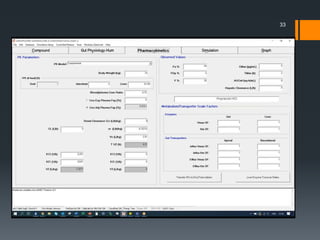
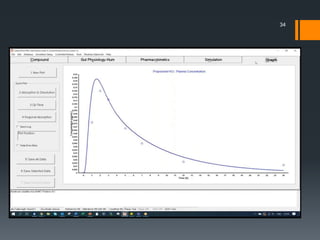
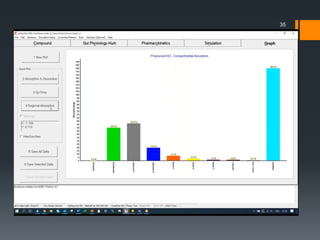
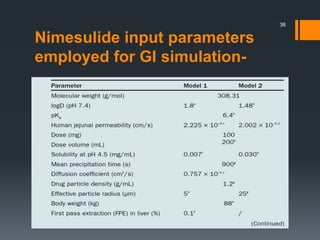
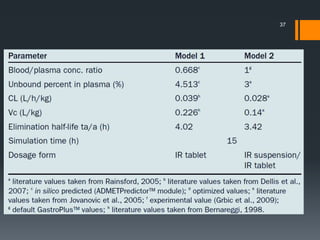
Gastric absorption
simulation
Presented by – Sagar S. Bhor 20MPH113
Guided by – Dr. Jigar Shah
1
Index
Introduction
Simulation
Advantages of simulation
Absorption process
Simulation models
Software's used for simulation
Requirements for simulation
User interface of gastroplus
Applications
References
2
Introduction
Simulation –
Simulation is the imitation of the operation of a
real-world process or system over time.
A Simulation of a system require model to imitate
the process in the computer based systems.
Computer simulation reproduce the behavior of a
system using a mathematical model
3
Computer simulations have become useful tool for the
mathematical modeling of many natural systems in
physics, astrophysics, climatology, chemistry and
biology in human systems.
Real world
Process
Simulation
process
Mathemati-
-cal model
4
Area’s of simulation -
Gaming Health services
Architecture military
5
HOW IT WORKS ?
6
Normal absorption process -
 Drug absorption is defined as the process of movement of
unchanged drug from site of administration to systemic
circulation.
 After dosing a drug product, the formulation disintegrates to
release drug particles. The drug particles (active
pharmaceutical ingredient, API) dissolve into the GI fluid.
 The formulation, drug particles and dissolved drug transit
through the GI tract. The dissolved drug permeates the
intestinal wall and reaches the blood flow. Basically, these
processes occur for all oral drugs.
7
8
Rate limiting process in absorption-
 Permeability limited absorption: After oral administration,
the drug dissolves immediately. However, permeation is slow.
The dissolved amount accumulates in the GI fluid, but does
not reach saturated solubility.
 Dissolution limited absorption: Dissolution is much slower
than permeation. The dissolved drug instantly permeates the
intestinal membrane. The dissolved amount in the GI fluid
remains below saturation.
 Solubility limited absorption: If dissolution is faster than
permeability, the drug may accumulate in the intestinal fluid
9
Conti.
reaching saturated solubility.
 The rate limiting steps mainly determines the oral absorption
& has direct impact.
10
Aim of simulation in absorption -
 Absorption is an important process in order to achieve the
therapeutic effect of drug that has been administered.
 During drug discovery, potential drug candidates are often
filtered based on their absorption – distribution –metabolism-
excretion (ADME) properties determined using in vitro
assays and in vivo animal models.
 biopharmaceutical evaluation can be used to guide
formulation strategy or to predict the effect of food on drug
absorption.
 development and evaluation of in-silico tools capable of
identifying critical factors influencing drug in vivo
performance.
11
 There is growing interest in development and evaluation of
in-silico tools capable of identifying the critical factors
influencing drug in-vivo performance based on input data.
 Drug absorption from the gastrointestinal (GI) tract is
a complex process and depends on large number of factors
12
Advantages of simulation-
 In-silico simulation tools require less investment in resources
and time in comparison to in vivo studies.
 They offer a potential to screen virtual compounds.As a
consequence, the number of experiments, costs and time
required for compound selection and development, is
considerably reduced.
 The DDI Module in GastroPlus allows you to predict drug-
drug interactions (DDIs) among drugs and metabolites.
 Prediction of pharmacokinetic and pharmacodynamic
properties .
13
Model & its characteristics –
The model is similar to a real system, which helps the analyst
predict the effect of changes to the system.
It helps analyze the performance of an existing or a proposed
system
Characteristics-
 Easy to understand
 Target direction
 Nearly real system
 Produce results fast
 Easy to control and operate
 Updateable
 Effective Report .
14
15
 Some dynamic models represents the GI physiology in-view of drug
transit, dissolution ,absorption .
 Some are as follows –
1. Advanced dissolution ,absorption& metabolism (ADAM) model
2. Grass model
3. GI-transit-absorption (GITA) model
4. Compartmental absorption and transit (CAT) model
5. Advanced CAT (ACAT) model
Some of the software’s integrated commercially are as follows -
Gastroplus™
SimCYP
IDEA™
Cloe® PK
Cloe® HIA
INTELLIPHARM® PKCR
16
Gastroplus™
 The GastroPlus™ SOFTWARE based on the ACAT model,
an improved version of the original CAT model described by
Yu and Amidon.
 This semi- physiological absorption model is based on the
concept of the Bio-pharmaceutics Classification System BCS
and prior knowledge of GI physiology.
 It is modeled by a system of coupled linear and nonlinear
rate equations used to simulate the effect of physiological
conditions on drug absorption as it transits through
successive GI compartments.
17
 The ACAT model of the human GI tract consists of 9
compartments linked in series, each of them representing a
different segment of the GI tract
18
Stomach
Duodenum
2 jejunum
compartments
3 ileum
compartments
Caecum
Ascending colon
 These compartments are further subdivided to comprise the
drug that is unreleased, un-dissolved, dissolved, and
absorbed (entered into the enterocytes).
 Movement of the drug between each sub- compartment is
described by a series of differential equations.
 In general, the rate of change of dissolved drug concentration
in each GI compartment depends on ten processes:-
Conti.,
19
Movement of drug in between
compartments -
20
I. Transit of drug into
the compartment
II. transit of drug out
of the compartment
III. release of drug
from the formulation
into the compartment
IV. dissolution of
drug particles
V. precipitation of
drug
VI. luminal
degradation of drug
VII. absorption of
drug into the
enterocytes
VIII. exsorption of
drug from the
enterocytes back into
the lumen
IX. absorption of
drug into portal vein
via paracellular
pathway
x. exsorption of drug
from portal vein via
paracellular pathway
Interpretation of ACAT model -
21
 The time scale associated with each of these processes is
set by an adequate rate constant. Transfer rate constant (k t),
associated with lumenal transit, is determined from the mean
transit time within each compartment.
 The dissolution rate constant (kd) for each compartment at
each time step is calculated based on the relevant formulation
parameters and the conditions like pH, drug concentration, %
fluid, and bile salt concentration in the compartment at that
time
22
Cont.
 Absorption rate constant (ka) depends on drug effective
permeability multiplied by an absorption scale factor (ASF)
for each compartment.
 Default ASF values are estimated on the basis of the logD
model, which considers the influence of logD of the drug on
the effective permeability
23
 According to this model, as the ionized fraction of a
compound increases, the effective permeability decreases
and vice-versa
 Lumenal degradation rate constant (kdeg) is interpolated from
the degradation rate or half-life vs pH, and the pH in the
compartment .
 The total amount of absorbed drug is summed over the
integrated amounts being absorbed/exsorbed from
each absorption/transit compartment.
 Once the drug passes through the basolateral membrane of
enterocytes, it reaches the portal vein and liver, where it can
undergo first pass metabolism. From the liver, it goes into the
systemic circulation(blood) from where the ACAT model is
connected to either a conventional PK compartment
model or a physiologically based PK (PBPK) disposition
model
24
 PBPK is an additional feature included in recent versions of
Gastroplus™ .This model describes drug distribution in major
tissues, which can be treated as either perfusion limited or
permeability limited .
 Each tissue is represented by a single compartment,
whereas different compartments are linked together by blood
circulation.
25
Inputs
 GastroPlus™ ACAT modeling requires a number of input
parameters, which should adequately reflect drug
biopharmaceutical properties. Default physiology parameters
under fasted and fed states e.g. transit time, pH, volume,
length, radii of the corresponding GI region are population
mean values obtained from published mean values obtained
from published data.
The other input parameters include -
 physicochemical parameters
 Pharmacokinetics parameters
 Formulation parameters
26
Inputs required -
physicochemical properties
• solubility,
• permeability,
• logP
• pKa,
• diffusion coefficient
PK parameters
• (clearance (CL),
• volume of distribution
• percentage of drug extracted in
the oral cavity
27
Formulation characteristics inputs -
particle size distribution
density
drug release profiles for controlled-release formulations
Dosage form
28
 Depending on the known solubility at any single pH and drug
pKa value(s), GastroPlus™ calculates regional solubility
based on the fraction of drug ionized at each compartmental
pH according to the Henderson-Hasselbalch equation.
29
User interface of gastroplus™
30
31
32
33
34
35
Nimesulide input parameters
employed for GI simulation-
36
37
GastroPlus™ Model 1 and Model 2 predicted and in vivo
observed mean NIM plasma profiles following administration of
a single 100 mg nimesulide IR tablet (a); predicted dissolution
and absorption profiles (b)
38
Model 1:
 Model 1 was constructed, assuming that nimesulide might
be a substrate for influx transporters in the intestine.
 Therefore, the ASFs were adjusted to best match the
resultant profile to the in vivo observed data (given in
previous table).
 Experimentally determined intrinsic solubility was used as
the input value, and human jejunal permeability was in
silico predicted.
 Drug particle radius was assumed to be 5 microns. All
other parameters were fixed at default values that
represent human fasted physiology.
39
Model 2:
 The approach used to construct and validate Model 2 was
based on the comparative study of two dosage forms of
nimesulide (immediate- release (IR) suspension and IR
tablet).
Results-
 The simulation results of nimesulide plasma concentration-
time profiles, absorption and dissolution profiles, and the
predicted and in vivo observed PK parameters obtained
using the Model 1 and 2 input data sets using gastroplus™
40
Comparison of PK parameters between Model 1 and
Model 2 predicted and in vivo observed data
41
 According to the obtained data, both Models 1 and 2 gave
accurate predictions of nimesulide average plasma profile
after oral administration.
 In both cases, the percentage prediction errors for C max
and area under the curve (AUC) values were less than 10%,
indicating that the models have predicted these parameters
well.
 The largest deviation was observed for t max (PE of 21.25a/a
and 15% in Model 1 and Model 2, respectively).
Nevertheless, the predicted values of 3.15 h (Model 1) and
3.4 h (Model 2) were considered as reasonable estimates,
since the reported t max values after oral administration of
nimesulide IR tablets varied between 1 and 4 h.
42
Applications -
 Simulation predict both the fraction of dose absorbed and the
rate of drug absorption.
 They offer a potential to screen virtual compounds. As a
consequence, the number of experiments, and concomitant
costs and time required for compound selection and
development, is considerably reduced.
 Drug- drug interaction prediction can be done in newer
versions of gastroplus™.
 Simulations can be used to evaluate plasma concentration-
time profiles by using the input parameters .
43
Simcyp
 The Advanced Dissolution Absorption and Metabolism
(ADAM) model is a multi-compartmental GI transit model fully
integrated into the Simcyp human population-based
Simulator as well as the rat, mouse and dog simulators.
 The Simulator provides both pharmacokinetic and
pharmacodynamics models and a separate pediatric module.
 As per ADAM model treats the GI tract classified into
 one stomach,
seven small intestine compartment
 one colon compartment
44
 within each compartment , drug can exist in several states
simultaneously viz. unreleased, undissolved (solid particles),
dissolved or degraded.
 Drug can be dosed in a supersaturated state or super-
saturation may be attained as a consequence of solubility
change when moving from one region of the GI tract to
another.
 When running a simulation the appropriate population should
be selected and then the trial size (numbers and groups)
together with age-range, gender proportions, fasted/fed
status, fluid taken with dose and dosing regimen including
staggering for up to four co-dosed drugs.
45
Effect of food on plasma conc. Of nifedipine
in SR & IR formulation
46
References-
Sandra Grbic, Jelena Parojcic, and Zorica Djuric,
Computer- aided biopharmaceutical
characterization: gastrointestinal absorption
simulation, University of Belgrade, Published by
Woodhead Publishing Limited, 2013.
Michael B. Bolger, Gastrointestinal Simulation
Based on the Advanced Compartmental
Absorption and Transit (ACAT), Founding Scientist
Simulations Plus, Inc., 2006.
Gastrointestinal Simulation Based on the
Advanced Compartmental Absorption and Transit
(ACAT), Michael B. Bolger ,Simulations Plus, Inc.
47
 Simulation plus software brochure ,simulation plus
 Computer-aided biopharmaceutical characterization ,
gastrointestinal absorption simulation , Dr. Abhishek Pandey
School of Studies in Pharmaceutical Sciences, Jiwaji
University, Gwalior
48
Thank you
49
Any questions ?
50

Gastric absorption simulation

  • 1.
    Gastric absorption simulation Presented by– Sagar S. Bhor 20MPH113 Guided by – Dr. Jigar Shah 1
  • 2.
    Index Introduction Simulation Advantages of simulation Absorptionprocess Simulation models Software's used for simulation Requirements for simulation User interface of gastroplus Applications References 2
  • 3.
    Introduction Simulation – Simulation isthe imitation of the operation of a real-world process or system over time. A Simulation of a system require model to imitate the process in the computer based systems. Computer simulation reproduce the behavior of a system using a mathematical model 3
  • 4.
    Computer simulations havebecome useful tool for the mathematical modeling of many natural systems in physics, astrophysics, climatology, chemistry and biology in human systems. Real world Process Simulation process Mathemati- -cal model 4
  • 5.
    Area’s of simulation- Gaming Health services Architecture military 5
  • 6.
  • 7.
    Normal absorption process-  Drug absorption is defined as the process of movement of unchanged drug from site of administration to systemic circulation.  After dosing a drug product, the formulation disintegrates to release drug particles. The drug particles (active pharmaceutical ingredient, API) dissolve into the GI fluid.  The formulation, drug particles and dissolved drug transit through the GI tract. The dissolved drug permeates the intestinal wall and reaches the blood flow. Basically, these processes occur for all oral drugs. 7
  • 8.
  • 9.
    Rate limiting processin absorption-  Permeability limited absorption: After oral administration, the drug dissolves immediately. However, permeation is slow. The dissolved amount accumulates in the GI fluid, but does not reach saturated solubility.  Dissolution limited absorption: Dissolution is much slower than permeation. The dissolved drug instantly permeates the intestinal membrane. The dissolved amount in the GI fluid remains below saturation.  Solubility limited absorption: If dissolution is faster than permeability, the drug may accumulate in the intestinal fluid 9
  • 10.
    Conti. reaching saturated solubility. The rate limiting steps mainly determines the oral absorption & has direct impact. 10
  • 11.
    Aim of simulationin absorption -  Absorption is an important process in order to achieve the therapeutic effect of drug that has been administered.  During drug discovery, potential drug candidates are often filtered based on their absorption – distribution –metabolism- excretion (ADME) properties determined using in vitro assays and in vivo animal models.  biopharmaceutical evaluation can be used to guide formulation strategy or to predict the effect of food on drug absorption.  development and evaluation of in-silico tools capable of identifying critical factors influencing drug in vivo performance. 11
  • 12.
     There isgrowing interest in development and evaluation of in-silico tools capable of identifying the critical factors influencing drug in-vivo performance based on input data.  Drug absorption from the gastrointestinal (GI) tract is a complex process and depends on large number of factors 12
  • 13.
    Advantages of simulation- In-silico simulation tools require less investment in resources and time in comparison to in vivo studies.  They offer a potential to screen virtual compounds.As a consequence, the number of experiments, costs and time required for compound selection and development, is considerably reduced.  The DDI Module in GastroPlus allows you to predict drug- drug interactions (DDIs) among drugs and metabolites.  Prediction of pharmacokinetic and pharmacodynamic properties . 13
  • 14.
    Model & itscharacteristics – The model is similar to a real system, which helps the analyst predict the effect of changes to the system. It helps analyze the performance of an existing or a proposed system Characteristics-  Easy to understand  Target direction  Nearly real system  Produce results fast  Easy to control and operate  Updateable  Effective Report . 14
  • 15.
  • 16.
     Some dynamicmodels represents the GI physiology in-view of drug transit, dissolution ,absorption .  Some are as follows – 1. Advanced dissolution ,absorption& metabolism (ADAM) model 2. Grass model 3. GI-transit-absorption (GITA) model 4. Compartmental absorption and transit (CAT) model 5. Advanced CAT (ACAT) model Some of the software’s integrated commercially are as follows - Gastroplus™ SimCYP IDEA™ Cloe® PK Cloe® HIA INTELLIPHARM® PKCR 16
  • 17.
    Gastroplus™  The GastroPlus™SOFTWARE based on the ACAT model, an improved version of the original CAT model described by Yu and Amidon.  This semi- physiological absorption model is based on the concept of the Bio-pharmaceutics Classification System BCS and prior knowledge of GI physiology.  It is modeled by a system of coupled linear and nonlinear rate equations used to simulate the effect of physiological conditions on drug absorption as it transits through successive GI compartments. 17
  • 18.
     The ACATmodel of the human GI tract consists of 9 compartments linked in series, each of them representing a different segment of the GI tract 18 Stomach Duodenum 2 jejunum compartments 3 ileum compartments Caecum Ascending colon
  • 19.
     These compartmentsare further subdivided to comprise the drug that is unreleased, un-dissolved, dissolved, and absorbed (entered into the enterocytes).  Movement of the drug between each sub- compartment is described by a series of differential equations.  In general, the rate of change of dissolved drug concentration in each GI compartment depends on ten processes:- Conti., 19
  • 20.
    Movement of drugin between compartments - 20 I. Transit of drug into the compartment II. transit of drug out of the compartment III. release of drug from the formulation into the compartment IV. dissolution of drug particles V. precipitation of drug VI. luminal degradation of drug VII. absorption of drug into the enterocytes VIII. exsorption of drug from the enterocytes back into the lumen IX. absorption of drug into portal vein via paracellular pathway x. exsorption of drug from portal vein via paracellular pathway
  • 21.
  • 22.
     The timescale associated with each of these processes is set by an adequate rate constant. Transfer rate constant (k t), associated with lumenal transit, is determined from the mean transit time within each compartment.  The dissolution rate constant (kd) for each compartment at each time step is calculated based on the relevant formulation parameters and the conditions like pH, drug concentration, % fluid, and bile salt concentration in the compartment at that time 22
  • 23.
    Cont.  Absorption rateconstant (ka) depends on drug effective permeability multiplied by an absorption scale factor (ASF) for each compartment.  Default ASF values are estimated on the basis of the logD model, which considers the influence of logD of the drug on the effective permeability 23
  • 24.
     According tothis model, as the ionized fraction of a compound increases, the effective permeability decreases and vice-versa  Lumenal degradation rate constant (kdeg) is interpolated from the degradation rate or half-life vs pH, and the pH in the compartment .  The total amount of absorbed drug is summed over the integrated amounts being absorbed/exsorbed from each absorption/transit compartment.  Once the drug passes through the basolateral membrane of enterocytes, it reaches the portal vein and liver, where it can undergo first pass metabolism. From the liver, it goes into the systemic circulation(blood) from where the ACAT model is connected to either a conventional PK compartment model or a physiologically based PK (PBPK) disposition model 24
  • 25.
     PBPK isan additional feature included in recent versions of Gastroplus™ .This model describes drug distribution in major tissues, which can be treated as either perfusion limited or permeability limited .  Each tissue is represented by a single compartment, whereas different compartments are linked together by blood circulation. 25
  • 26.
    Inputs  GastroPlus™ ACATmodeling requires a number of input parameters, which should adequately reflect drug biopharmaceutical properties. Default physiology parameters under fasted and fed states e.g. transit time, pH, volume, length, radii of the corresponding GI region are population mean values obtained from published mean values obtained from published data. The other input parameters include -  physicochemical parameters  Pharmacokinetics parameters  Formulation parameters 26
  • 27.
    Inputs required - physicochemicalproperties • solubility, • permeability, • logP • pKa, • diffusion coefficient PK parameters • (clearance (CL), • volume of distribution • percentage of drug extracted in the oral cavity 27
  • 28.
    Formulation characteristics inputs- particle size distribution density drug release profiles for controlled-release formulations Dosage form 28
  • 29.
     Depending onthe known solubility at any single pH and drug pKa value(s), GastroPlus™ calculates regional solubility based on the fraction of drug ionized at each compartmental pH according to the Henderson-Hasselbalch equation. 29
  • 30.
    User interface ofgastroplus™ 30
  • 31.
  • 32.
  • 33.
  • 34.
  • 35.
  • 36.
  • 37.
  • 38.
    GastroPlus™ Model 1and Model 2 predicted and in vivo observed mean NIM plasma profiles following administration of a single 100 mg nimesulide IR tablet (a); predicted dissolution and absorption profiles (b) 38
  • 39.
    Model 1:  Model1 was constructed, assuming that nimesulide might be a substrate for influx transporters in the intestine.  Therefore, the ASFs were adjusted to best match the resultant profile to the in vivo observed data (given in previous table).  Experimentally determined intrinsic solubility was used as the input value, and human jejunal permeability was in silico predicted.  Drug particle radius was assumed to be 5 microns. All other parameters were fixed at default values that represent human fasted physiology. 39
  • 40.
    Model 2:  Theapproach used to construct and validate Model 2 was based on the comparative study of two dosage forms of nimesulide (immediate- release (IR) suspension and IR tablet). Results-  The simulation results of nimesulide plasma concentration- time profiles, absorption and dissolution profiles, and the predicted and in vivo observed PK parameters obtained using the Model 1 and 2 input data sets using gastroplus™ 40
  • 41.
    Comparison of PKparameters between Model 1 and Model 2 predicted and in vivo observed data 41
  • 42.
     According tothe obtained data, both Models 1 and 2 gave accurate predictions of nimesulide average plasma profile after oral administration.  In both cases, the percentage prediction errors for C max and area under the curve (AUC) values were less than 10%, indicating that the models have predicted these parameters well.  The largest deviation was observed for t max (PE of 21.25a/a and 15% in Model 1 and Model 2, respectively). Nevertheless, the predicted values of 3.15 h (Model 1) and 3.4 h (Model 2) were considered as reasonable estimates, since the reported t max values after oral administration of nimesulide IR tablets varied between 1 and 4 h. 42
  • 43.
    Applications -  Simulationpredict both the fraction of dose absorbed and the rate of drug absorption.  They offer a potential to screen virtual compounds. As a consequence, the number of experiments, and concomitant costs and time required for compound selection and development, is considerably reduced.  Drug- drug interaction prediction can be done in newer versions of gastroplus™.  Simulations can be used to evaluate plasma concentration- time profiles by using the input parameters . 43
  • 44.
    Simcyp  The AdvancedDissolution Absorption and Metabolism (ADAM) model is a multi-compartmental GI transit model fully integrated into the Simcyp human population-based Simulator as well as the rat, mouse and dog simulators.  The Simulator provides both pharmacokinetic and pharmacodynamics models and a separate pediatric module.  As per ADAM model treats the GI tract classified into  one stomach, seven small intestine compartment  one colon compartment 44
  • 45.
     within eachcompartment , drug can exist in several states simultaneously viz. unreleased, undissolved (solid particles), dissolved or degraded.  Drug can be dosed in a supersaturated state or super- saturation may be attained as a consequence of solubility change when moving from one region of the GI tract to another.  When running a simulation the appropriate population should be selected and then the trial size (numbers and groups) together with age-range, gender proportions, fasted/fed status, fluid taken with dose and dosing regimen including staggering for up to four co-dosed drugs. 45
  • 46.
    Effect of foodon plasma conc. Of nifedipine in SR & IR formulation 46
  • 47.
    References- Sandra Grbic, JelenaParojcic, and Zorica Djuric, Computer- aided biopharmaceutical characterization: gastrointestinal absorption simulation, University of Belgrade, Published by Woodhead Publishing Limited, 2013. Michael B. Bolger, Gastrointestinal Simulation Based on the Advanced Compartmental Absorption and Transit (ACAT), Founding Scientist Simulations Plus, Inc., 2006. Gastrointestinal Simulation Based on the Advanced Compartmental Absorption and Transit (ACAT), Michael B. Bolger ,Simulations Plus, Inc. 47
  • 48.
     Simulation plussoftware brochure ,simulation plus  Computer-aided biopharmaceutical characterization , gastrointestinal absorption simulation , Dr. Abhishek Pandey School of Studies in Pharmaceutical Sciences, Jiwaji University, Gwalior 48
  • 49.
  • 50.