Abstract
From 2018 through 2021, Wildfires have emerged as one of the most destructive and deadly forces impacting energy resiliency around the globe. Dramatic new policy measures have been implemented in different jurisdictions with decidedly mixed results. Even less clear is whether these policy measures will truly ensure safe, reliable, and affordable energy------along with a modicum of reliability. This presentation will provide a detailed overview of the costs of wildfires within a resiliency framework, focusing upon California, Australia and other highly impacted geographic areas. Existing policy responses such as the Public Safety Power Shutoff (PSPS) program in California will be evaluated for efficacy. Evolving policies will also be reviewed----especially those that hold material potential to mitigate risk. Finally, for those areas with high wildfire risk, electricity market responses in the commercial and industrial (C&I) sector will be explored in detail. To what degree has wildfire risk expedited the shift from centralized utility electricity generation to distributed and/or third-party C&I electricity generation? Has this shift focused upon specific technologies (i.e. storage vs renewables vs fossil fuel generators). The presentation will assess
whether these market shifts are mitigating wildfire risks or simply creating greater complexity and variability.
Rivier University Institute for Senior Education (RISE) Course
A series of 6 PowerPoint Talks
How did we maintain meaning, purpose, and even happiness during the COVID19 lockdown?
It lowered the CO2 emissions that are warming our planet, but increased income inequality.
Will new technologies lower our carbon dioxide emissions to stop global warming by 2050?
Renewable energy, including wind and solar power, has experienced explosive growth in recent years with no sign of slowing down. Read our special report, How Renewables are Winning, to learn more about this rapid period of renewable energy advancement.
GREEN ENERGY’S ECONOMIC PROGRESS
Reducing carbon missions by 51% in 2030
-Environmental, social, and governance funds have more than tripled to reach $2 Trillion.
-Three new “Mean Green” board members are forcing Exxon to clean up its act.
-GM is betting big on batteries for electric vehicles with a new $2.3 billion plant in Ohio.
-Advances in electric vehicles and next-generation nuclear reactors are helping the US achieve its goal of reducing carbon emissions to net zero by 2050.
Passivhaus Conference Keynote Presentation – Nov 2007stanner
Buildings account for about 33% of all CO2 emissions. Add the fact that what we build today will likely be around for another 50 to 100 years and you understand why "incrementalism is death" in our built environment. The technology, materials and talent exists today. All we need is the courage to take the necessary leaps in constructing comfortable, beautiful, achievable, sustainable buildings now.
"" is an initiative undertaken by the members of the French Nuclear Energy Society (SFEN), the American Nuclear Society (ANS) and the European Nuclear Society (ENS). It brings together nuclear scientists from all parts of the globe, through the representation of 60 regional and national nuclear associations.
A Year of Developments: Focusing on Nuclear Energy for the FutureAntony_Cascella
In the past year, the United States of America has seen a range of developments in the energy sector. Most notably, advances in nuclear power were made across the nation. California, Nebraska, Illinois, Tennessee, and New York had their fair share of contributions towards policies concerning nuclear energy.
Up-to-date global electricity dataset, with analysis of the global electricity transition. Full the full report, dahboard and dataset, see https://ember-climate.org/project/global-power-2020/
1.“Limits To Growth”published in 1972. *Has sold 10 million copies
*In 2012, predictions were shown to be accurate & updated.
2. 2011 UN IPCC Report predicts hurricanes & weather extremes will increase from global warming.
3. Can we deploy new technologies in time?
4. Re-envisioning Beauty to Save our Planet.
L. Hunter Lovins at the Iowa Environmental Council's annual conferenceiaenvironment
L. Hunter Lovins delivered the keynote address at the Iowa Environmental Council's annual conference, "Finding Iowa's Way: Economic Solutions for a Healthier Environment," held October 4, 2012, in Des Moines.
Manhattan Institute Reality Check on Fracking, Renewables, and CO2 ReductionMarcellus Drilling News
For all of the attention and federal funds given to renewable energy, it remains a blip on America’s energy radar: solar power represents less than 1 percent of U.S. electricity generation. Wind and solar power together generated less electricity in the first half of 2015 than in the first half of 2014, and investment in the industry has been flat for almost five years, domestically and globally.
Making Earth Cool Again: Challenges & SolutionsPaul H. Carr
COOLING CHALLENGES: Fall 2018 Reports
(1) ""Global Climate Change Impacts in US": 13 Government Agency Report
(Nov 2018). Up to 10% decrease in US economy by 2100.
(2) "Preventing 2.7 F (1.5 C) degrees of warming." IPCC report, authored by 90 scientists from 40 countries (Oct 2018). Greenhouse pollution must be reduced by 45 percent from 2010 levels by 2030, and 100 percent by 2050.
COOL SOLUTIONS
(1) "Can Nuclear Energy Thrive in a Carbon-Constrained World?": (MIT Report, Sept 2018)
A reactor build-up (at a historically feasible rate) could completely decarbonize the World’s power sector within 30 years.
The energy storage costs needed for wind and solar alone would make them up to four times more expensive than reactors.
(2) A vegetarian/vegan diet is a way everyone can stop global warming.
(3) Capitalistic solution: carbon fee plus dividend.
Climate Change Extremes: Increasing Wildfires & HurricanesPaul H. Carr
1. CLIMATE CHANGE EXTREMES: INCREASING FOREST FIRES AND HURRICANES
2. CLIMATE CHANGE SCIENCE:
CO2 from fossil fuel burning is warming our Earth via the Greenhouse effect
3. WHAT WE CAN DO IMMEDIATELY:
A more vegetarian diet.
THIS IS ONLY SAMPLE 1) WHAT is the major environmental .docxAASTHA76
** THIS IS ONLY SAMPLE
1) WHAT is the major environmental or resource ISSUE, HOW is it caused, and WHERE is it occurring?
Issue: Increased temperatures in the city. The Urban Heat Island manifests as warmer nighttime air temperatures in the city. Urban materials like concrete and asphalt store heat energy during the day and release it slowly at night, increasing minimum temperatures (the lowest temperature of the night). The Phoenix Urban Heat Island has higher air temperatures in the city core (downtown Phoenix) as compared to air temperatures in the rural locations (like Wickenburg and Queen Creek). The temperature differences between the city core and rural locations can range from 10-18°F, especially during the warm summer season.
2) WHAT is the main RESOURCE involved and HOW is it being impacted or
developed? Describe a consequence
Resource: Energy. In warm climates like Phoenix, not being able to cool effectively at night has negative consequences for human health and comfort. This drives an increase in energy consumption as electric air conditioners are the main tool used to cool buildings and structures. A feedback loop is then created that helps perpetuates the heat island. Air conditioners expel hot air as they operate, which in turn contributes to warmer air temperatures, forcing even more energy usage.
3) WHO are the primary stakeholders or key players (people and/or organizations) driving this issue (or attempting to mitigate the issue) and WHAT are they doing?
Key Player: Phoenix Mayor and Council. The City of Phoenix was named as a finalist in the 2018 Bloomberg Mayors Challenge for their HeatReady proposal. The HeatReady program will help Phoenix prepare their responses to dangerous levels of heat. Additionally, the Phoenix Council is investigating urban forestry as a mitigation technique. Trees assist heat mitigation due to shade and transpiration (evaporating water into the atmosphere, which is a cooling process).
4) HOW is society (or individuals) being impacted by this issue (positively or negatively)? Provide one example.
Society impact: Poor and homeless suffer. The people most at risk from the Urban Heat Island are those that can’t cool effectively at night. In the Phoenix area, the communities most at risk are the poor and homeless. In warm climates like Phoenix, not being able to cool effectively at night has negative consequences for human health. On average, over 100 people die from heat-related illnesses every year.
5) HOW does this issue affect extenuating environmental situations or impact other natural resources? Provide one example.
Other resource: Water. As the city warms, temperatures in urban lakes increase. Warmer lake temperatures deplete dissolved oxygen which affects aquatic organisms in the lake. Warmer air temperatures also drive additional household water usage for pools, lawns, evaporative coolers, and landscaping. Adoption of urban forestry will increase municipal water usage, as well.
Climate, Carbon, and "Ground of All Being"Paul H. Carr
Pope Francis’ encyclical “On Care for our Common Home” is motivating the reduction of fossil fuel burning that has been increasing carbon dioxide levels. These are warming our planet via the Greenhouse Effect. Paul Tillich’s s expression of God as the “Ground of all Being” can motivate increased planting of trees. Plant life emerges from the fertile ground, the living, breathing skin of our earth. Plants use photosynthesis to remove carbon from the atmosphere. To make our earth cool again, we must lower our carbon emissions with next generation nuclear reactors and vegetarian/vegan diets.
Marin County Climate Actions, California Climate Change legislation, California Green Economy, President Obama Clean Power Act, Paris 2015 COP 21: convention of 190 countries to make a new international agreement on climate, aiming to keep global warming below 2°C
Technology and Policies are Available to Save Our Environment.Paul H. Carr
OUTLINE: POLICY INFLUENCERS
1. Wall Street Journal - Is climate science settled?
2. Peer-reviewed Climate Science Articles- 99% settled.
3. Forbes – Is carbon-free energy available?
4. Nashua Telegraph – What about China’s coal burning?
5. Risky Business Report - Economics of Global Warming. by Bloomberg, Paulsen, & Steyer
6. Pope Francis’ Moral Responsibility to bequeath a habitable planet to future generations
Examines the claims that climate change is very serious, and checks the available records to determine whether the main blame is increased carbon dioxide or heat emissions. Climate records show no trends to extremes, and loss of Arctic ice may be counteracted by increased growth of northern forests.
Environmentalists never discuss carbon absorption by plant life including forests - https://www.bbc.com/news/science-environment-29601644
Climate always changes - https://www.youtube.com/watch?v=T9eQNZu9Sog or
Canada may already be carbon neutral - http://business.financialpost.com/opinion/canada-may-already-be-carbon-neutral-so-why-are-we-keeping-it-a-secret
Not enough is being said about either eco-terrorism or poor urban planning
Environmentalists never discuss carbon absorption by plant life including forests - https://www.bbc.com/news/science-environment-29601644
Climate always changes - https://www.youtube.com/watch?v=T9eQNZu9Sog
Canada may already be carbon neutral - http://business.financialpost.com/opinion/canada-may-already-be-carbon-neutral-so-why-are-we-keeping-it-a-secret
All levels of govts have to revisit how they managed all aspects of their land as well as urban planning.
Wastewater Treatment Plants: Enhancing the Water-Energy Nexus at the Most Cri...Jim Dodenhoff
Wastewater Treatment Plants (WWTP) are becoming valuable platforms for innovative water and energy technologies. There are a number of key drivers for end users that are encouraging a more systems based approach to water and energy management on WWTP campuses including: drought (and the corresponding need for greater water reclamation), integration of renewables and storage, energy efficiency and demand response practices to match load with energy supply, overarching decarbonization strategies, system resiliency and reliability, and higher standards for water quality.
This presentation describes the transformation of WasteWater Treatment Centers to Resource Centers.
How Changes to Time of Use (TOU) Rates are Impacting Commercial & Industrial ...Jim Dodenhoff
The significant penetration of solar energy in the electricity supply mix, especially in Western U.S. states, has resulted in profound changes to the shape of electricity system load curves. In the past, utility electricity suppliers with summer peak demand generally found their load peaking from mid-day to late afternoon. These same geographic areas have also been the most attractive candidates for solar implementation. The net effect has been a shifting of system net daily peak period to later in the day: spanning mid-late afternoon to early-late evening.
A guiding principle behind most ratemaking is to have electricity rates reflect real-time system costs. This provides higher pricing signals to the customer when the system has less available supply of electricity. Many utility tariffs are now either incorporating Time-of-Use (TOU) tariffs and/or moving their peak periods to later in the day to more accurately reflect net system peak and the impact of significant solar supply. These changes can have large cost impacts on Commercial & Industrial end users who have significant load in the evening hours.
This presentation will model these TOU tariff changes in California and other Western geographic areas. Energy management technologies such as energy storage and advanced controls will be analyzed as potential solutions to mitigate increased costs from TOU tariffs.
Finally, the carbon-intensity of unique utility electricity grids will be analyzed in the context of TOU peak periods. The author will present findings showing whether purchase of utility electricity during daily peak periods buys into a higher carbon emitting generation fleet, and to what degree.
In the first 15 years of the 21st Century there has been a steady growth in Microgrids driven by a number of factors including geography, resilience, and location specific economics. In the last five years this growth has accelerated as the cost of renewables and storage have dropped significantly allowing for integration of these distributed energy resources (DER's) into Microgrids. A key to this trend has been intelligent, cybersecure microgrid control solutions (MCS) which have algorithms that can execute sophisticated control strategies that manage power flows safely and optimally. It is the MCS which is the nervous system of the microgrid and the platform upon which Microgrids are becoming a mainstream and scalable energy solution.
Presentation at the Energy Tech 2018 Conference explaining how IPERC's Microgrid Control Solution uses autonomous control to execute use cases and manage contingencies.
Integrating Cybersecure Microgrids Improves Energy Resiliency for the U.S. Mi...Jim Dodenhoff
Presentation given as part of the "Reliability, Resiliency, & Efficiency Energy Security" Panel at the 2017 World Energy Engineering Congress, sponsored by the Association of Energy Engineers
Integrating Renewable Energy and Cybersecurity to Improve Energy ResiliencyJim Dodenhoff
Microgrids provide a distinct opportunity to bring new capabilities, energy cost reduction, fuel savings, enhanced reliability & resiliency to the grid through the proper integration of renewable energy, DER’s and cybersecurity.
Water system optimization an energy efficiency view final presentationJim Dodenhoff
This paper reviews energy efficiency projects implemented for water distribution utilities in Arizona and highlights the enhanced value proposition of combined energy-water conservation projects.
2017 wwtp presentation y20170524 final linkedinnonotesJim Dodenhoff
Wastewater Treatment Plants (WWTP) are becoming valuable platforms for innovative water and energy technologies. There are a number of key drivers for end users that are encouraging a more system based approach to water and energy management on WWTP campuses including: drought (and the corresponding need for greater water reclamation), integration of renewables and storage, energy efficiency and demand response practices to match load with energy supply, overarching decarbonization strategies, system resiliency and reliability, and higher standards for water quality.
This presentation describes the transformation of WasteWater Treatment Centers to Resource Centers.
052115 final nlm jd water energy goggles 2015 emc finalJim Dodenhoff
This presentation explores the “Water-Energy Nexus” and redefines the boundaries of a water-energy project. This newly developed conceptual framework can be used by the water industry and policy makers to rethink their approach to water-energy conservation programs.
Distributed Control and Intelligence for Electric GridsJim Dodenhoff
Overview of a Demonstration Project that IPERC performed successfully implementing load shedding and generation sharing capabilities for a military microgrid.
2017 wwtp presentation y20170524 final linkedinnonotesJim Dodenhoff
Wastewater Treatment Plants (WWTP) are becoming valuable platforms for innovative water and energy technologies. There are a number of key drivers for end users that are encouraging a more system based approach to water and energy management on WWTP campuses including: drought (and the corresponding need for greater water reclamation), integration of renewables and storage, energy efficiency and demand response practices to match load with energy supply, overarching decarbonization strategies, system resiliency and reliability, and higher standards for water quality.
This presentation describes the transformation of WasteWater Treatment Centers to Resource Centers.
2017 clean energy presentation dodenhoff y20170608 linked in nonotesJim Dodenhoff
This presentation will track the major policy, market, and economic changes that have occurred between June 2016 and June 2017 and their broad impact on U.S. Clean Energy programs. The paper will identify how significantly U.S. energy policy and markets can change----or not--------over a year.
Willie Nelson Net Worth: A Journey Through Music, Movies, and Business Venturesgreendigital
Willie Nelson is a name that resonates within the world of music and entertainment. Known for his unique voice, and masterful guitar skills. and an extraordinary career spanning several decades. Nelson has become a legend in the country music scene. But, his influence extends far beyond the realm of music. with ventures in acting, writing, activism, and business. This comprehensive article delves into Willie Nelson net worth. exploring the various facets of his career that have contributed to his large fortune.
Follow us on: Pinterest
Introduction
Willie Nelson net worth is a testament to his enduring influence and success in many fields. Born on April 29, 1933, in Abbott, Texas. Nelson's journey from a humble beginning to becoming one of the most iconic figures in American music is nothing short of inspirational. His net worth, which estimated to be around $25 million as of 2024. reflects a career that is as diverse as it is prolific.
Early Life and Musical Beginnings
Humble Origins
Willie Hugh Nelson was born during the Great Depression. a time of significant economic hardship in the United States. Raised by his grandparents. Nelson found solace and inspiration in music from an early age. His grandmother taught him to play the guitar. setting the stage for what would become an illustrious career.
First Steps in Music
Nelson's initial foray into the music industry was fraught with challenges. He moved to Nashville, Tennessee, to pursue his dreams, but success did not come . Working as a songwriter, Nelson penned hits for other artists. which helped him gain a foothold in the competitive music scene. His songwriting skills contributed to his early earnings. laying the foundation for his net worth.
Rise to Stardom
Breakthrough Albums
The 1970s marked a turning point in Willie Nelson's career. His albums "Shotgun Willie" (1973), "Red Headed Stranger" (1975). and "Stardust" (1978) received critical acclaim and commercial success. These albums not only solidified his position in the country music genre. but also introduced his music to a broader audience. The success of these albums played a crucial role in boosting Willie Nelson net worth.
Iconic Songs
Willie Nelson net worth is also attributed to his extensive catalog of hit songs. Tracks like "Blue Eyes Crying in the Rain," "On the Road Again," and "Always on My Mind" have become timeless classics. These songs have not only earned Nelson large royalties but have also ensured his continued relevance in the music industry.
Acting and Film Career
Hollywood Ventures
In addition to his music career, Willie Nelson has also made a mark in Hollywood. His distinctive personality and on-screen presence have landed him roles in several films and television shows. Notable appearances include roles in "The Electric Horseman" (1979), "Honeysuckle Rose" (1980), and "Barbarosa" (1982). These acting gigs have added a significant amount to Willie Nelson net worth.
Television Appearances
Nelson's char
WRI’s brand new “Food Service Playbook for Promoting Sustainable Food Choices” gives food service operators the very latest strategies for creating dining environments that empower consumers to choose sustainable, plant-rich dishes. This research builds off our first guide for food service, now with industry experience and insights from nearly 350 academic trials.
"Understanding the Carbon Cycle: Processes, Human Impacts, and Strategies for...MMariSelvam4
The carbon cycle is a critical component of Earth's environmental system, governing the movement and transformation of carbon through various reservoirs, including the atmosphere, oceans, soil, and living organisms. This complex cycle involves several key processes such as photosynthesis, respiration, decomposition, and carbon sequestration, each contributing to the regulation of carbon levels on the planet.
Human activities, particularly fossil fuel combustion and deforestation, have significantly altered the natural carbon cycle, leading to increased atmospheric carbon dioxide concentrations and driving climate change. Understanding the intricacies of the carbon cycle is essential for assessing the impacts of these changes and developing effective mitigation strategies.
By studying the carbon cycle, scientists can identify carbon sources and sinks, measure carbon fluxes, and predict future trends. This knowledge is crucial for crafting policies aimed at reducing carbon emissions, enhancing carbon storage, and promoting sustainable practices. The carbon cycle's interplay with climate systems, ecosystems, and human activities underscores its importance in maintaining a stable and healthy planet.
In-depth exploration of the carbon cycle reveals the delicate balance required to sustain life and the urgent need to address anthropogenic influences. Through research, education, and policy, we can work towards restoring equilibrium in the carbon cycle and ensuring a sustainable future for generations to come.
Diabetes is a rapidly and serious health problem in Pakistan. This chronic condition is associated with serious long-term complications, including higher risk of heart disease and stroke. Aggressive treatment of hypertension and hyperlipideamia can result in a substantial reduction in cardiovascular events in patients with diabetes 1. Consequently pharmacist-led diabetes cardiovascular risk (DCVR) clinics have been established in both primary and secondary care sites in NHS Lothian during the past five years. An audit of the pharmaceutical care delivery at the clinics was conducted in order to evaluate practice and to standardize the pharmacists’ documentation of outcomes. Pharmaceutical care issues (PCI) and patient details were collected both prospectively and retrospectively from three DCVR clinics. The PCI`s were categorized according to a triangularised system consisting of multiple categories. These were ‘checks’, ‘changes’ (‘change in drug therapy process’ and ‘change in drug therapy’), ‘drug therapy problems’ and ‘quality assurance descriptors’ (‘timer perspective’ and ‘degree of change’). A verified medication assessment tool (MAT) for patients with chronic cardiovascular disease was applied to the patients from one of the clinics. The tool was used to quantify PCI`s and pharmacist actions that were centered on implementing or enforcing clinical guideline standards. A database was developed to be used as an assessment tool and to standardize the documentation of achievement of outcomes. Feedback on the audit of the pharmaceutical care delivery and the database was received from the DCVR clinic pharmacist at a focus group meeting.
Natural farming @ Dr. Siddhartha S. Jena.pptxsidjena70
A brief about organic farming/ Natural farming/ Zero budget natural farming/ Subash Palekar Natural farming which keeps us and environment safe and healthy. Next gen Agricultural practices of chemical free farming.
Artificial Reefs by Kuddle Life Foundation - May 2024punit537210
Situated in Pondicherry, India, Kuddle Life Foundation is a charitable, non-profit and non-governmental organization (NGO) dedicated to improving the living standards of coastal communities and simultaneously placing a strong emphasis on the protection of marine ecosystems.
One of the key areas we work in is Artificial Reefs. This presentation captures our journey so far and our learnings. We hope you get as excited about marine conservation and artificial reefs as we are.
Please visit our website: https://kuddlelife.org
Our Instagram channel:
@kuddlelifefoundation
Our Linkedin Page:
https://www.linkedin.com/company/kuddlelifefoundation/
and write to us if you have any questions:
info@kuddlelife.org
Summary of the Climate and Energy Policy of Australia
A new world wildfires -2021111 for posting
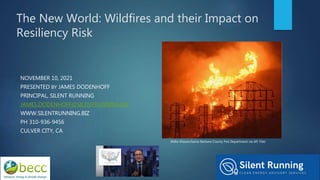
1. The New World: Wildfires and their Impact on
Resiliency Risk
NOVEMBER 10, 2021
PRESENTED BY JAMES DODENHOFF
PRINCIPAL, SILENT RUNNING
JAMES.DODENHOFF@SILENTRUNNING.BIZ
WWW.SILENTRUNNING.BIZ
PH 310-936-9456
CULVER CITY, CA
(Mike Eliason/Santa Barbara County Fire Department via AP, File)
2. Abstract
From 2018 through 2021, Wildfires have emerged as one of the most destructive and deadly
forces impacting energy resiliency around the globe. Dramatic new policy measures have
been implemented in different jurisdictions with decidedly mixed results. Even less clear is
whether these policy measures will truly ensure safe, reliable, and affordable energy------
along with a modicum of reliability. This presentation will provide a detailed overview of the
costs of wildfires within a resiliency framework, focusing upon California, Australia and other
highly impacted geographic areas. Existing policy responses such as the Public Safety
Power Shutoff (PSPS) program in
California will be evaluated for efficacy. Evolving policies will also be reviewed----especially
those that hold material potential to mitigate risk. Finally, for those areas with high wildfire
risk, electricity market responses in the commercial and industrial (C&I) sector will be
explored in detail. To what degree has wildfire risk expedited the shift from centralized utility
electricity generation to distributed and/or third-party C&I electricity generation? Has this
shift focused upon specific technologies (i.e. storage vs renewables vs fossil fuel
generators). The presentation will assess
whether these market shifts are mitigating wildfire risks or simply creating greater complexity
and variability.
3. Largest Wildfires in 21st Century
(as measured by Area burned)
Name Country Year Area Burned
(km2)
Equivalence in
Land Area
Fatalities
2021 Russia Wildfires Russia 2014 2021 200,000 Nebraska 0
2019-2020 Australian Bushfire
Season (Black Summer)
Australia 2019-20 180,000 South Dakota 479
2019 Siberia wildfires Russia 2019 43,000 2 x New Hampshire 0
2014 NW Territories Fires Canada 2014 34,000 2 x Hawaii 0
2009 Black Saturday Fires Australia 2019 21,000 Massachusetts 173
2020 California Wildfires United States 2020 18,000 New Jersey 31
2010 Bolivia Forest Fires Bolivia 2010 15,000 Connecticut 0
2011-12 Australian bushfire season Australia 2011-12 14,000 Connecticut 0
2006-07 Australian bushfire season Australia 2006-07 13,000 Connecticut 5
2017 British Columbia wildfires Canada 2017 12,000 Connecticut 0
2021 California Wildfires United States 2021 11,117 Connecticut 3
2015 Russian Wildfires Russia 2015 11,000 Connecticut 33
https://en.wikipedia.org/wiki/List_of_largest_fires_of_the_21st-century
4. Black Saturday Bushfires in Australia
-February 2009
Australian Government Bureau of Meteorology
Black Saturday Fires-Feb 2009
• 173 Fatalities
• 1.1 MM Acres/1700 sq miles
• CO2 produced: 10-15 MM tonnes
• A$4.4 billion cost
• Cause: Extreme Heat, High Winds,
Electric Infrastructure Sparking,
Arcing, and Breaking, Arson
• Legal-Class action suit against
SPAusnet settled at A$500M
5. Black Summer Wildfires in Australia: 2019-2020
Black Summer Fires:
Sept ‘19-March ‘20
• Fatalities: 34 Direct/445 Indirect
• 46 MM Acres/72.000 sq miles
• CO2 produced: 715 Million tonnes
• Cost: A$100 billion cost
• Cause: Lightning Strikes, Arson,
extreme high temperatures, large fuel
loads, drought
• Buildings Destroyed: 10,000
Source: Levin, Noam; Yebra, Marta; Phinn, Stuart; “Unveiling the Factors Responsible for Australia’s
Black Summer Fires of 2019/2020”, Fire, September 2021
6. Largest California Wildfires in 21st Century
Source: “Map: 1 0f every 8 acres in California has burned in the last 10 years. Here’s
where the biggest fires spread --- and are Burning now”, fSan Jose Mercury News, Paul
Rogers, September 29,2021
Dixie Fire
July-Oct 2021
• Fatalities: 1 Fatality
• Footprint:1 MM Acres/1600 sq
miles
• CO2 produced: TBD
• Cost: $1.25 billion
• Likely Cause: Vegetation falling on
live Power Line
• Buildings Destroyed: 1.329
August Complex Fire
August-Nov 2020
• Fatalities: 1 Fatality
• Footprint: 1 MM Acres/1600 sq
miles
• CO2 produced: TBD
• Cost: $320 MM
• Likely Cause: Lightning Strikes
• Buildings Destroyed: 935
Camp Fire
November 2018
• Fatalities: 85 People
• Footprint: 153,000 Acres/240 sq
miles
• CO2 produced: TBD
• Cost: $16.6 billion
• Cause: Faulty Electrical Transmission
Line
• Buildings Destroyed: 1.329
8. Wildfire Causes and Wildfire Stages
Fire
Lifecycle
Stage
Ignition
Growth
Fully
Developed
Decay
Lightning
Extreme
Heat,
Wind, and
Drought
Fuel
Loading
Manmade-
Arson
Manmade-
Accidental
Electrical
Infrastructur
e
Significant
Moderate
Minor
Insignificant
9. Climate Change Impact on Wildfires started
by Electrical Infrastructure
Climate Change
Extreme
Weather Events
• Extreme Heat
• High Winds
• Drought
Greater
Ignition Risk
• Downed Power Lines
• Vegetation contact with
Power Lines
Greater Fire
Growth Risk
• Sustained
Sparking
• Large
Geographic
Footprint
HOT OFF THE PRESS
“Quantifying contributions of natural variability and
anthropogenic forcings on increased fire weather risk
over the western United States,” Yizhou Zhuang, Rong
Fu, Benjamin D. Santer, Robert E. Dickinson, and Alex
of the National Academy of Sciences of the United
2021
10. Tools for Mitigating Wildfire Risk Caused by
Electrical Infrastructure
Public
Safety
Power
Shutoffs
(PSPS)
Vegetation
Management
& Prescribed
Burning
Update &
Upgrade
Risky T&D
Components
Underground
T&D
infrastructure
Field-Based
Regulatory
Intervention
Microgrids
&
Distributed
Generation
Climate
Change
Mitigation
12. Thank You!
James Dodenhoff, Principal, Silent Running LLC
James.Dodenhoff@silentrunning.biz
www.silentrunning.biz
Please email me if you’d like a copy of the presentation and accompanying
references.
Editor's Notes
It took John Oliver 20 minutes to cover the Power Grid & Resiliency last Saturday. I’m going to try and address the the Challenge of Minimizing Wildfire Risk from/to Electrical Infrastructure in 7-8 minutes. Somewhat like hopping on a rollercoaster while it is moving.
This slide provides a Global overview of the Largest Wildfires in the 21st Century, sorted by footprint of area burned.
In this chart, I’ve highlighted in yellow, those fire events which I’ve taken a deep dive into and for which the greatest amount of accurate data is available.
As you look down the table, I want you to consider the parameters along which wildfires and bush fires are analyzed:
Size: How big is a wildfire? Amount of area burned?
How lethal is a fire? How many people die from a given fire (direct/indirect)
How destructive is a fire? Property loss (electrical infrastructure), Animal Loss, Wild/Pristine Areas lost
How costly is a fire? What amounts of moneys are spent or economic opportunities lost when we have a wildfire (Business Interruption Electricity Customers without power)
How much Environmental damage? GHG Emissions, watershed loss, air quality, biodiversity
What caused the Fire? Cause maps to both initial ignition and subsequent growth, full development, and decay.
Other dimensions?
Roughly the Size of Kenya or France in Total
Black Saturday
Black Saturday Fires in 2009 comprised Bandigo & Redesdale, Kinglake Complex, Bunyip, Churchill Complex, Dargo, and Beechworth
Cause of Fire: High Temperature Records. Melbourne had three days over 109 degrees.
1.1 Million Acres is = 1700 square miles- Larger than the state of Rhode Island.
Carbon production from Black Saturday fires produced equivalent of 5% of Australia’s overall CO2 production
Electricity Failures behind most Black Saturday deaths.
When they happened Black Friday Fires 9th deadliest bushfire/wildfire event in recorded history.
Black Summer Wildfires Australia 2019-2020
Acreage covered = 72,000 sq miles or equivalent of South Dakota
Fatalities: 34 Direct/445 Indirect (Smoke Inhalation)
Lightning the major cause of ignition, however the historically high and dry conditions greatly exacerpated the destruction from the fire.
Small percentage from human causes (including powerlines, machinery and amateur back-burns on rural property. Arson was a relatively small impact)
CO2 emissions for this event alone were 715 MM tonnes exceeding the “normal” total annual CO2 emissions from Australia of 535 MM tonnes.
Nine of California’s 10 largest wildfires have occurred in the last decade. and the 8 largest have burned since 2017. Over the past 10 years, 1 of every 8 acres in the state has burned in a wildfire, double that of the previous decade.
Natasha Stavros is an applied science system engineer at NASA’s Jet Propulsion Laboratory in Southern California who studies wildfires. She says that wildfires in the U.S. West are bigger, more severe, and faster than ever before, and more destructive, with 15 of the 20 most destructive wildfires in California history occurring within the past decade.
Finally, I’ve included detail on the 2018 Camp Fire which actually was NOT one of the Largest California Wildfires in this century. The Camp Fire was, however the deadliest and most destructive wildfire in California's history,[11] and the most expensive natural disaster in the world in 2018 in terms of insured losses.[12][13][3]. It is the sixth deadliest U.S. wildfire overall.
The fire was started by a failed transmission line.
All of this to say that the largest wildfires or bushfires are not necessarily the most lethal or destructive, and smaller wildfires and bushfires can reap enormous destruction.
Stage 1-Ignition has occurred but there has been no spread
Stage 2-FireGrowth-Fire is self sustaining and there is a rapid increase in Heat Release
Stage 3-Fully Developed-Fire is at its hottest point. Burning all of its available fuel
Stage 4- Decay-Fire is running out of fuel but is still very dangerous. This is the longest stage
On the left hand column under “Fire Lifecycle Stage” are the primary stages or phases of a 0-30%. The remaining columns are the major causes of wildfires and the degree to which these causes or origins impact each phase of a Wildfire.,
What causes wildfires? What is a seemingly simple question is, in fact, quite complicated. Less than 10% of CA Wildfires are started by electric infrastructure. Lightning is roughly 15-25%, Manmade arson and accidental causes comprise another 15-25%, but, the largest direct cause of wildfires is either unknown or undetermined.
Let’s dig a little deeper. A significant driver for fire ignition may not necessarily be a key driver for the fire’s growth and fully developed burn (I would put a single lightning strike into this category). Fuel loading may not be a particularly significant ignition driver, but can be the main driver behind the fire’s growth, spread, and destructiveness.
Extreme heat, Wind, and drought have an important impact on all phases of a wildfire. Electrical infrastructure failure, arcing, or sparking is certainly a driver for ignition and growth, but is not particularly significant to a fire’s full development.
Electrical Infrastructure is not a major root cause of wildfires. However it has shown the capability to create destructive and deadly wildfires like the Camp Fire in 2018 which was ignited by a faulty electric transmission line. Even so, the severity and destructiveness of this fire was also driven by severe drought, high fuel loading, and close proximity of people and structures to high wildfire risk areas.
The point I’m making is that-Climate Change creates an environment (namely Extreme Weather events and conditions) which magnify the burn potential for ignition events and which can amplify the intensity of fire growth and heat release for a given wildfire.
Finally, as you can see, I’ve provided a reference to a VERY RECENT article by CA researchers who have found that regular weather patterns explain a relatively small portion of CA’s extreme weather events and that climate change is a much larger explanatory factor ranging from 60-80%. They argue that climate change is primarily responsible for extreme weather events and conditions. These, are in turn, a large and important driver of the rash of destructive wildfires.
This slide presents an array of the most widely used tools for trying to reduce wildfires started by electrical infrastructure. The color schemes I use are evaluative and directional. A green shaded tool is at least somewhat effective in taking on the challenge. A red shaded tool indicates a lack of efficacy, feasibility, or provability.
I am a large supporter of microgrids and distributed energy and see a decentralized generation system as a remedy for many of the grid’s deficiencies, however, my research indicates that this is not the end-all/be-all solution for mitigating wildfire risk---especially since so many microgrids will remain grid-connected.
Conversely, my research could find little evidence that PSPS’s provided material wildfire mitigation and a significant evidence that in a context of extreme weather events (high wind, extreme heat, drought), cutting off access to electricity introduces additional hazards to end-use customers.
Pacific Gas & Electric has proposed Undergrounding some of its T&D infrastructure in high fire risk areas. The costs of this infrastructure is roughly 5-10 times that of overhead lines. Undergrounding is generally implemented in urbanized (rather than remote) areas and bundled with other infrastructure (e.g. broadband cable). Undergrounding may reduce risk from wildfires but it in no way protects against a host of other risks and challenges (underground flooding, human digging, and high maintenance costs). PG&E’s proposal to underground a portion of its T&D infrastructure is neither feasible, nor credible in my view.
Ultimately, Climate Change Mitigation is the best long term tool and the umbrella under which wildfire risk can be reduced.
xxxxxxxxxxxxxxxxxxxxxxxxxxxxxxxxxxxxxxxxxxxxxxxxxxxxxxxxxx
Circling back to the Challenge we are trying to address-----Minimizing Wildfire Risk from/to Electrical Infrastructure, I would offer some closing thoughts
There is considerable ambiguity around Wildfire Risk Mitigation Measures and their Efficacy w respect to Electrical Infrastructure: How do we know our measures are working?
Public Safety Power Shut-offs are primarily a Liability Mitigation measure for utilities and their regulators.
In CA, the C&I Distributed Generation Market is being driven by PSPS risk and energy independence as much or more than by Wildfire risk. End Use Customers are more afraid of PSPS’s than wildfires and are seeking certainty of service and cost.
Last, but certainly not least Climate Change plays a central role in the escalating number, severity, and destructiveness of wildfires around the world. Climate Change creates conditions where electrical infrastructure ignition risk is higher and fire-specific destruction is greater.
HERE IS MY UTOPIA: A WORLD WHERE WE CAN PREDICT, MEASURE, AND MITIGATE ELECTRIC INFRASTRUCTURE WILDFIRE RISK WITH THE END-GAME OF ENHANCED GRID RESILIENCY AND RELIABILITY.
MY RESEARCH INDICATES WE HAVE A VERY LONG WAY TO GO.
In fact, I would argue that the tools we have for climate change measurement and mitigation may be more evolved than the tools we have for reducing wildfire risk. For both wildfires and climate change effective implementation of mitigation measures is in its infancy. This is unsurprising given their interdependence.