Download to read offline
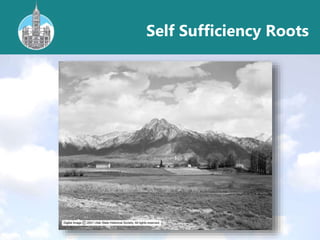
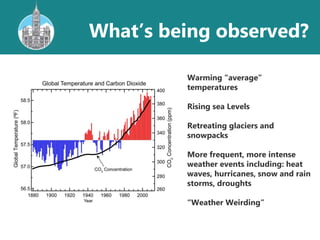

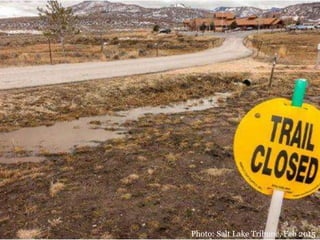

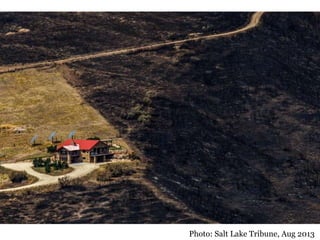
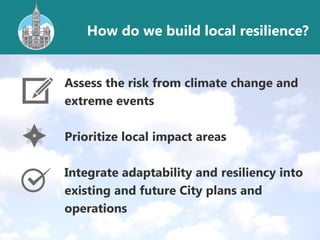
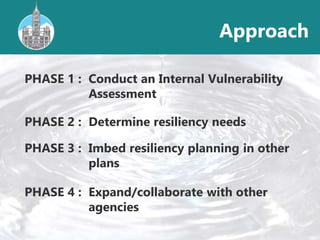
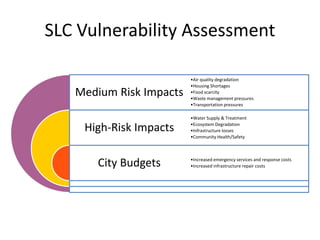


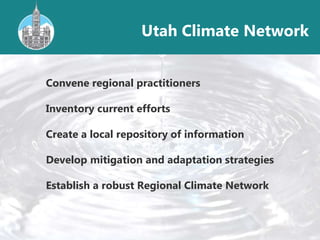
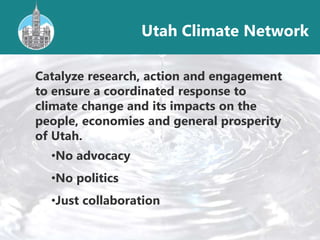


The document outlines strategies for building local resilience to climate change in Salt Lake City, highlighting the need for self-sufficiency, proactive planning, and collaboration with regional practitioners. It details a phased approach that includes vulnerability assessments, determining resiliency needs, and integrating these considerations into city planning. Additionally, the document emphasizes the importance of a coordinated response to climate change, focusing on community impacts and infrastructure sustainability.


![City_politics_and_the_environment_g2[1].pptx](https://cdn.slidesharecdn.com/ss_thumbnails/citypoliticsandtheenvironmentg21-230314002358-a3126444-thumbnail.jpg?width=640&height=640&fit=bounds)


