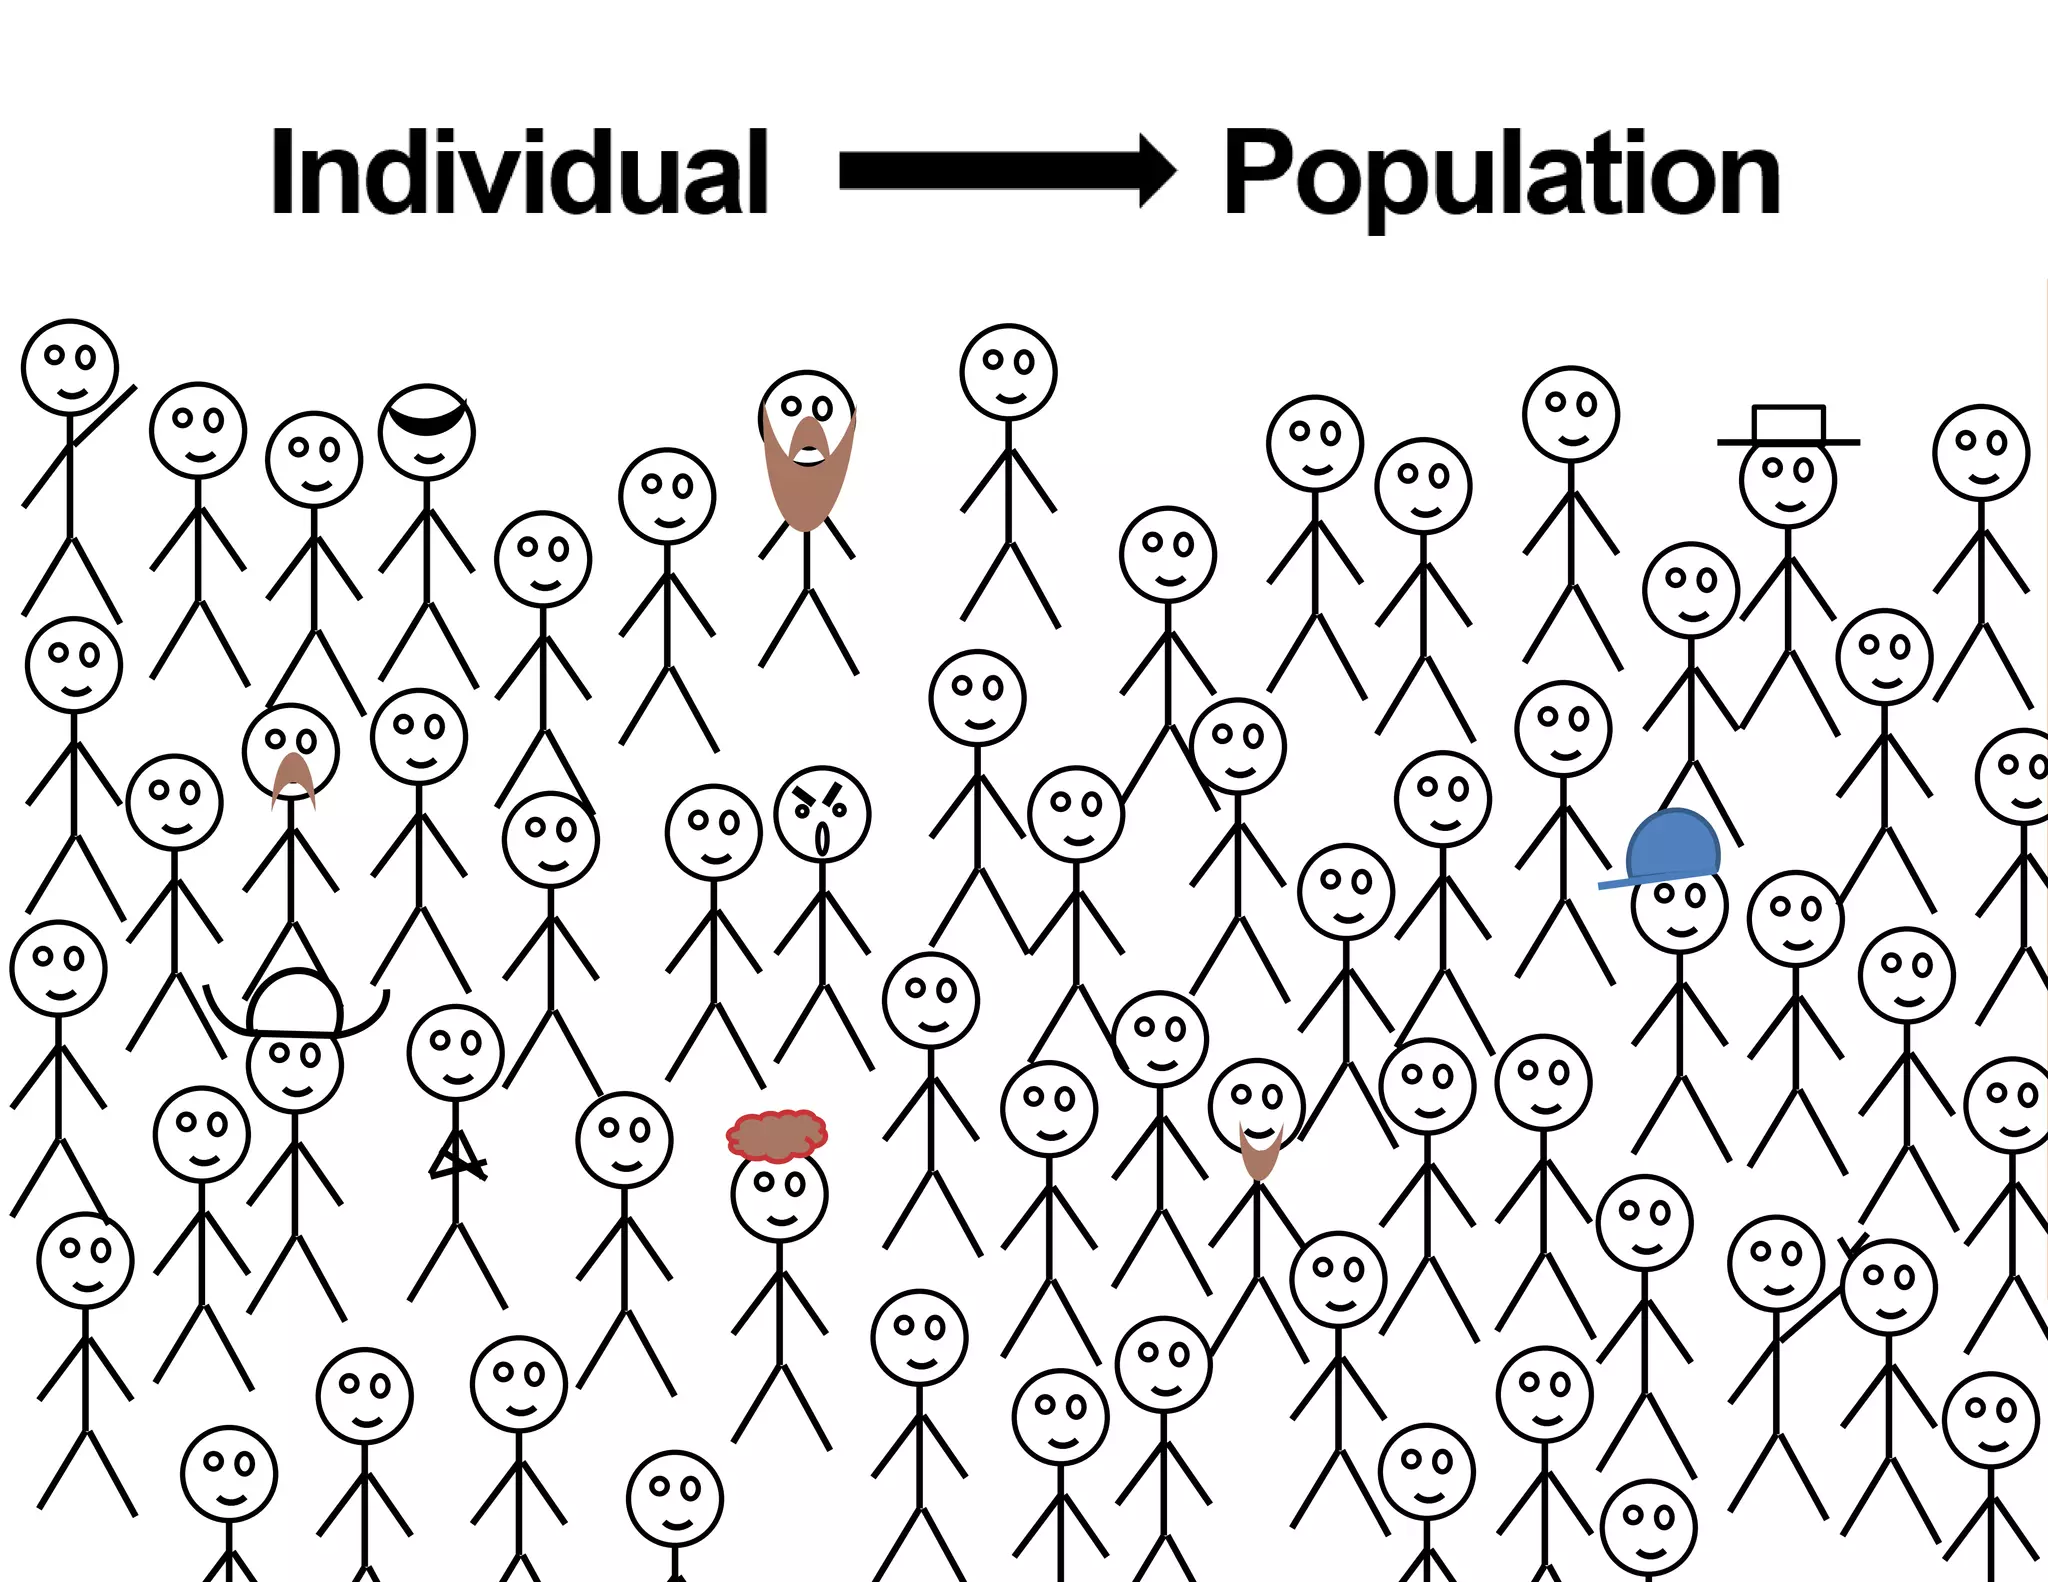
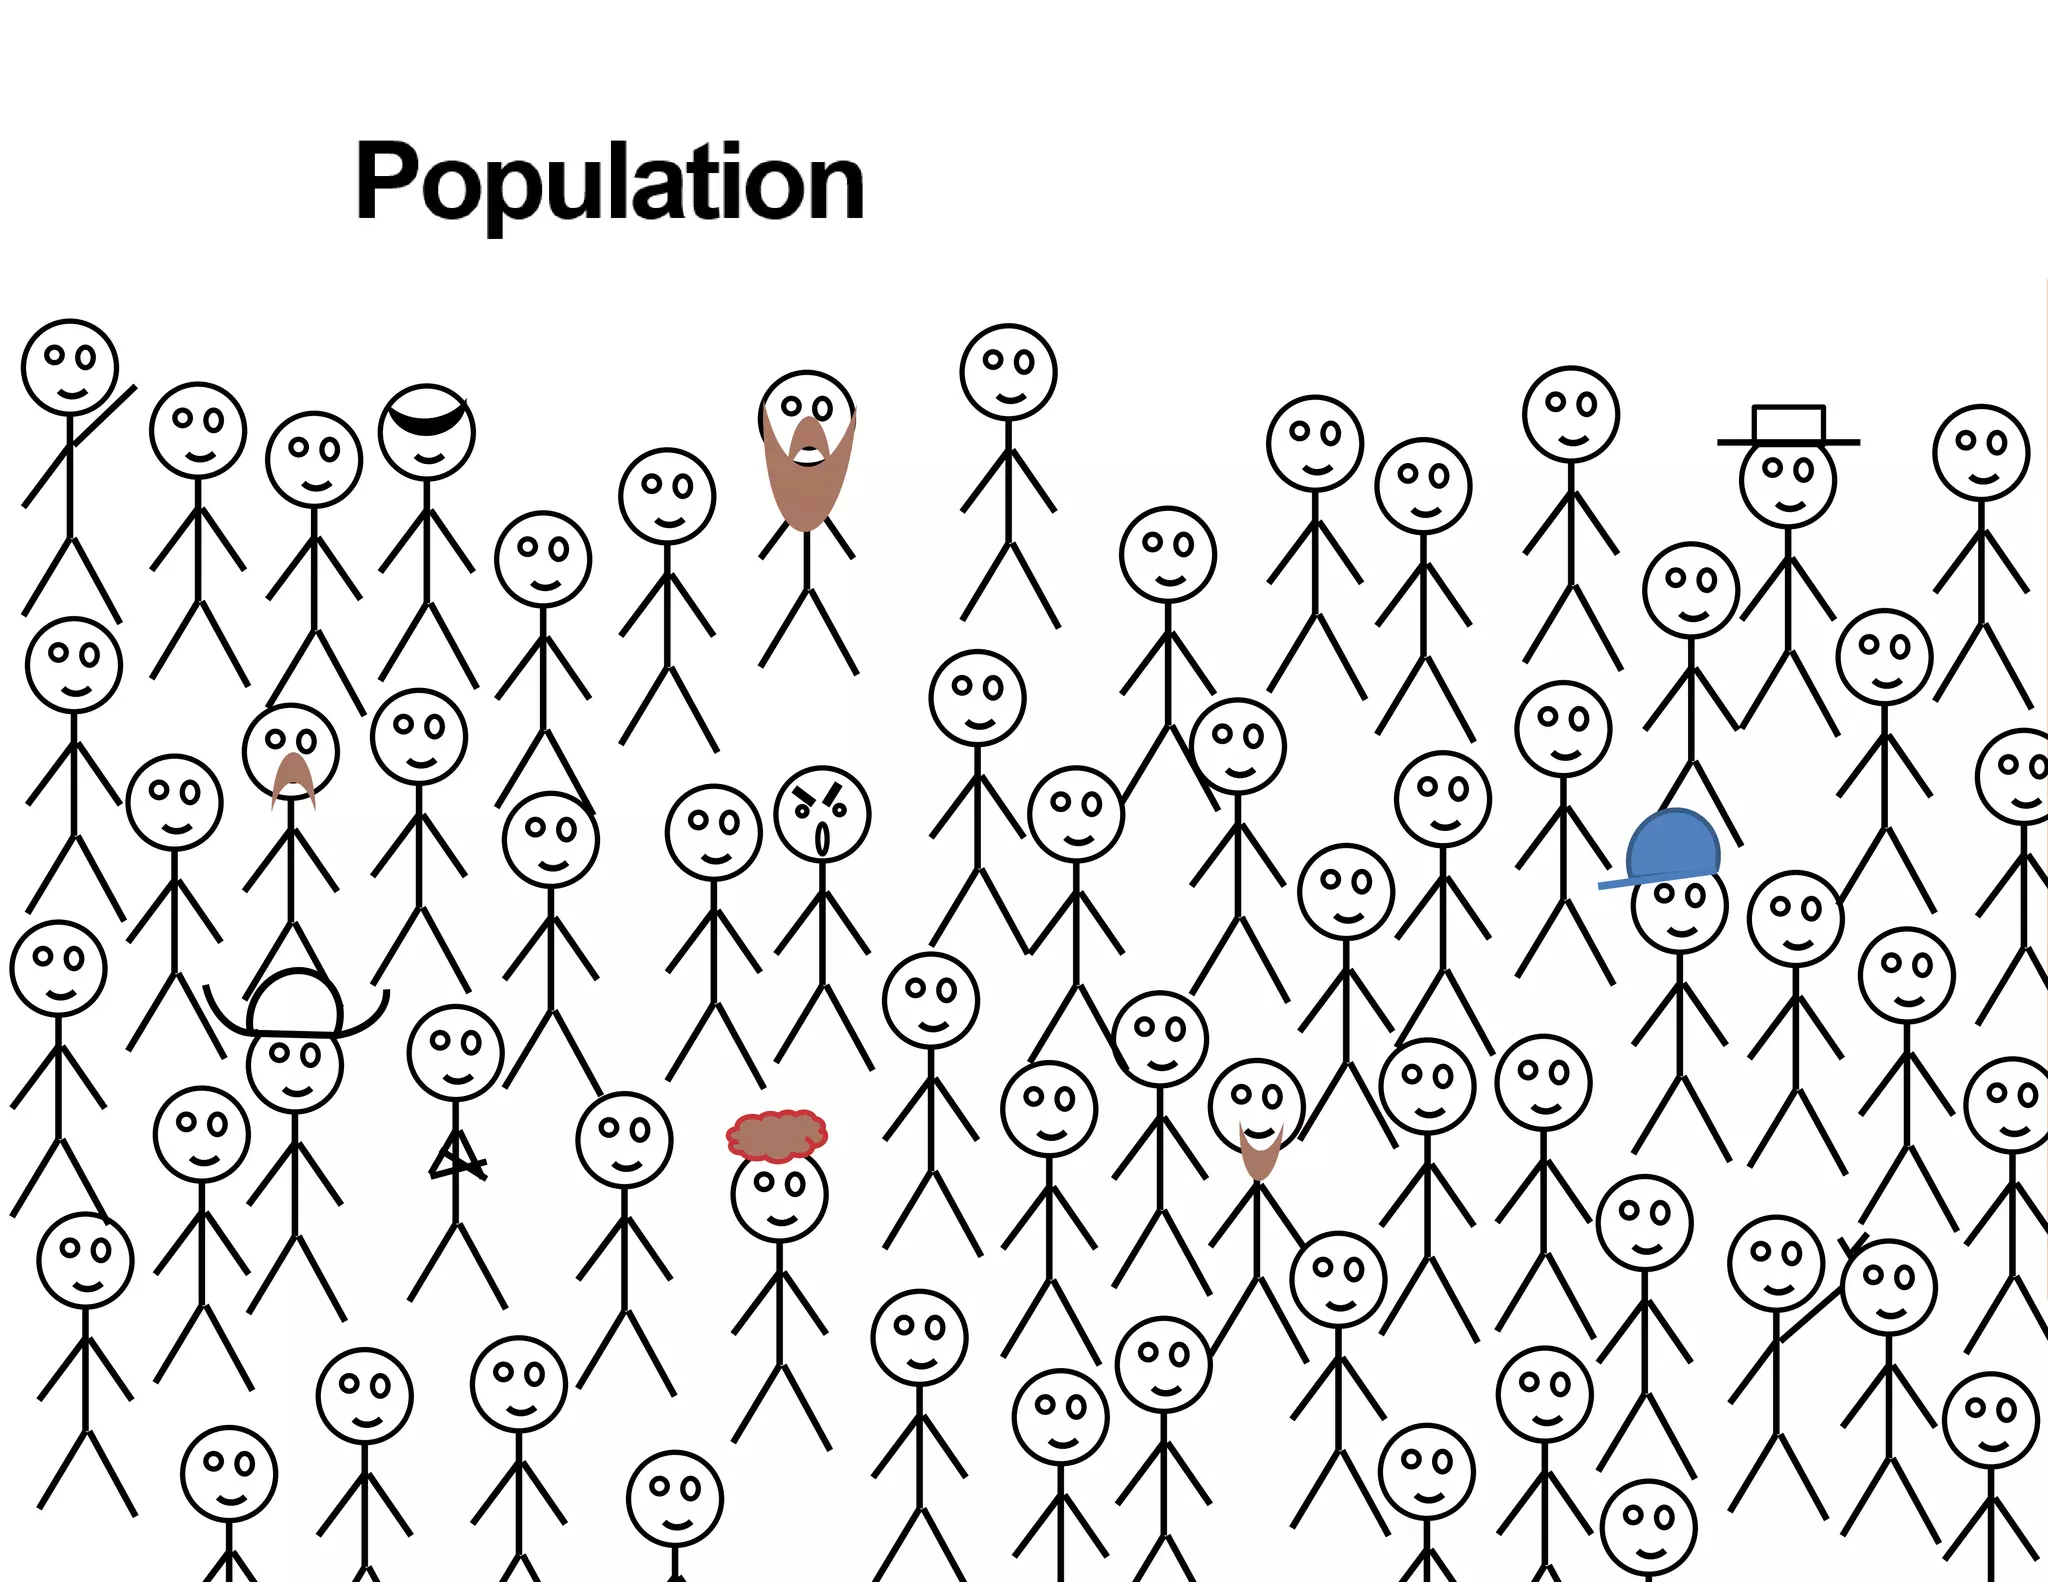
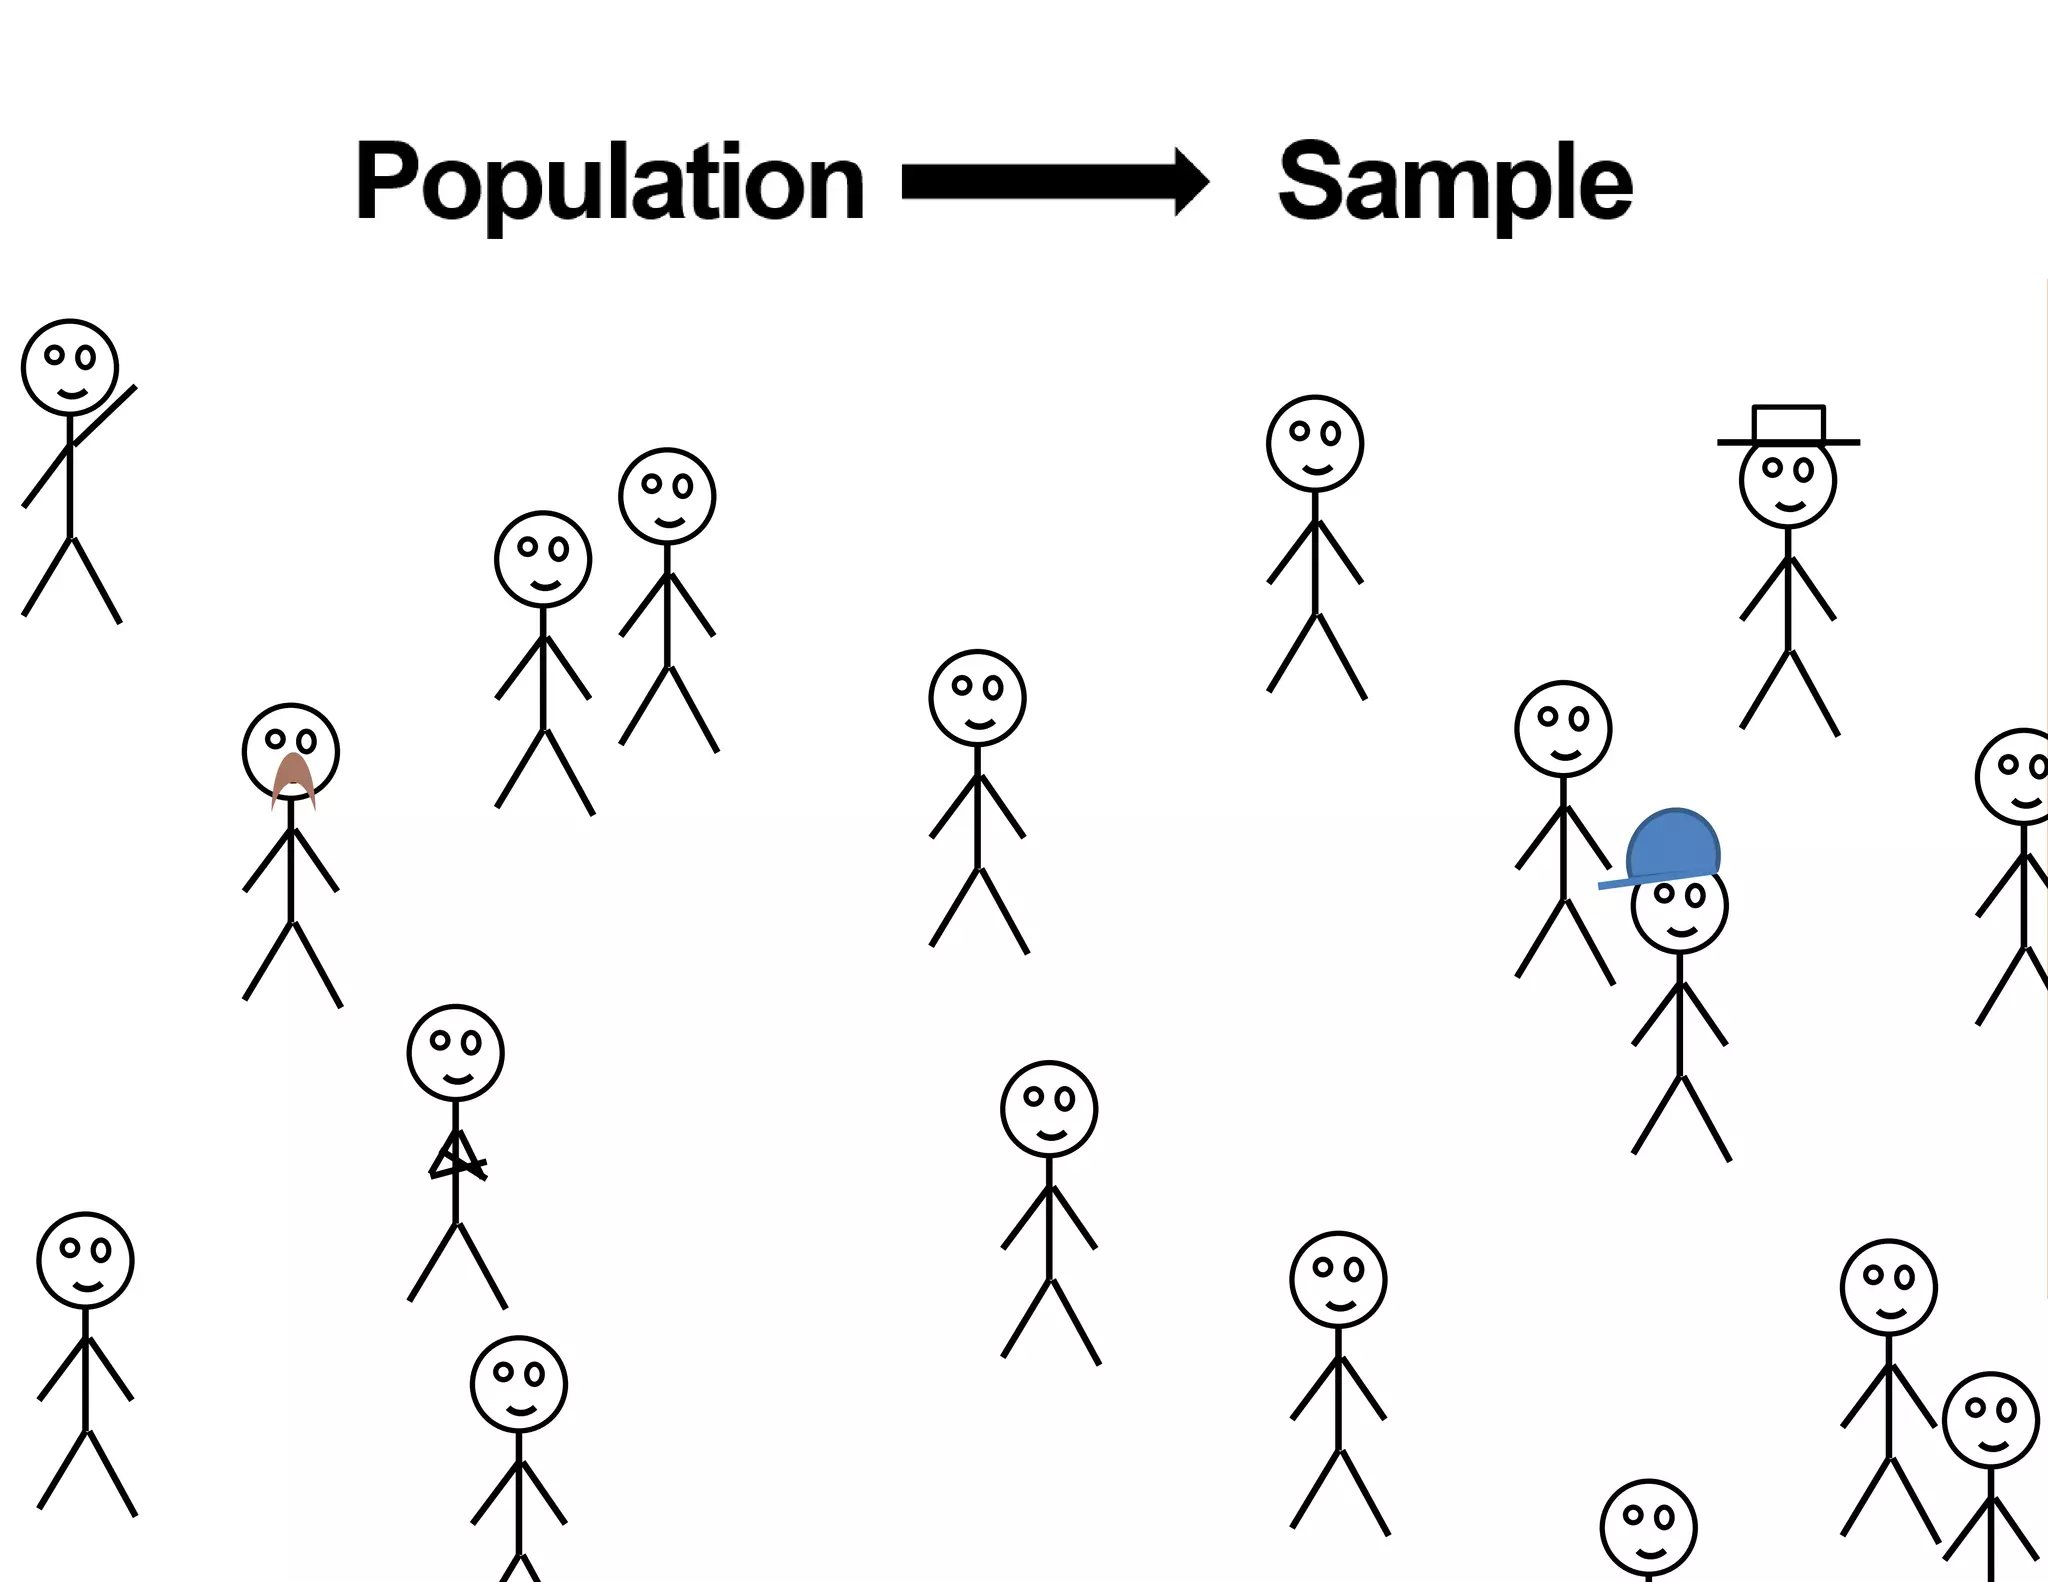
- The document discusses methods for estimating the impact of programs, specifically average treatment effects.
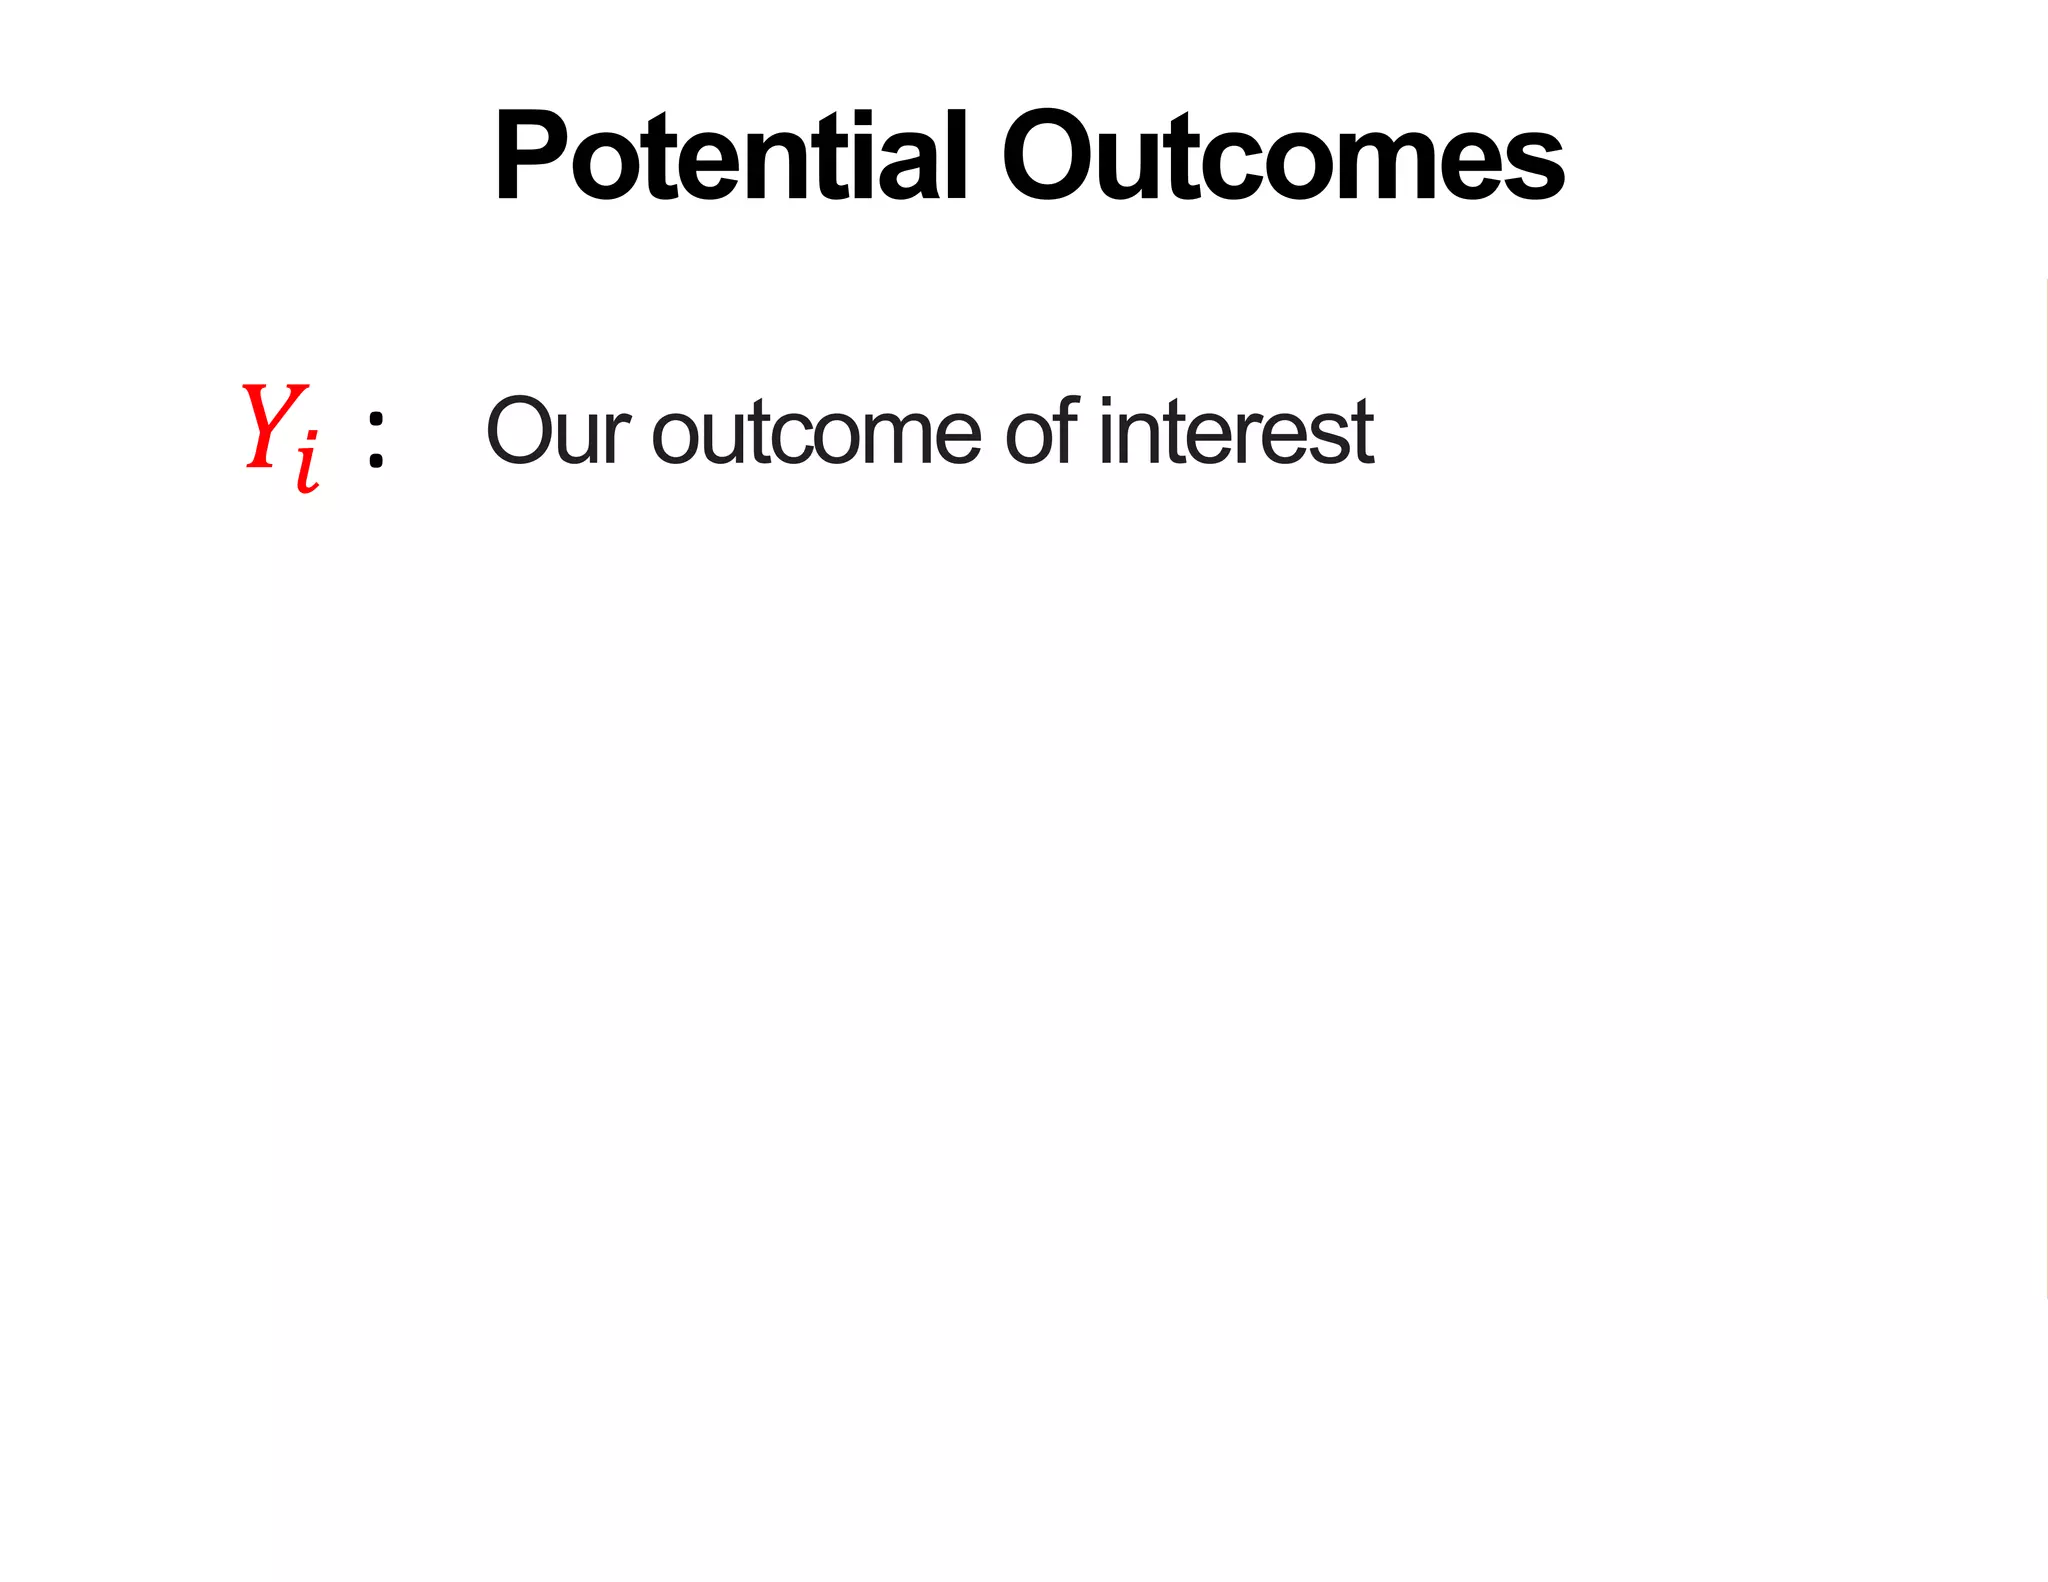
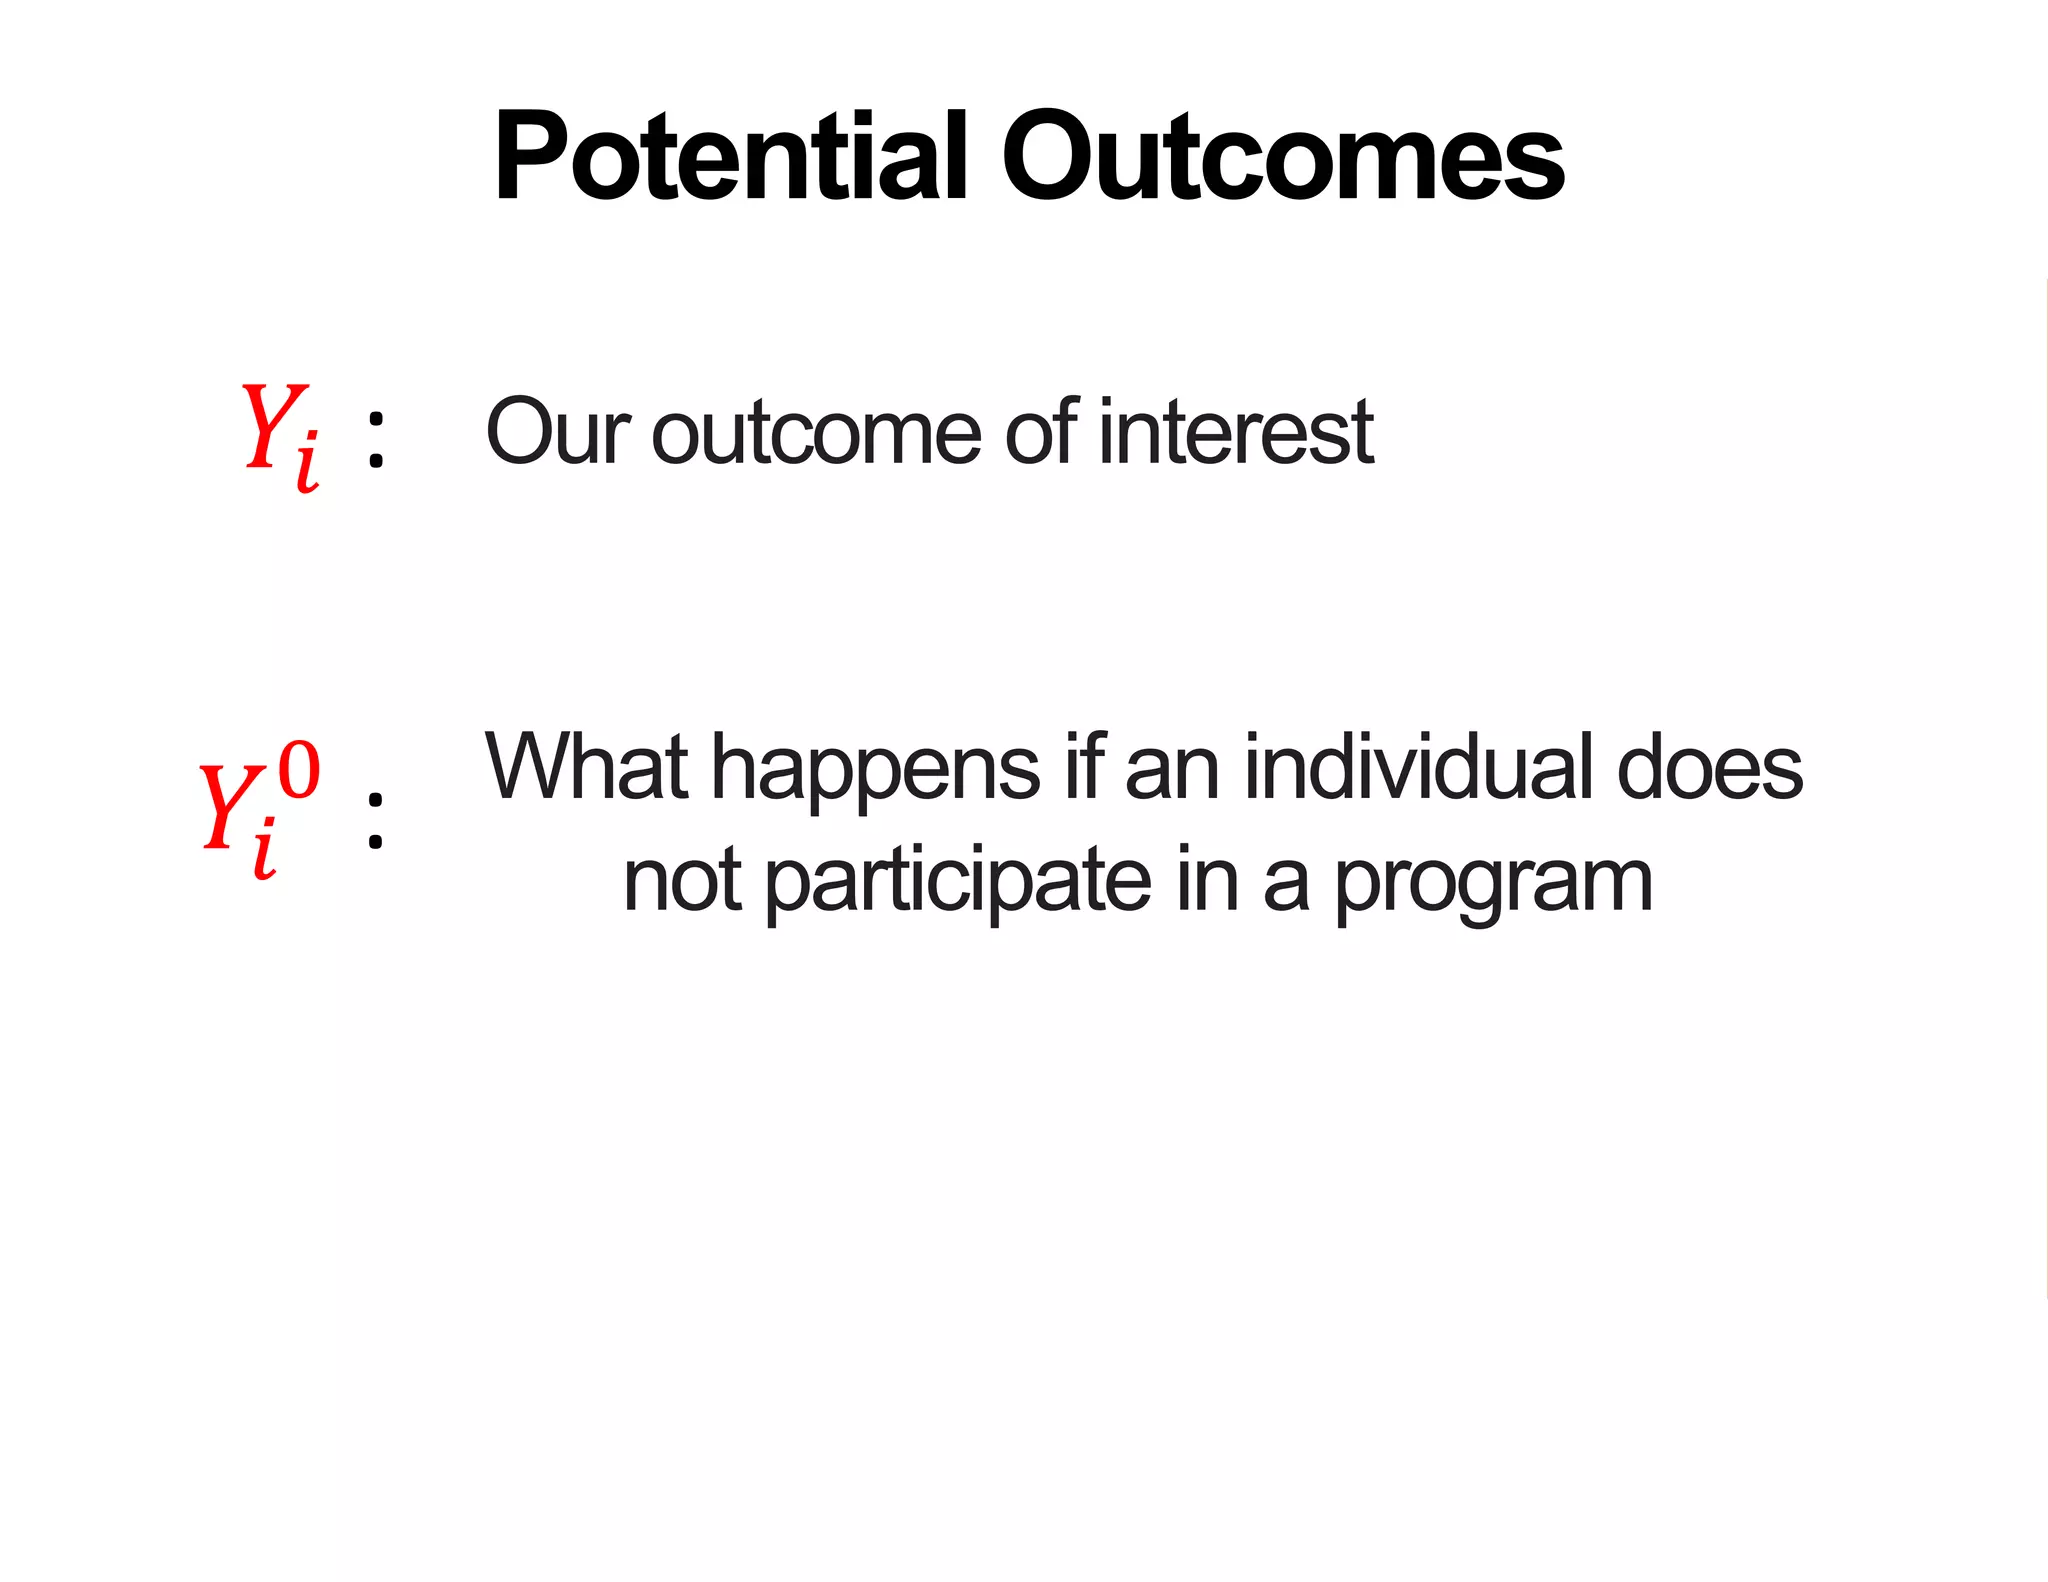
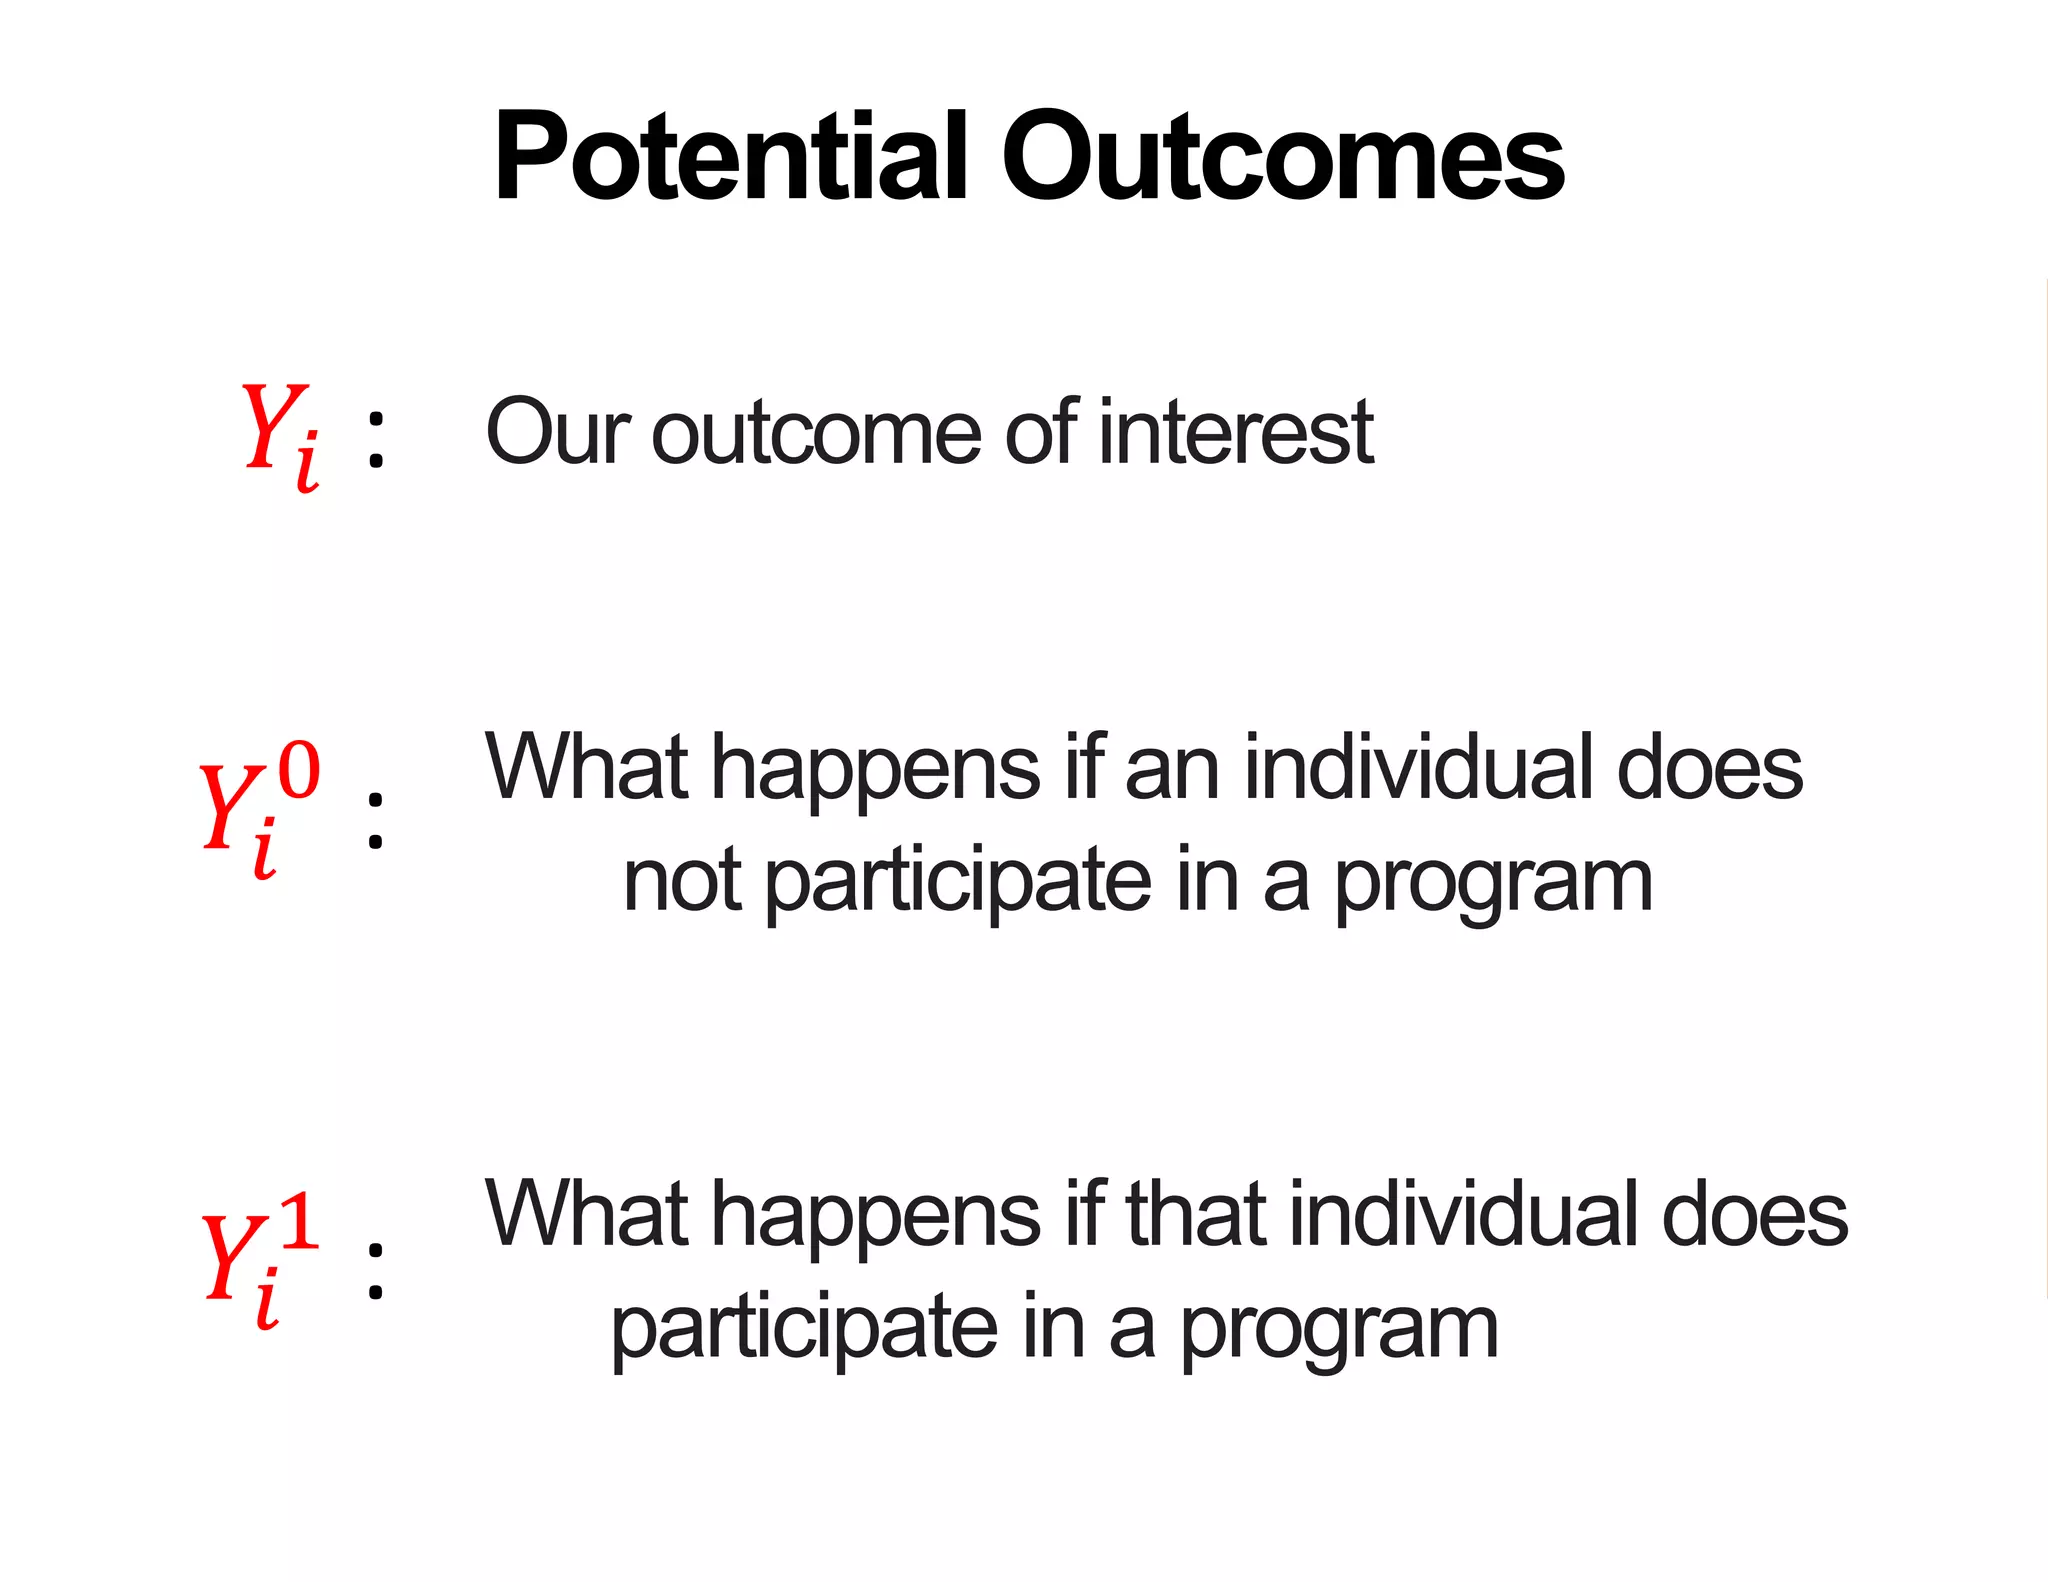
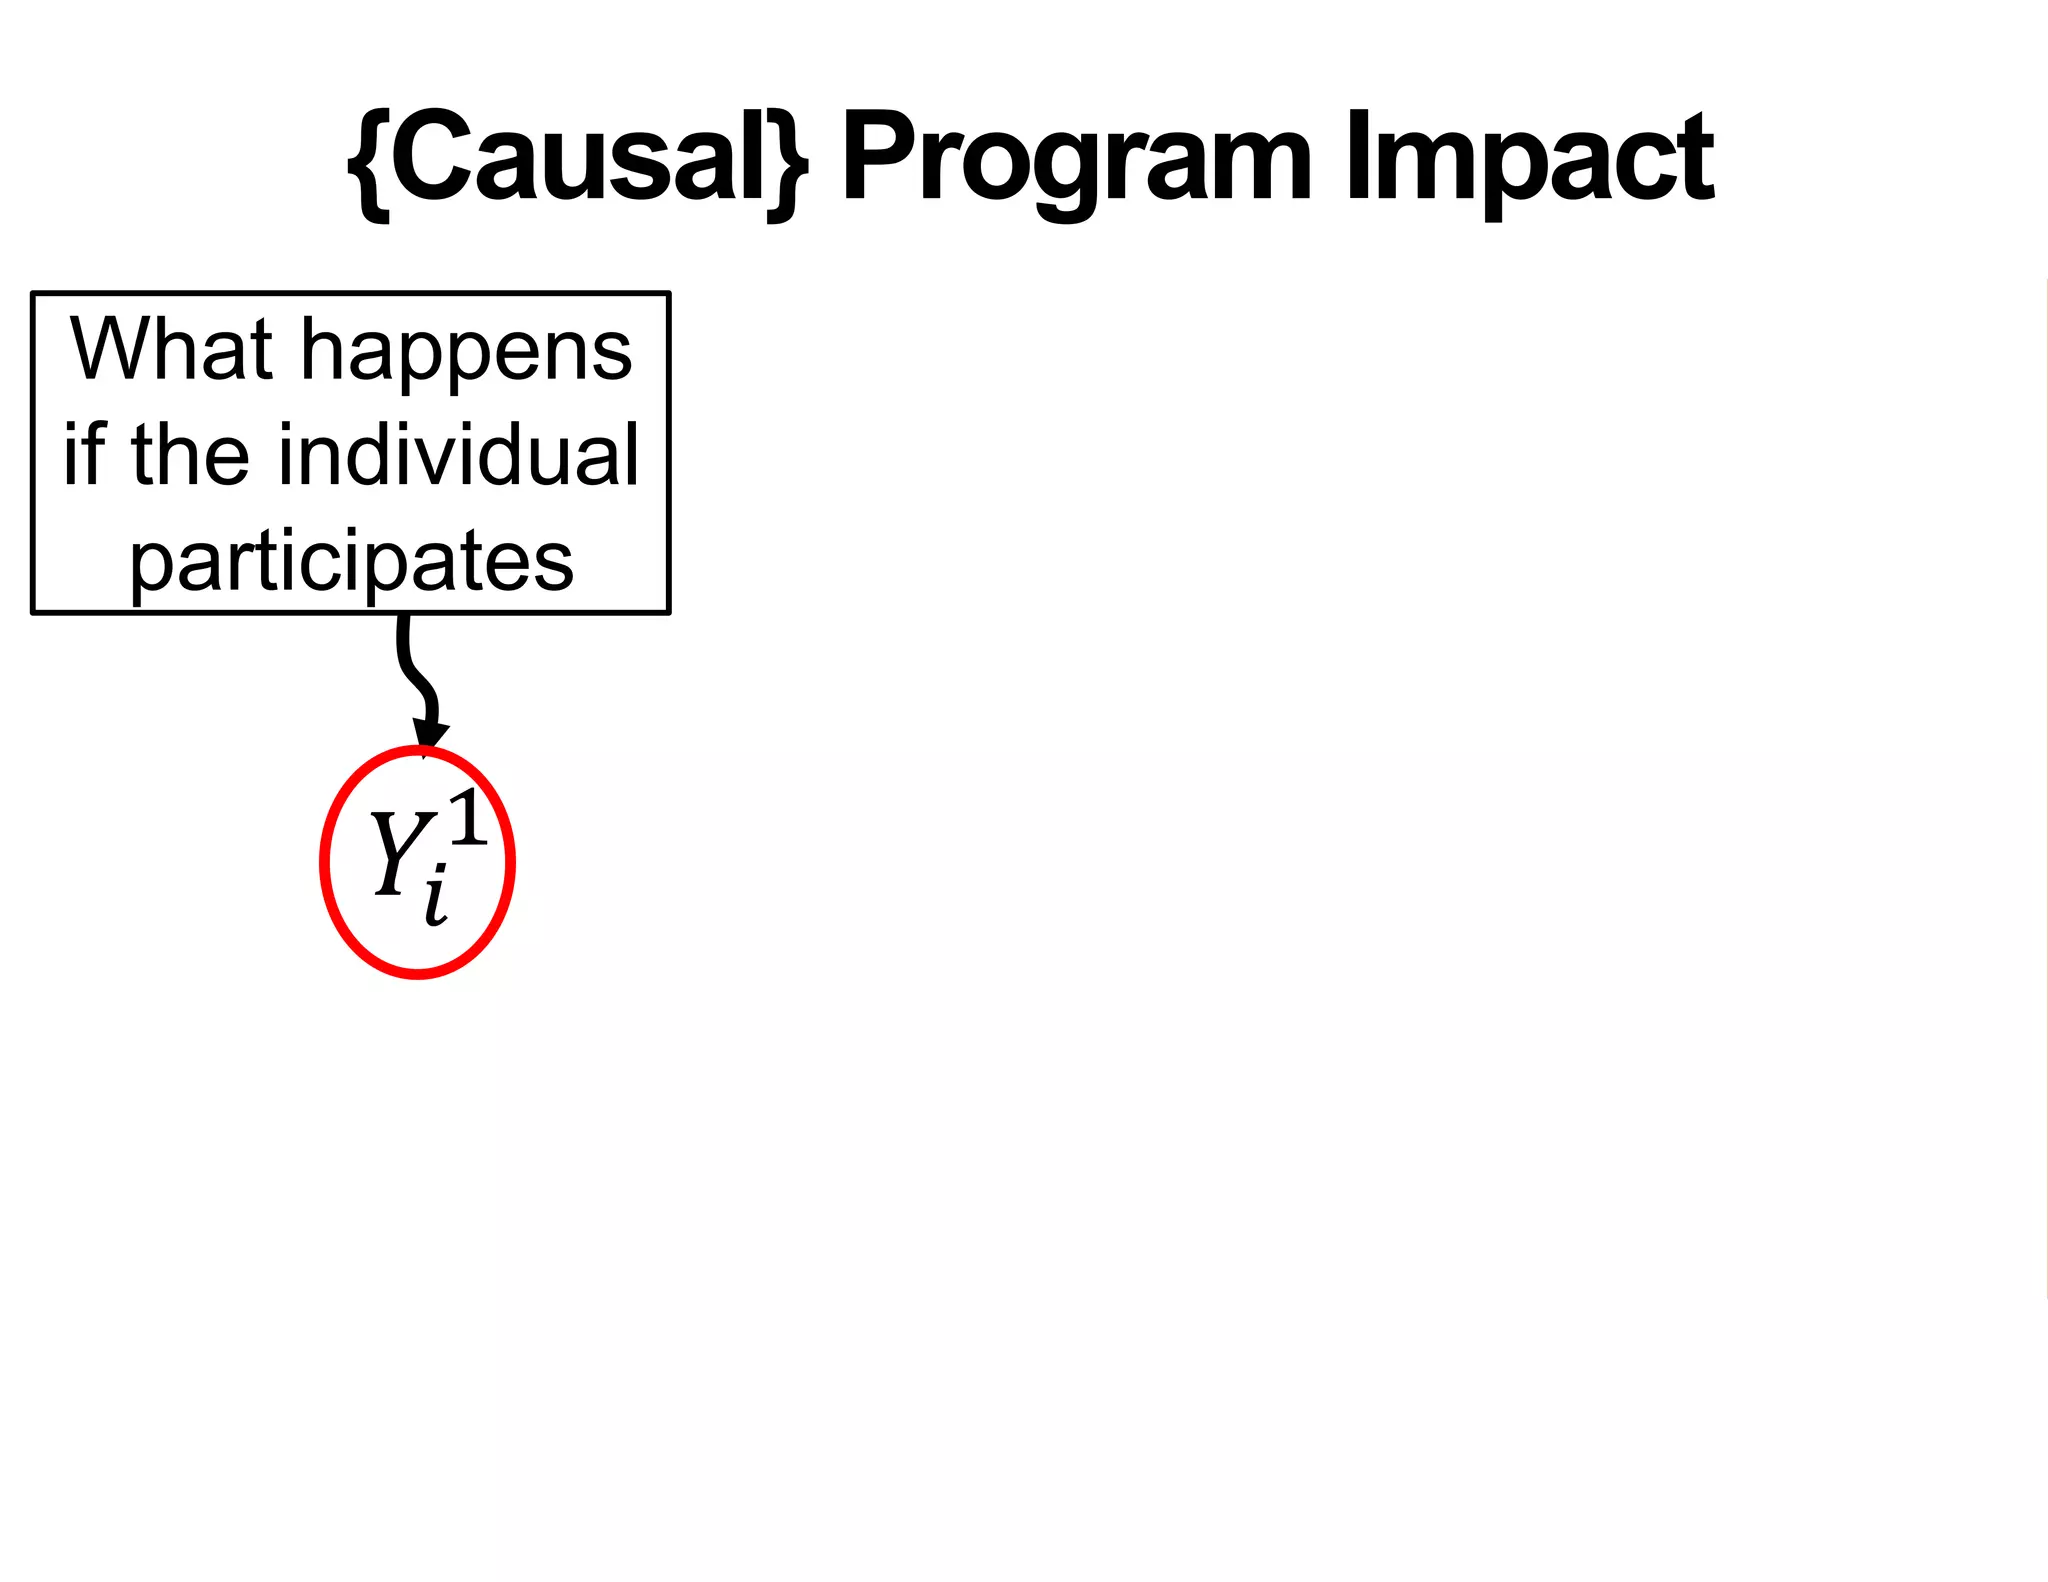
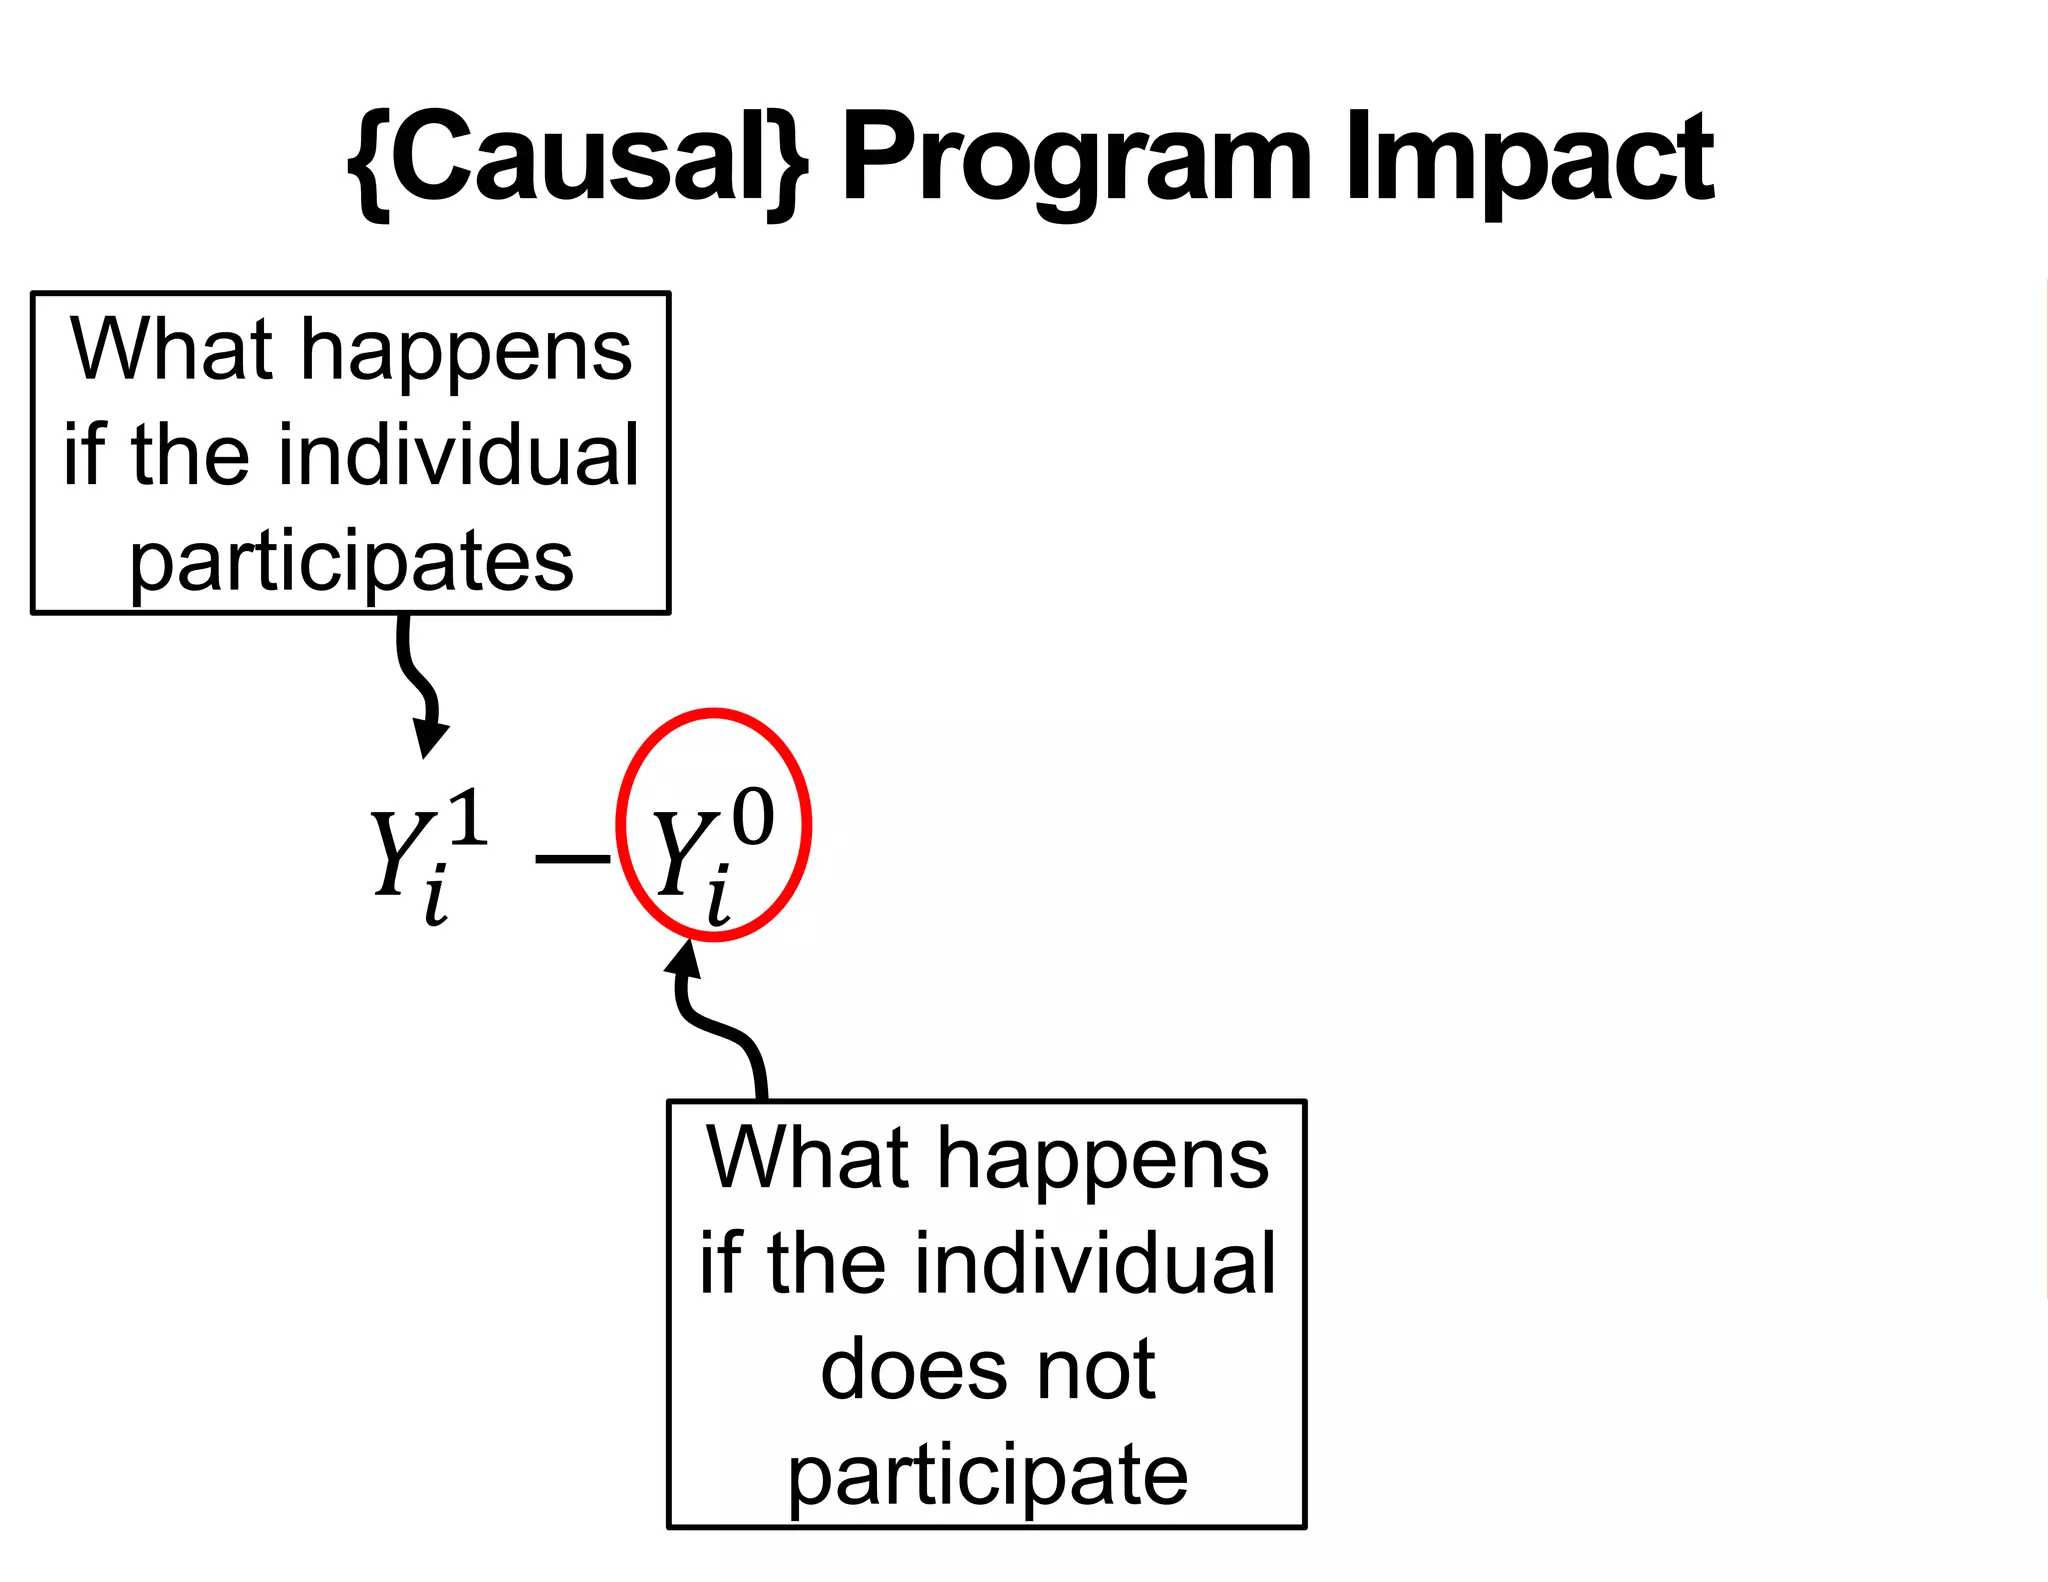
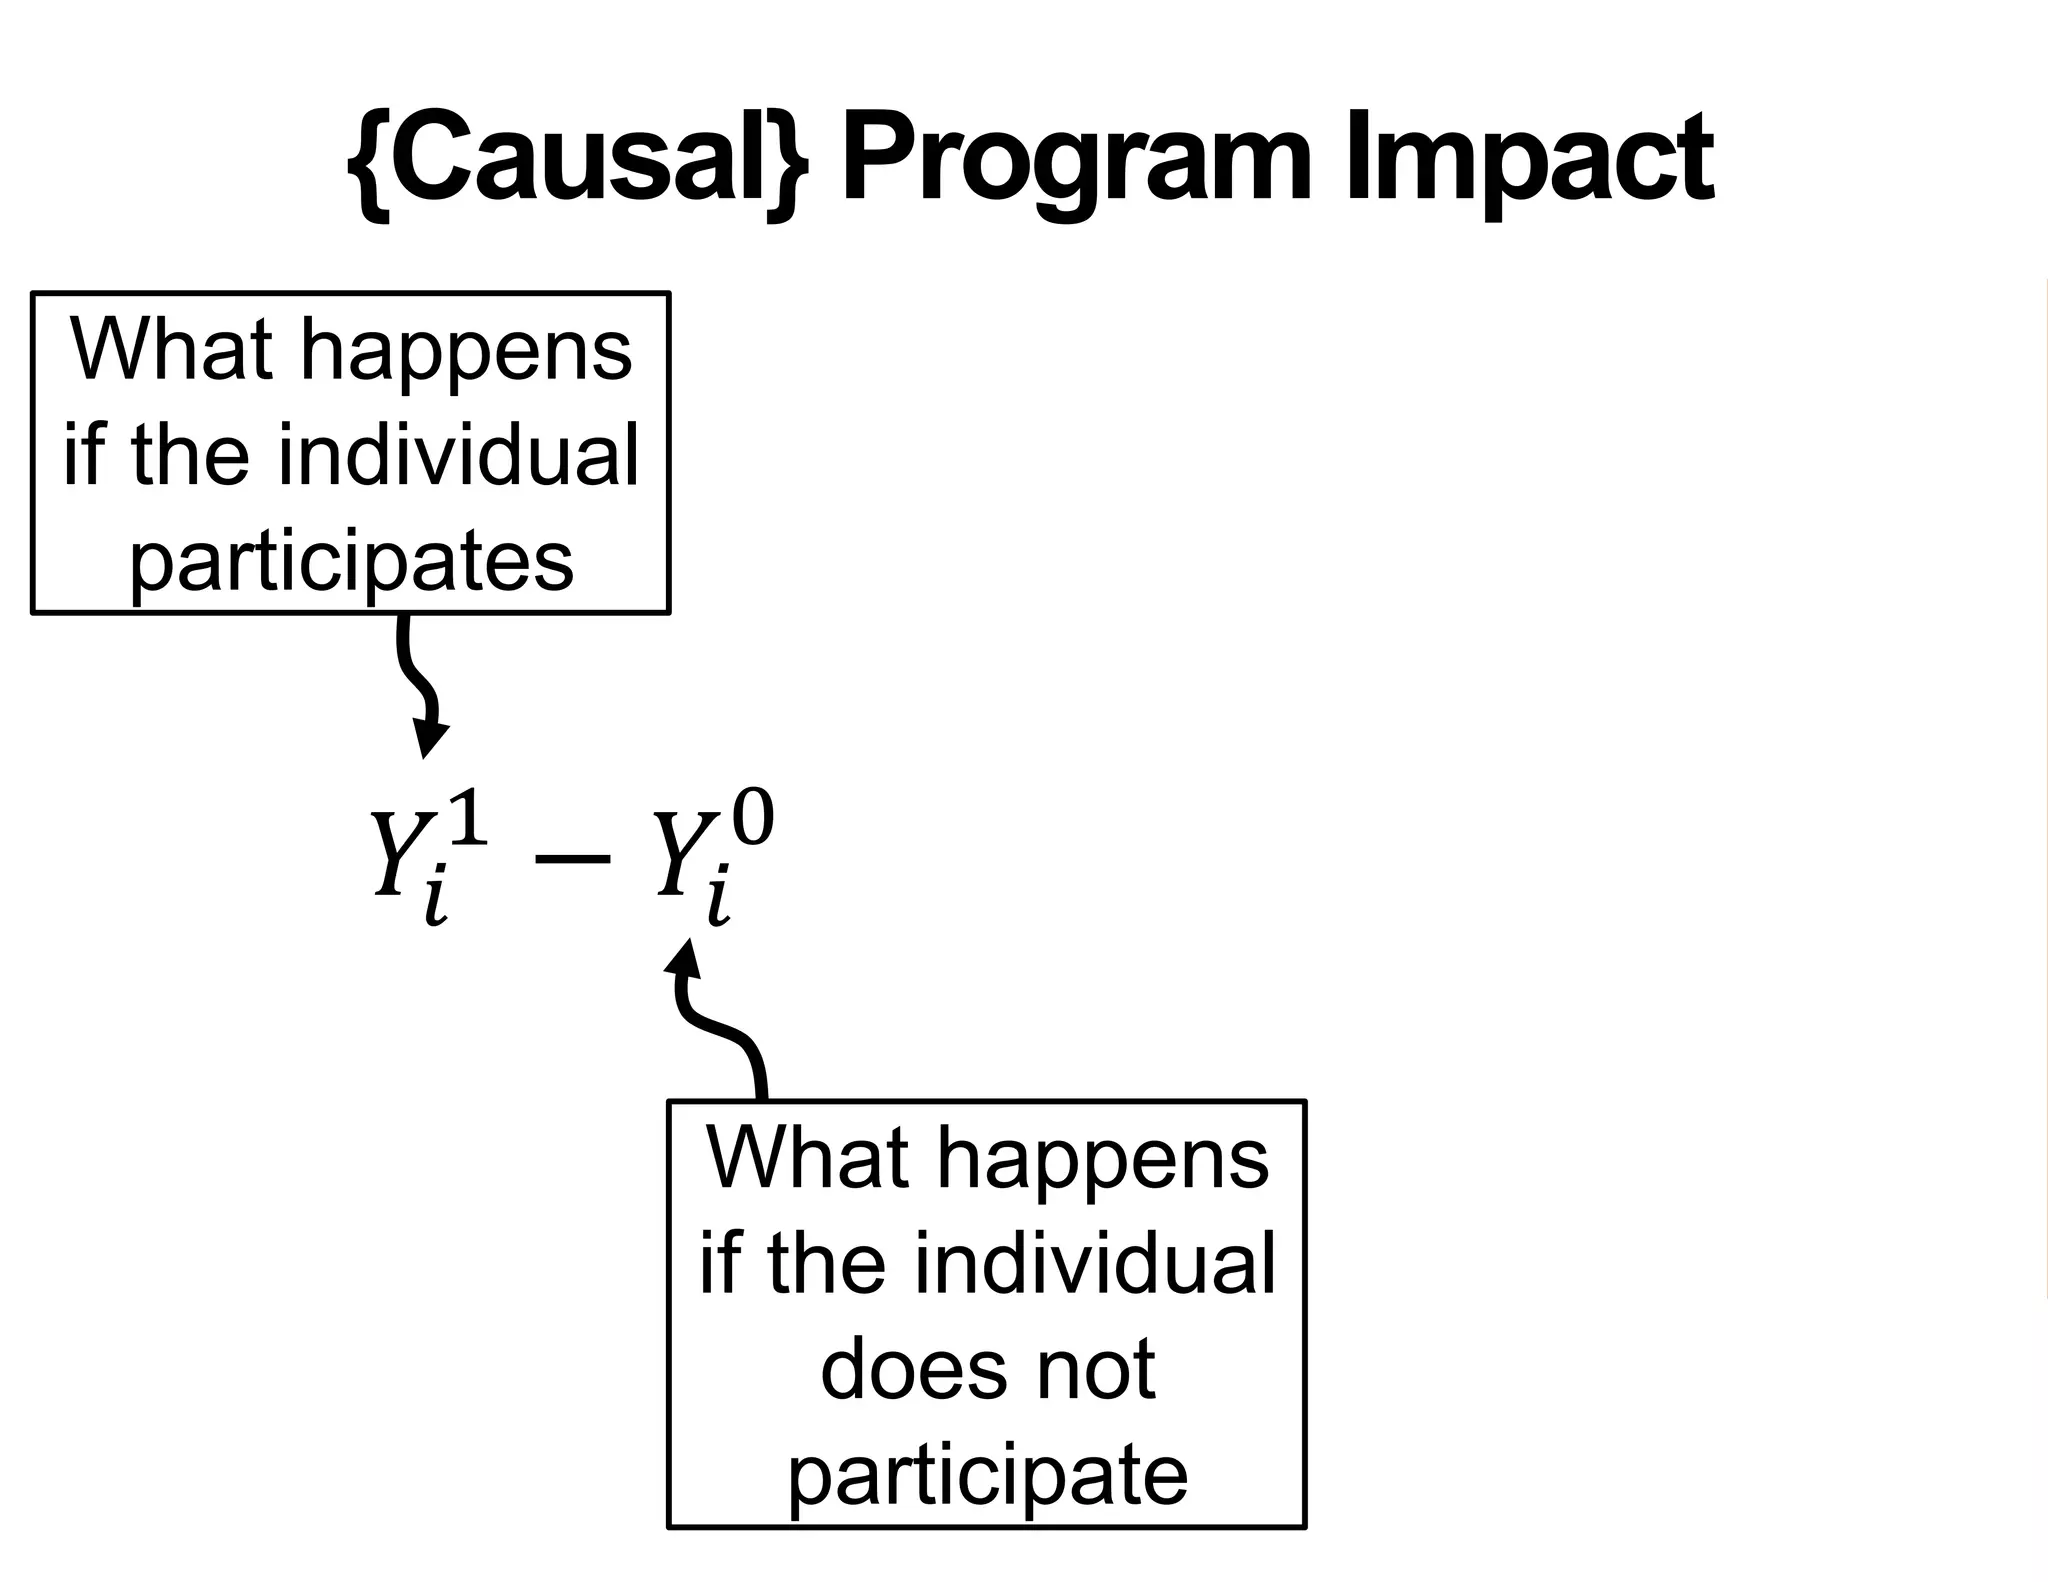
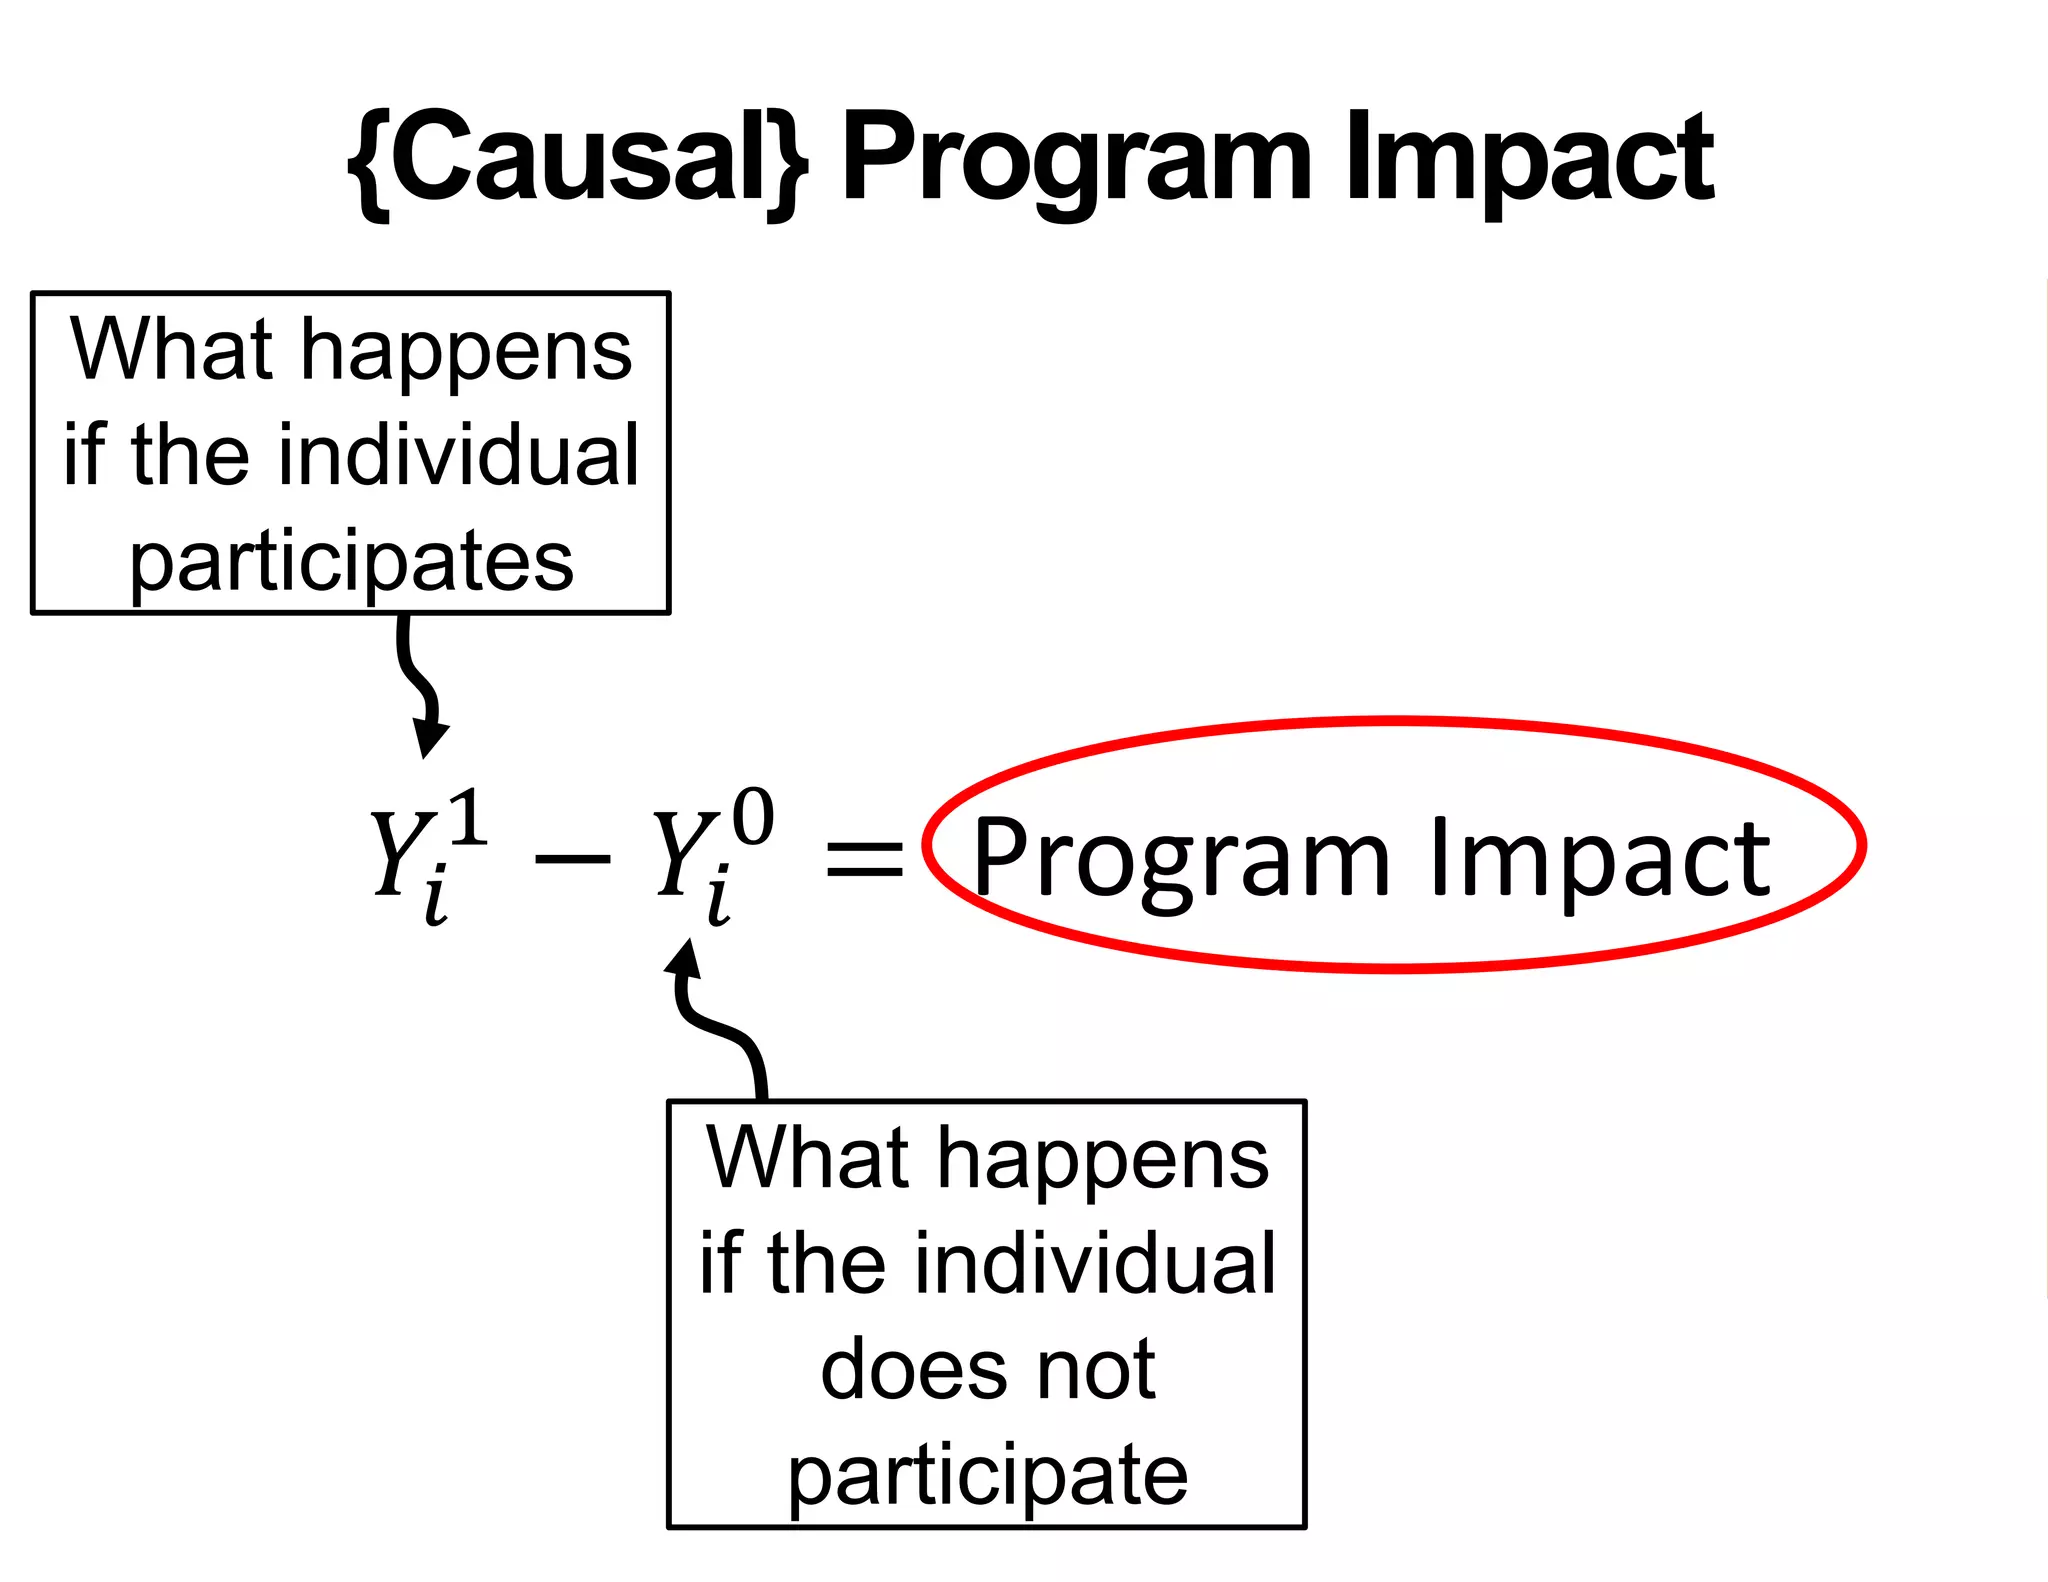
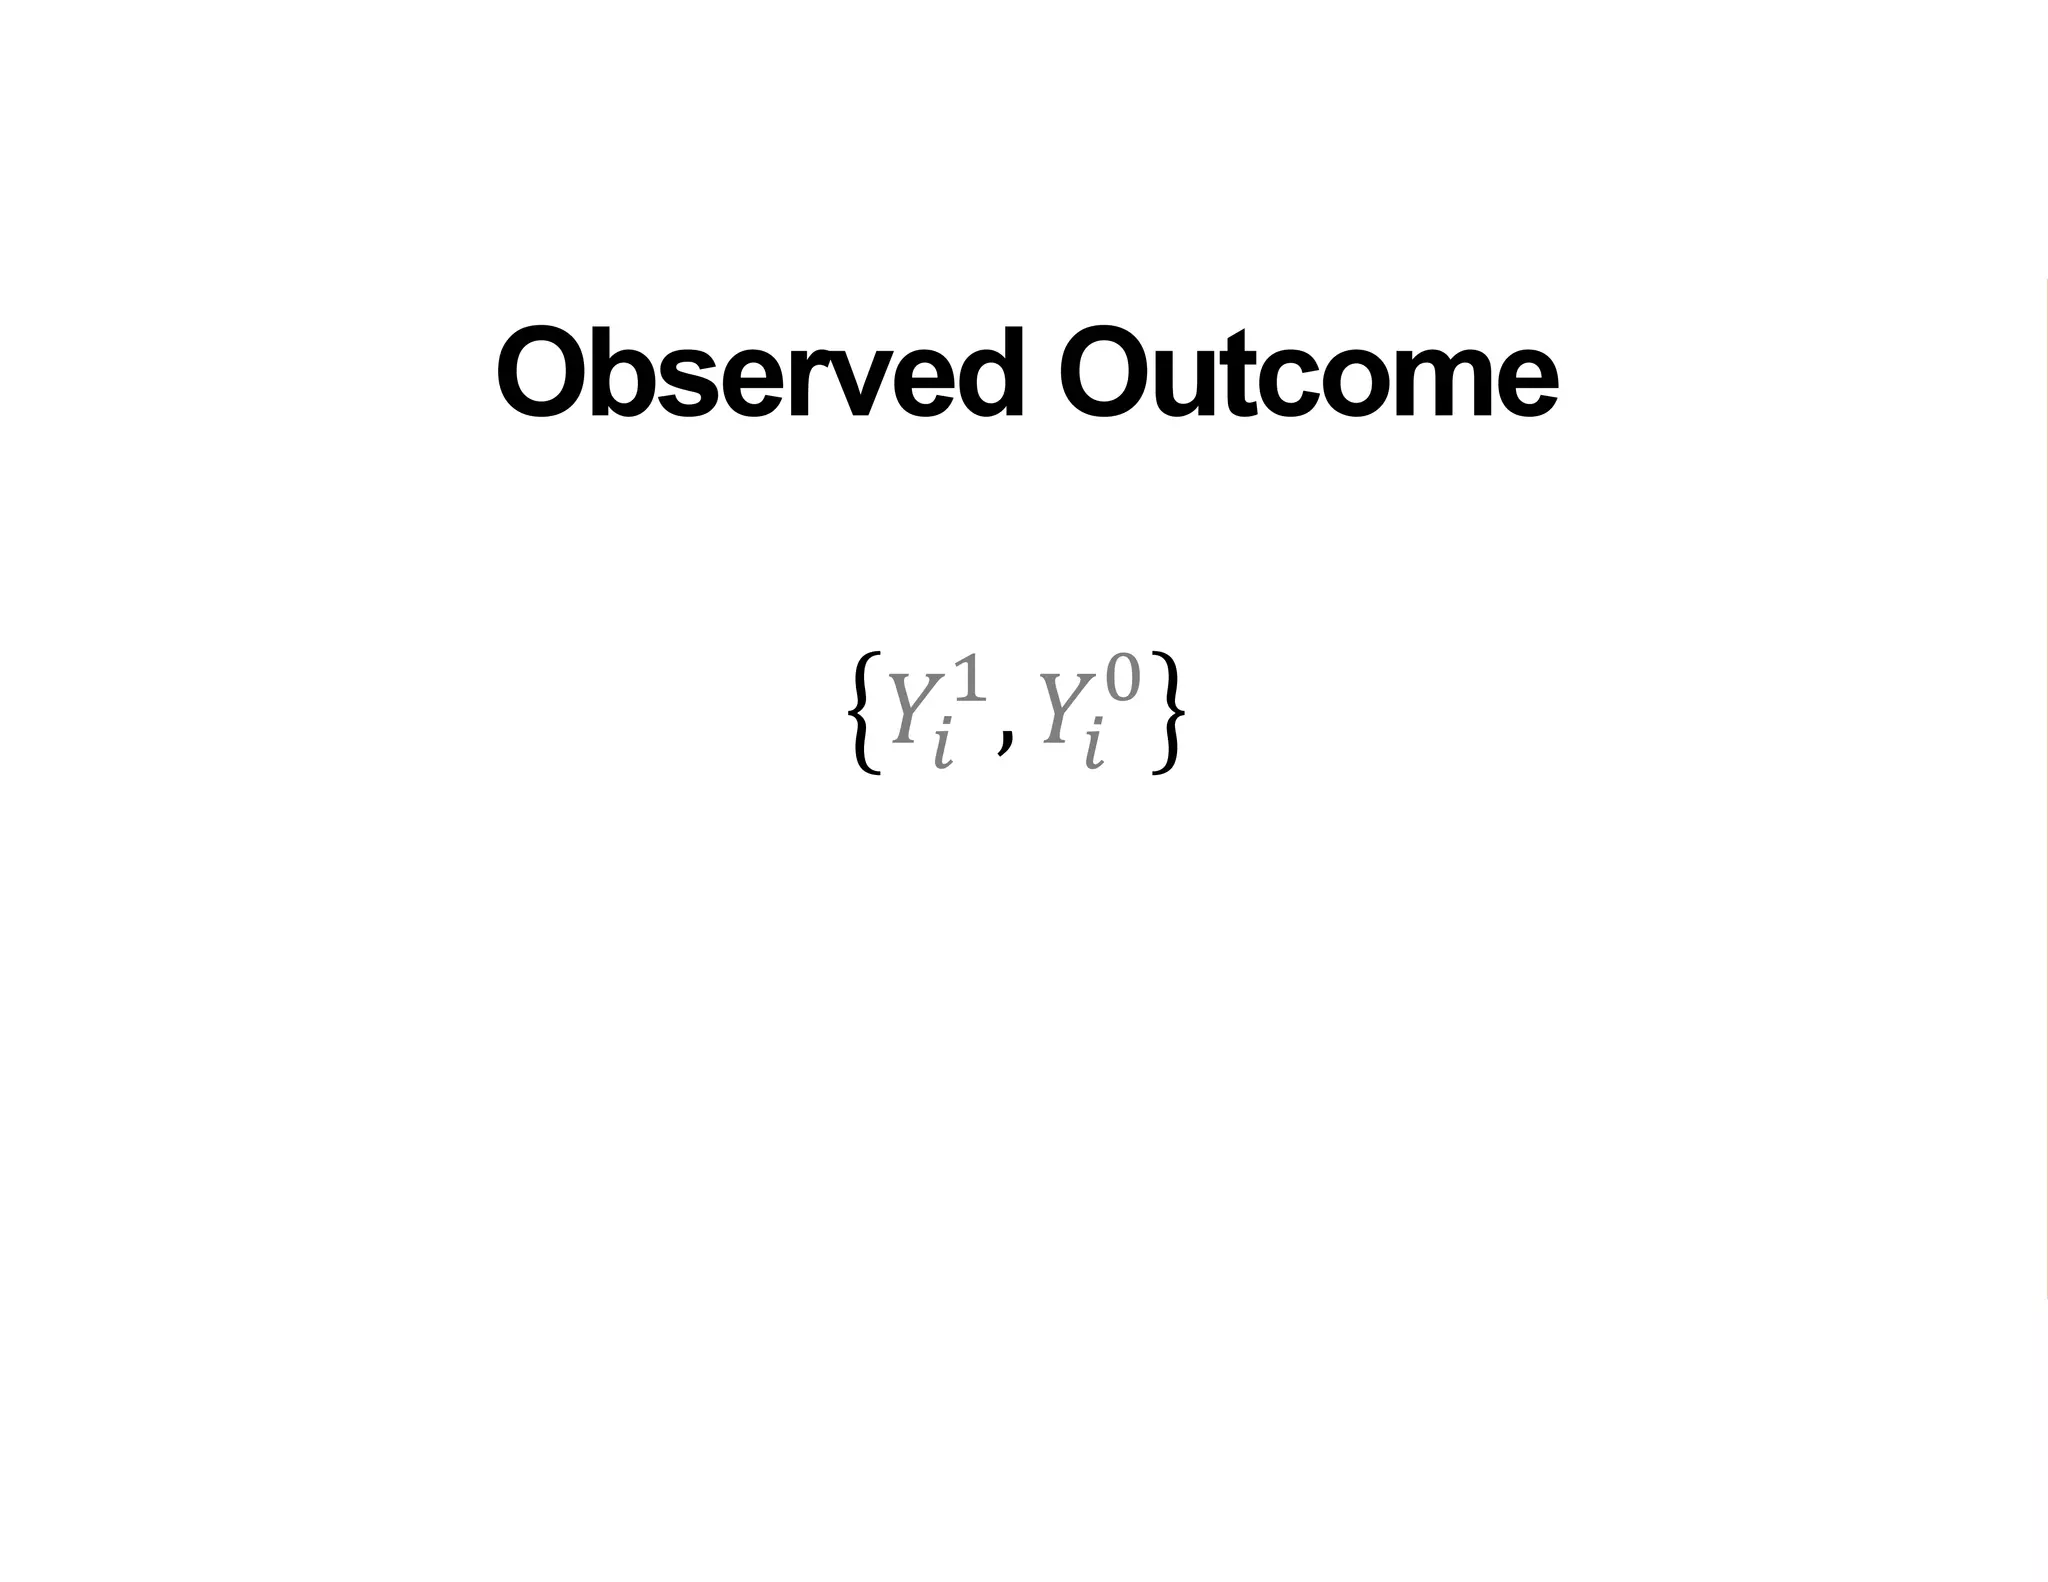
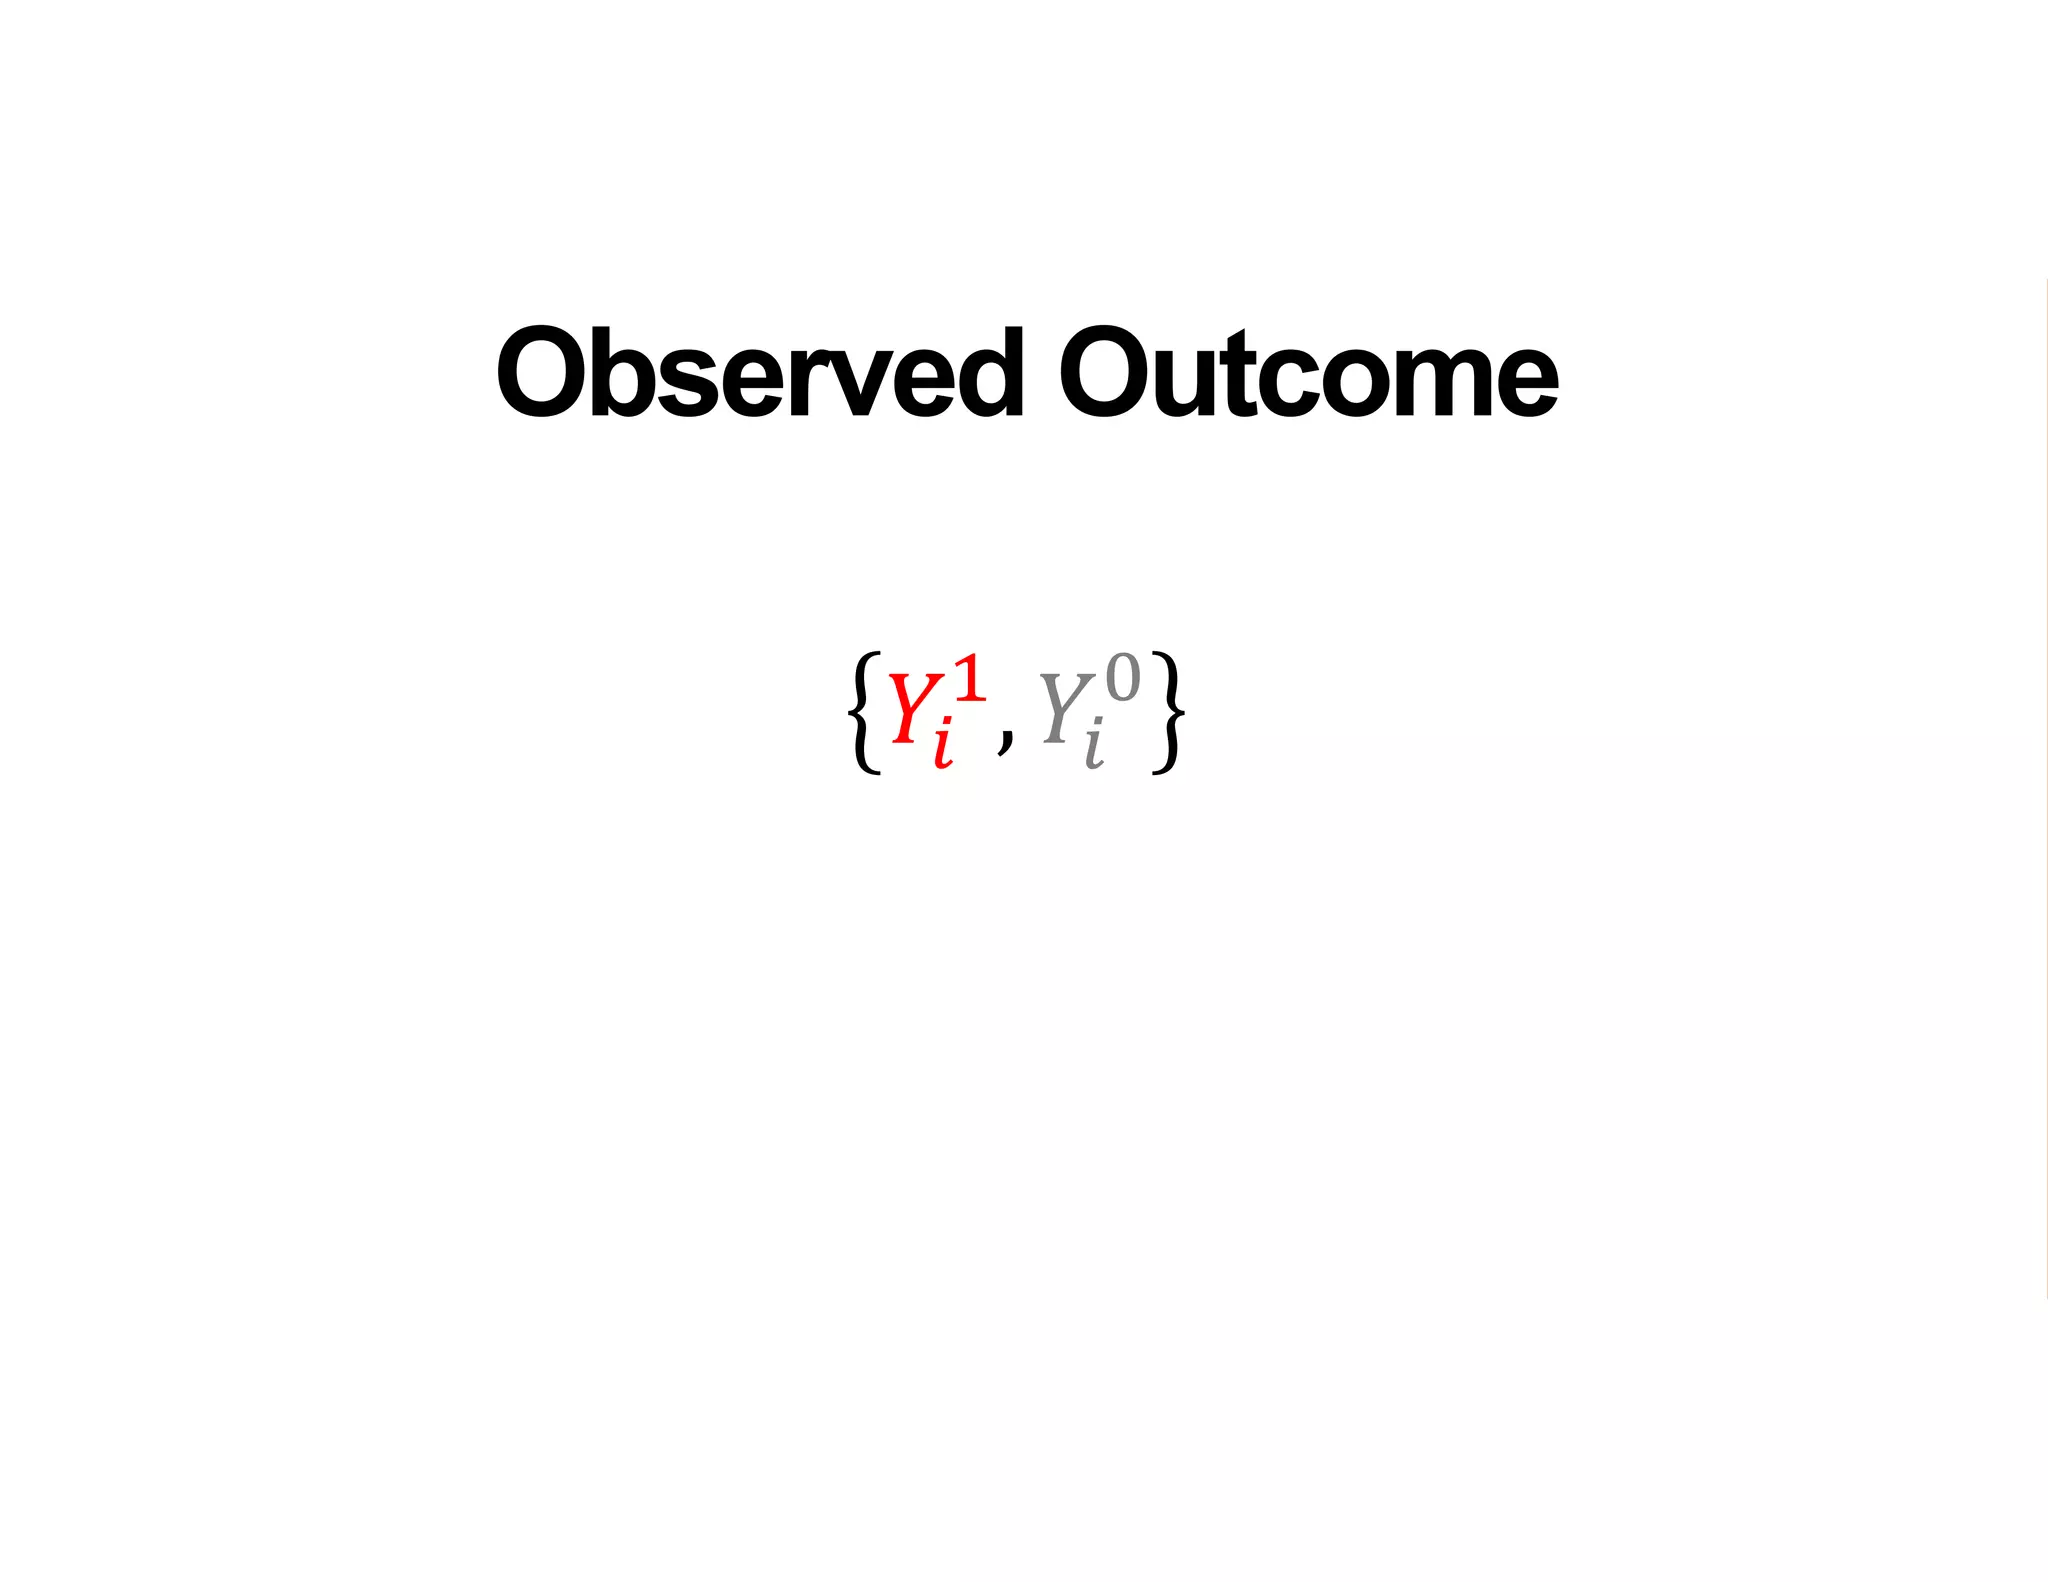
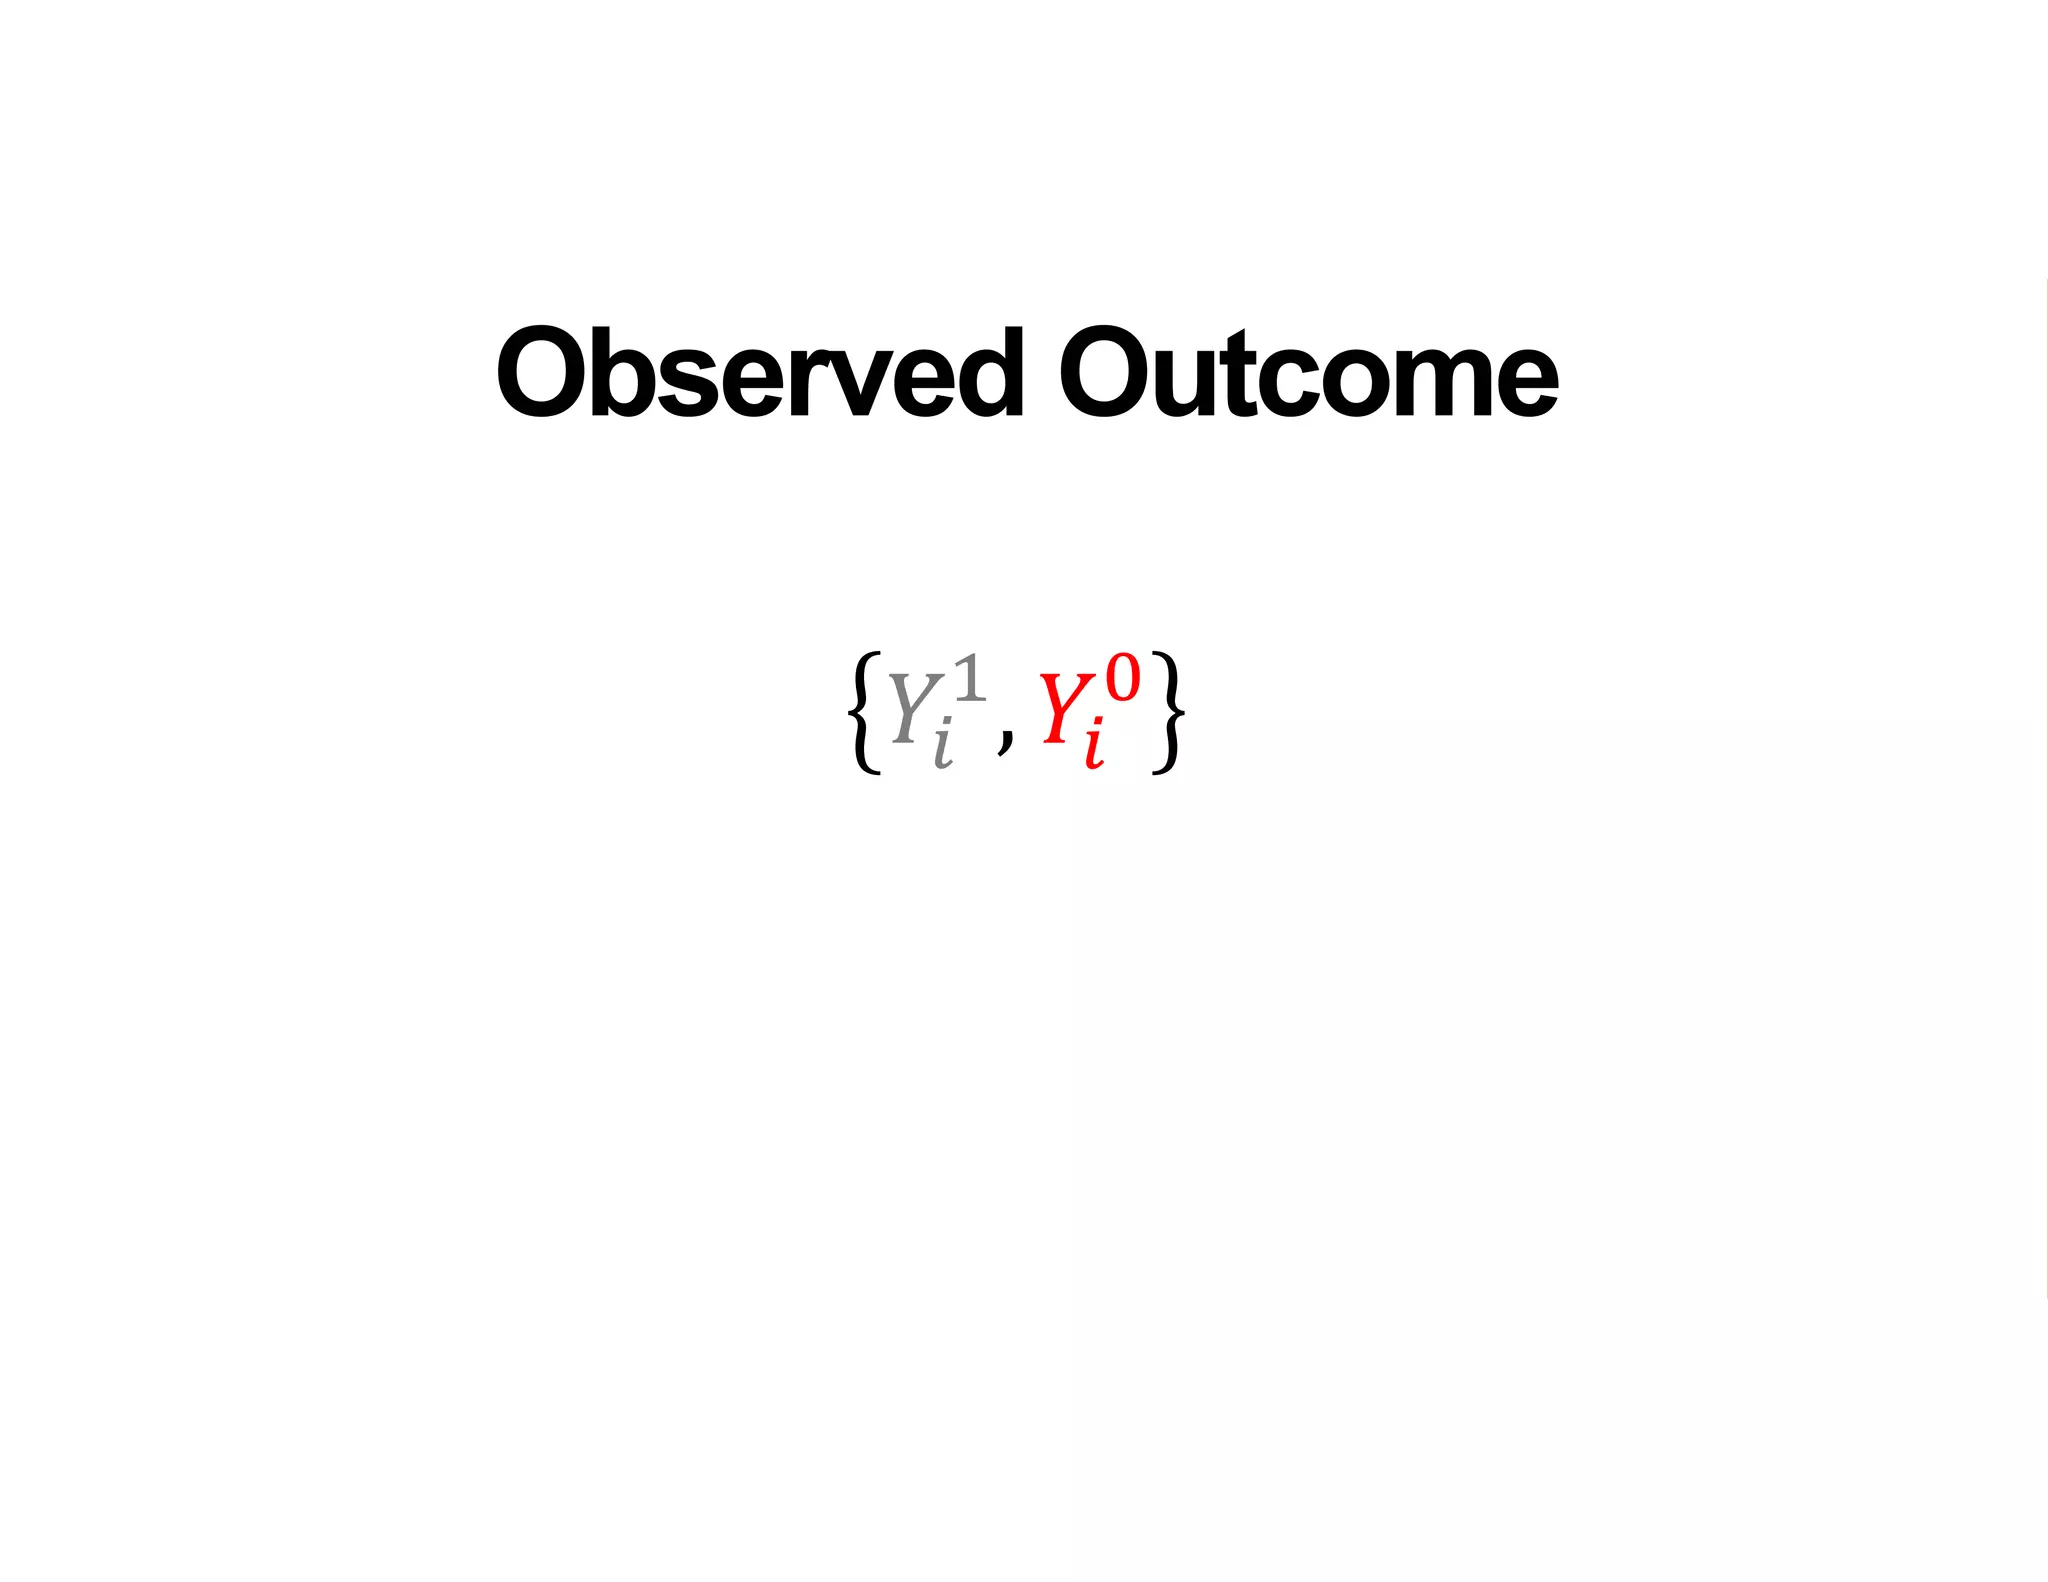
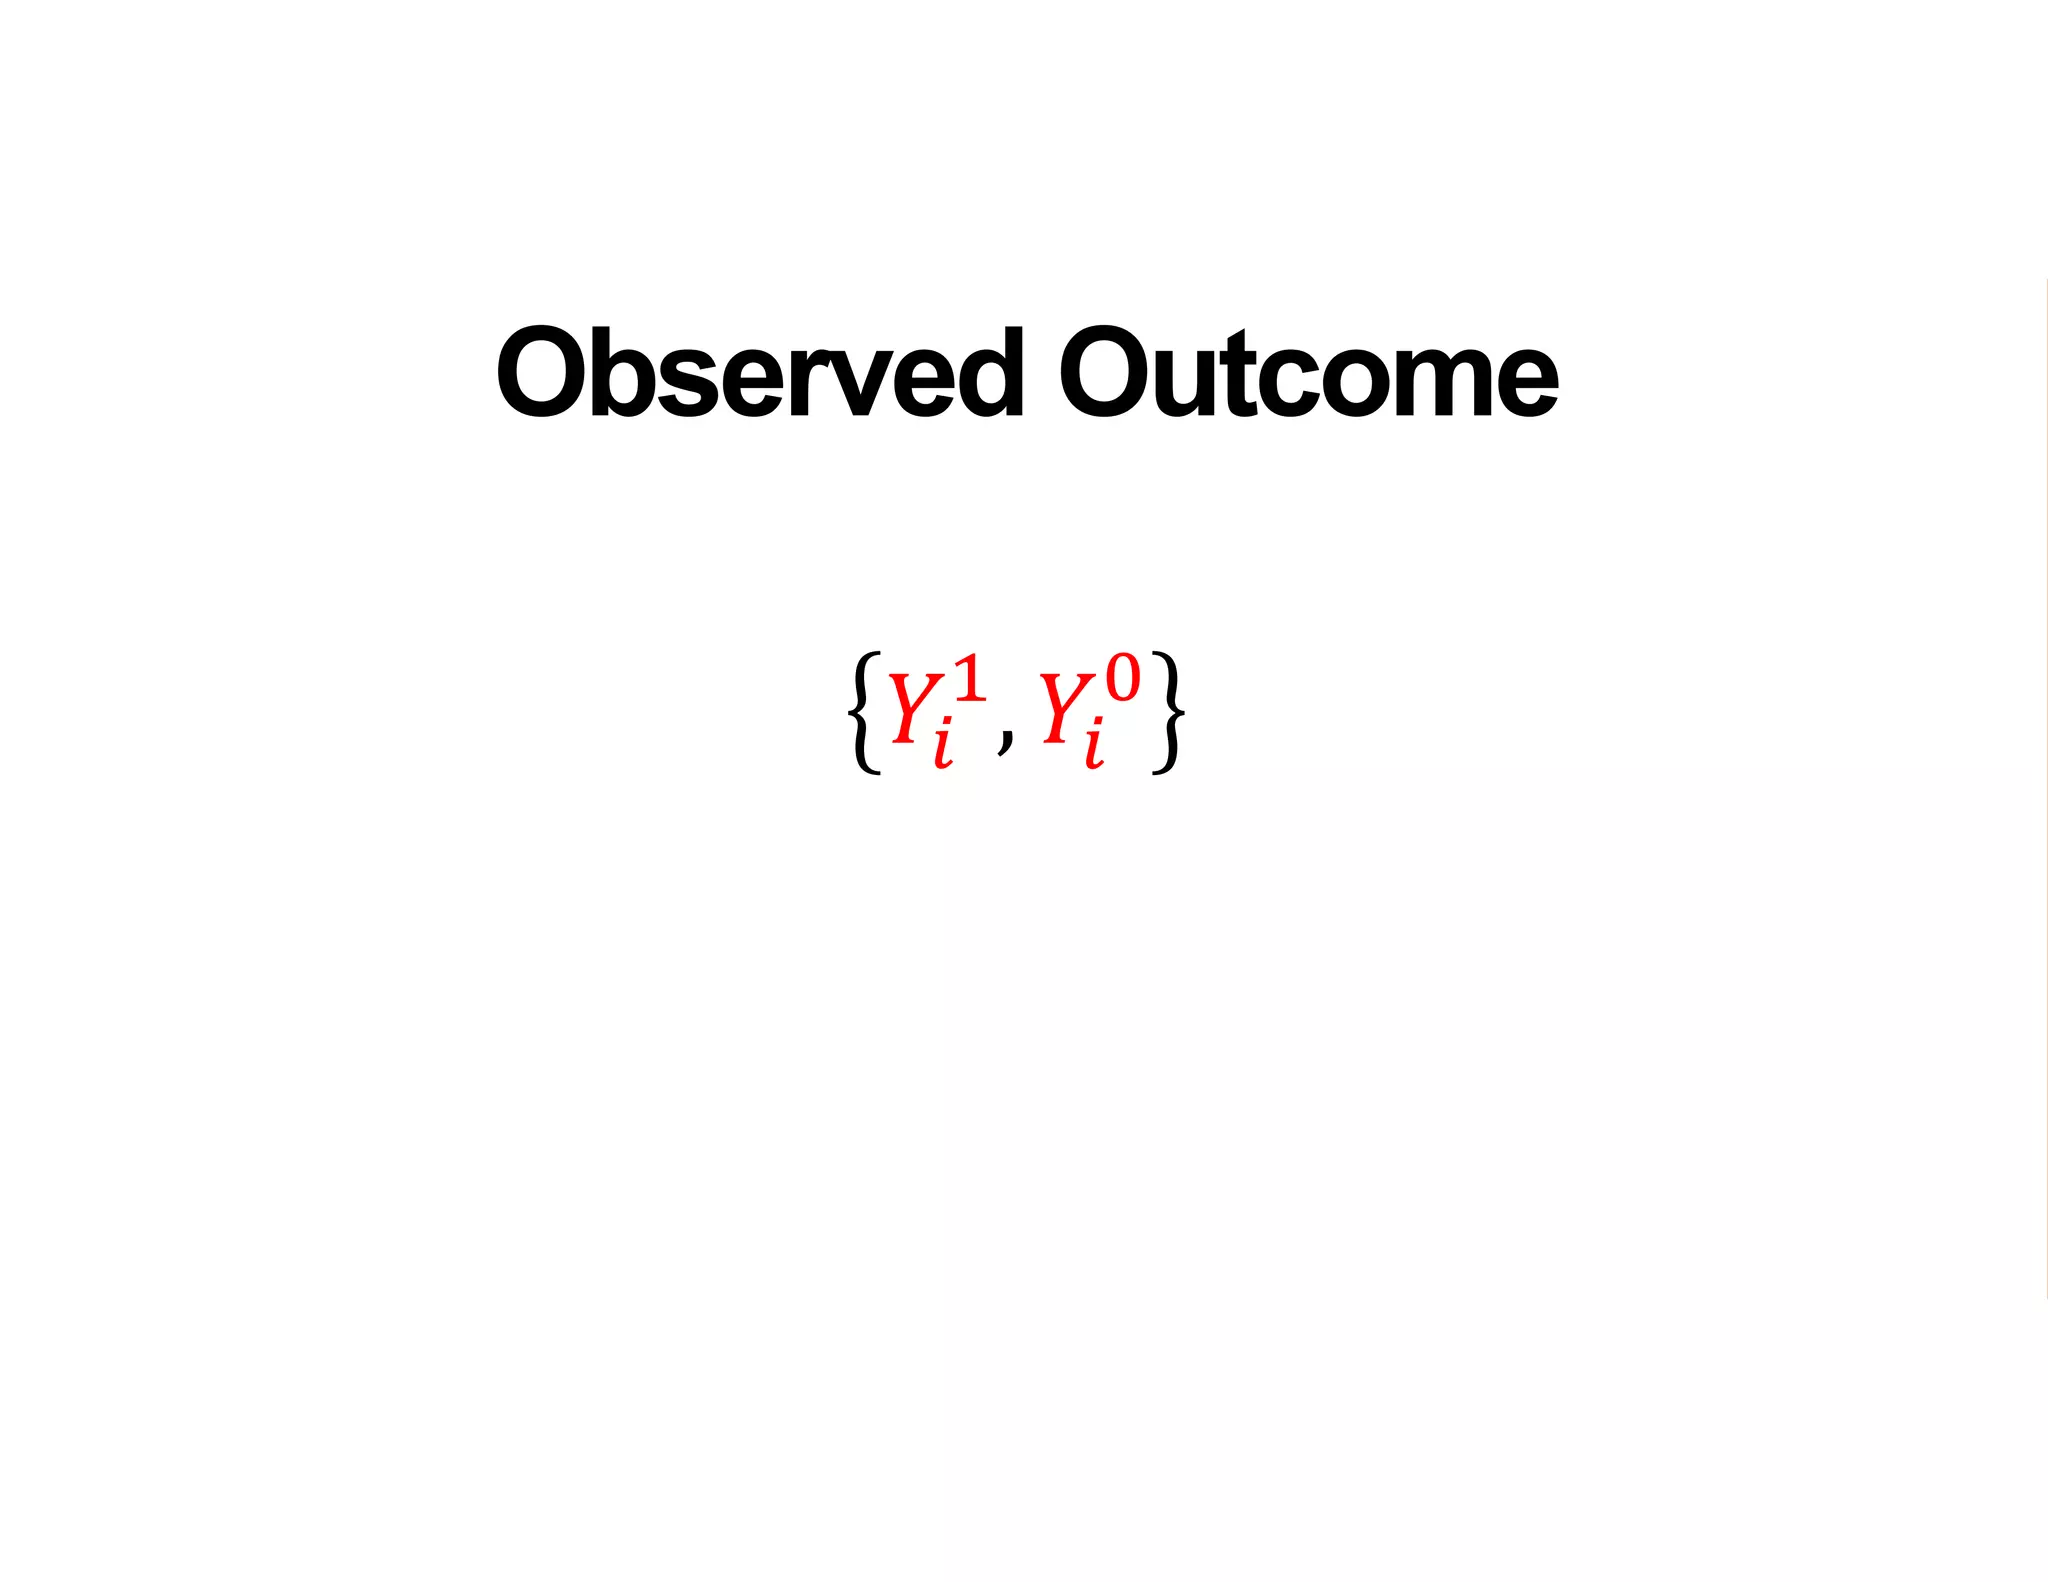
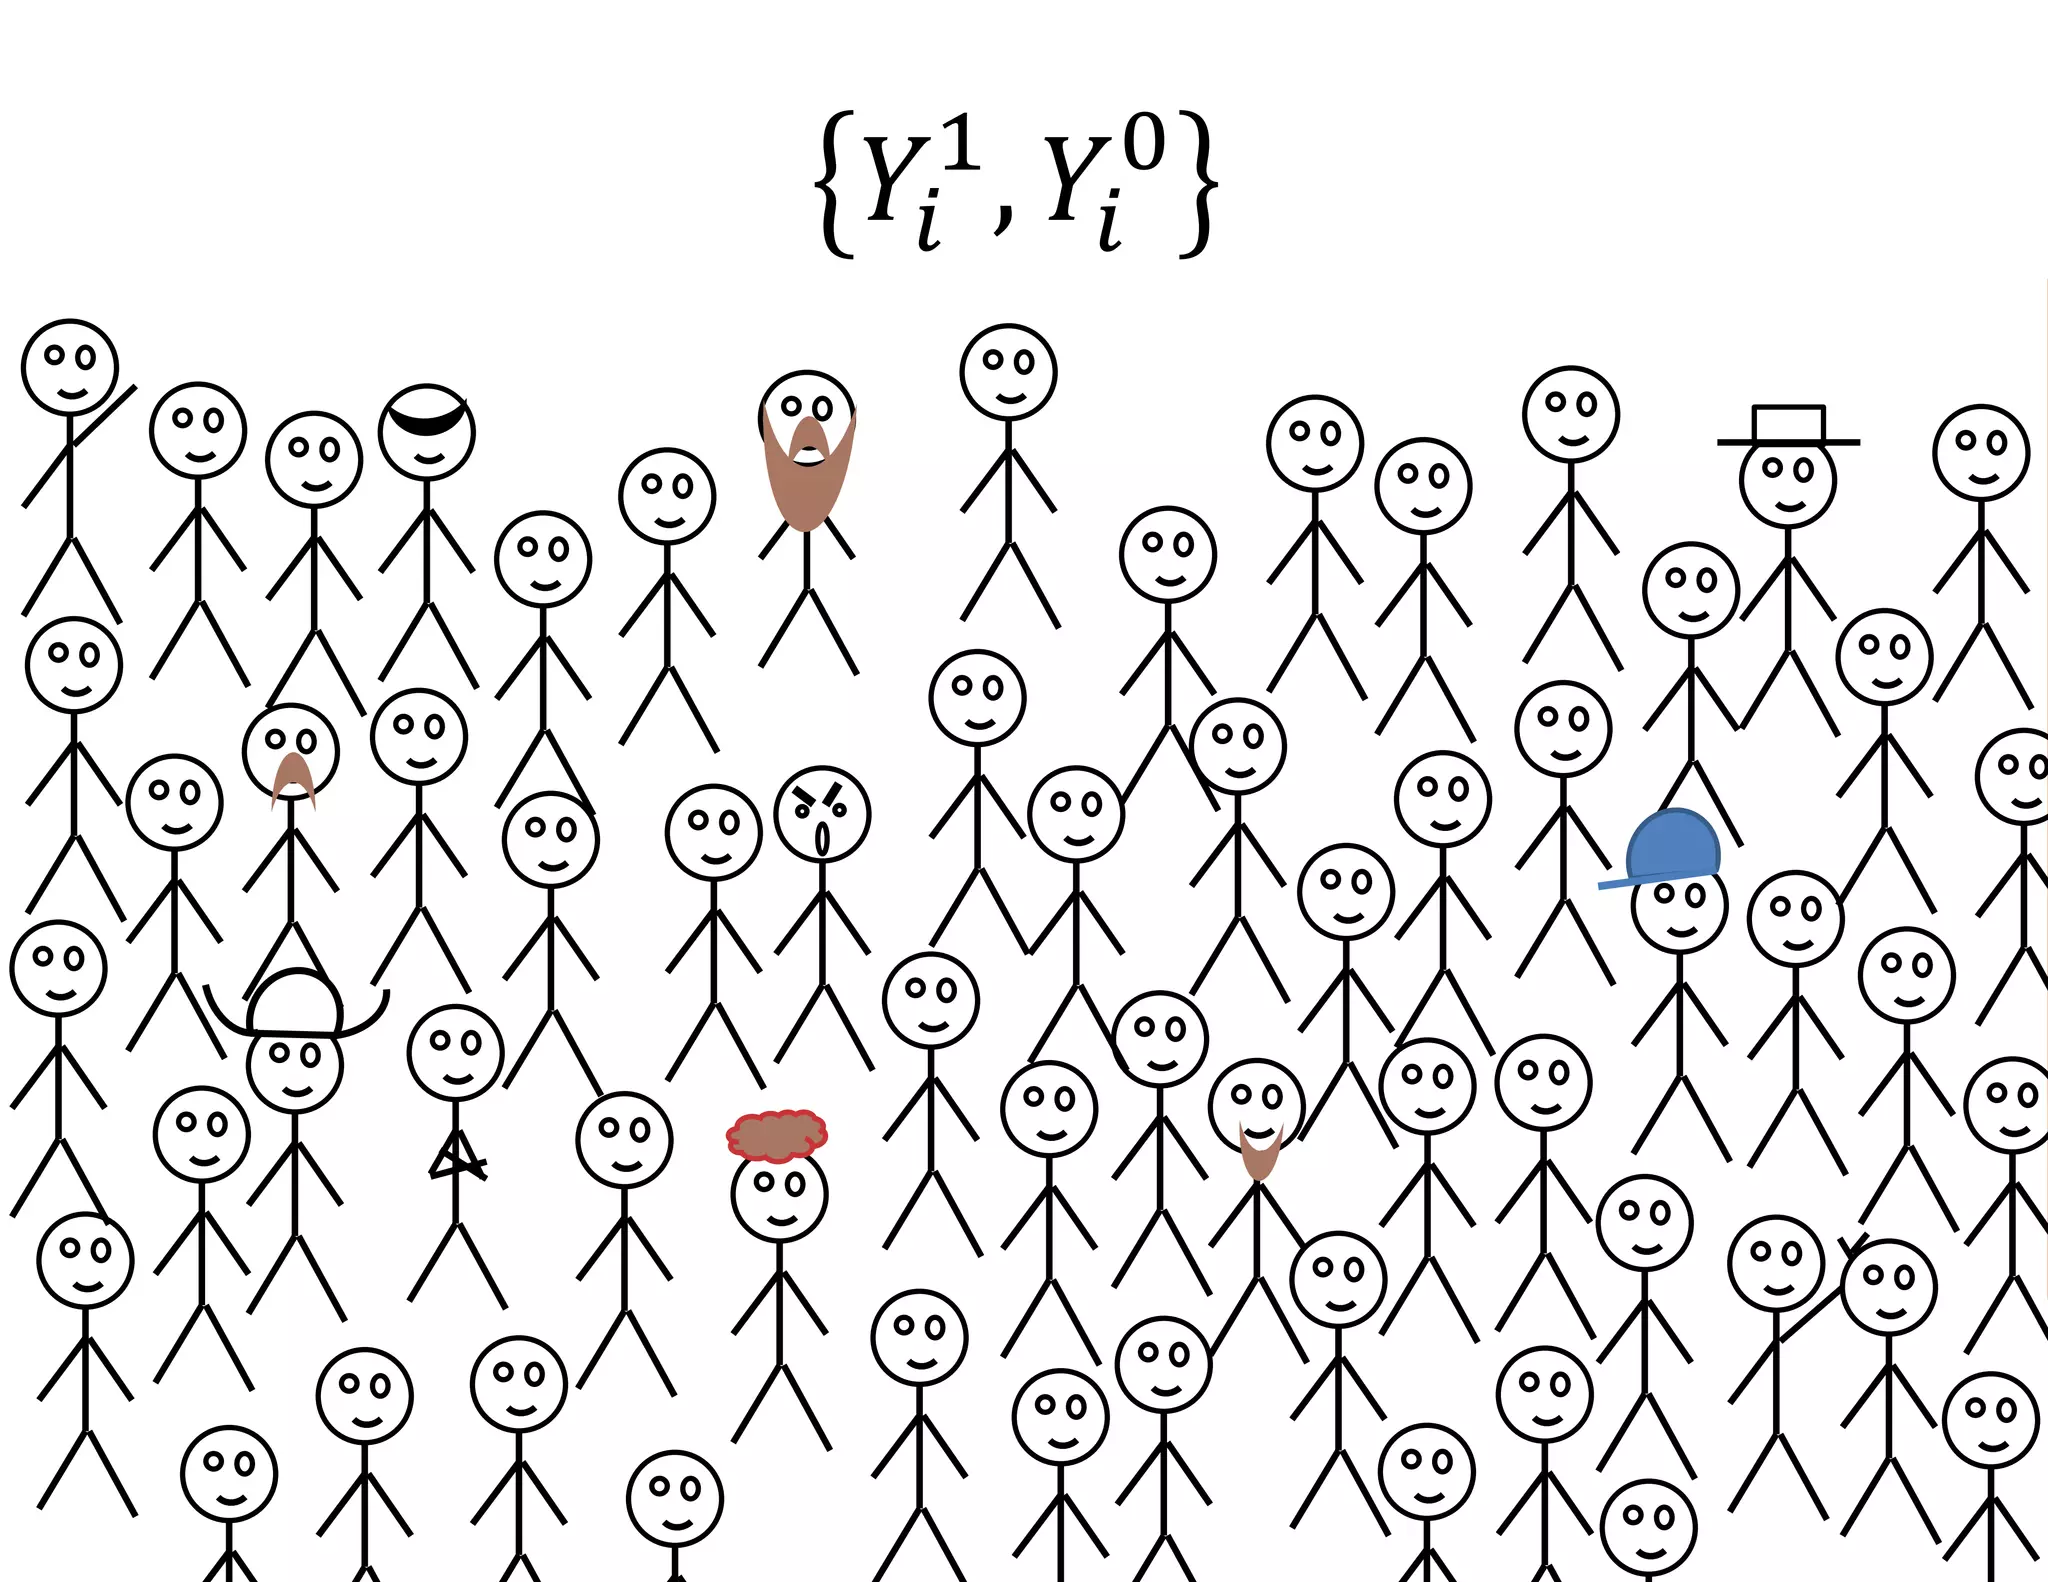
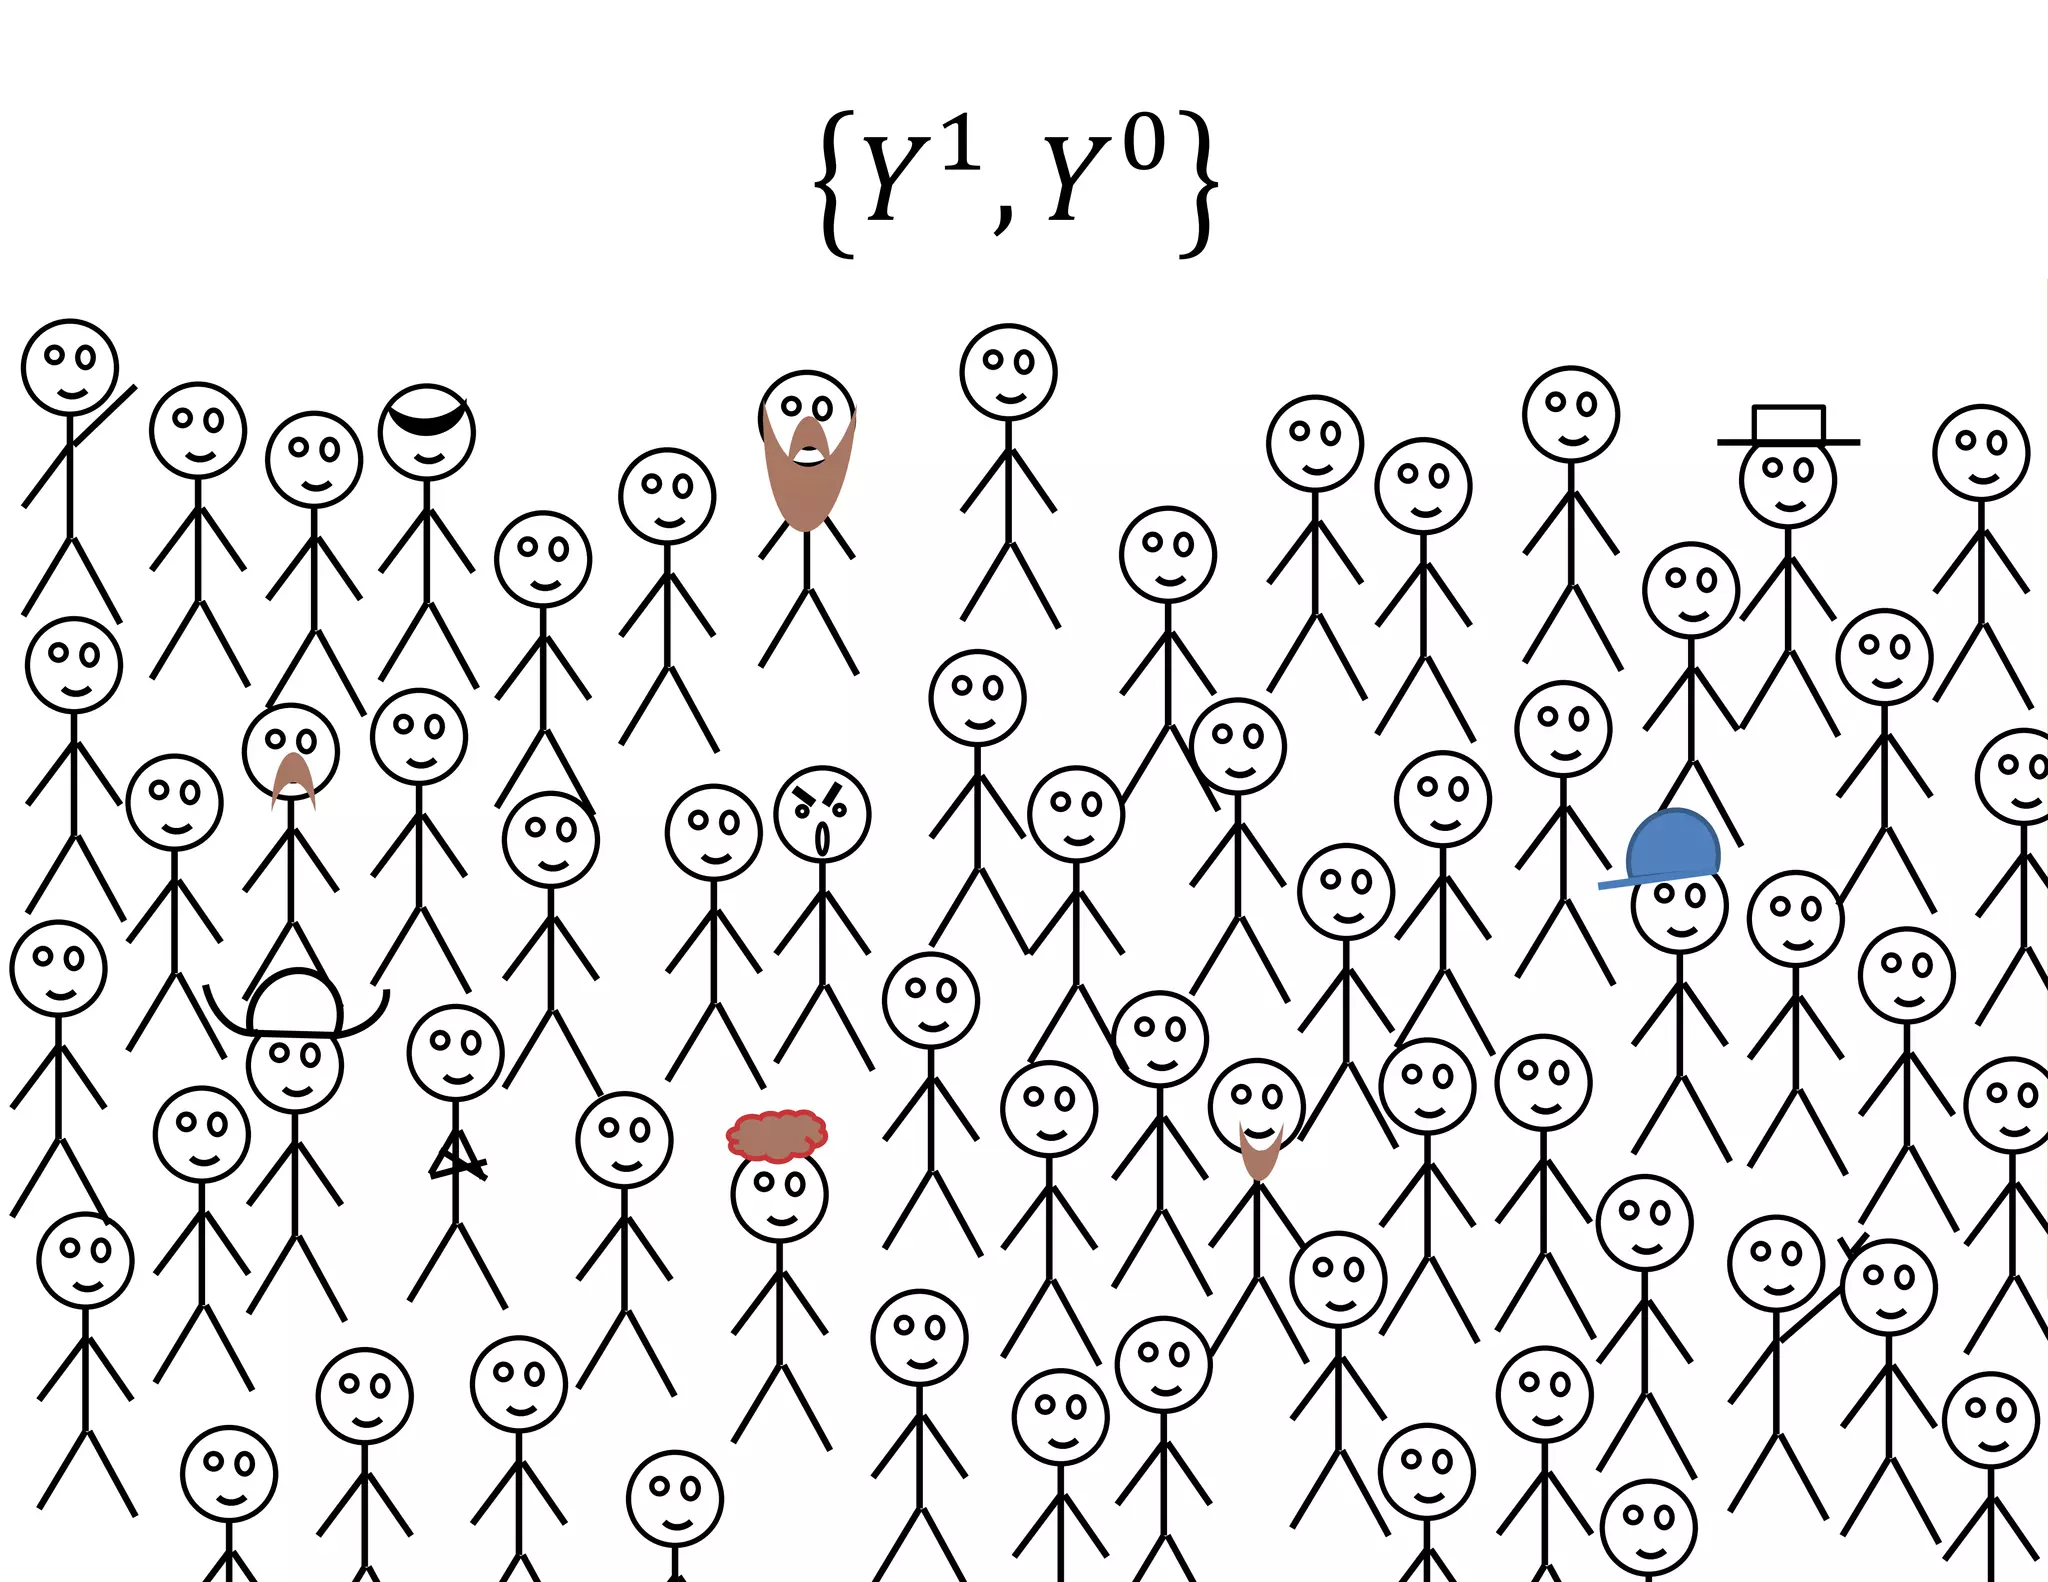
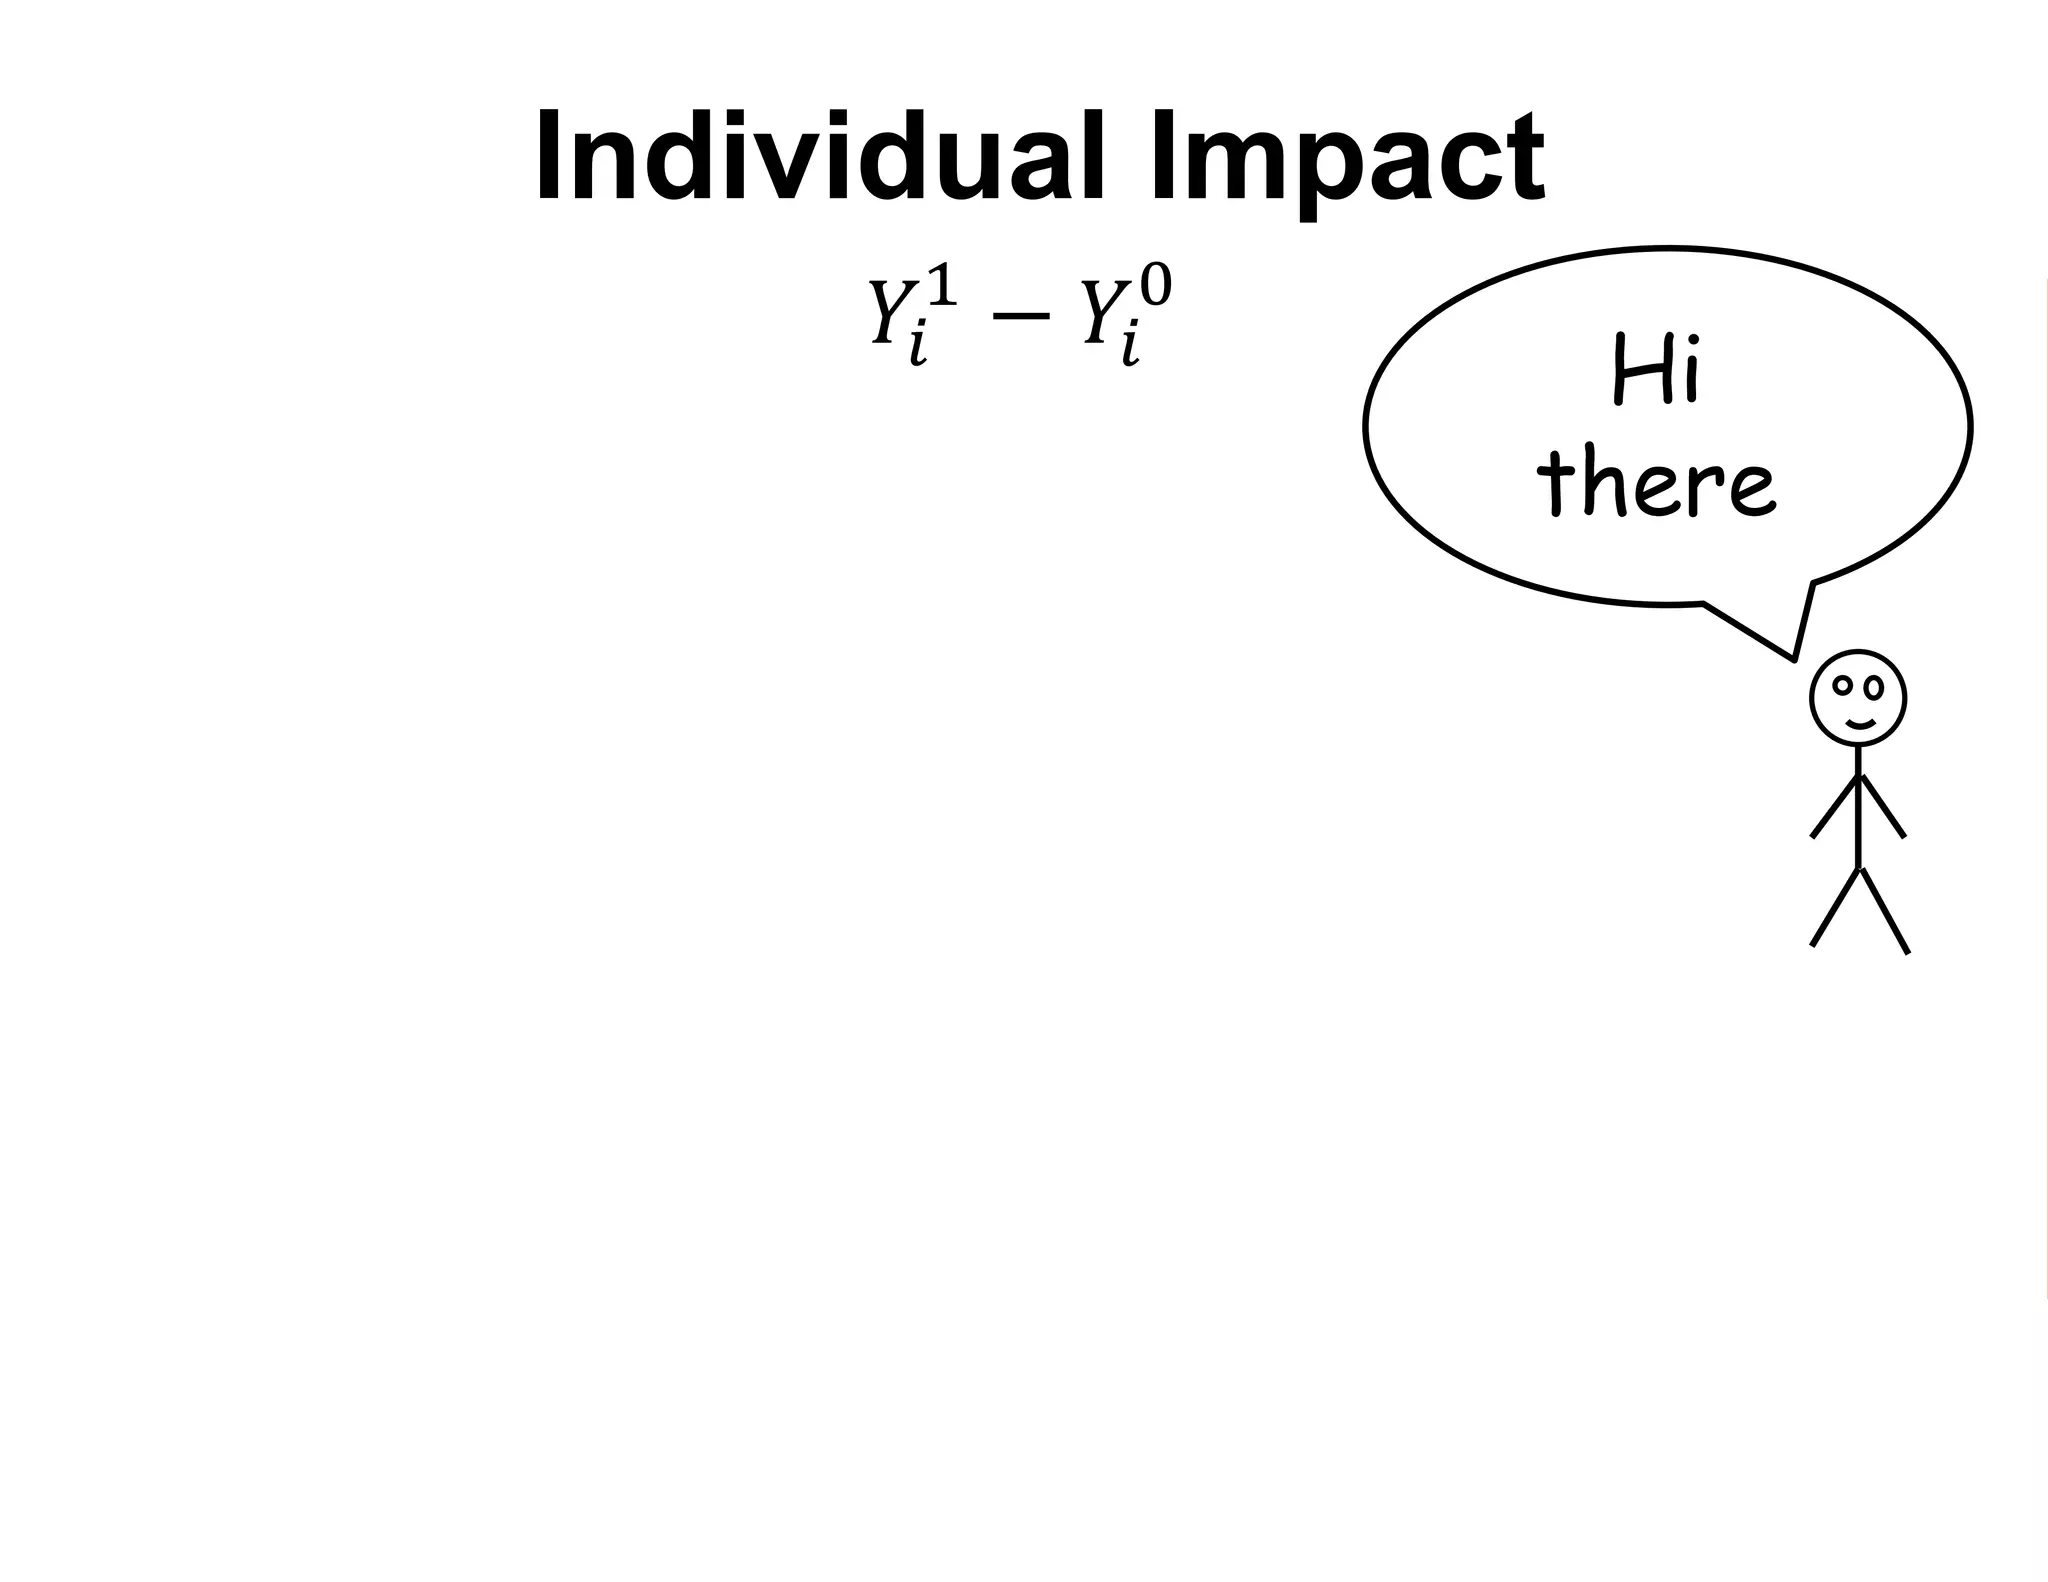
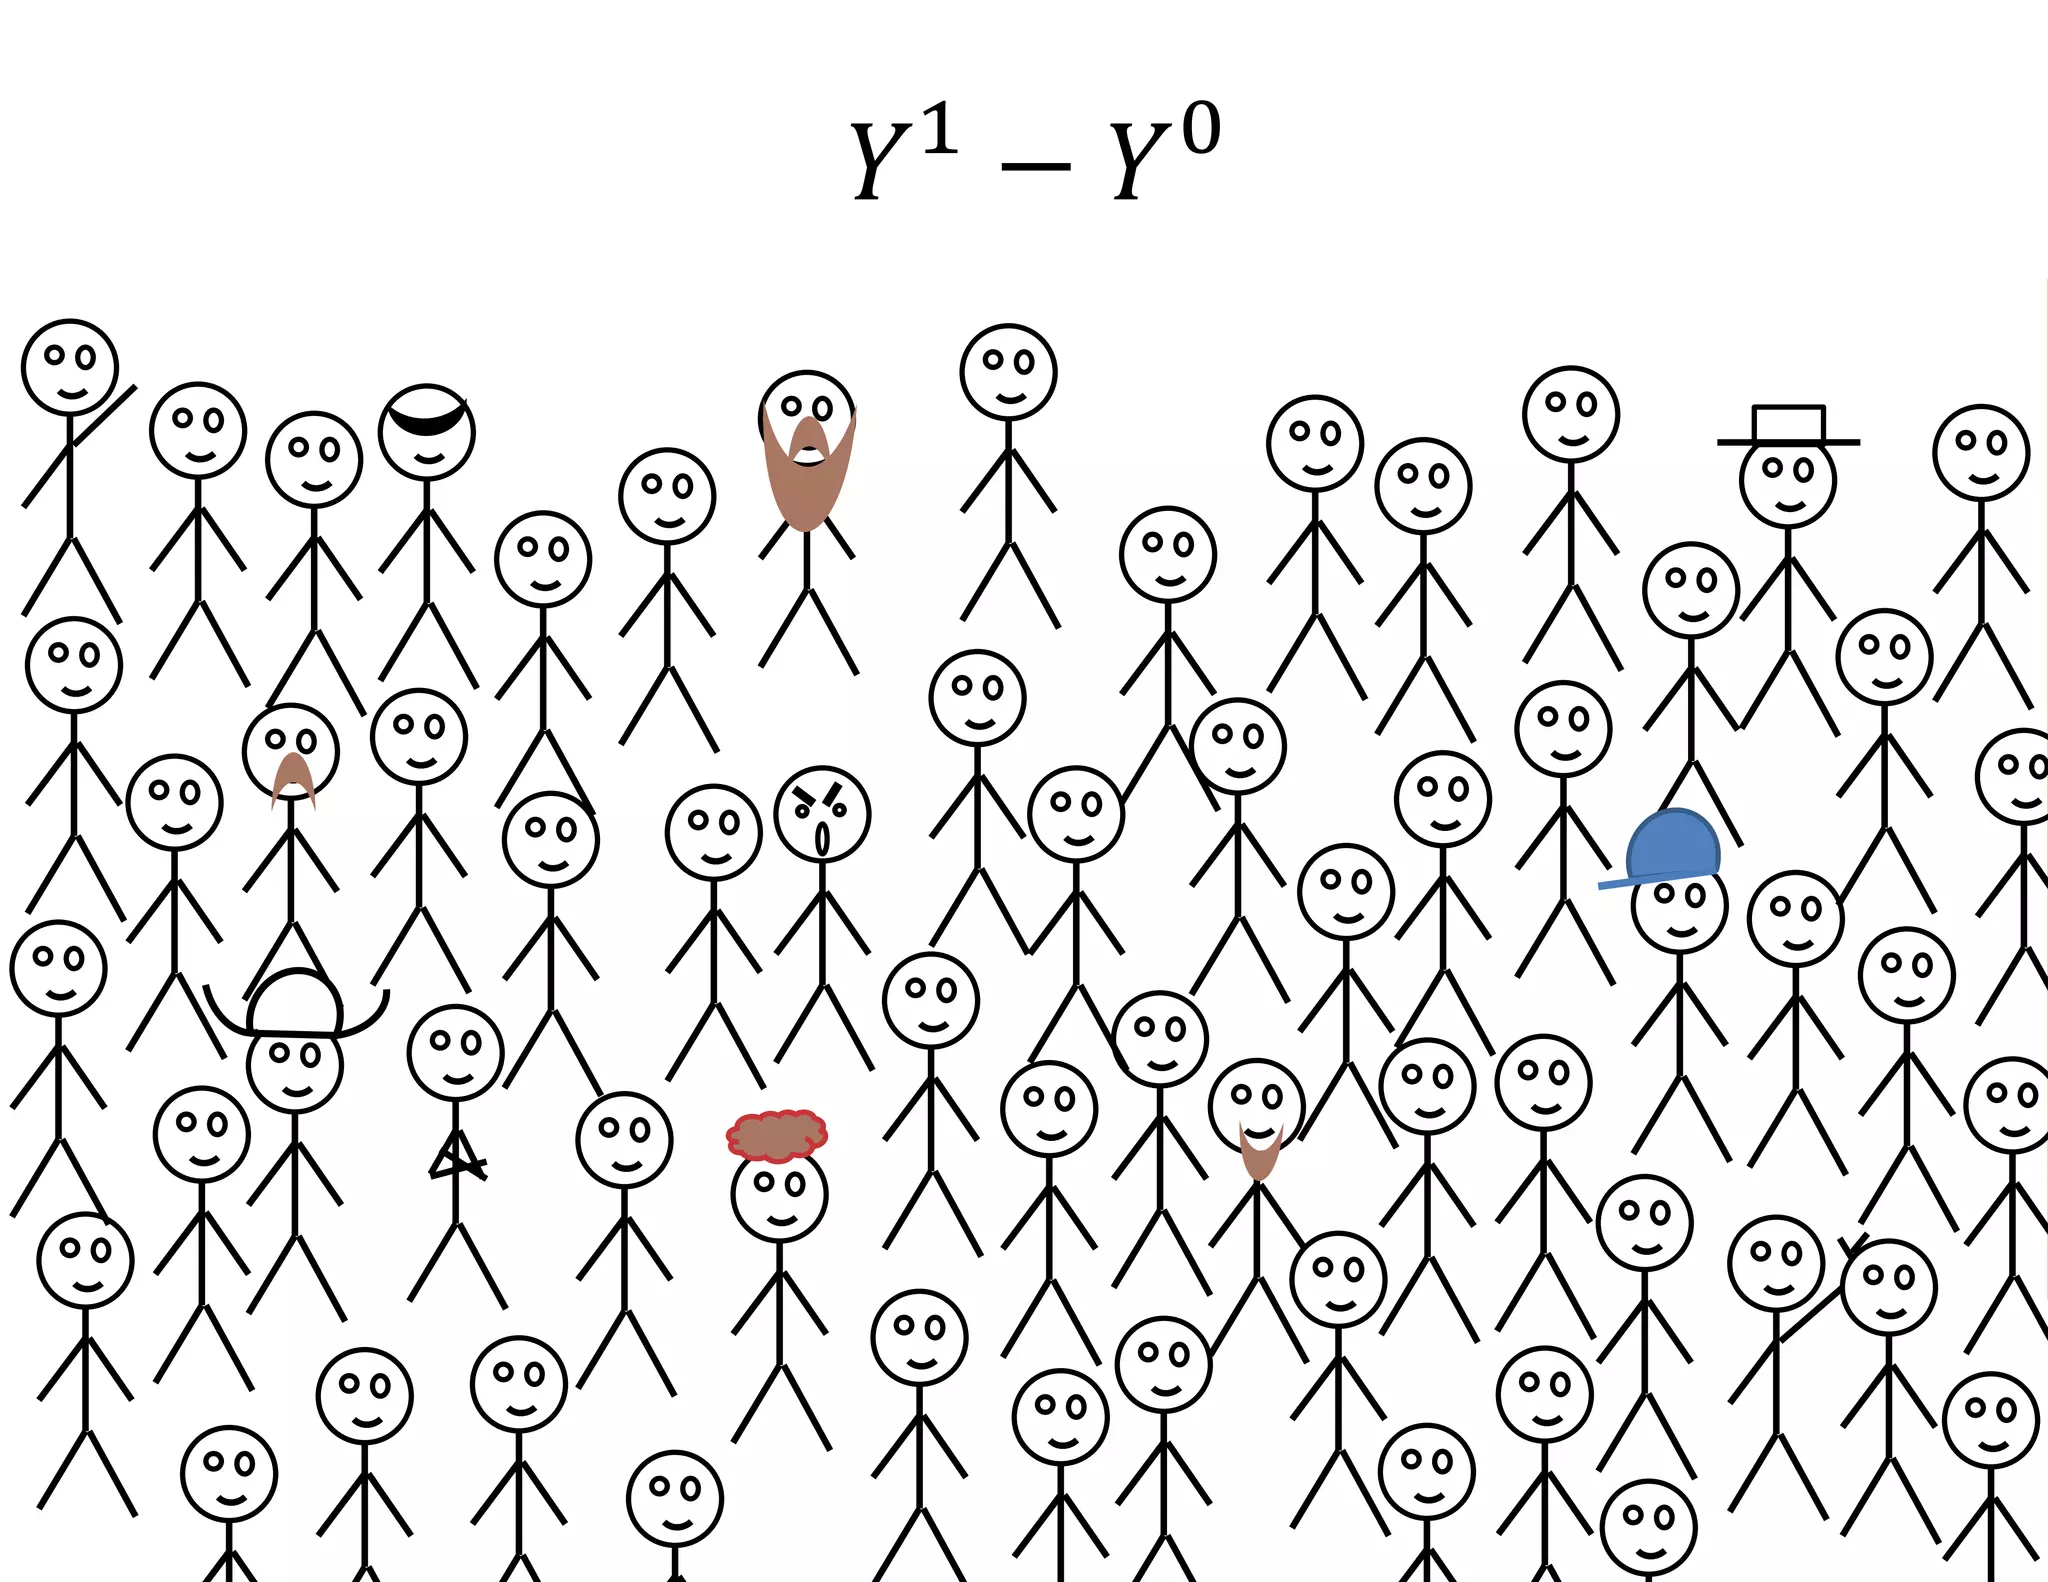
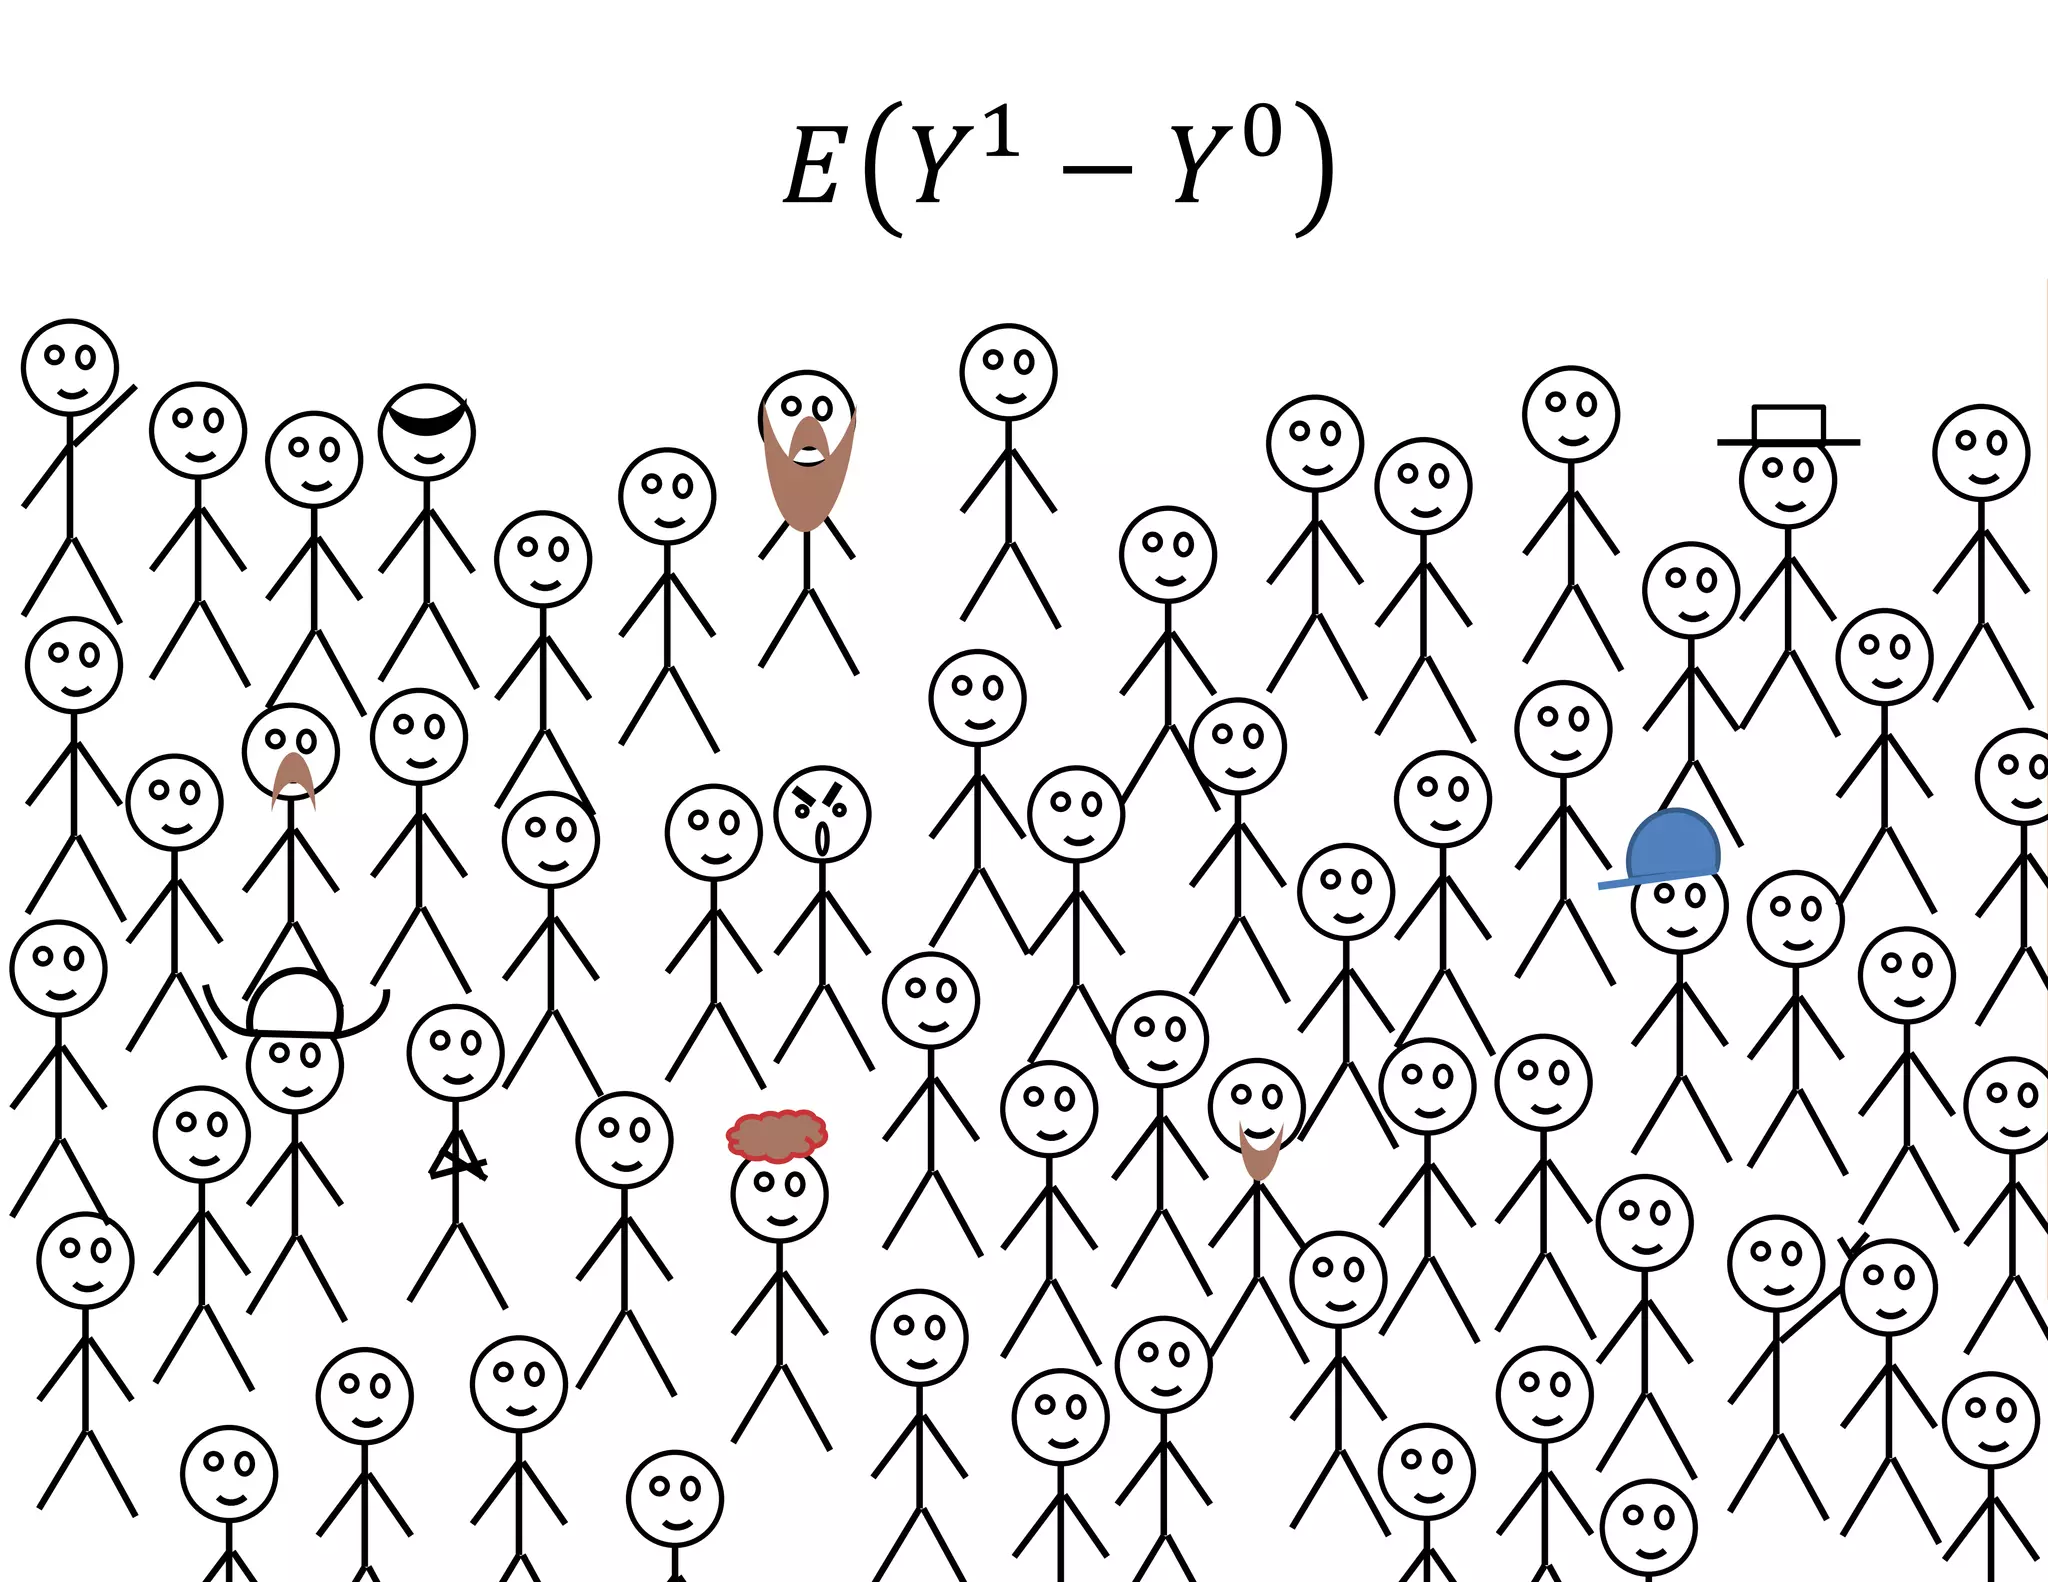
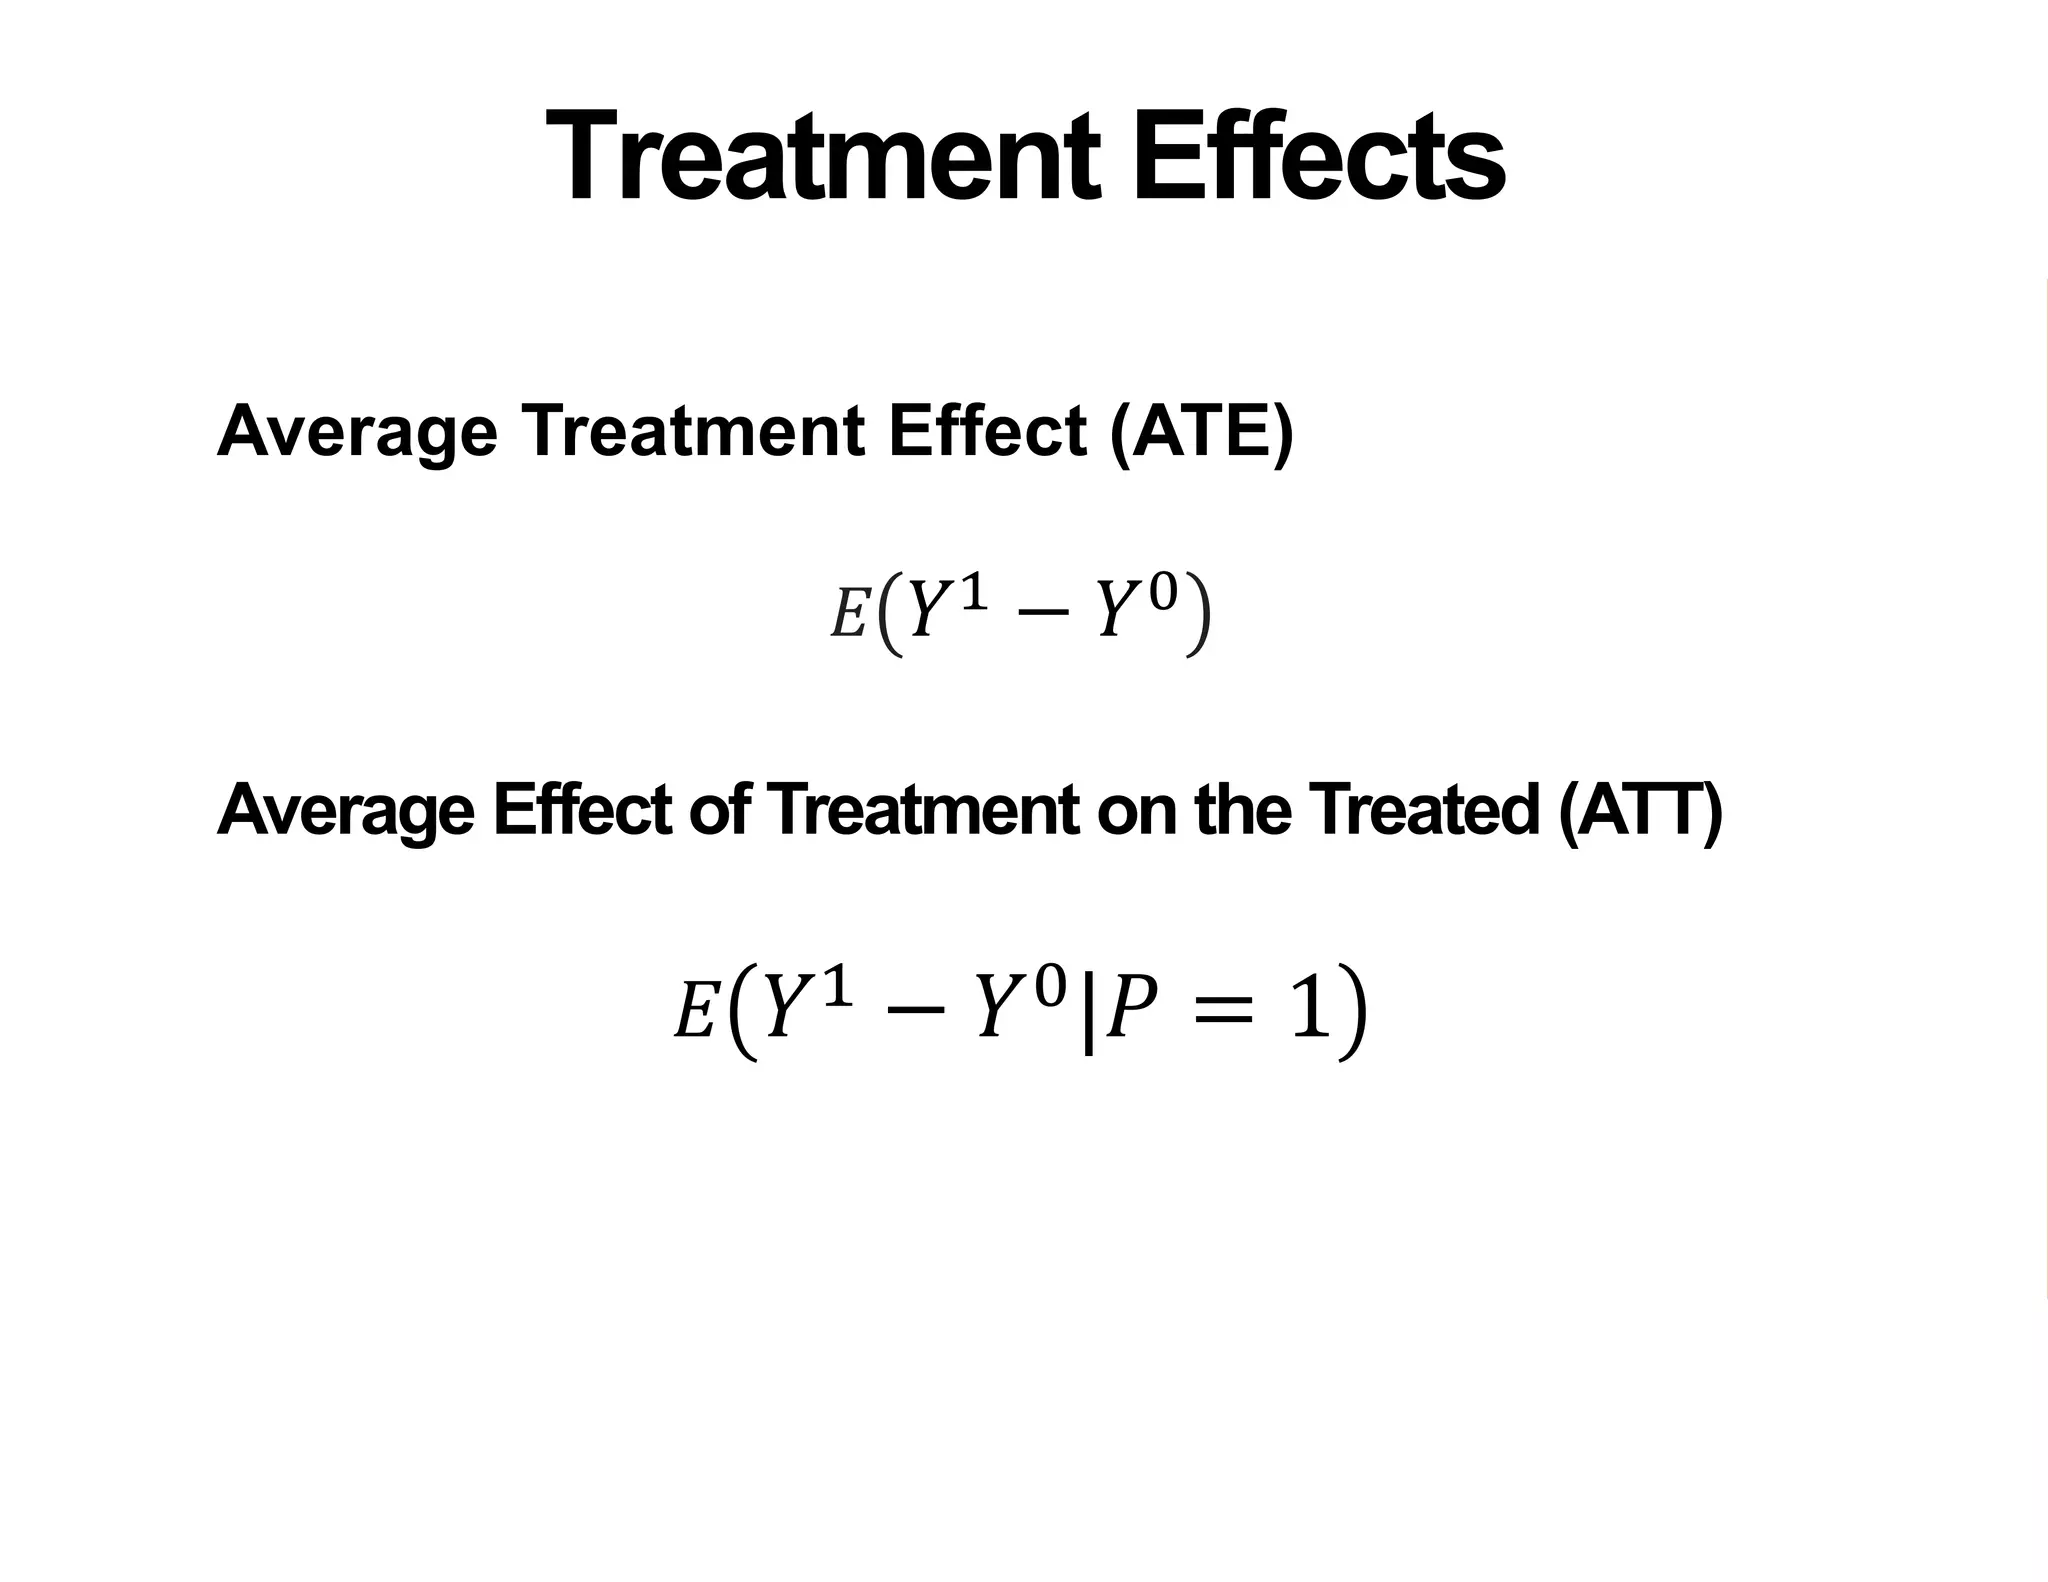
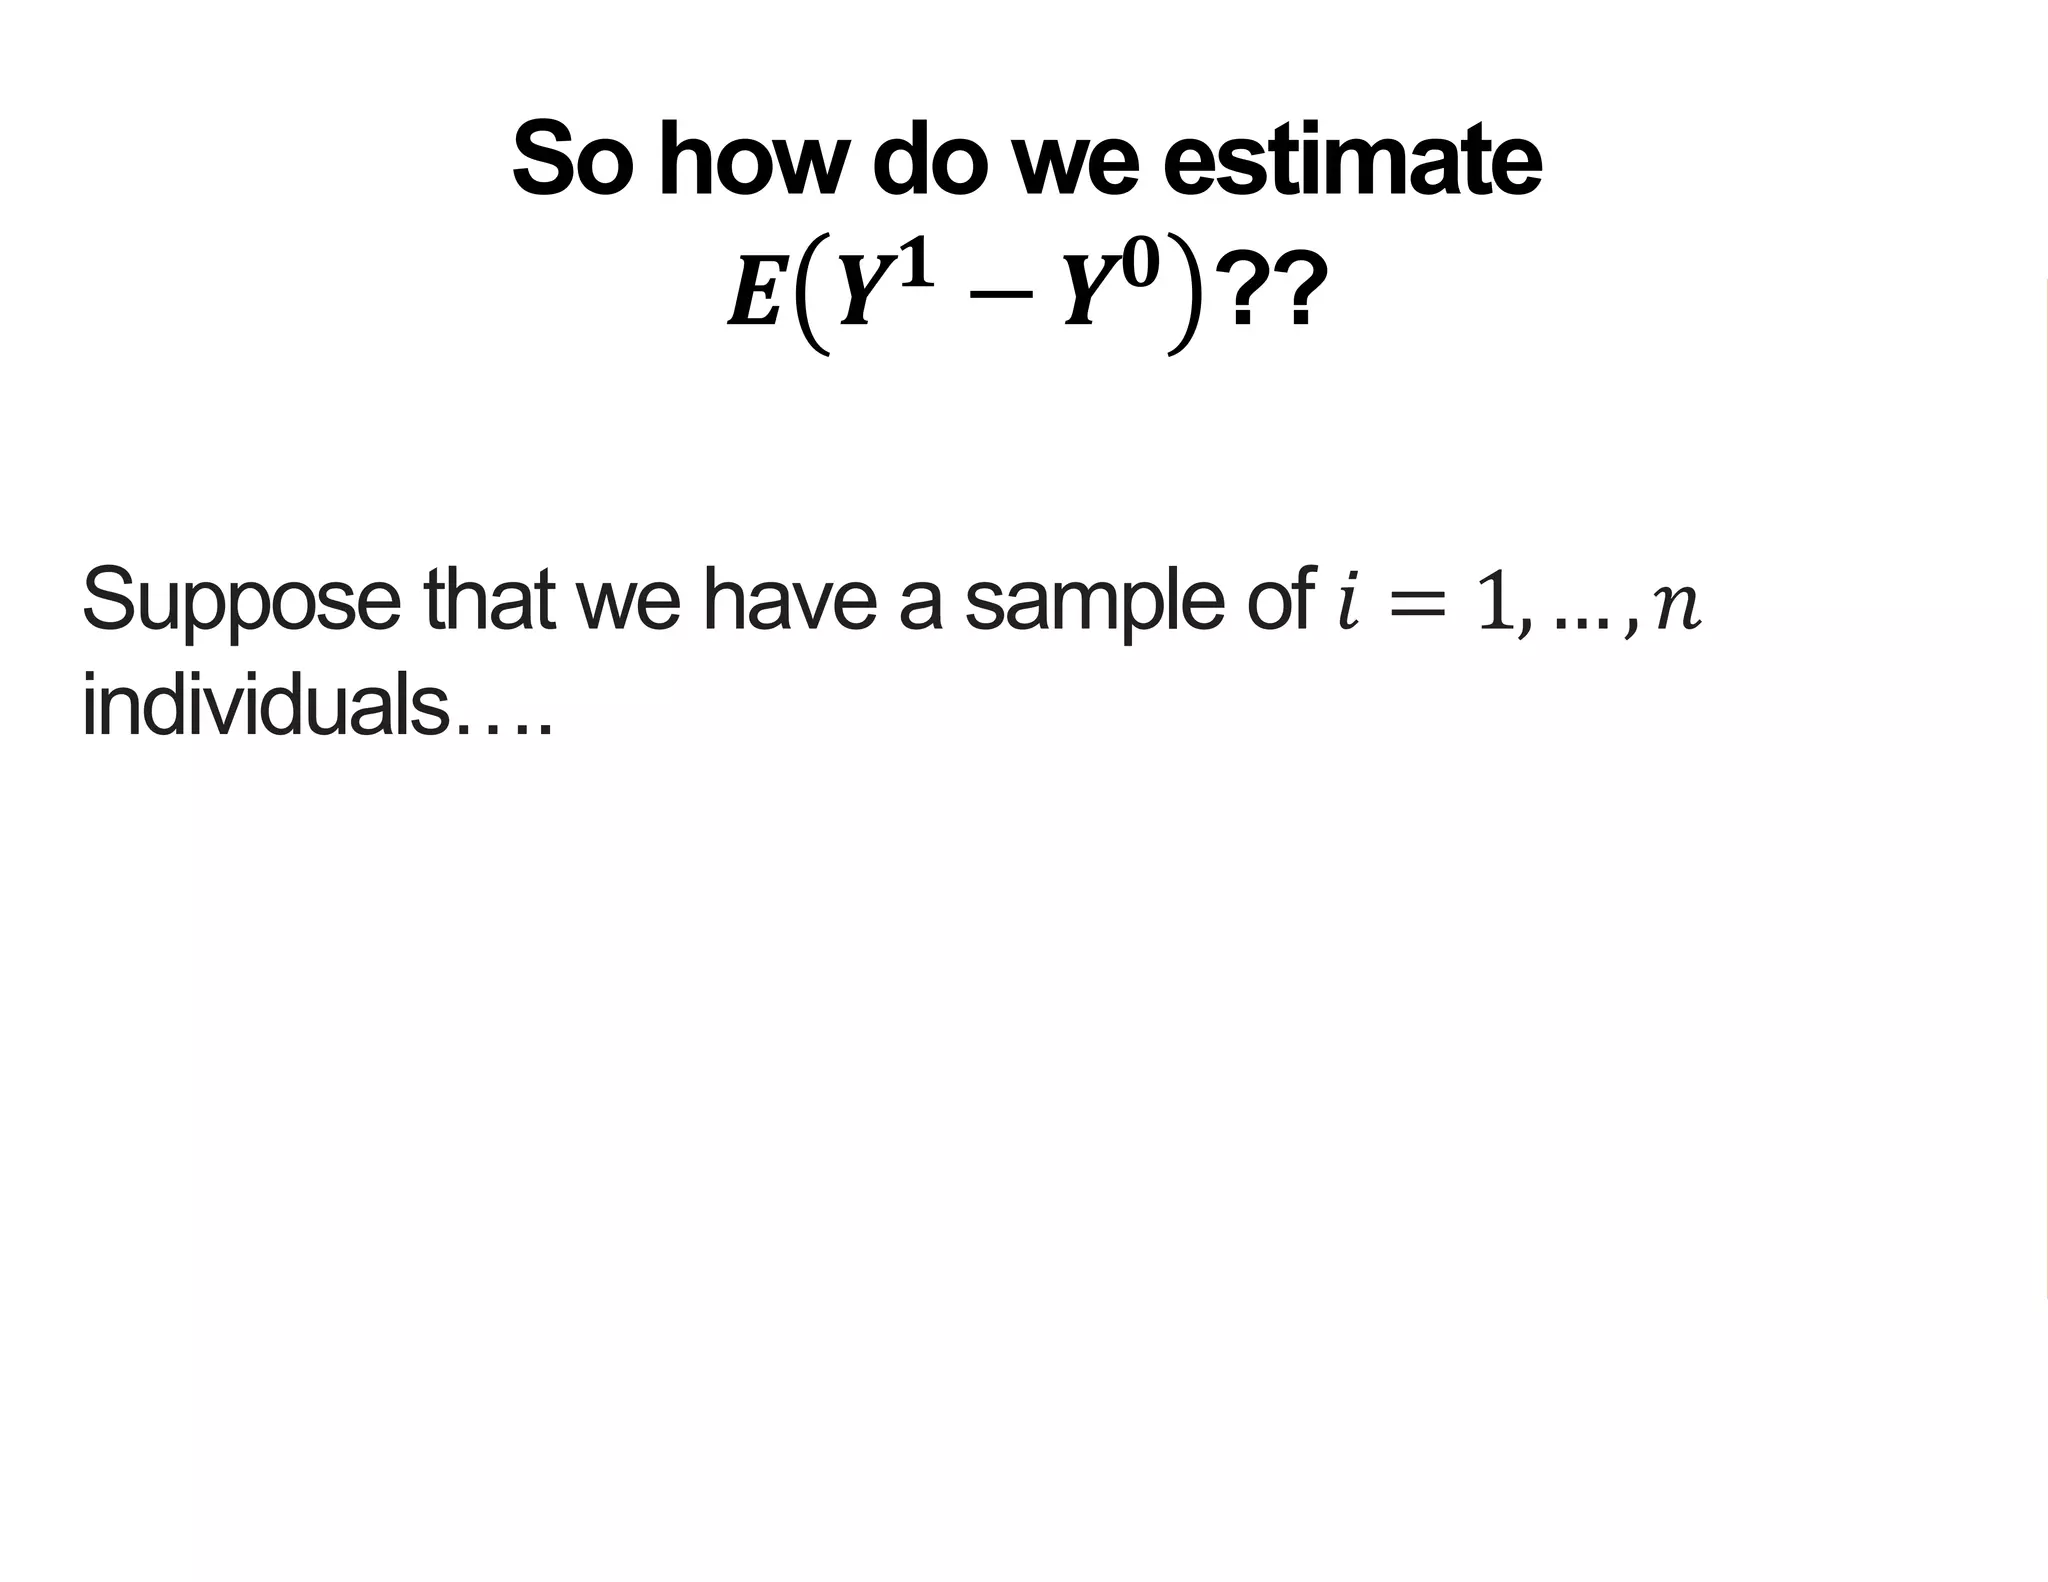
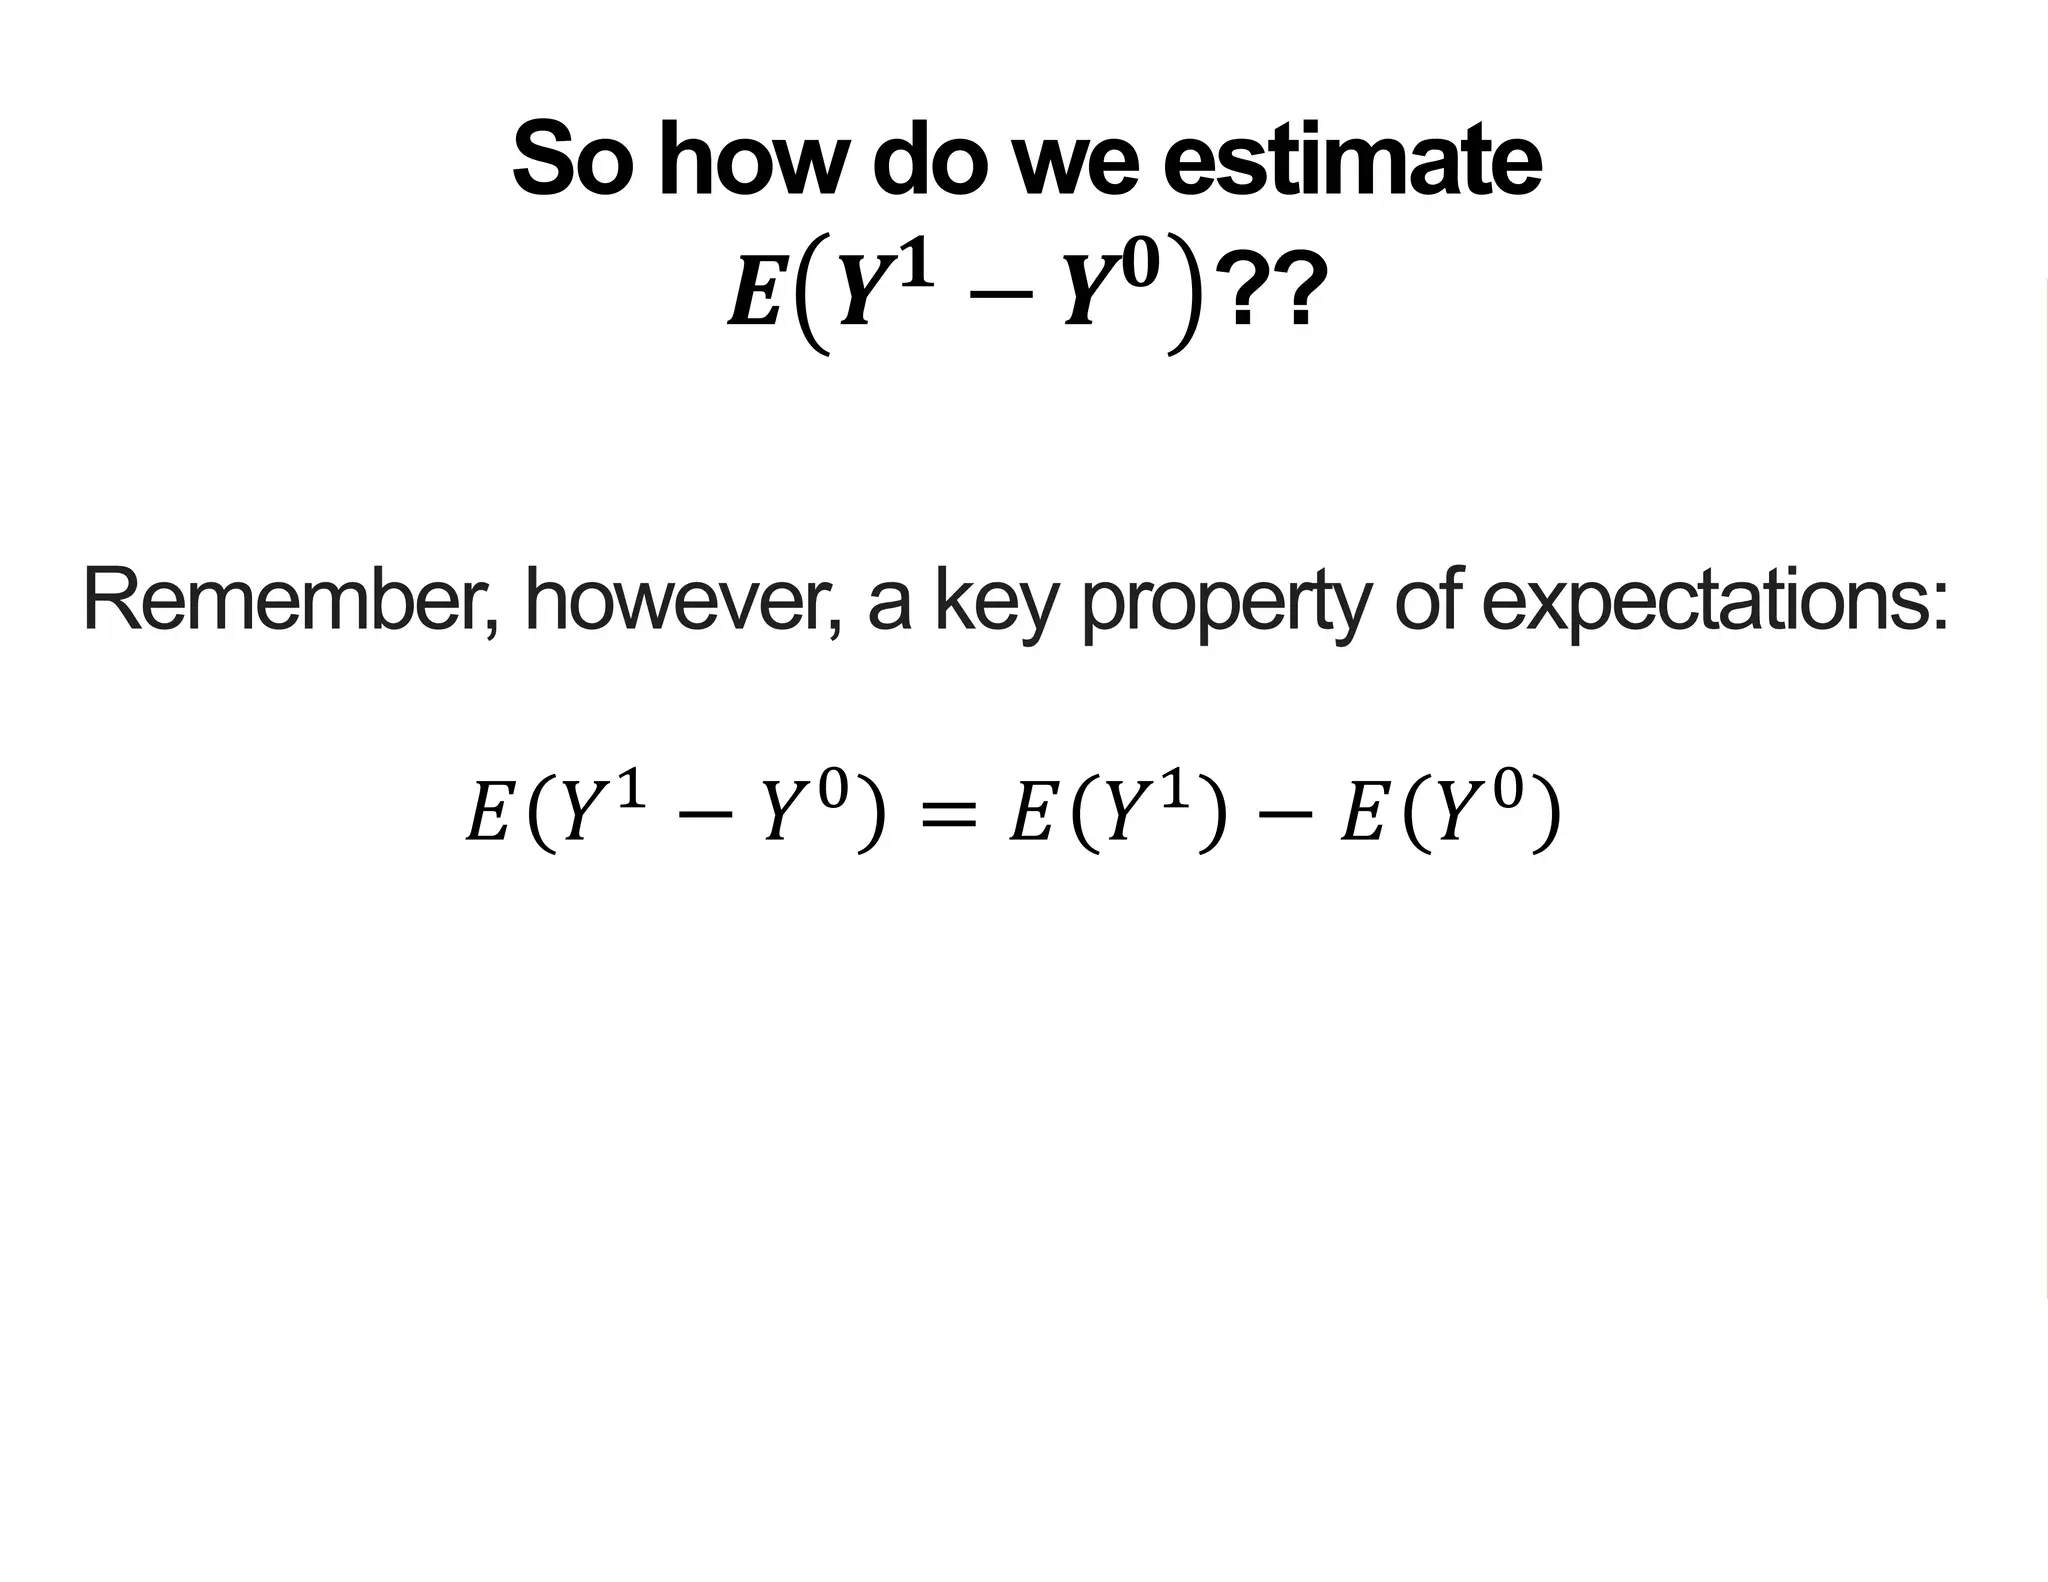
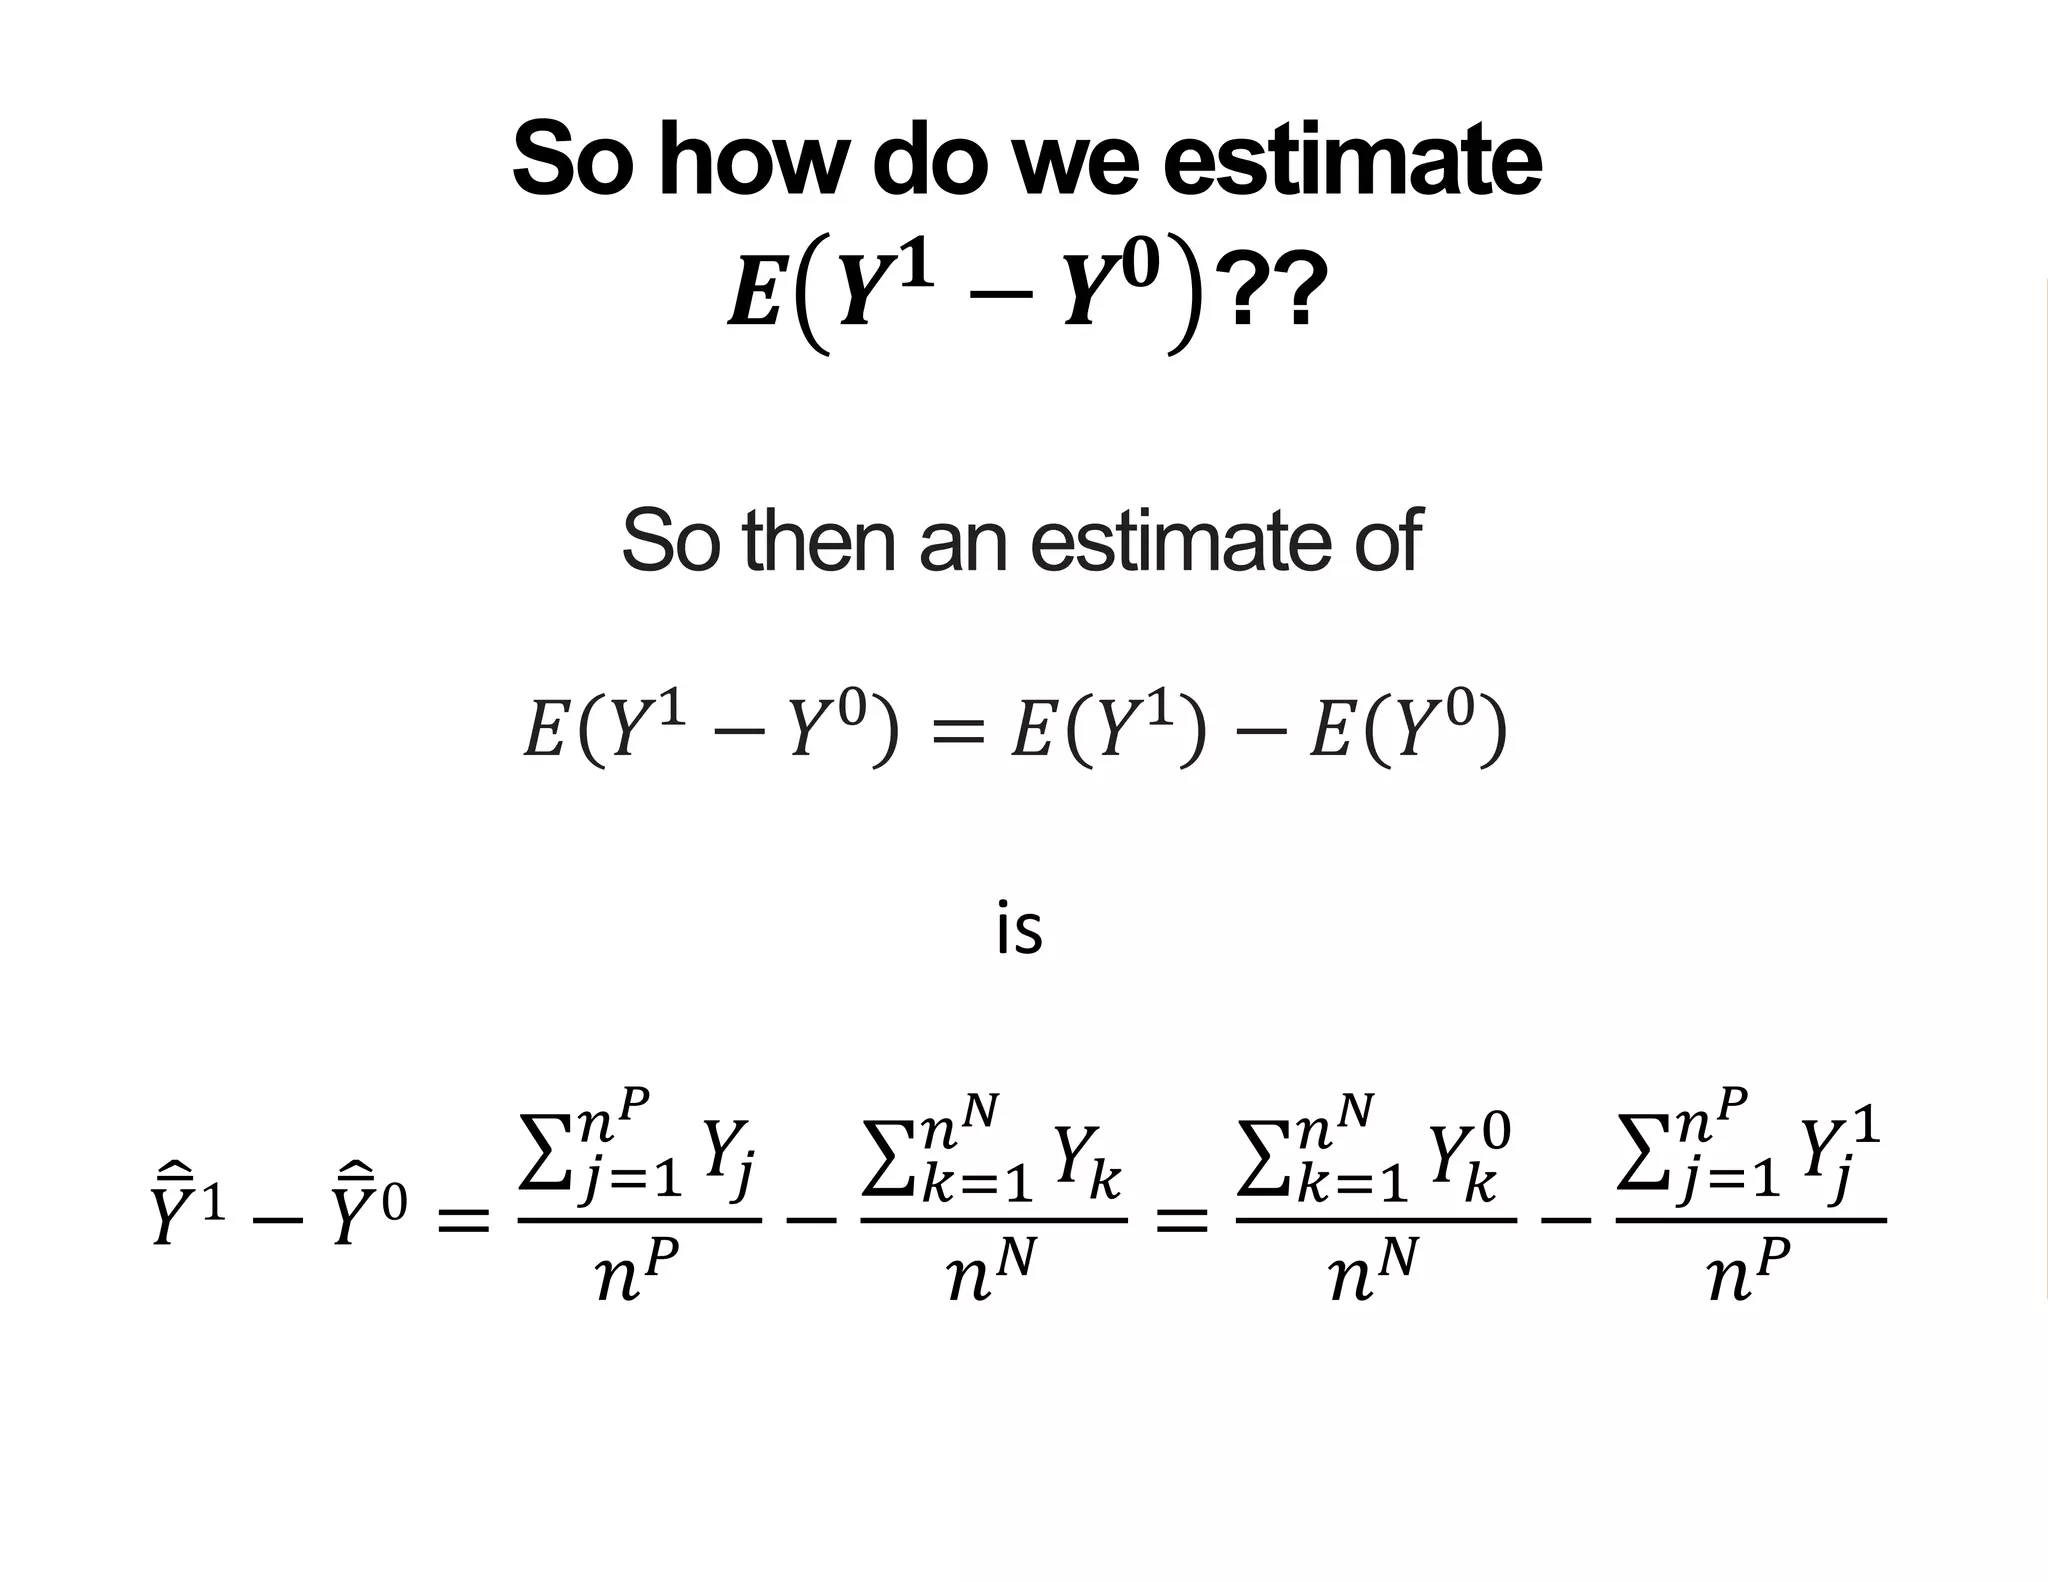
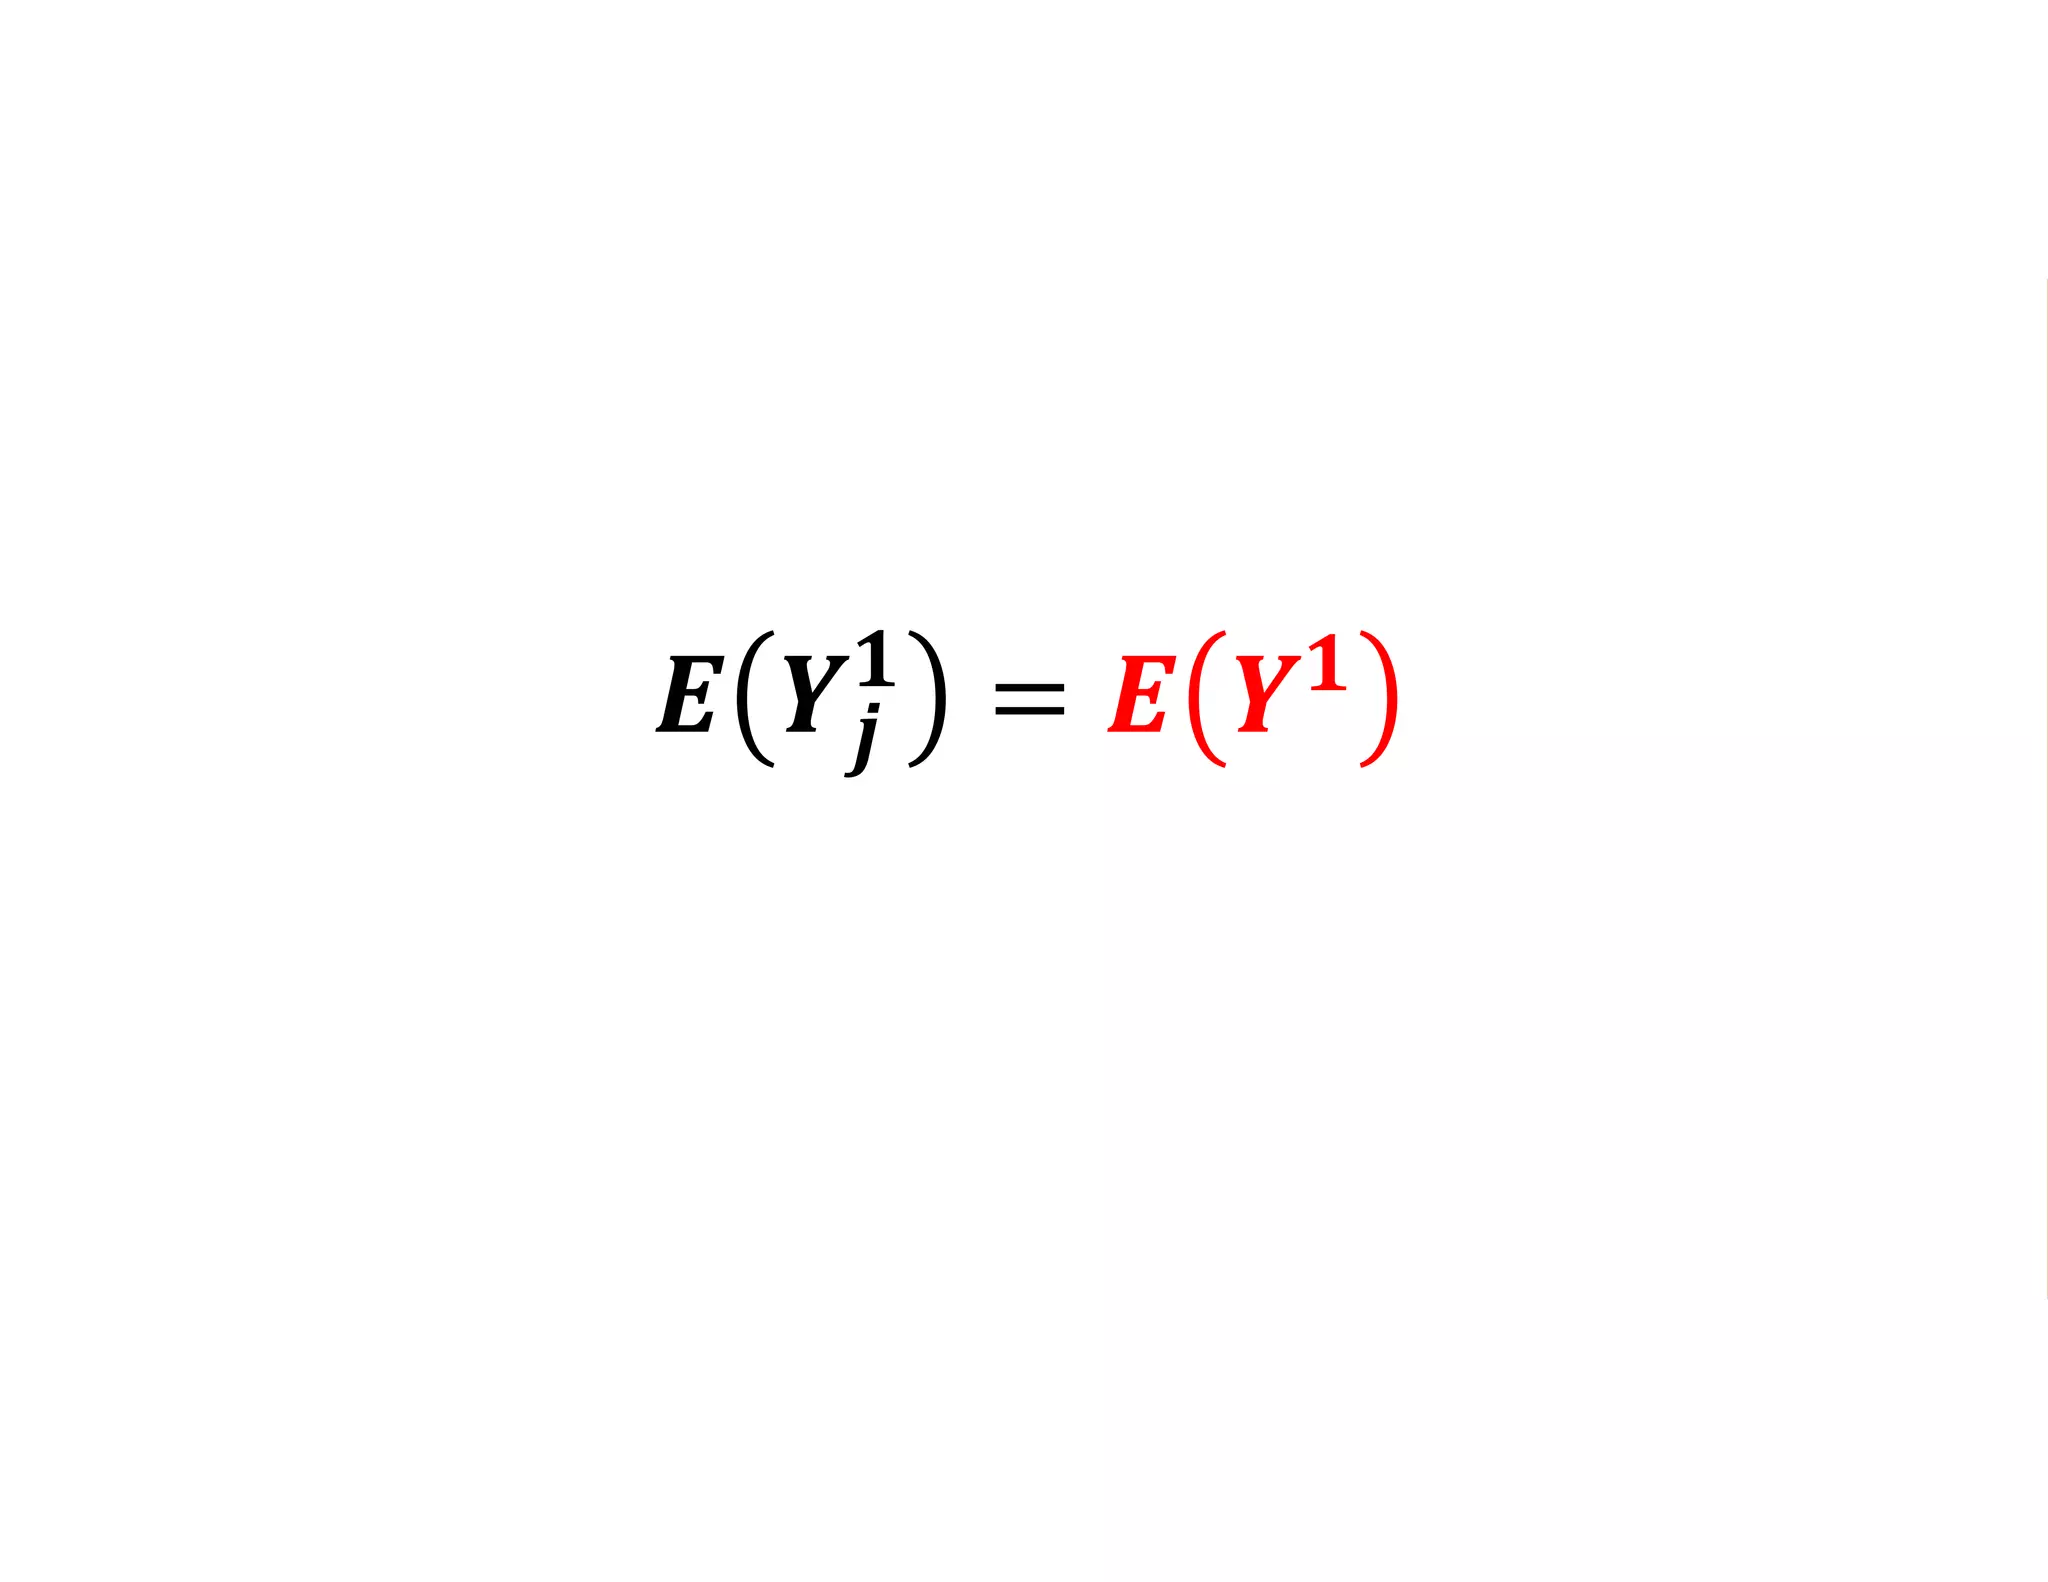
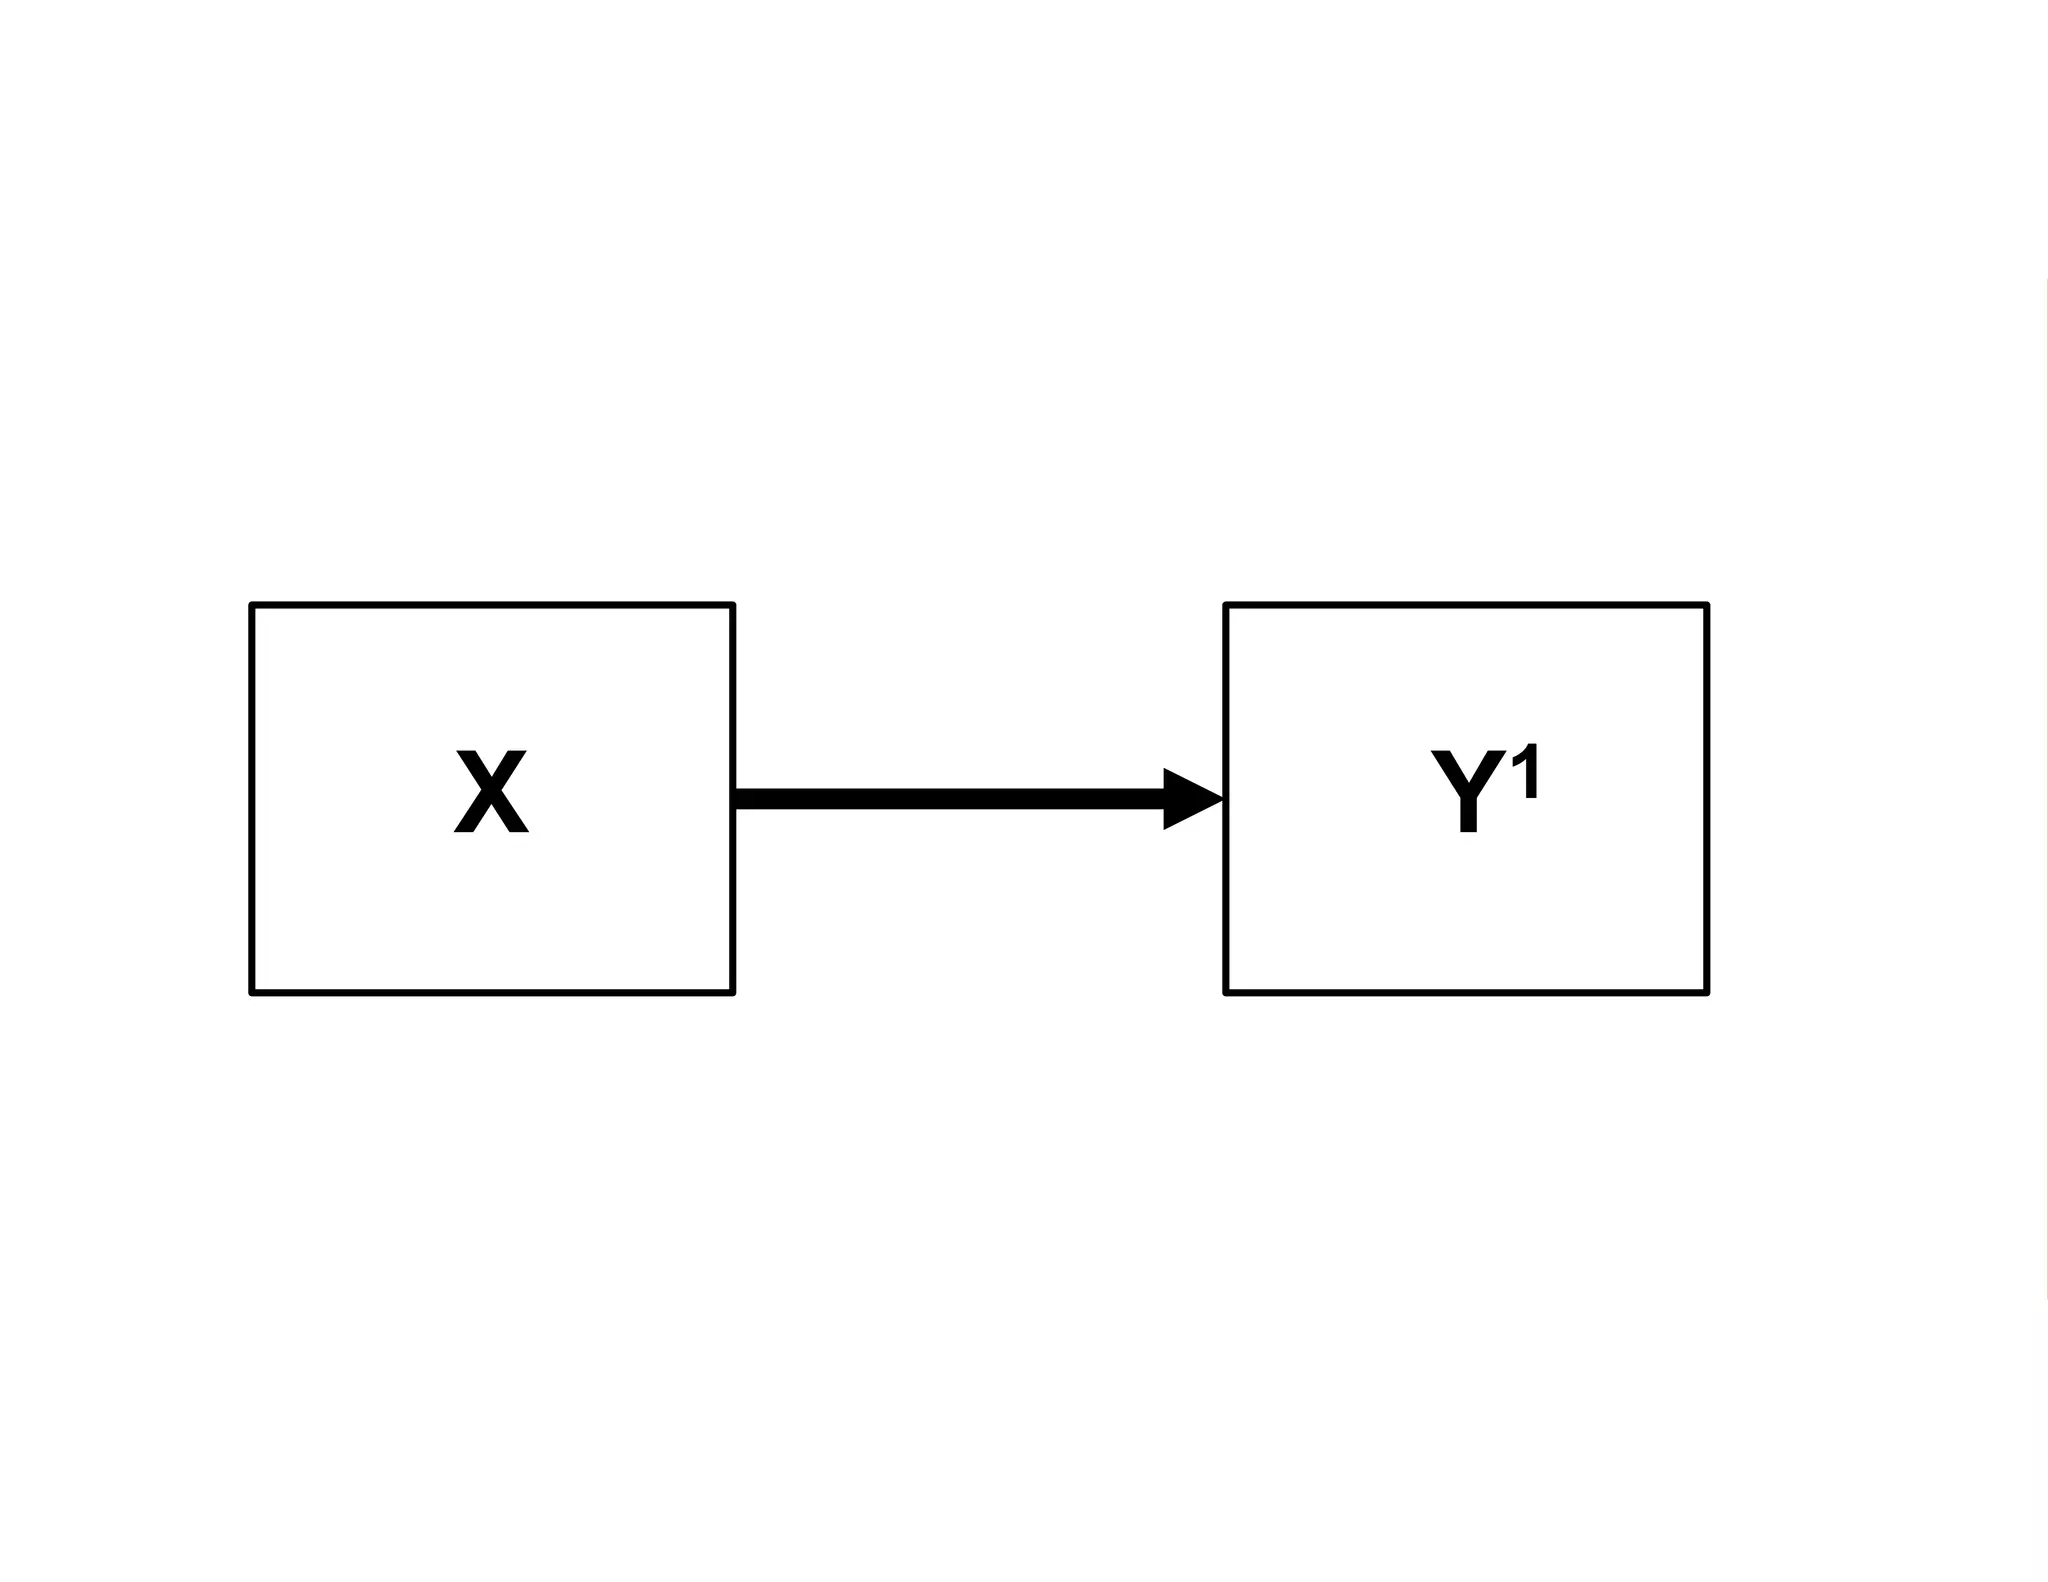
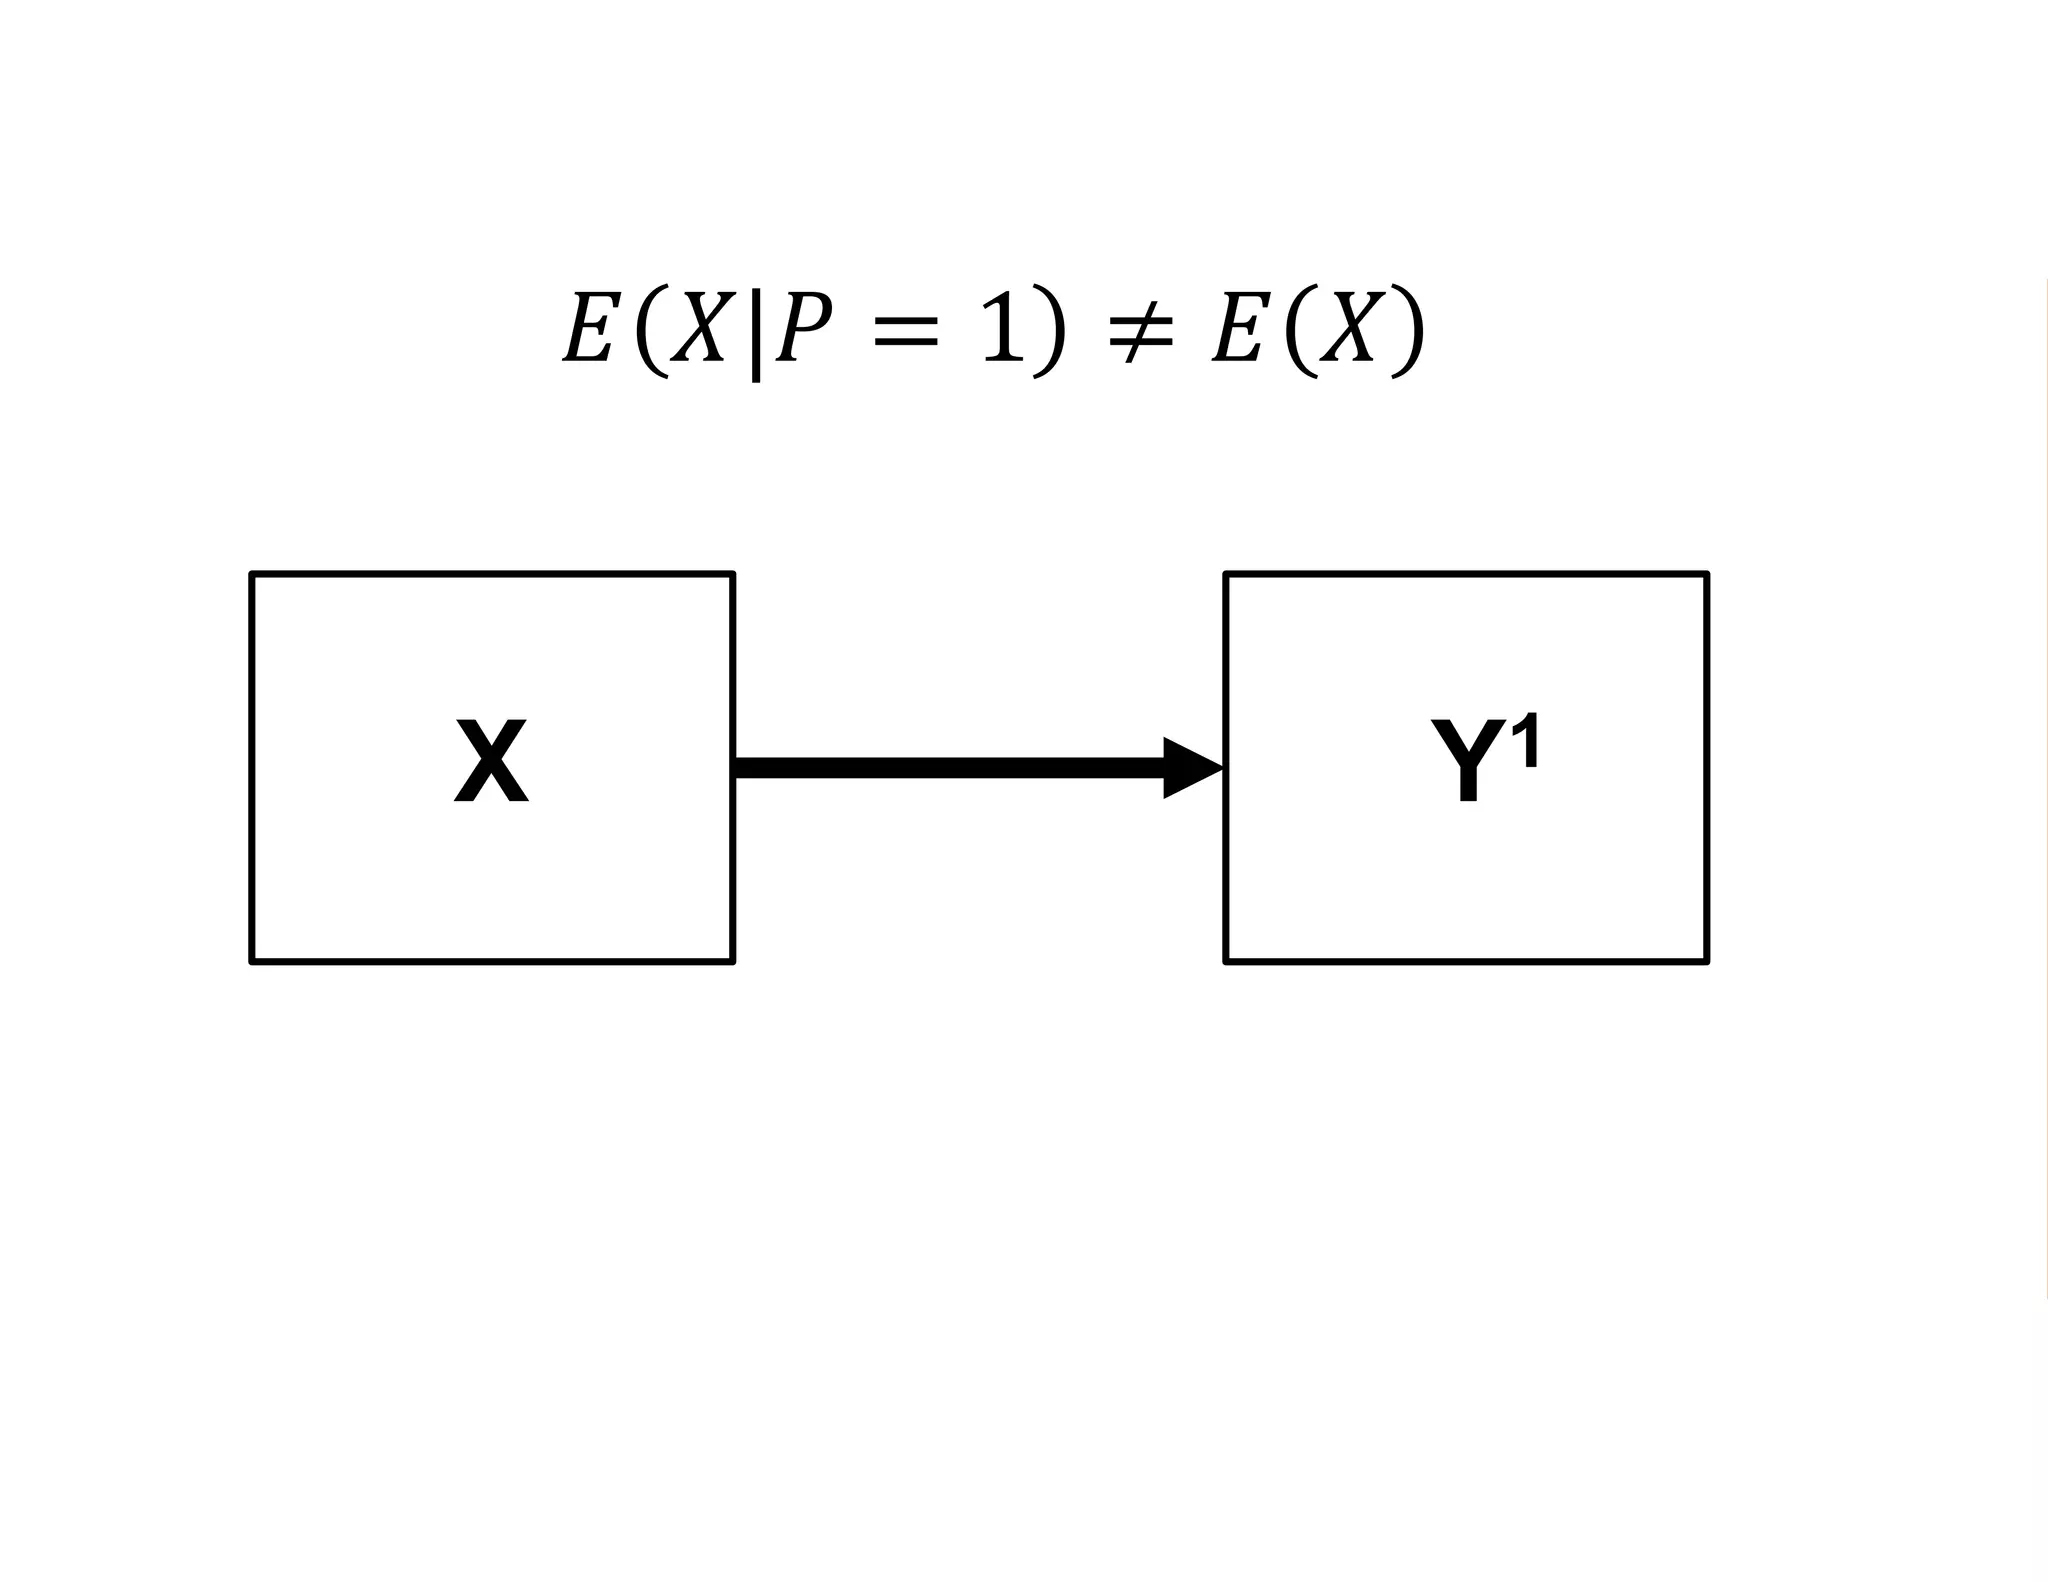
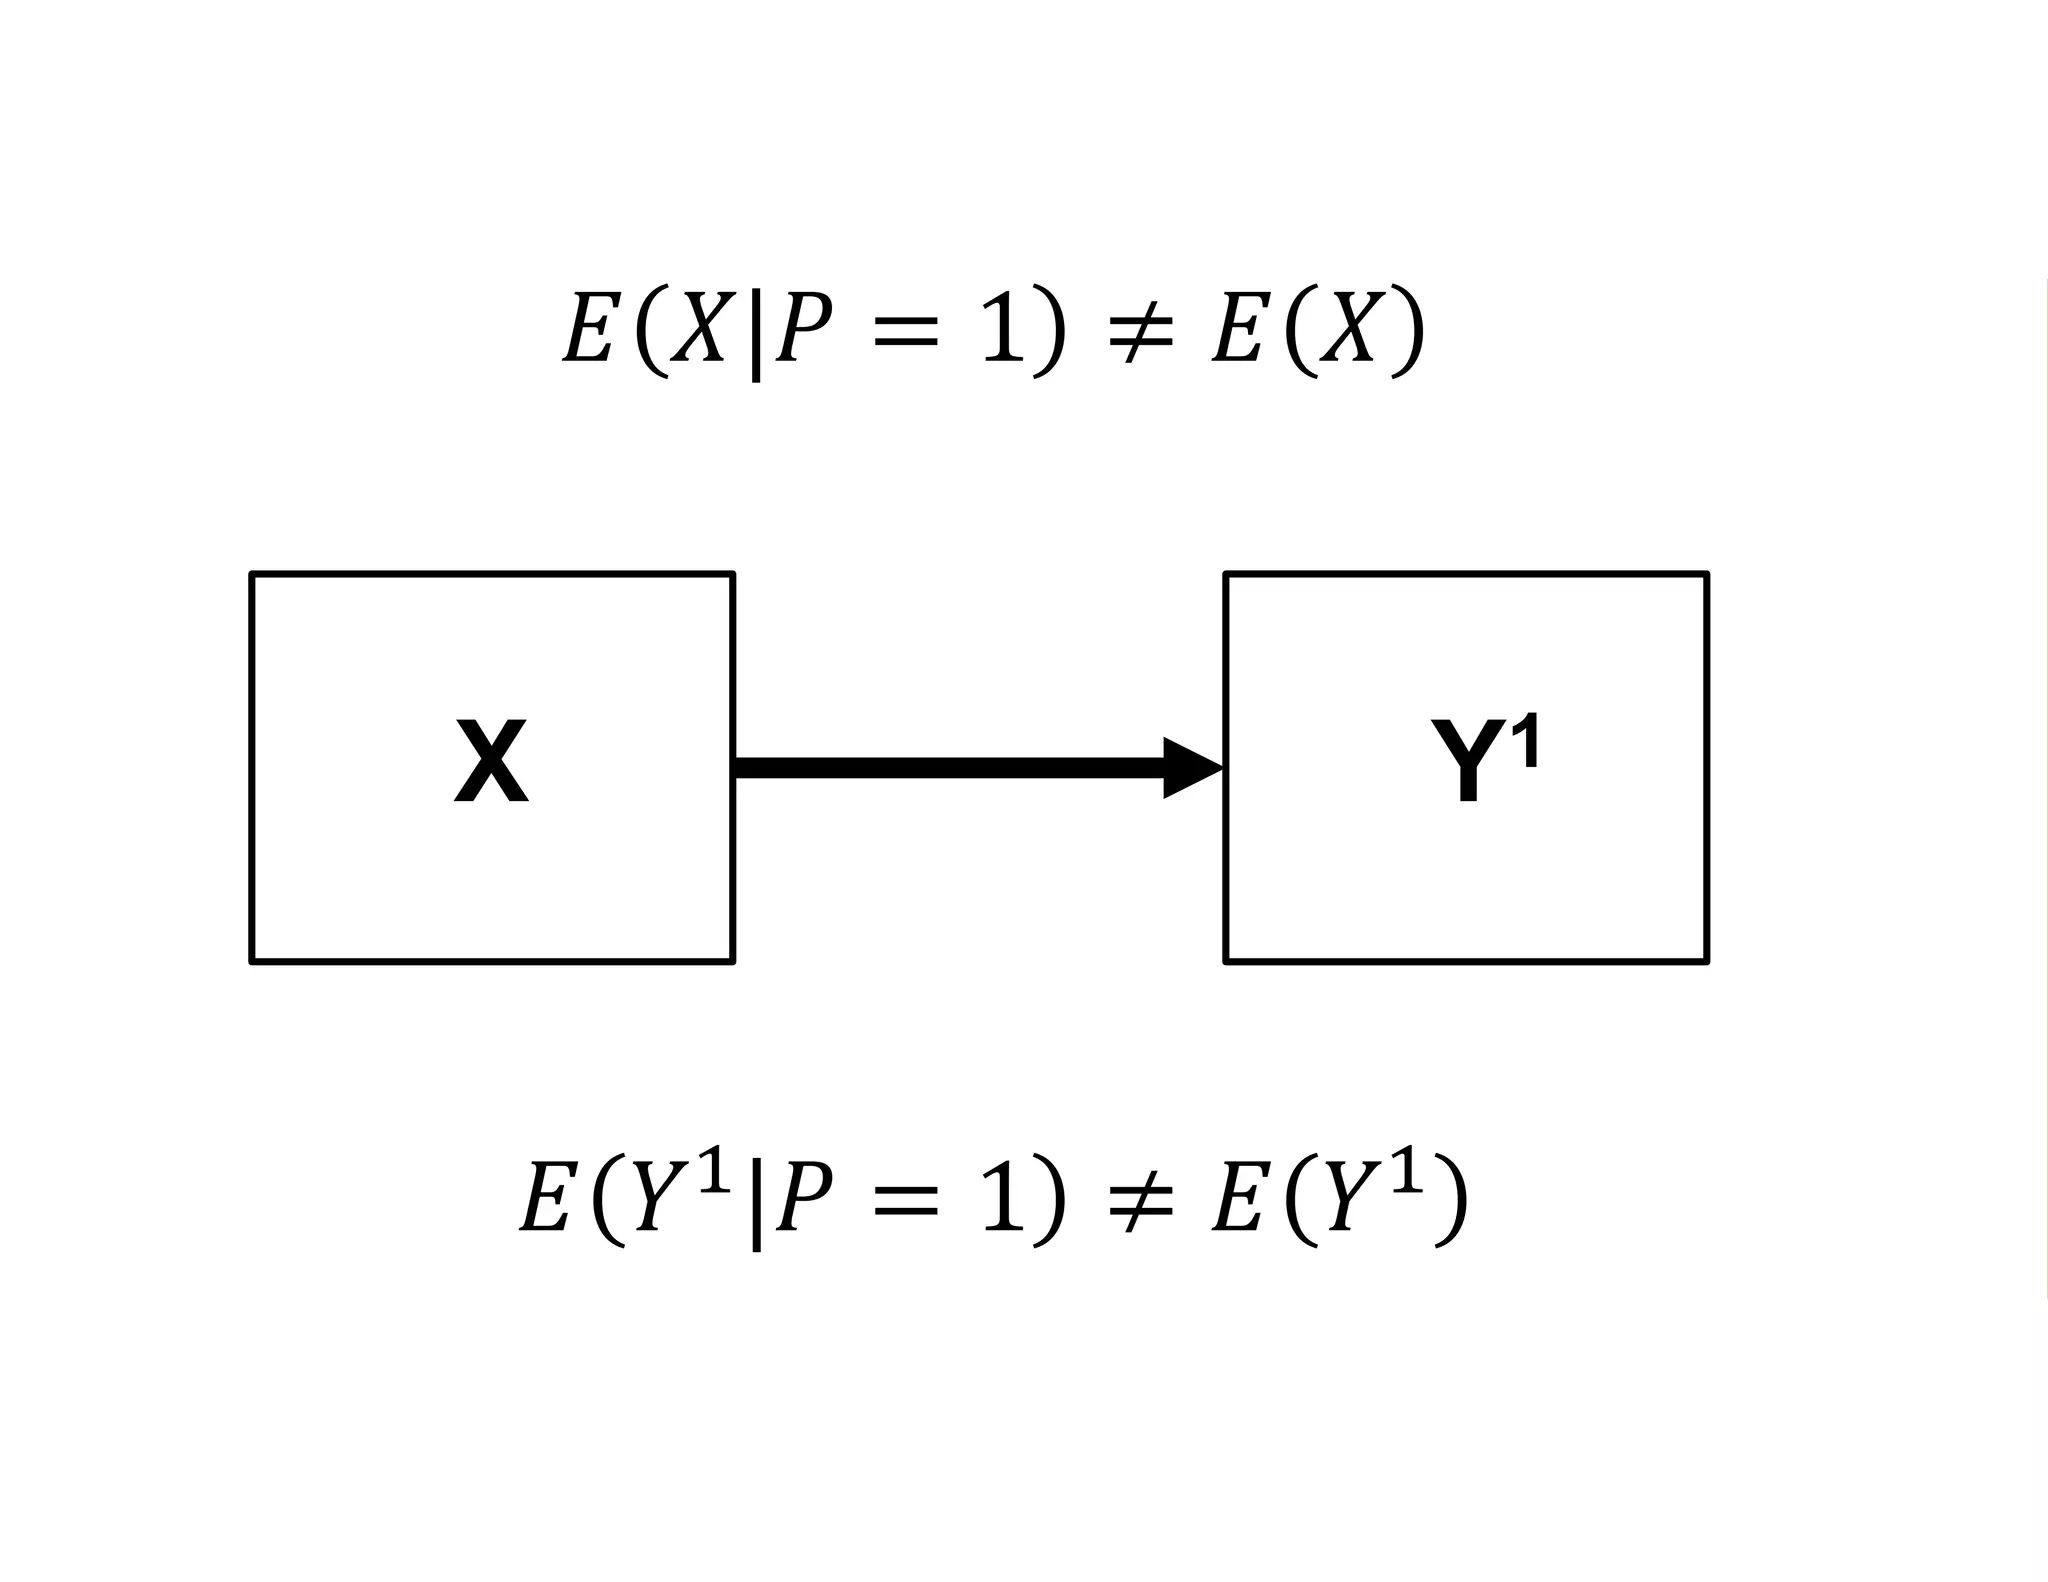
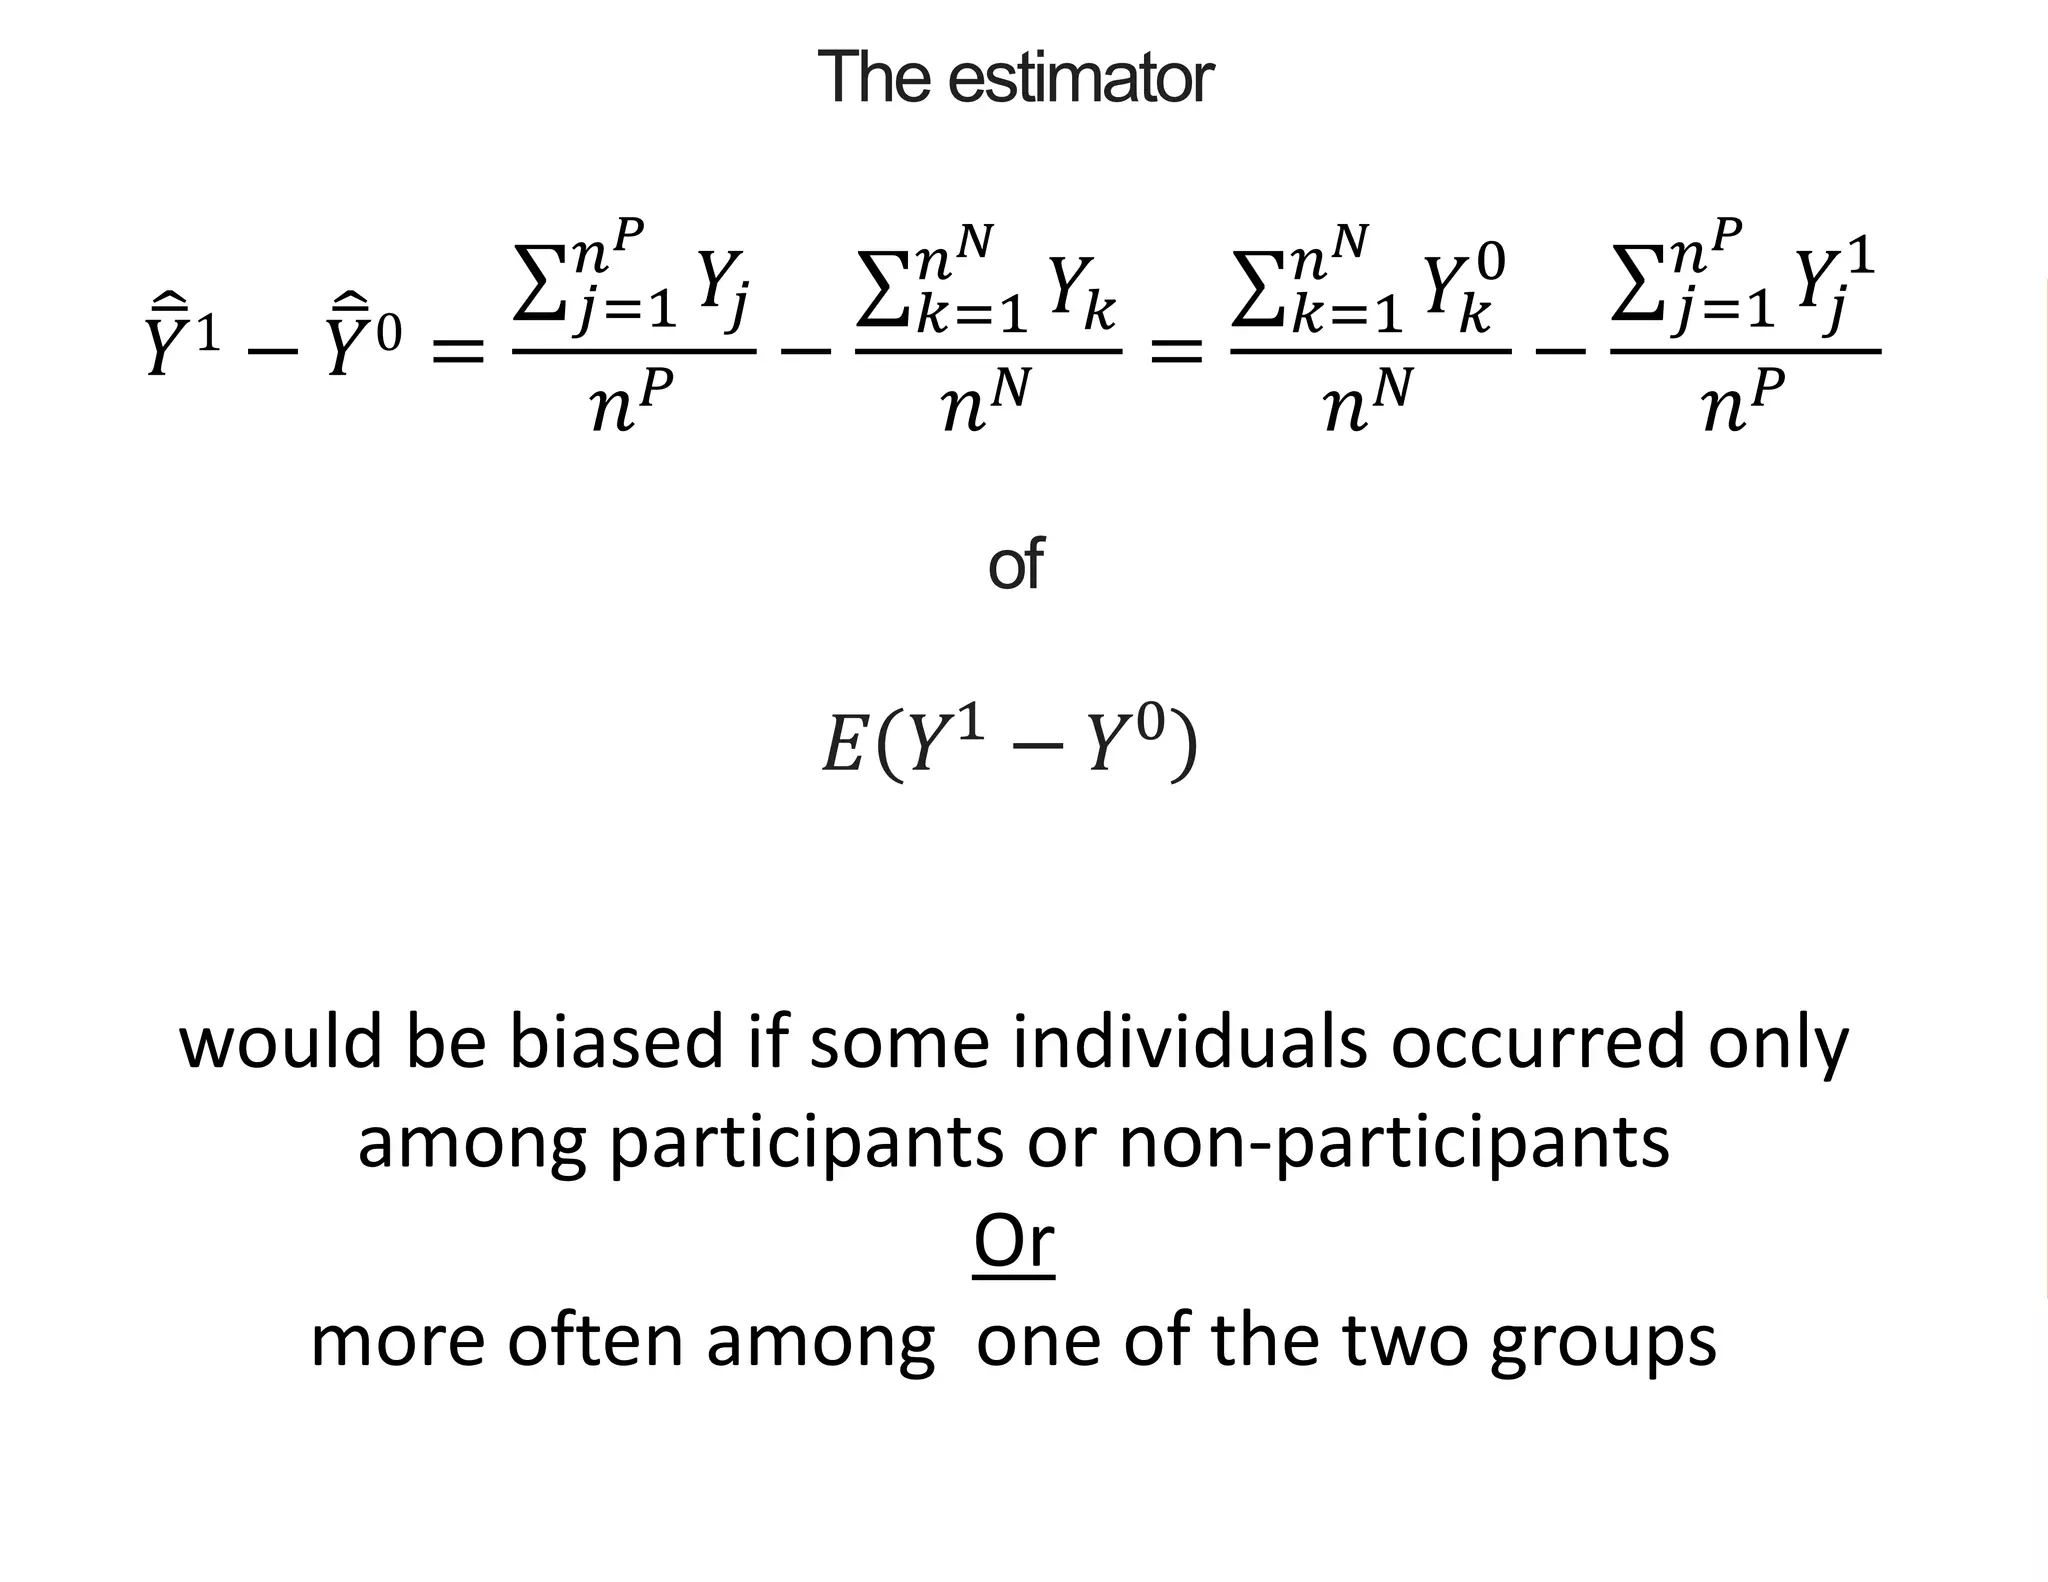
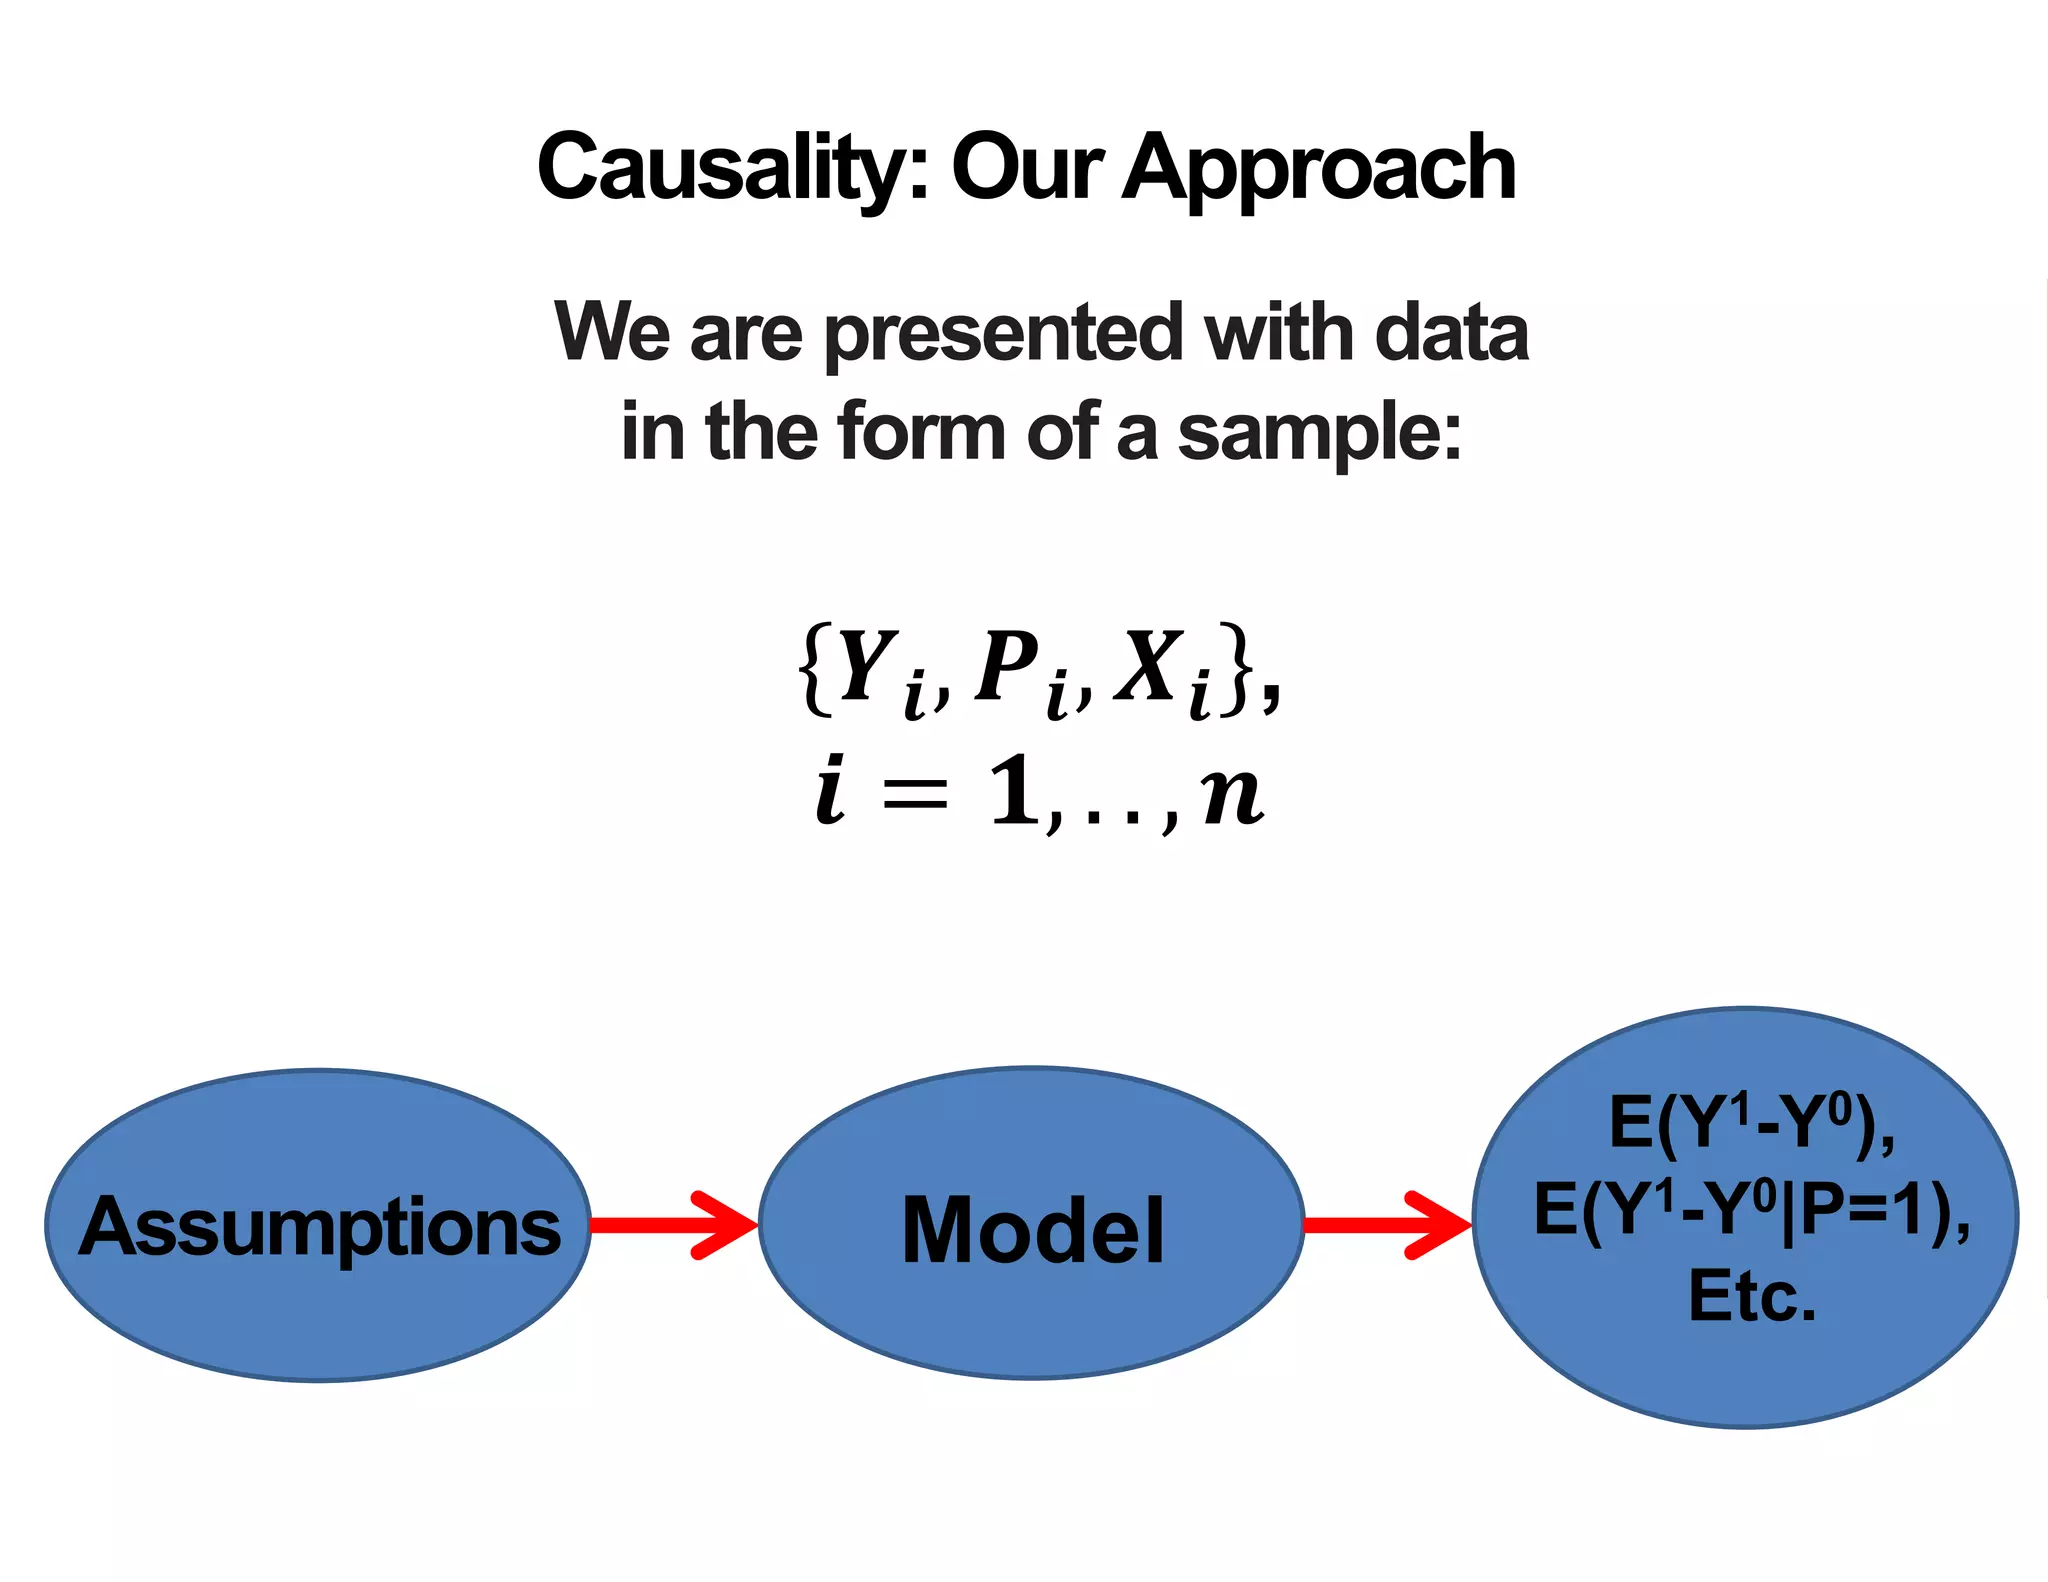
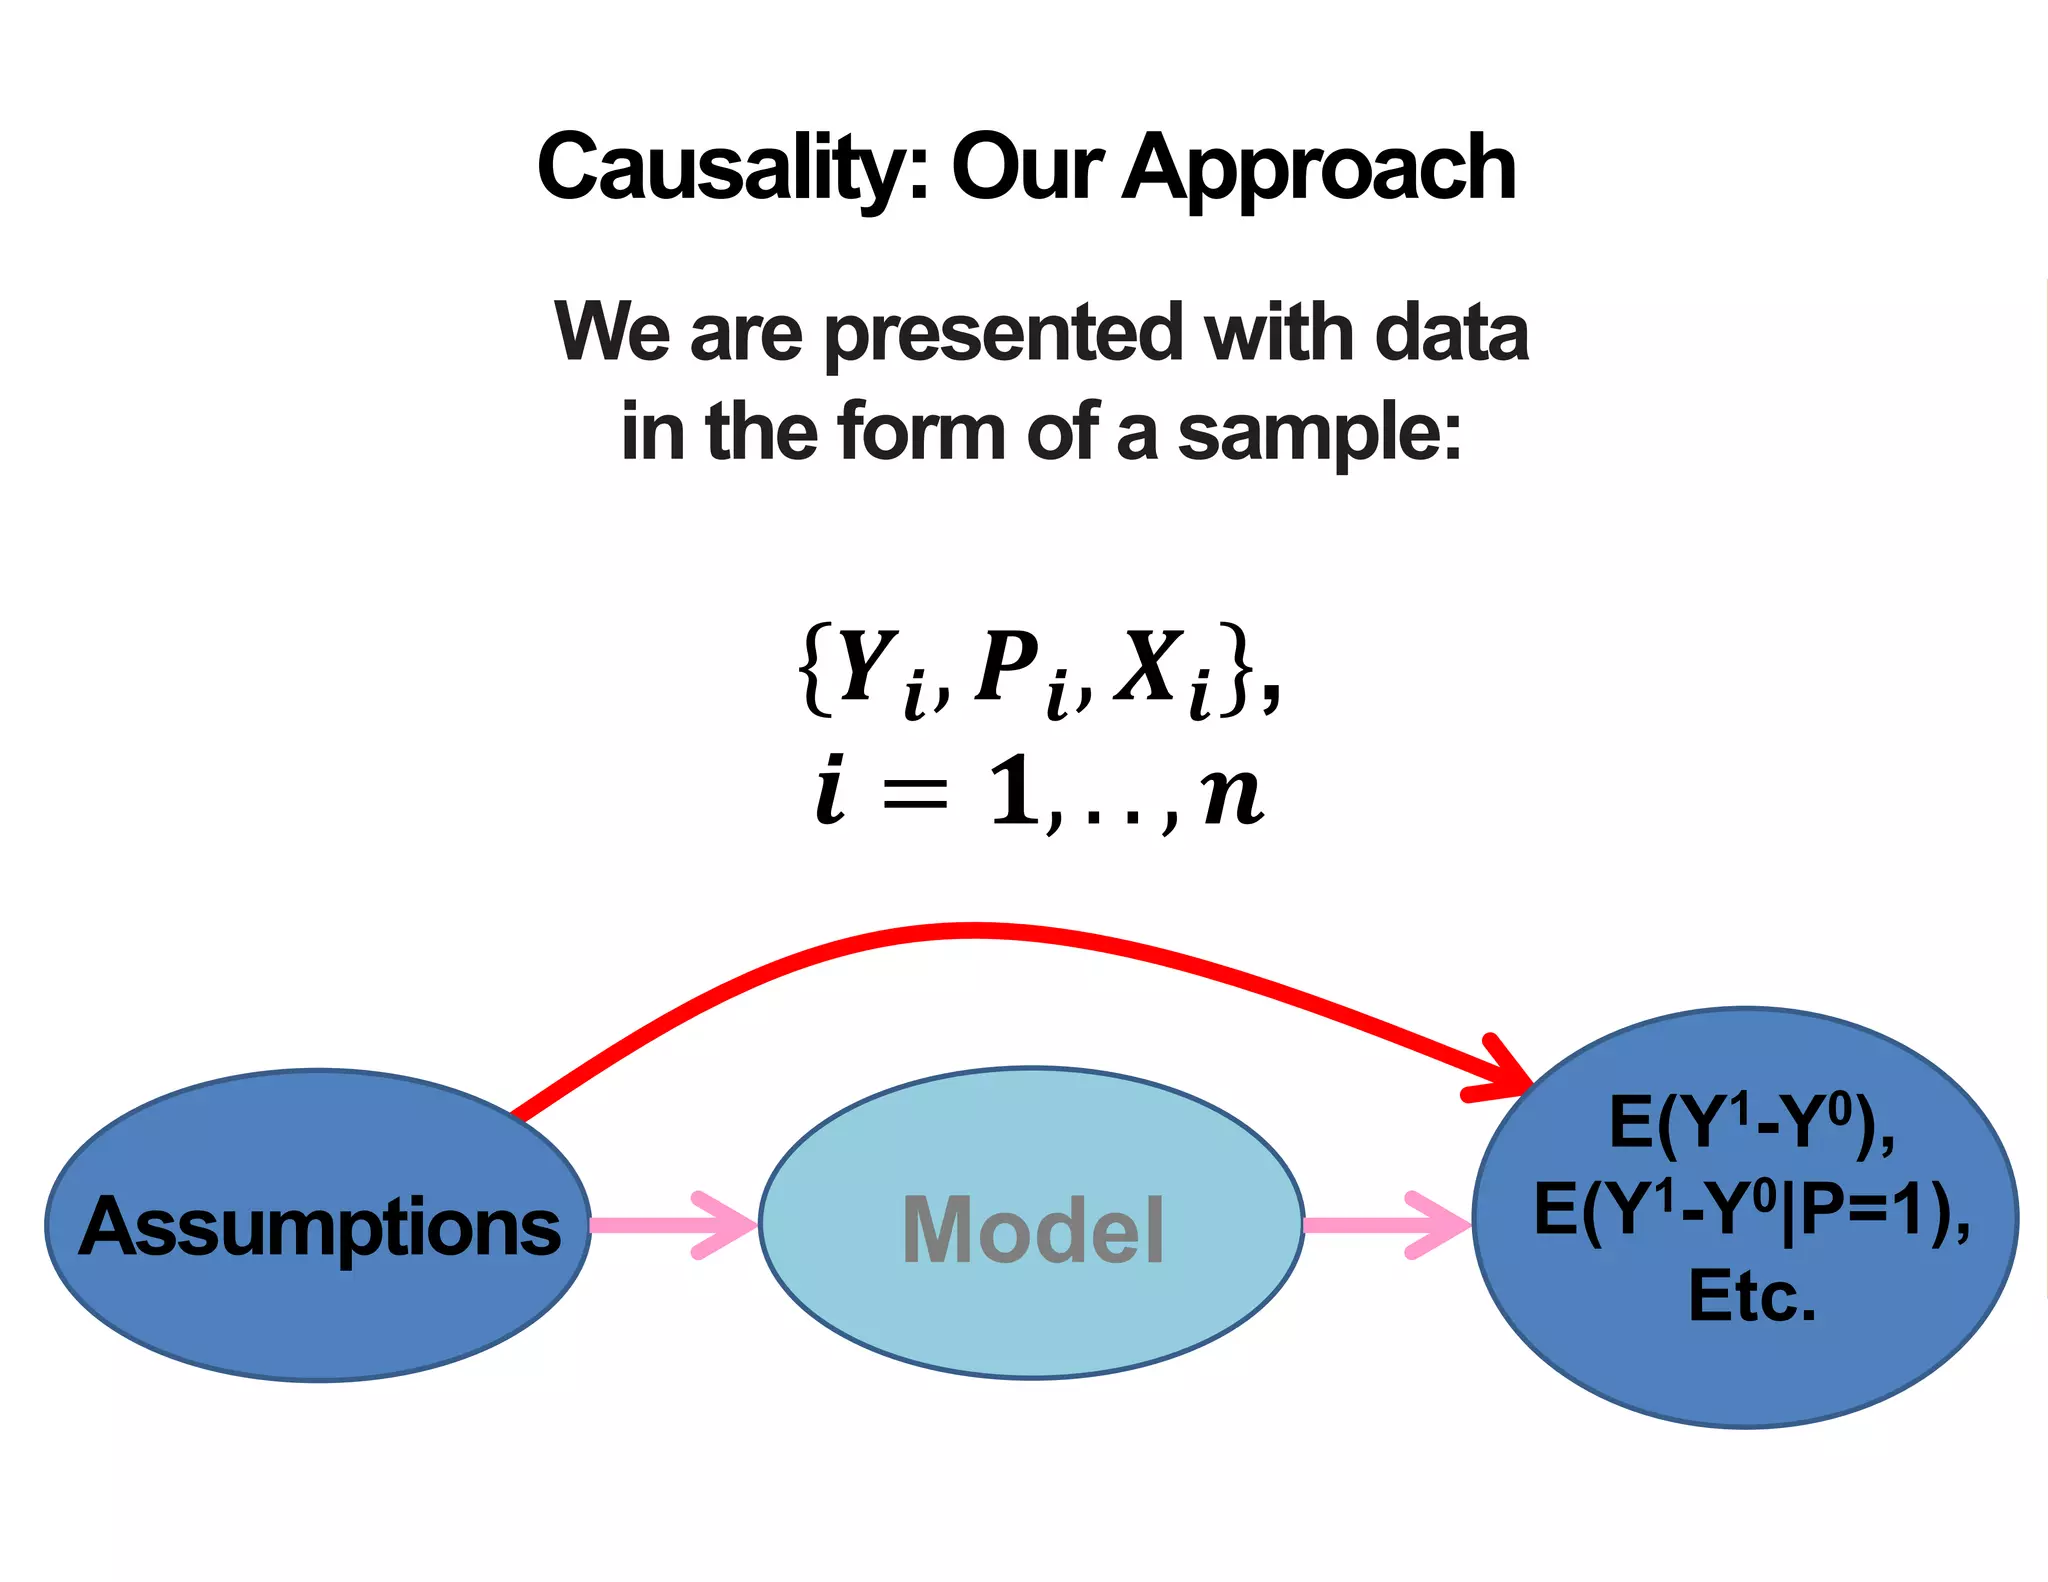
- It introduces the concept of potential outcomes (Yi1 if an individual participates in the program, Yi0 if they do not) and defines the average treatment effect as the expected difference between these potential outcomes (E[Yi1 - Yi0]).
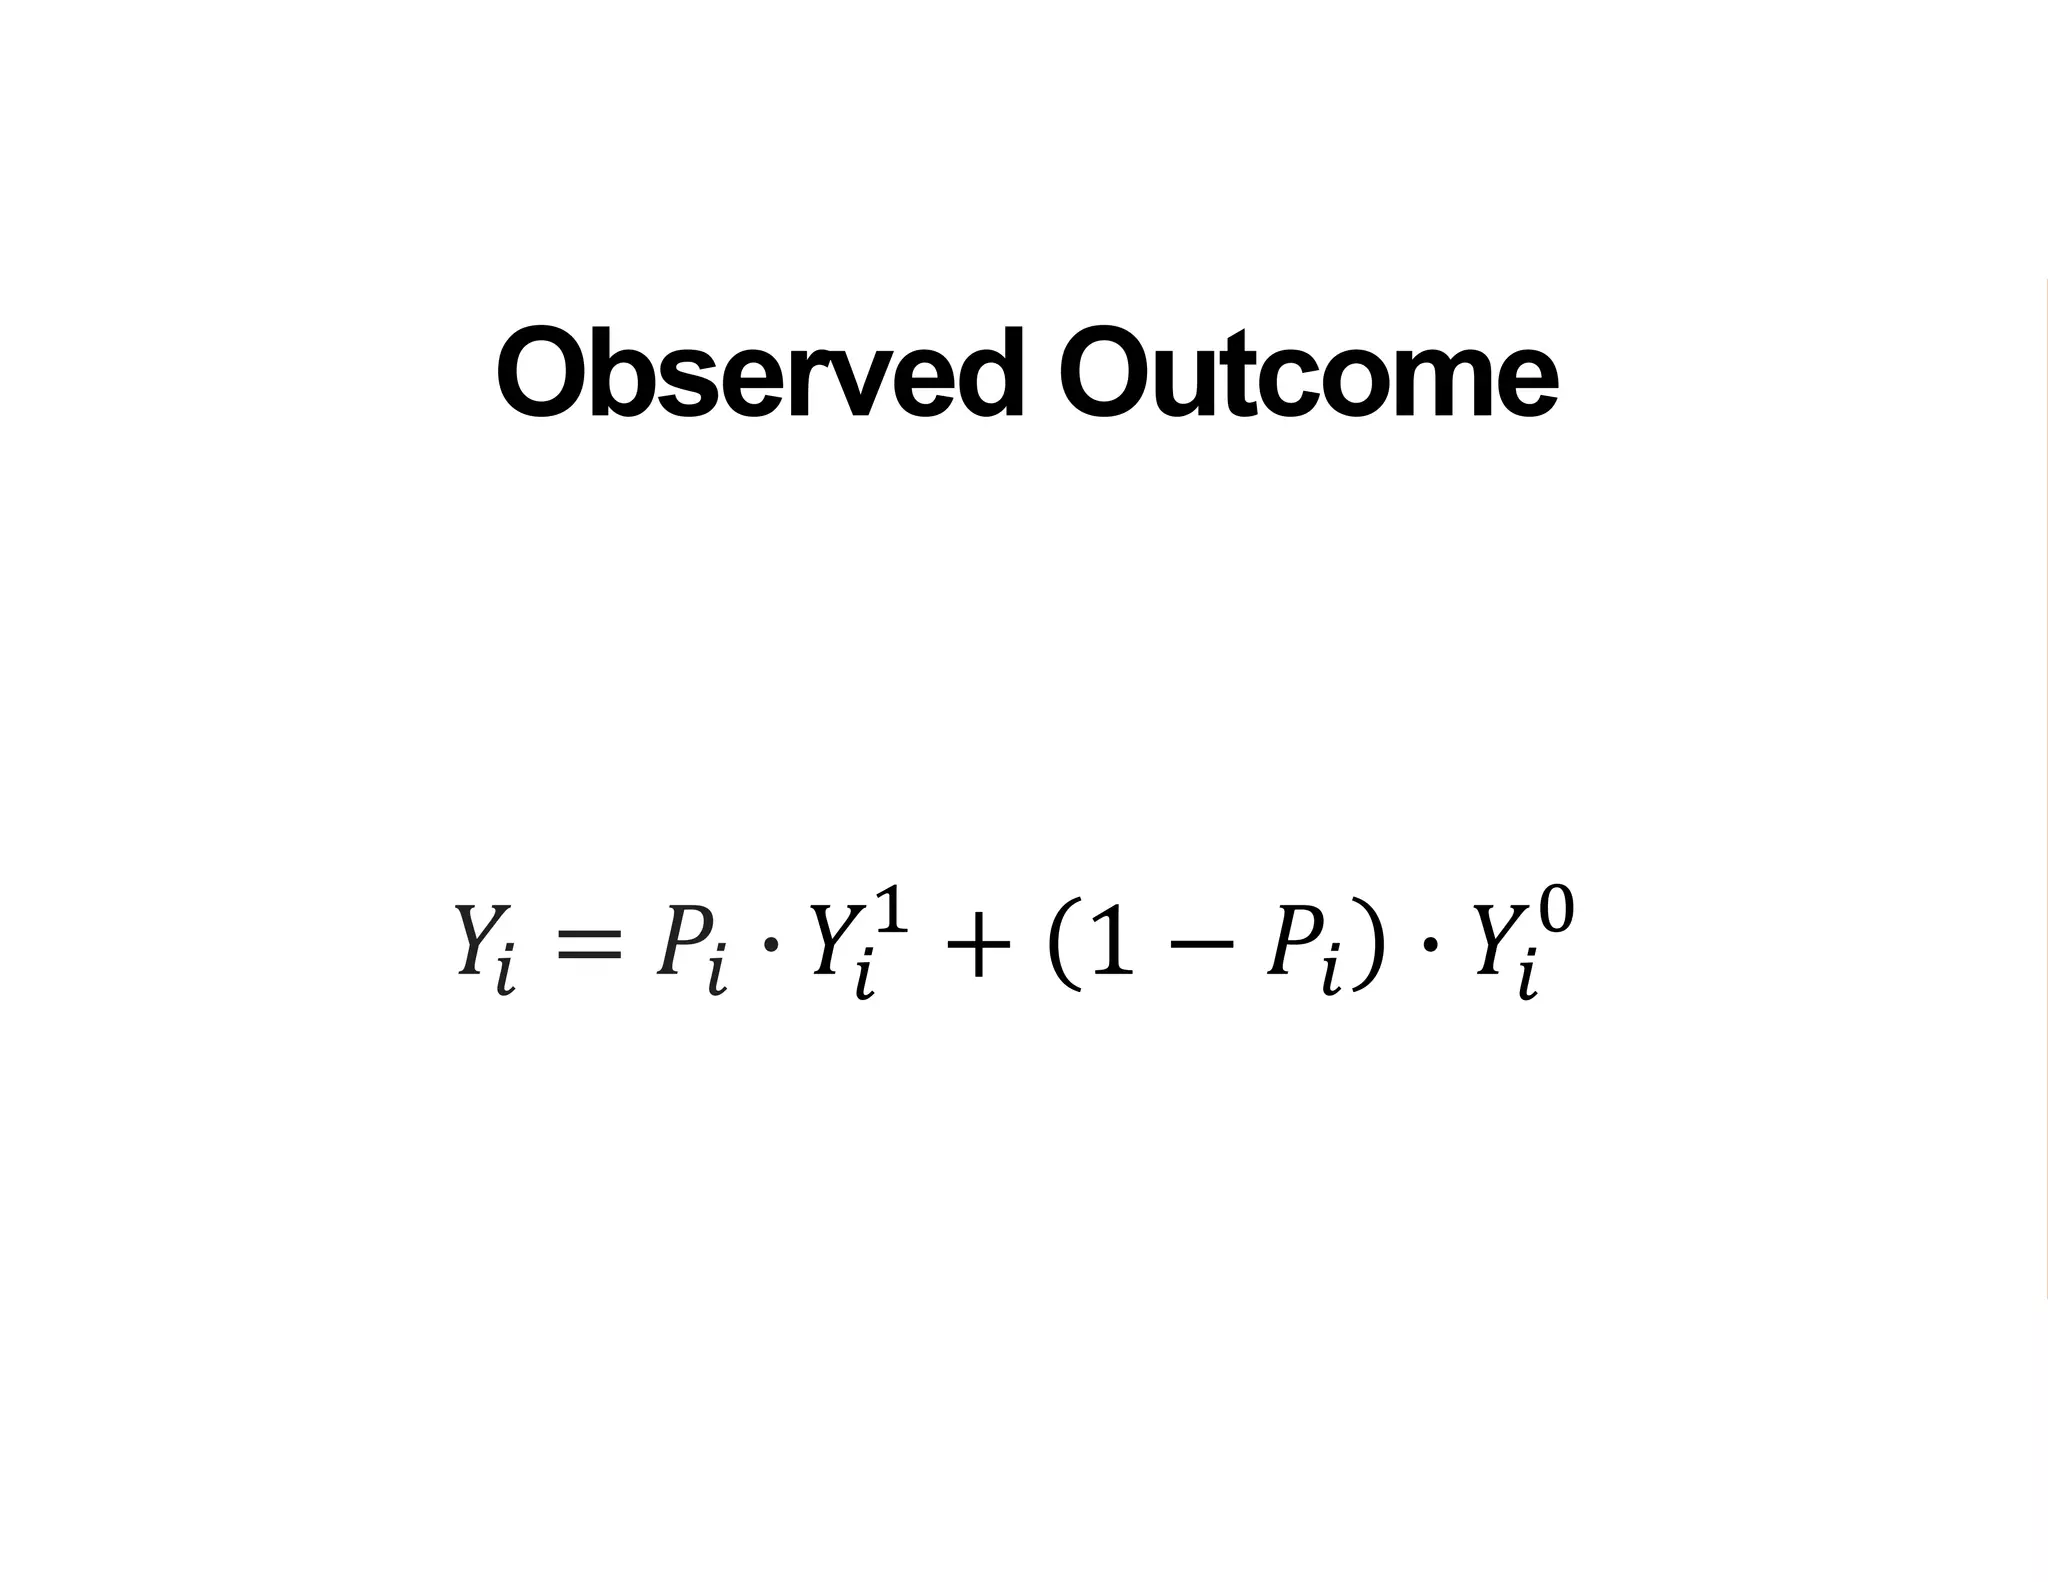
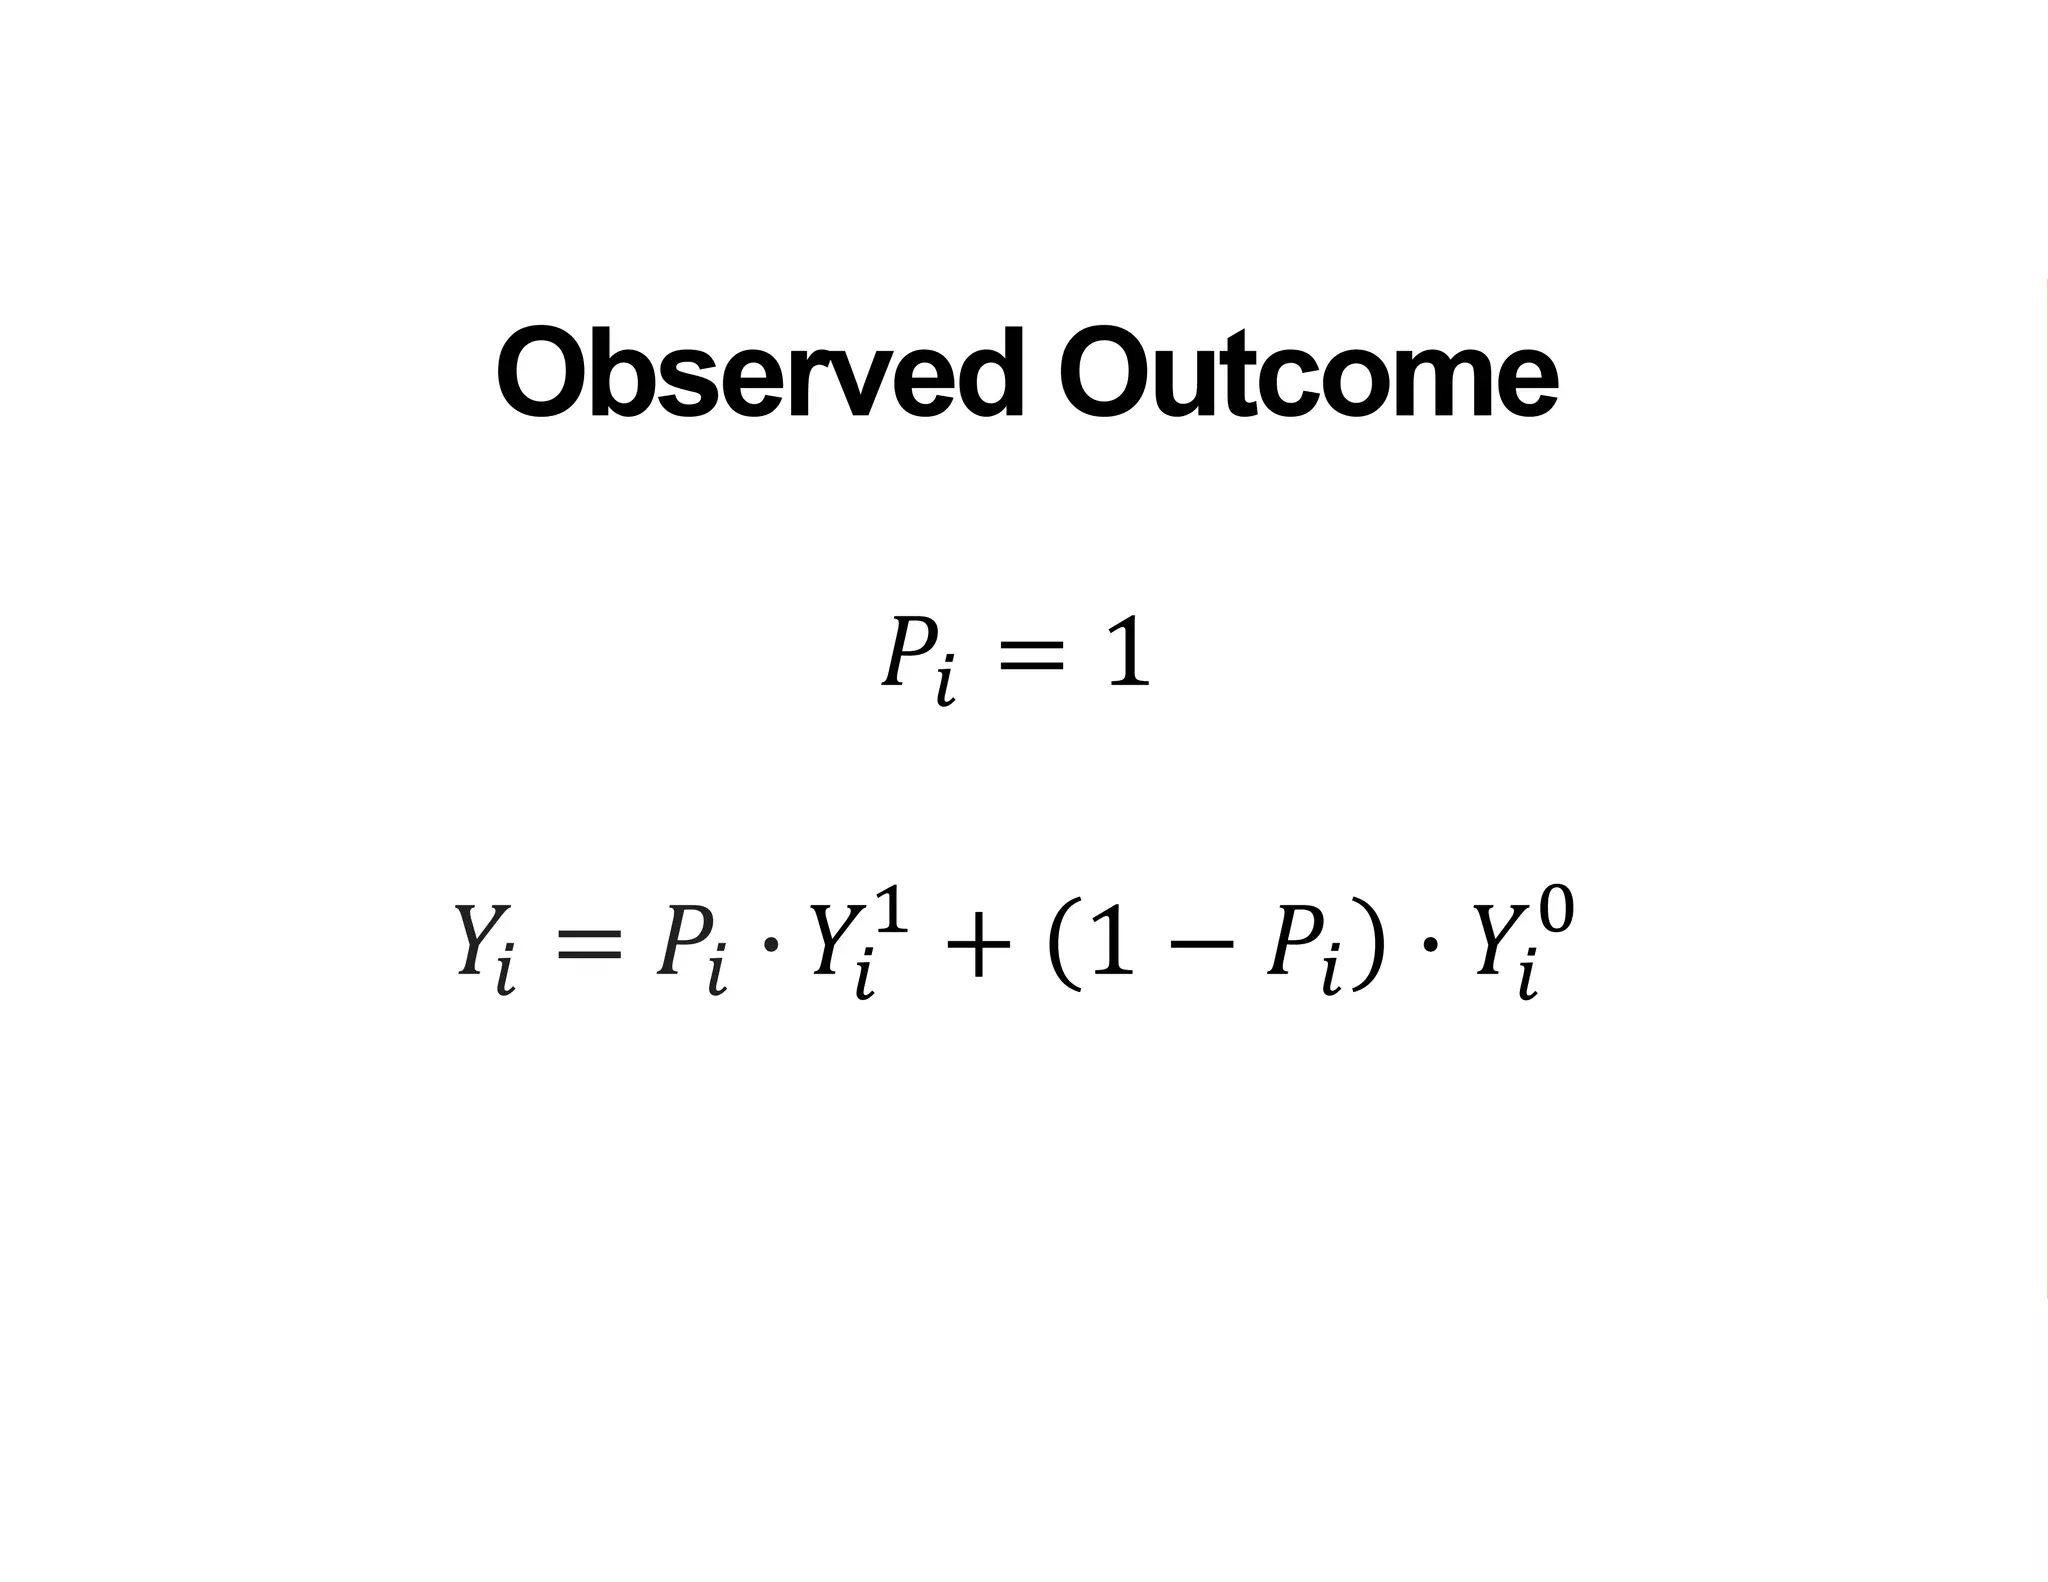
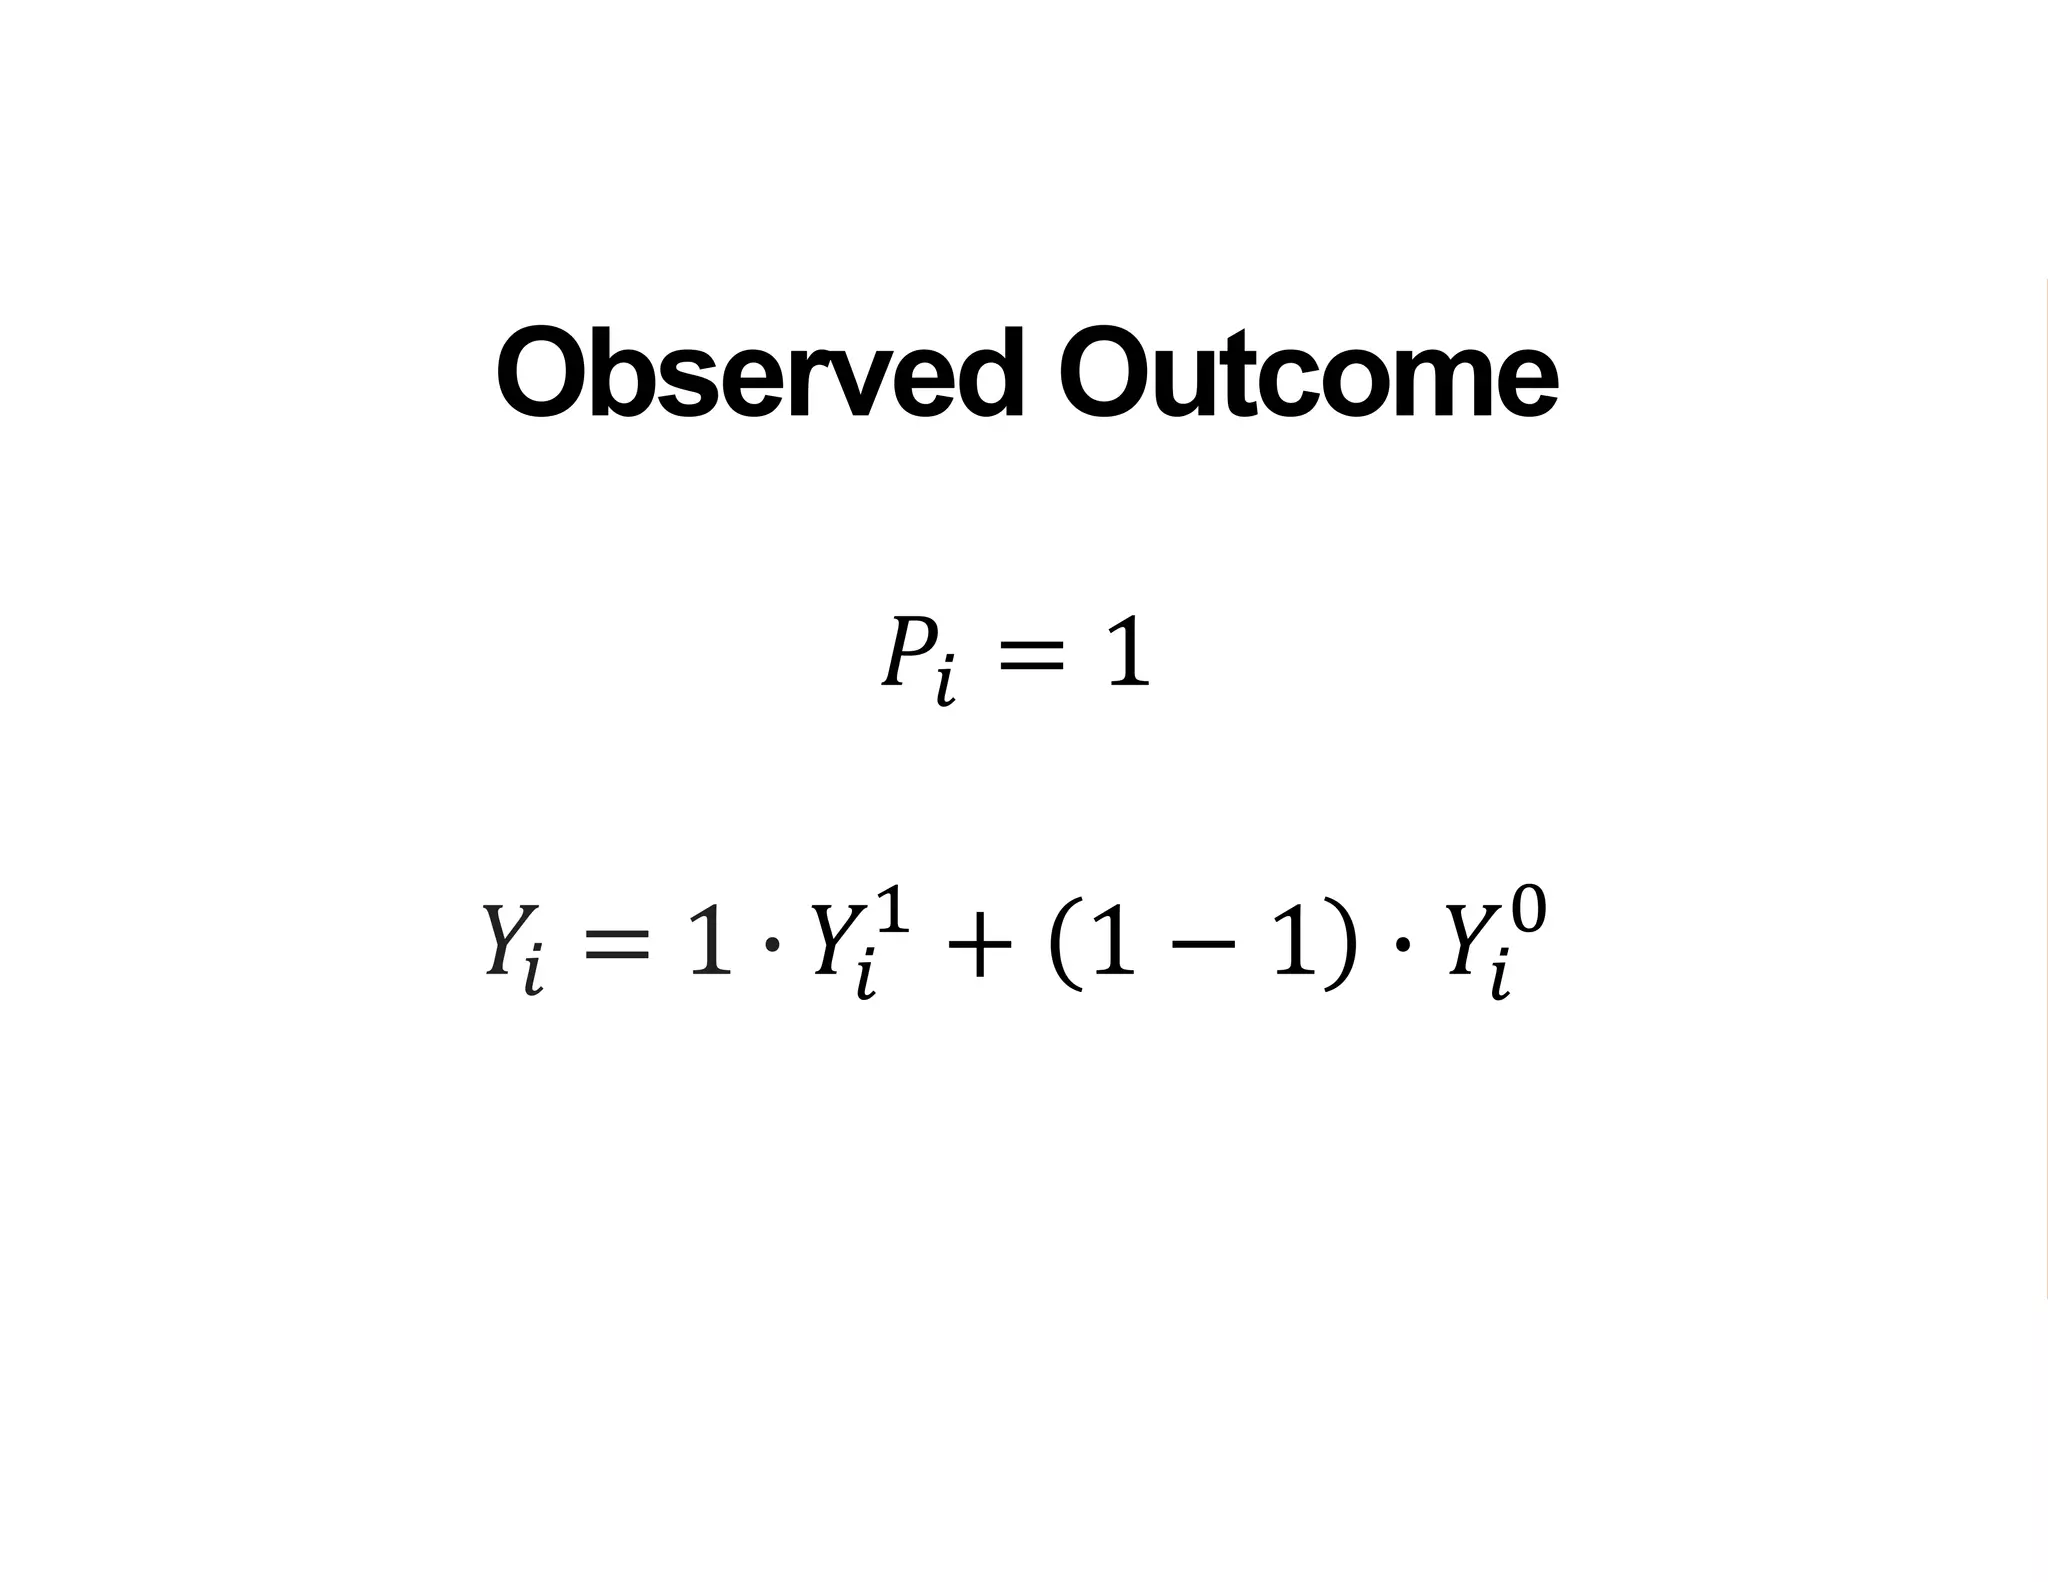
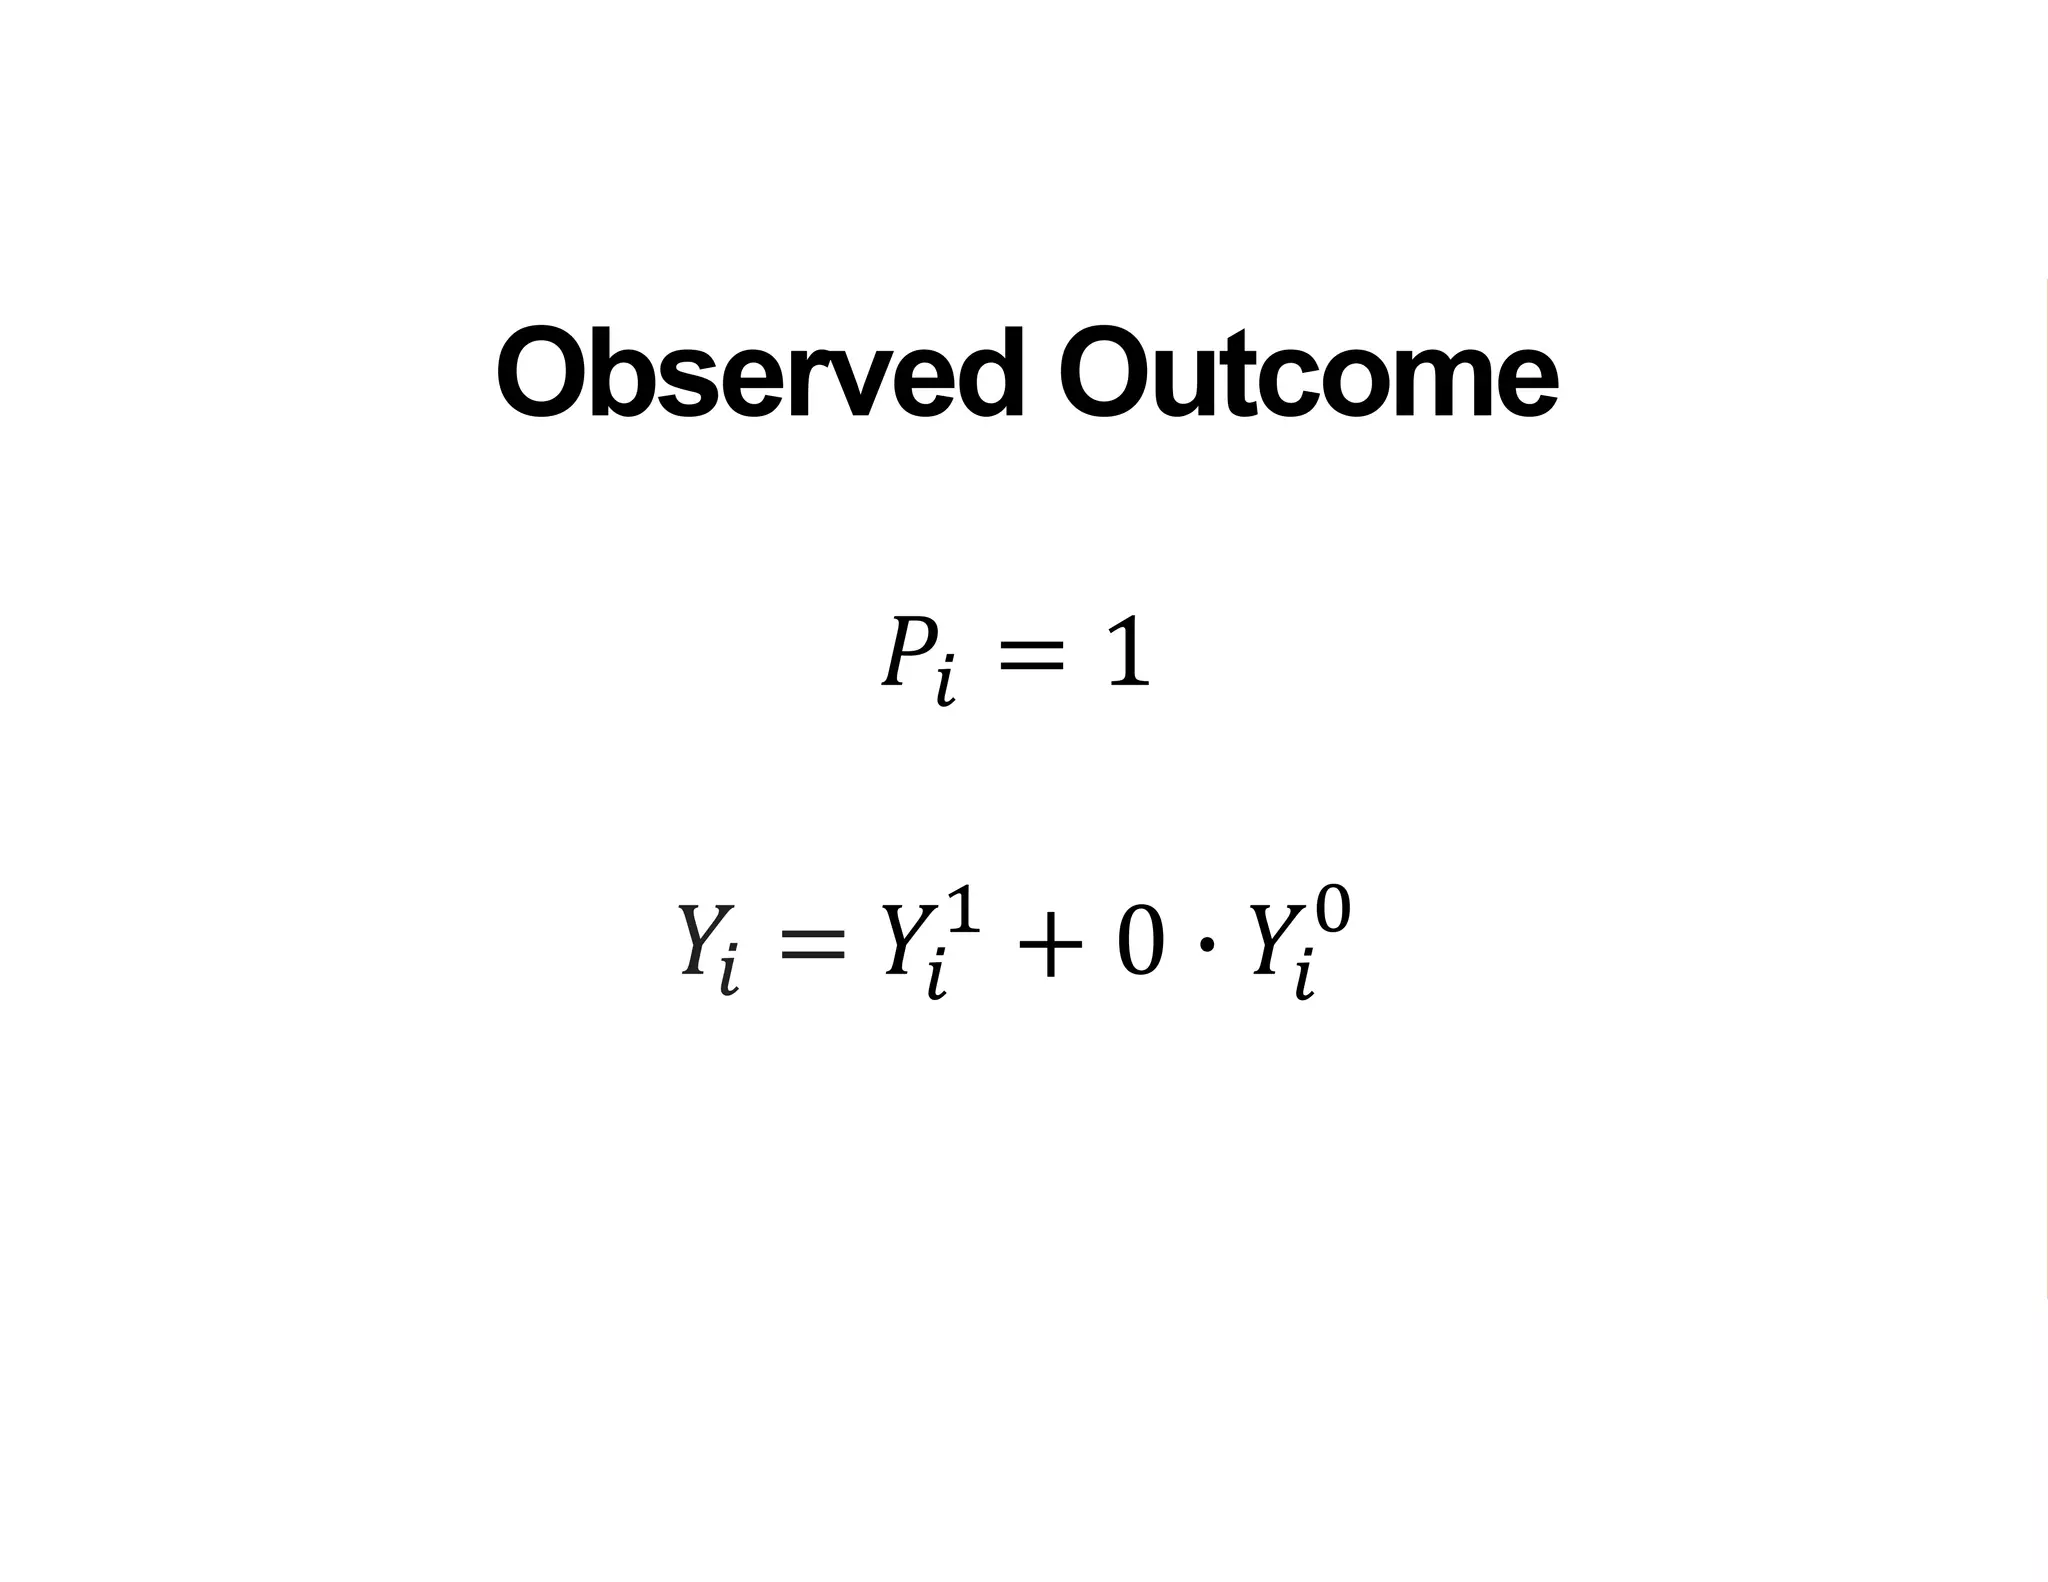
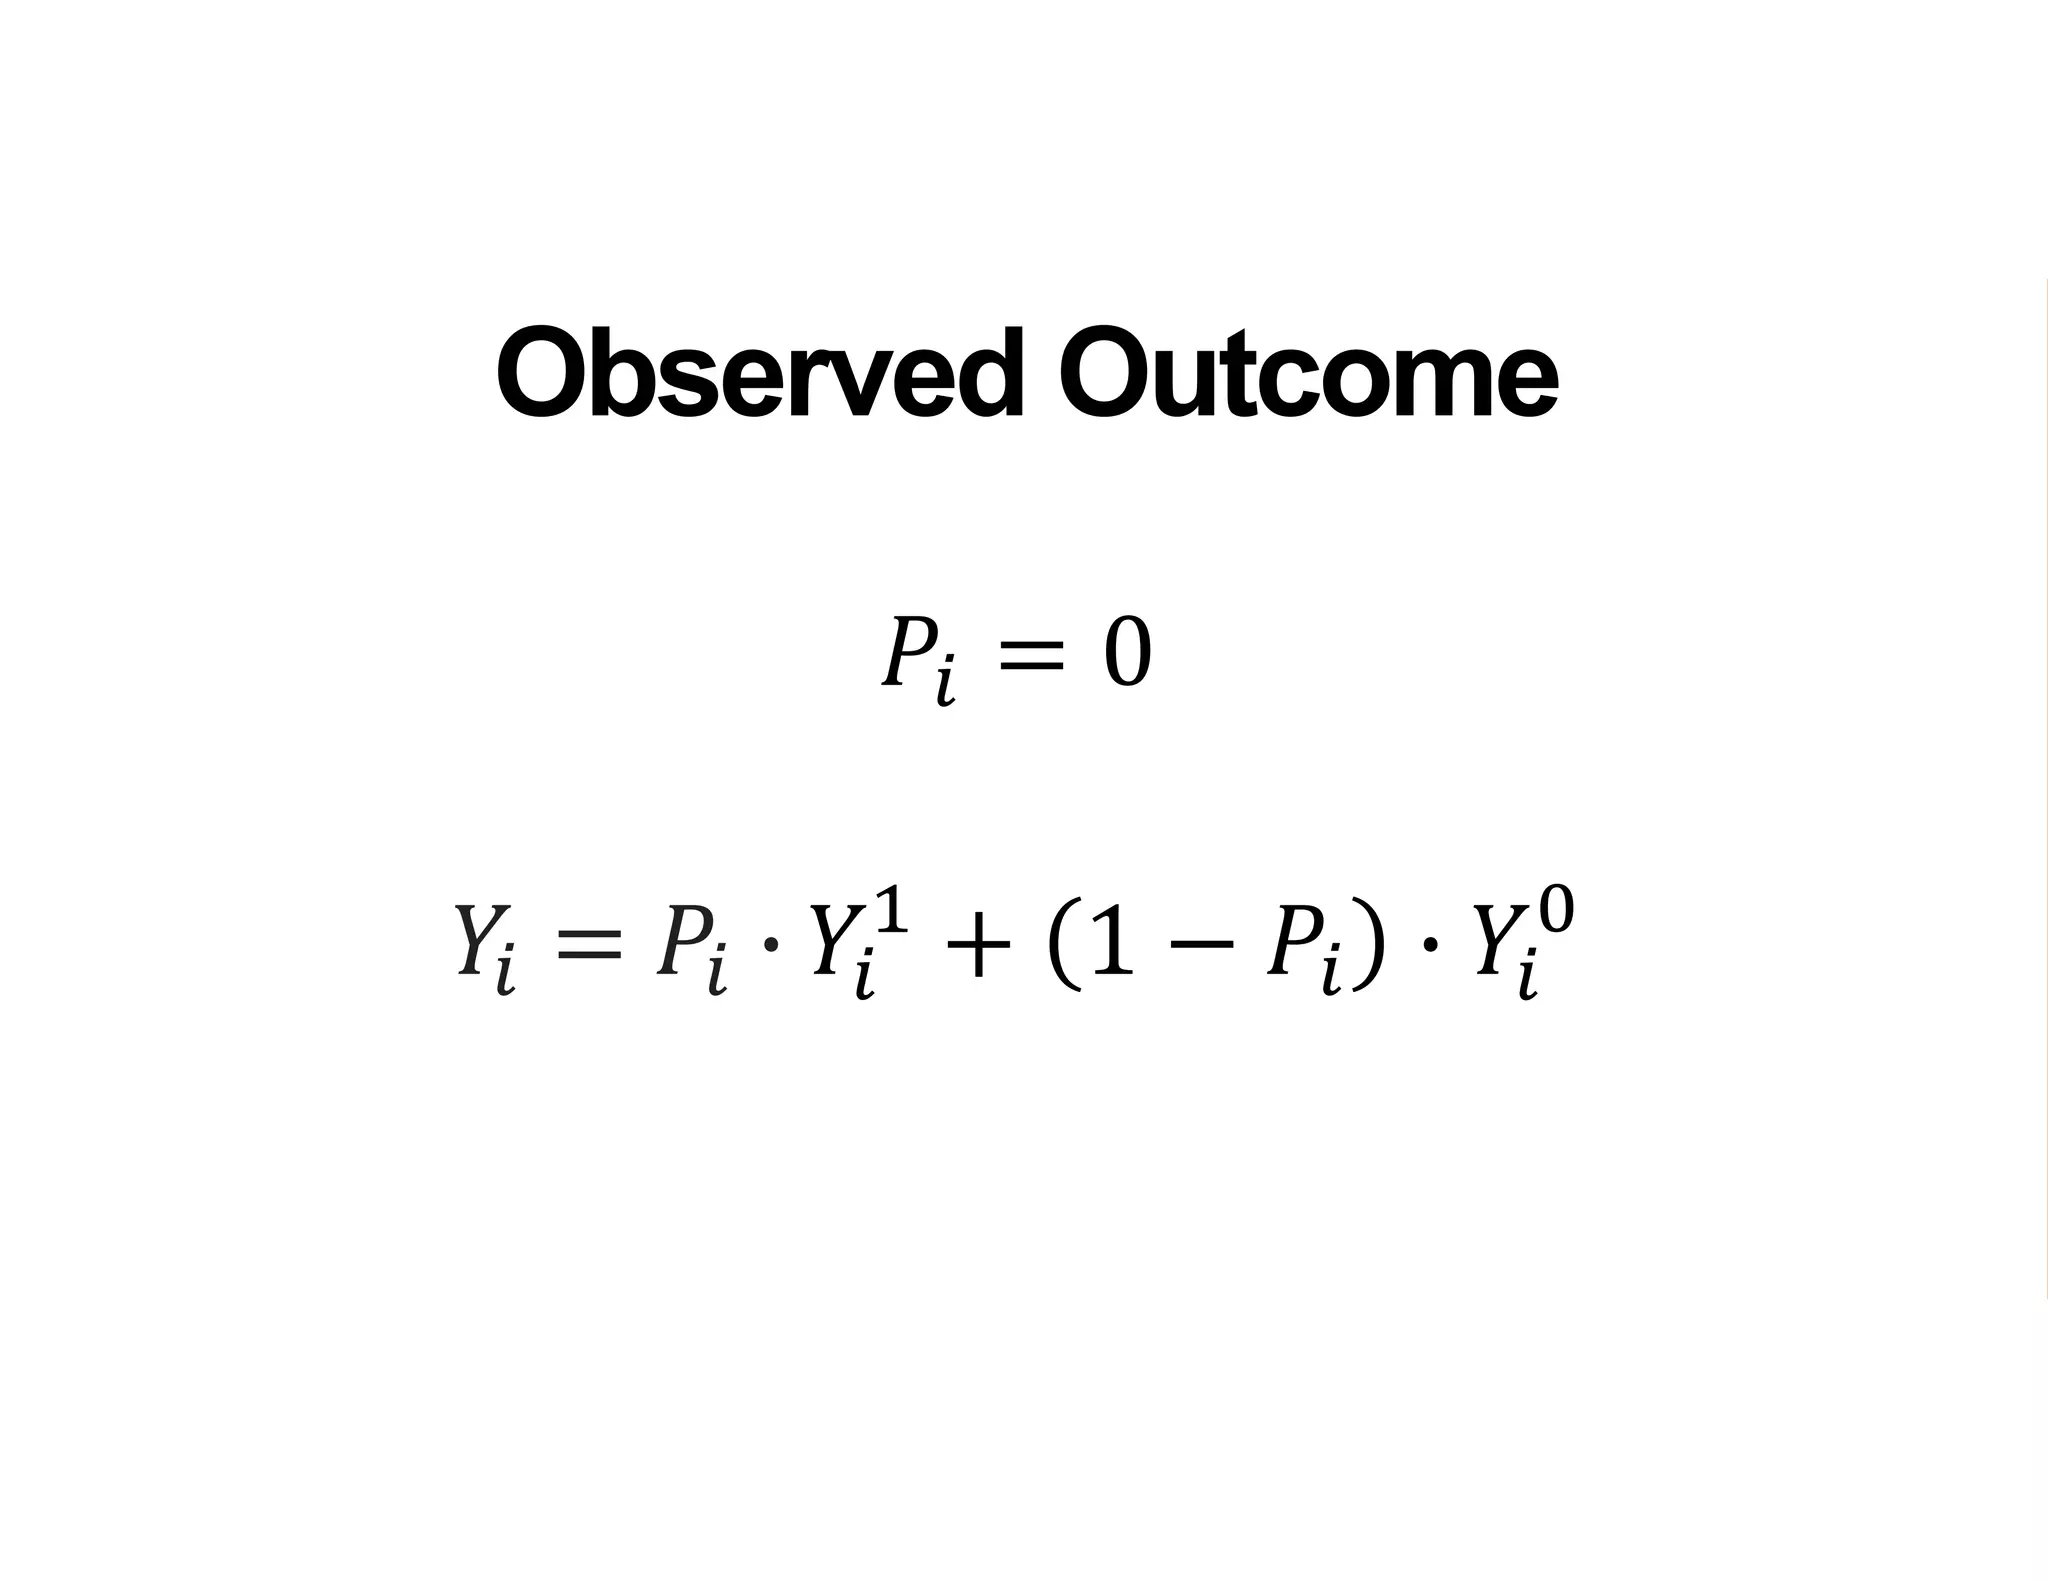
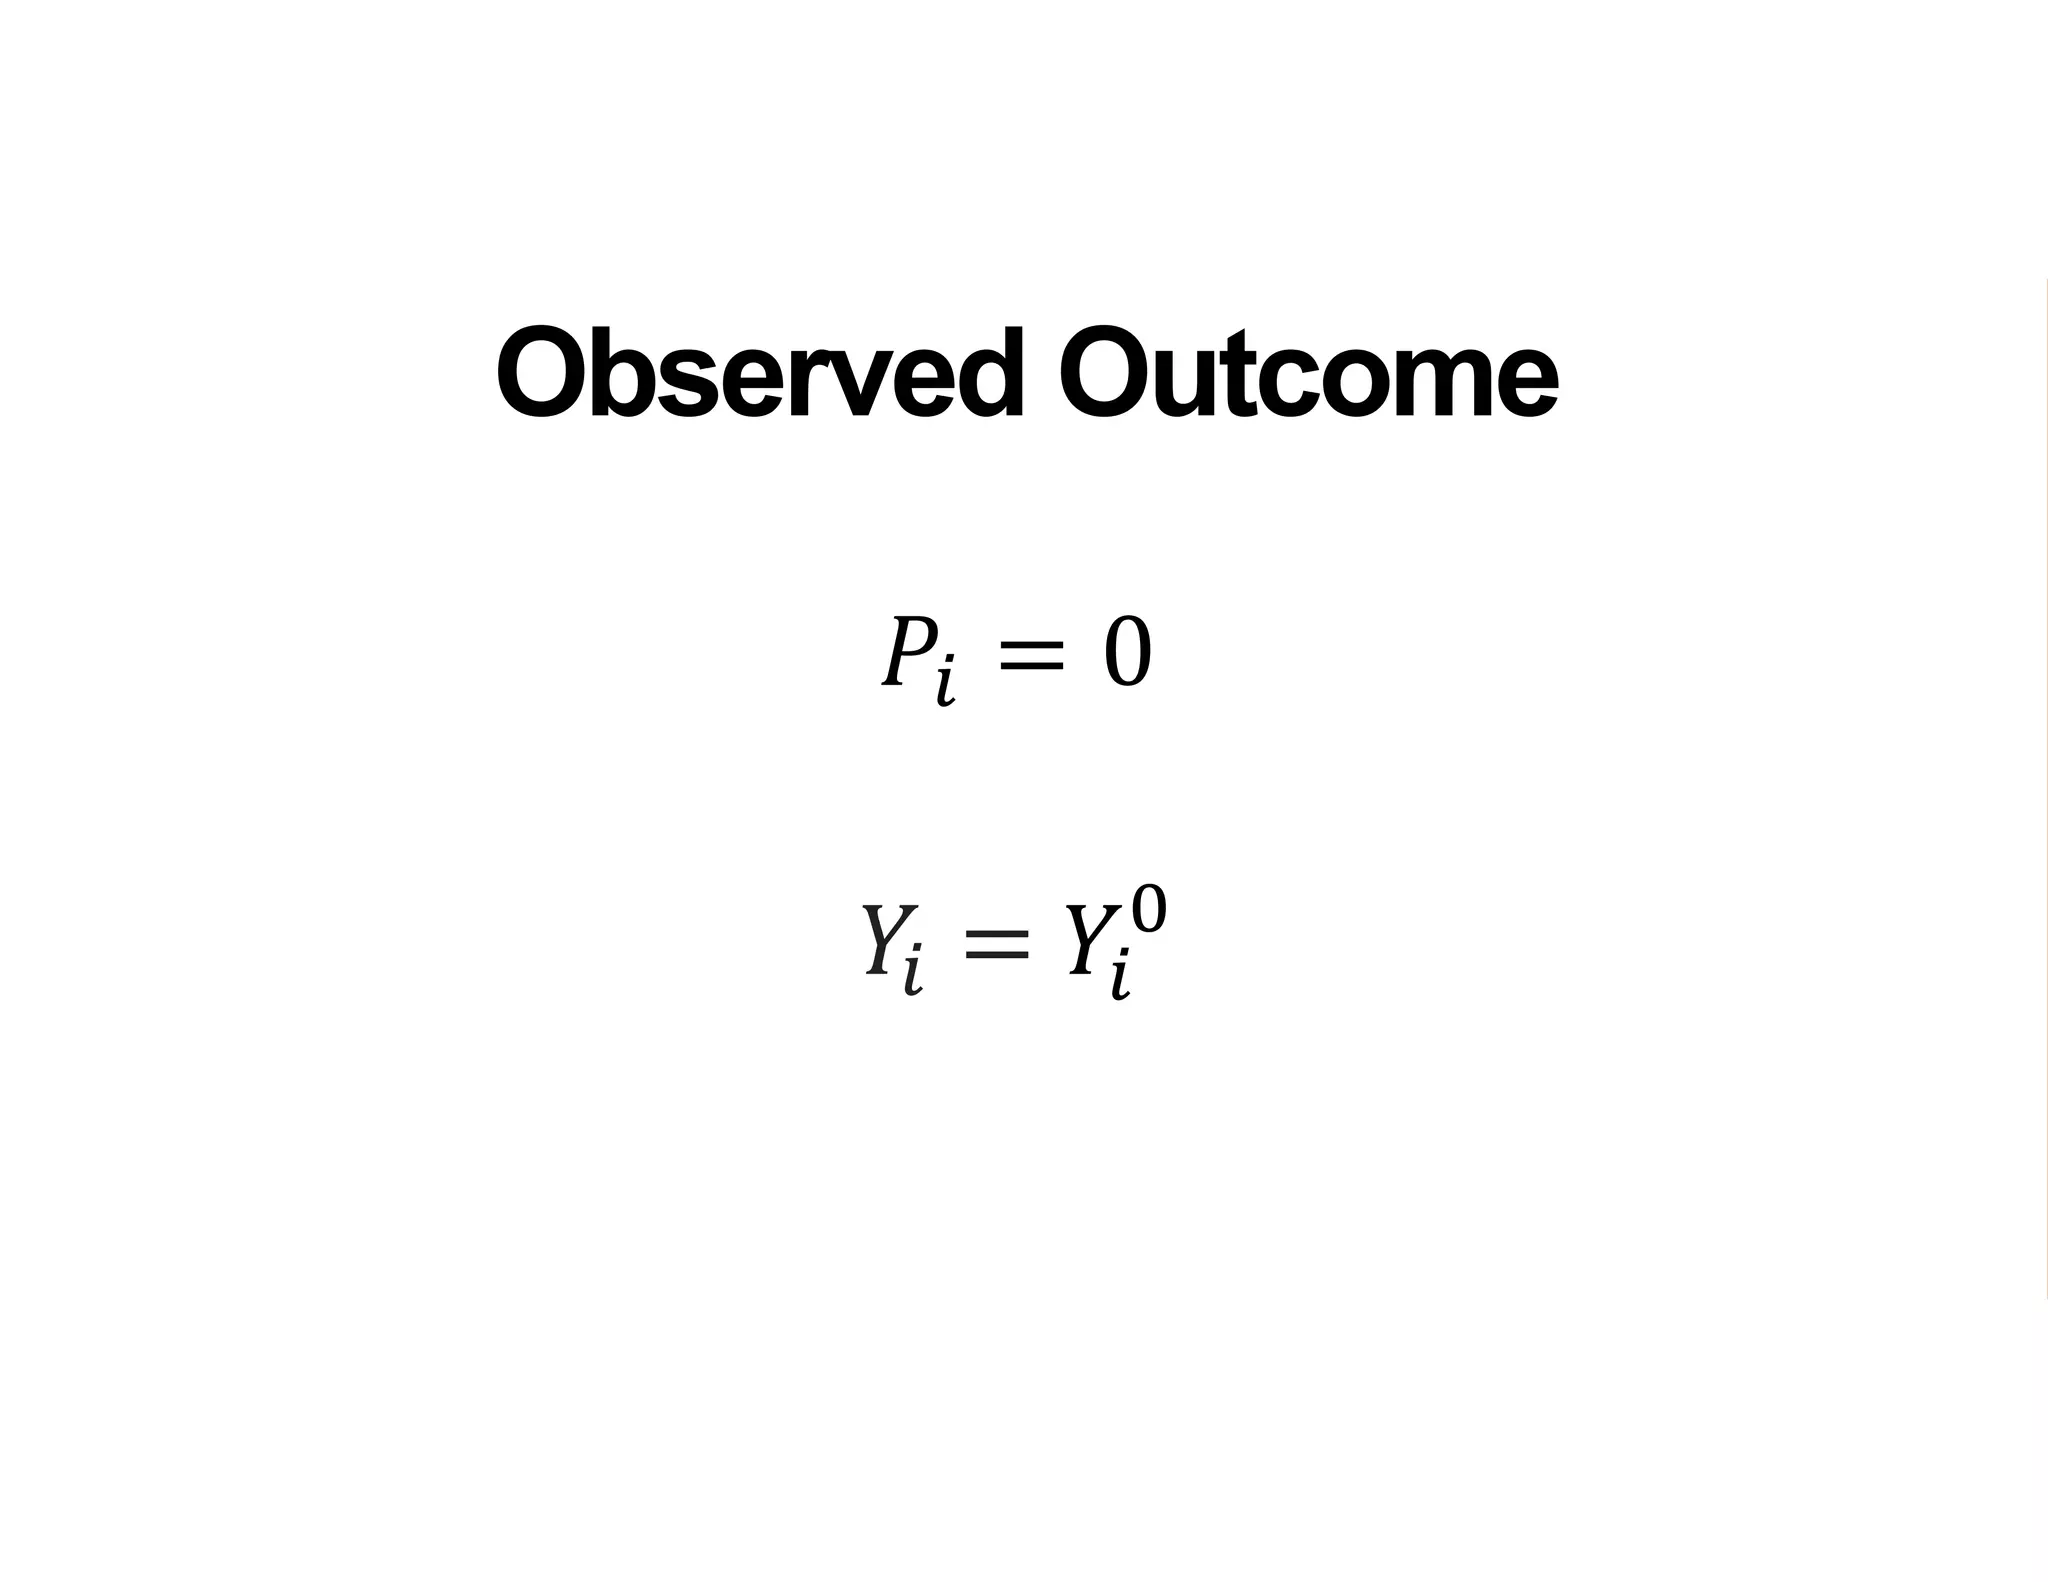
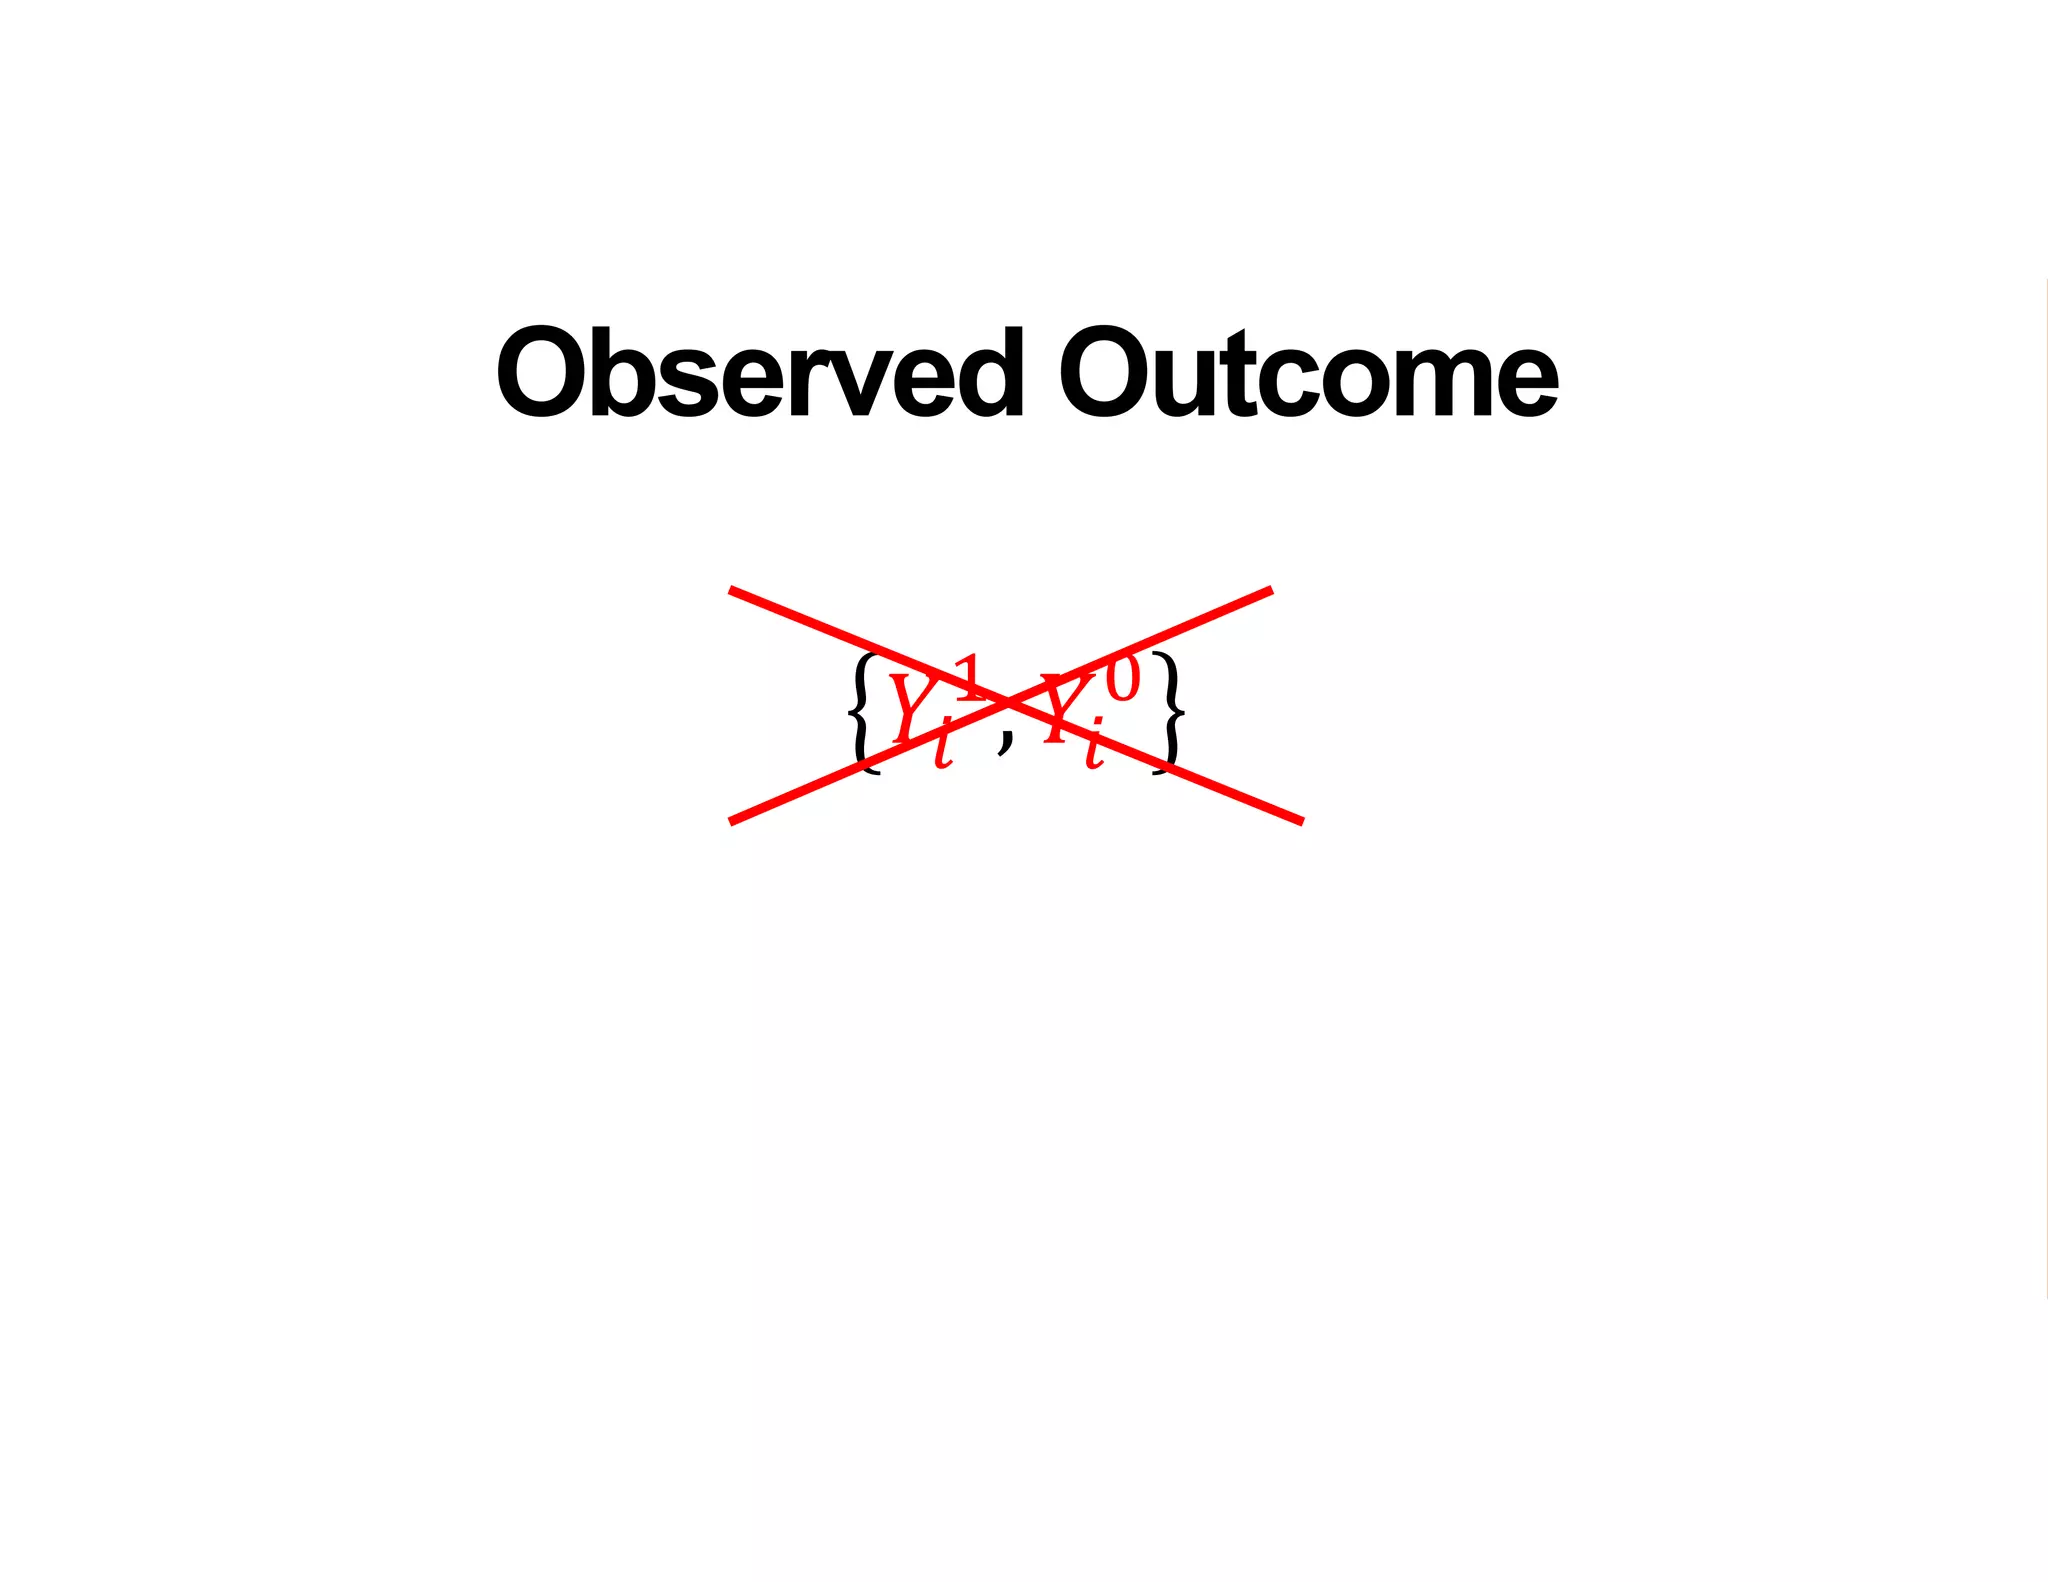
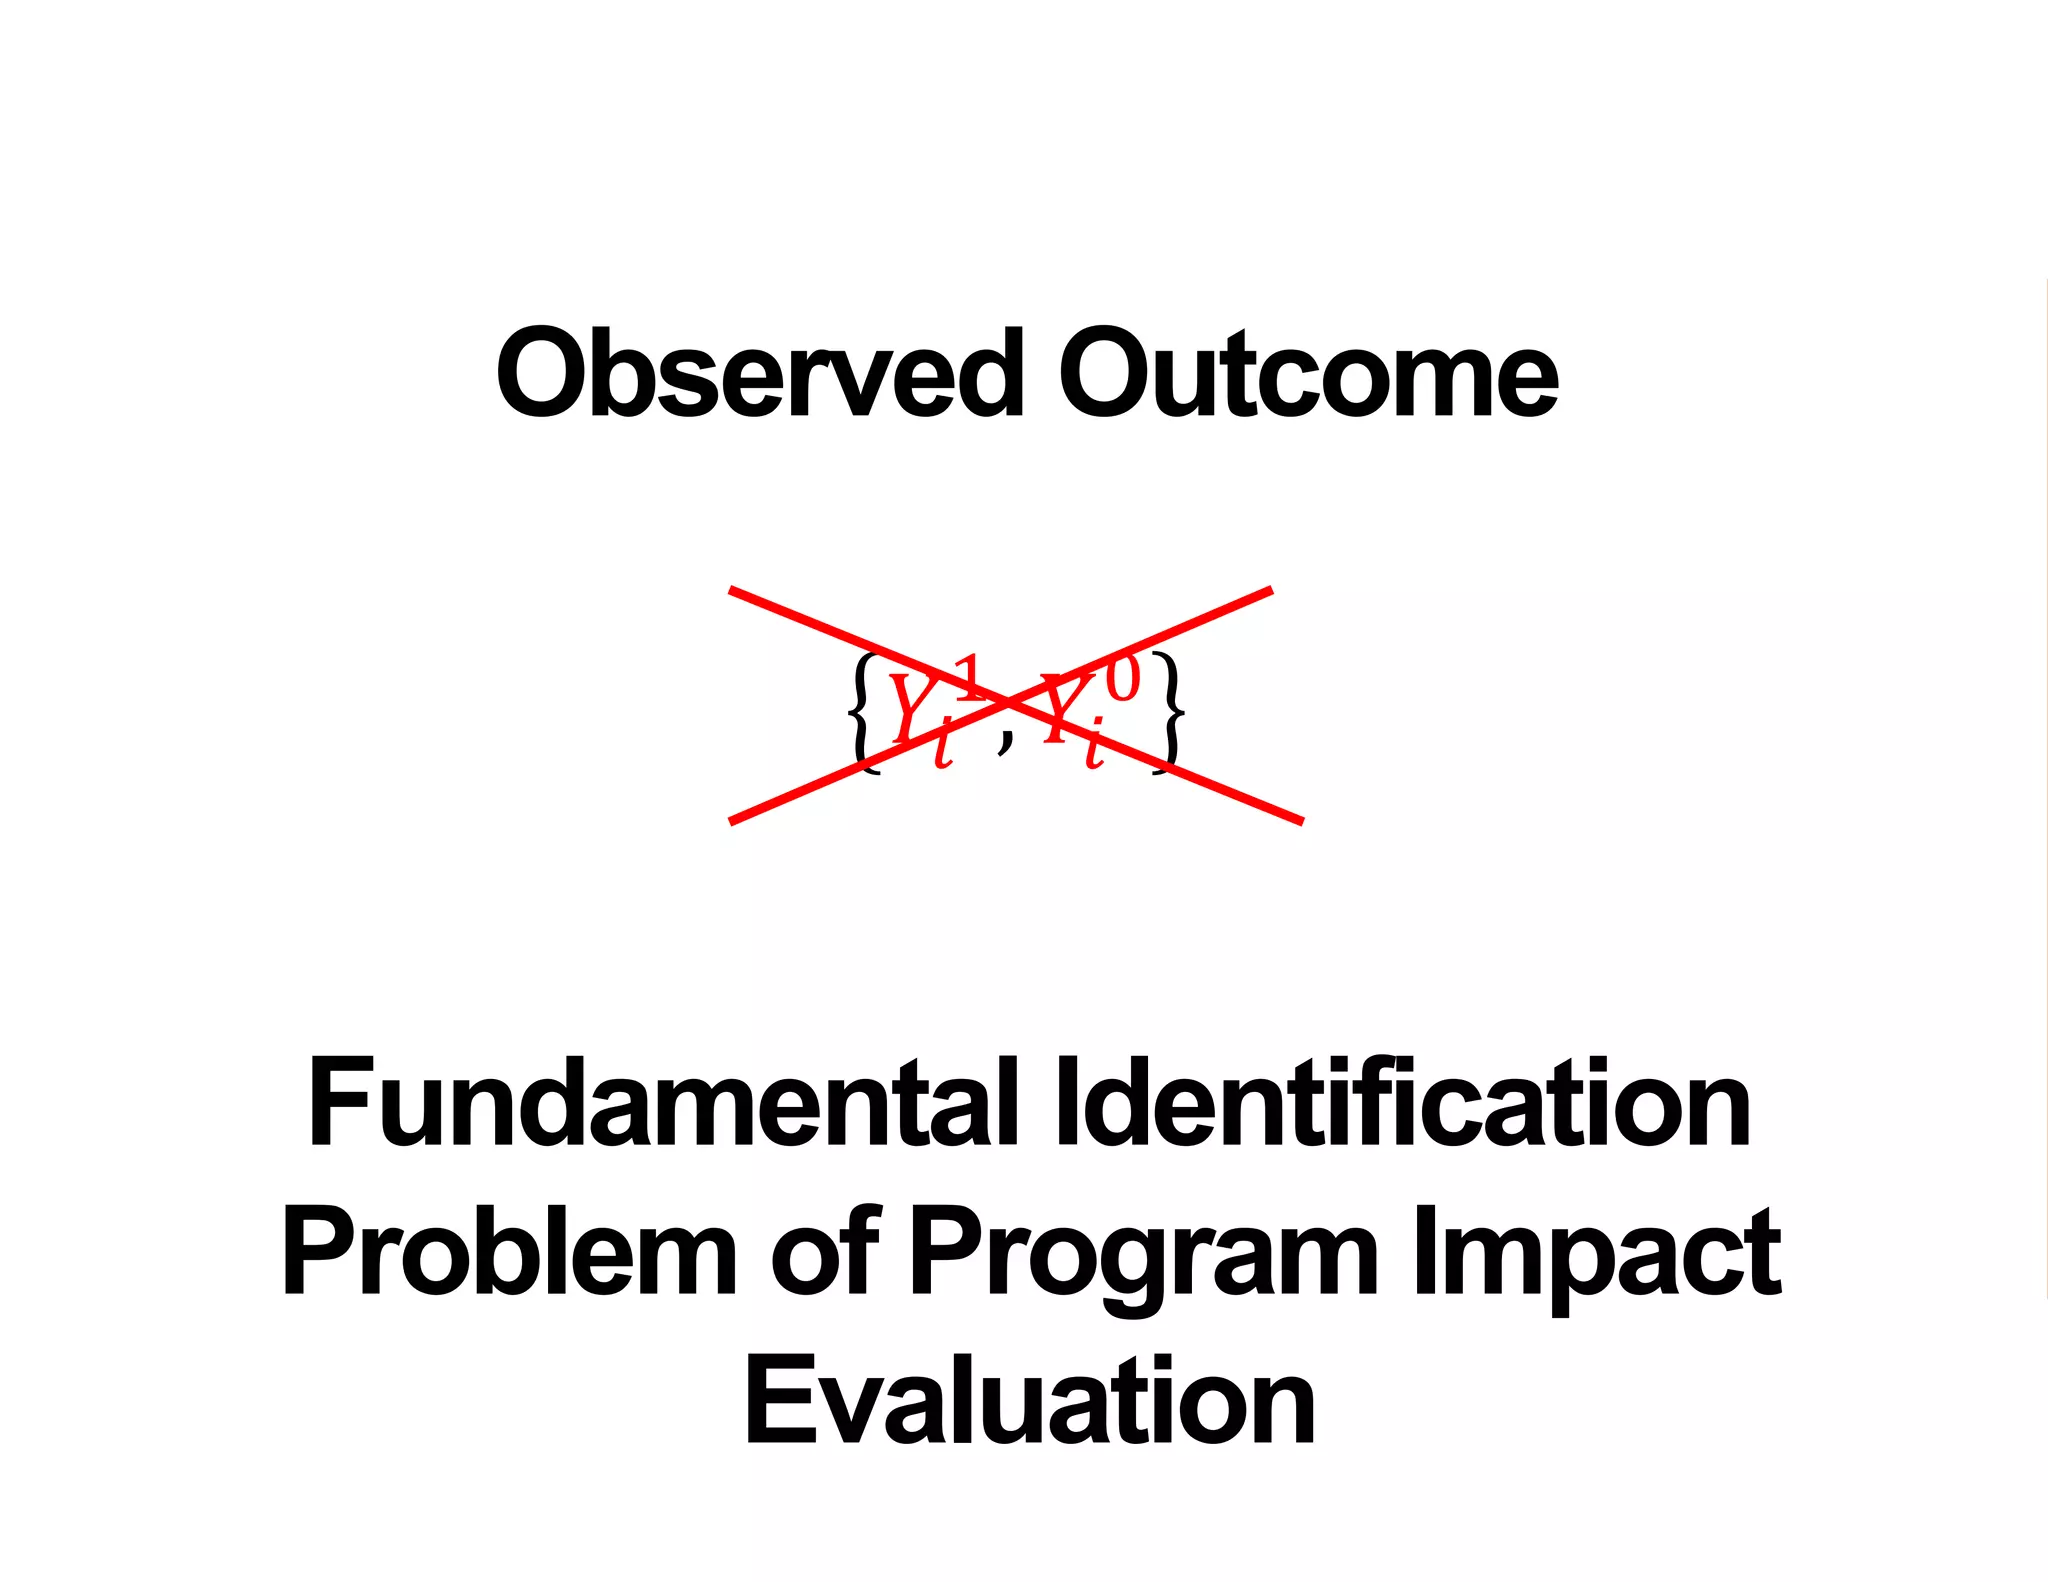
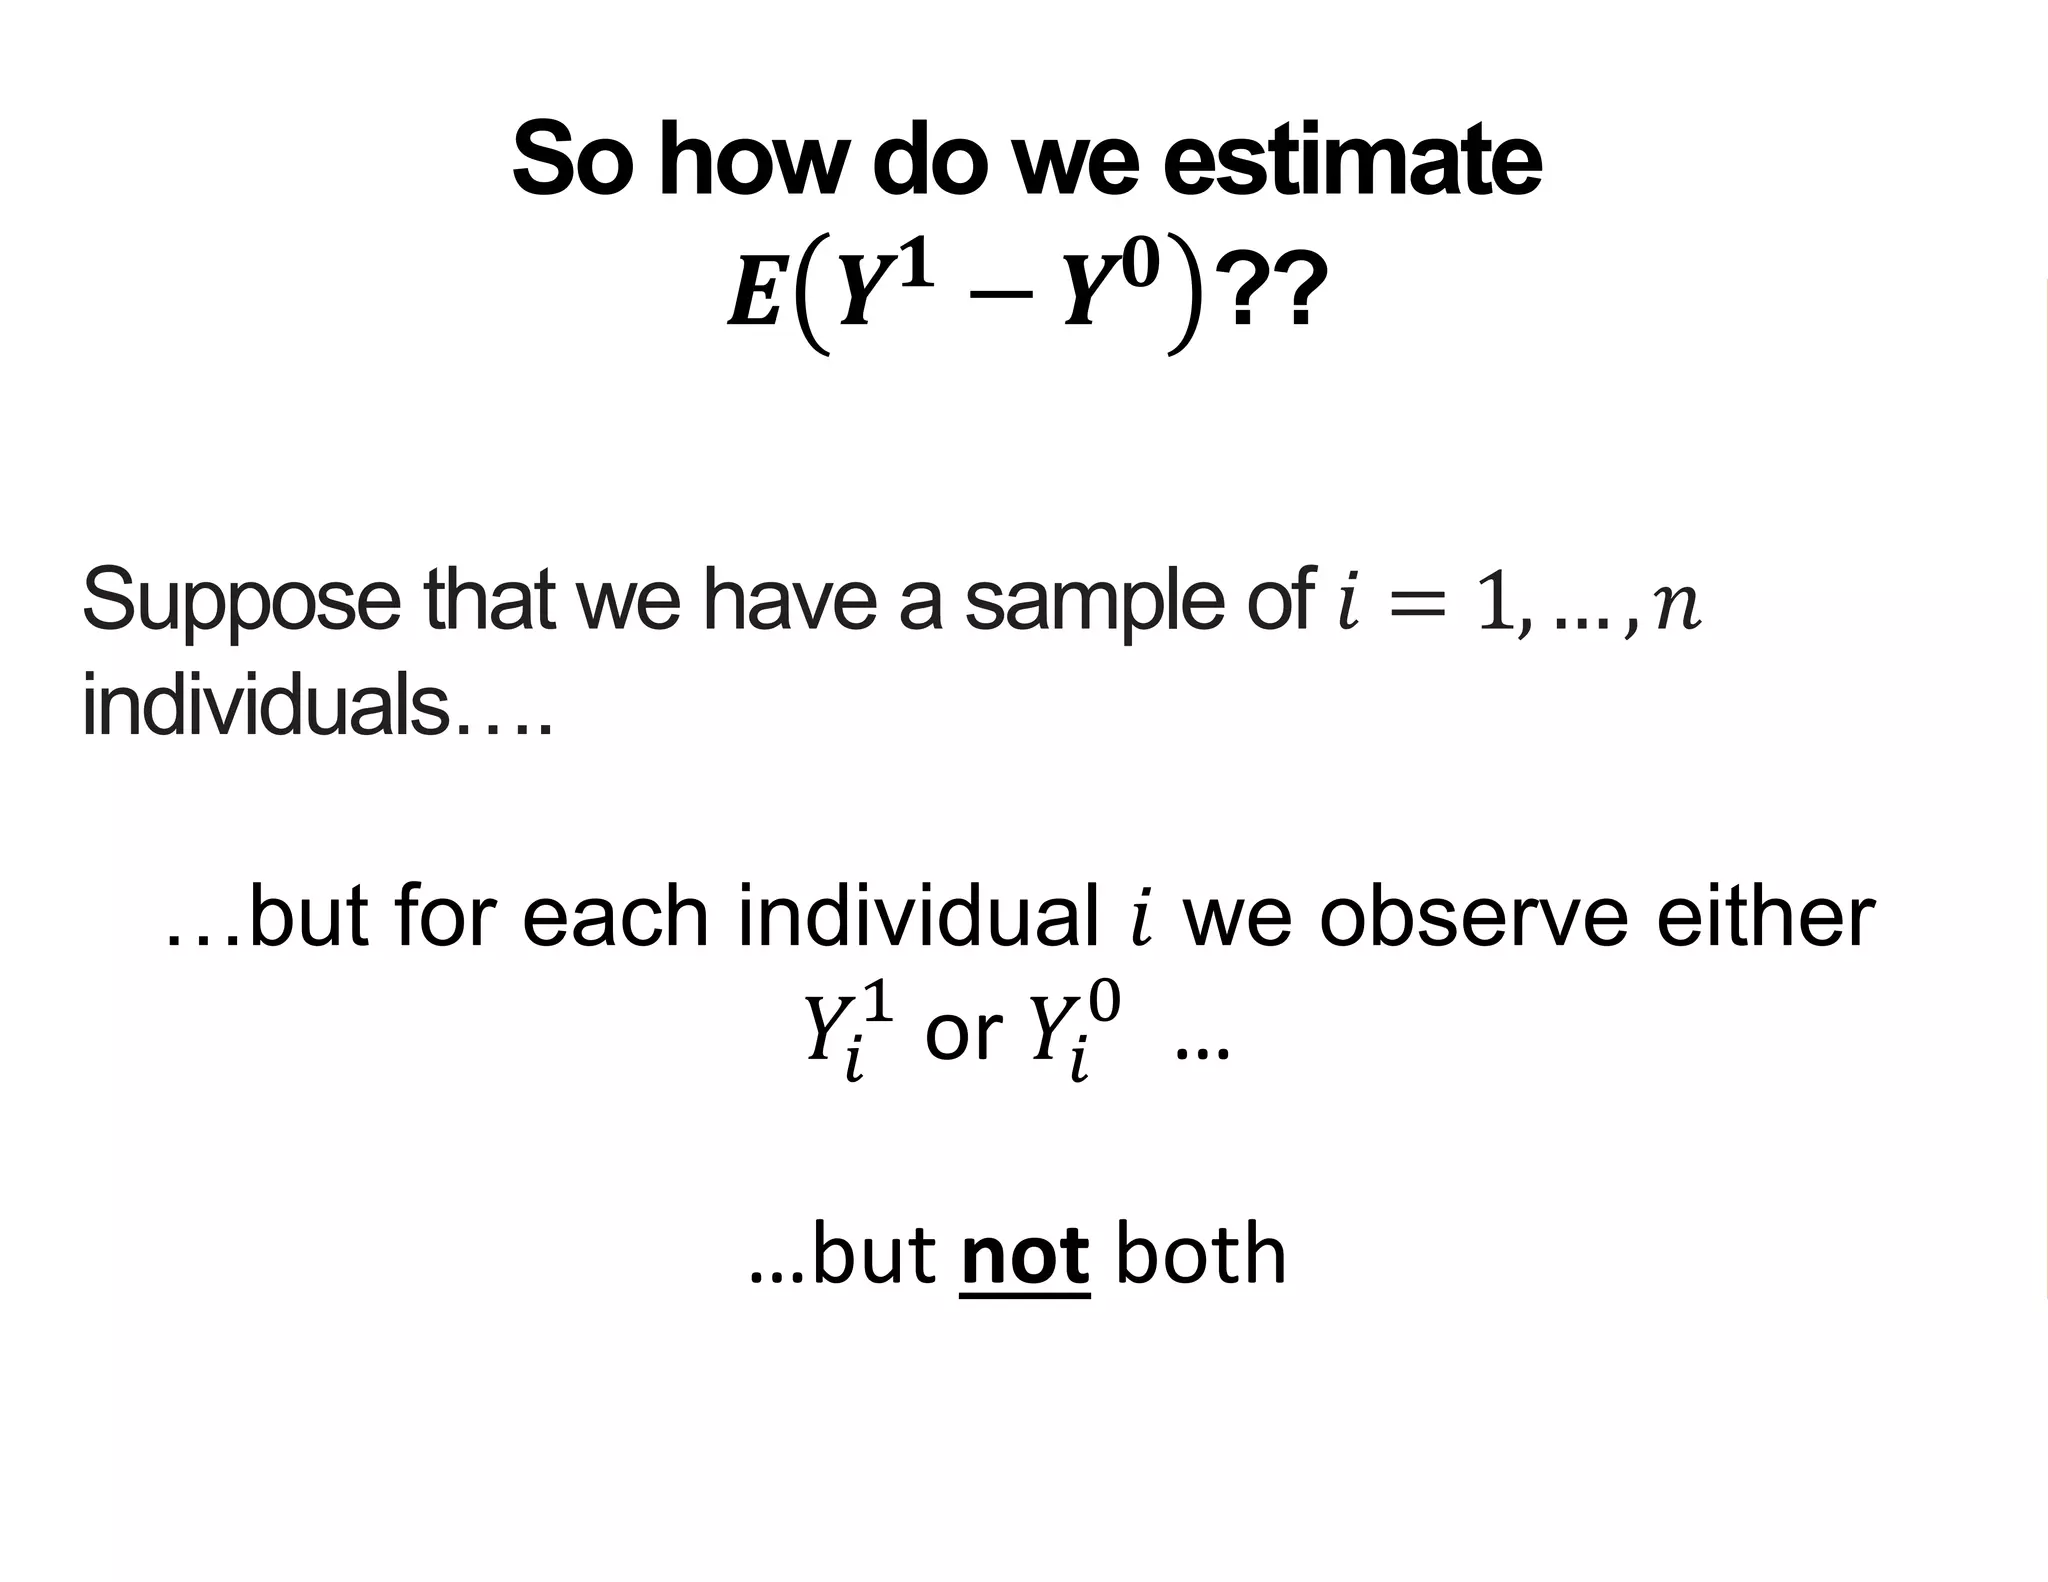
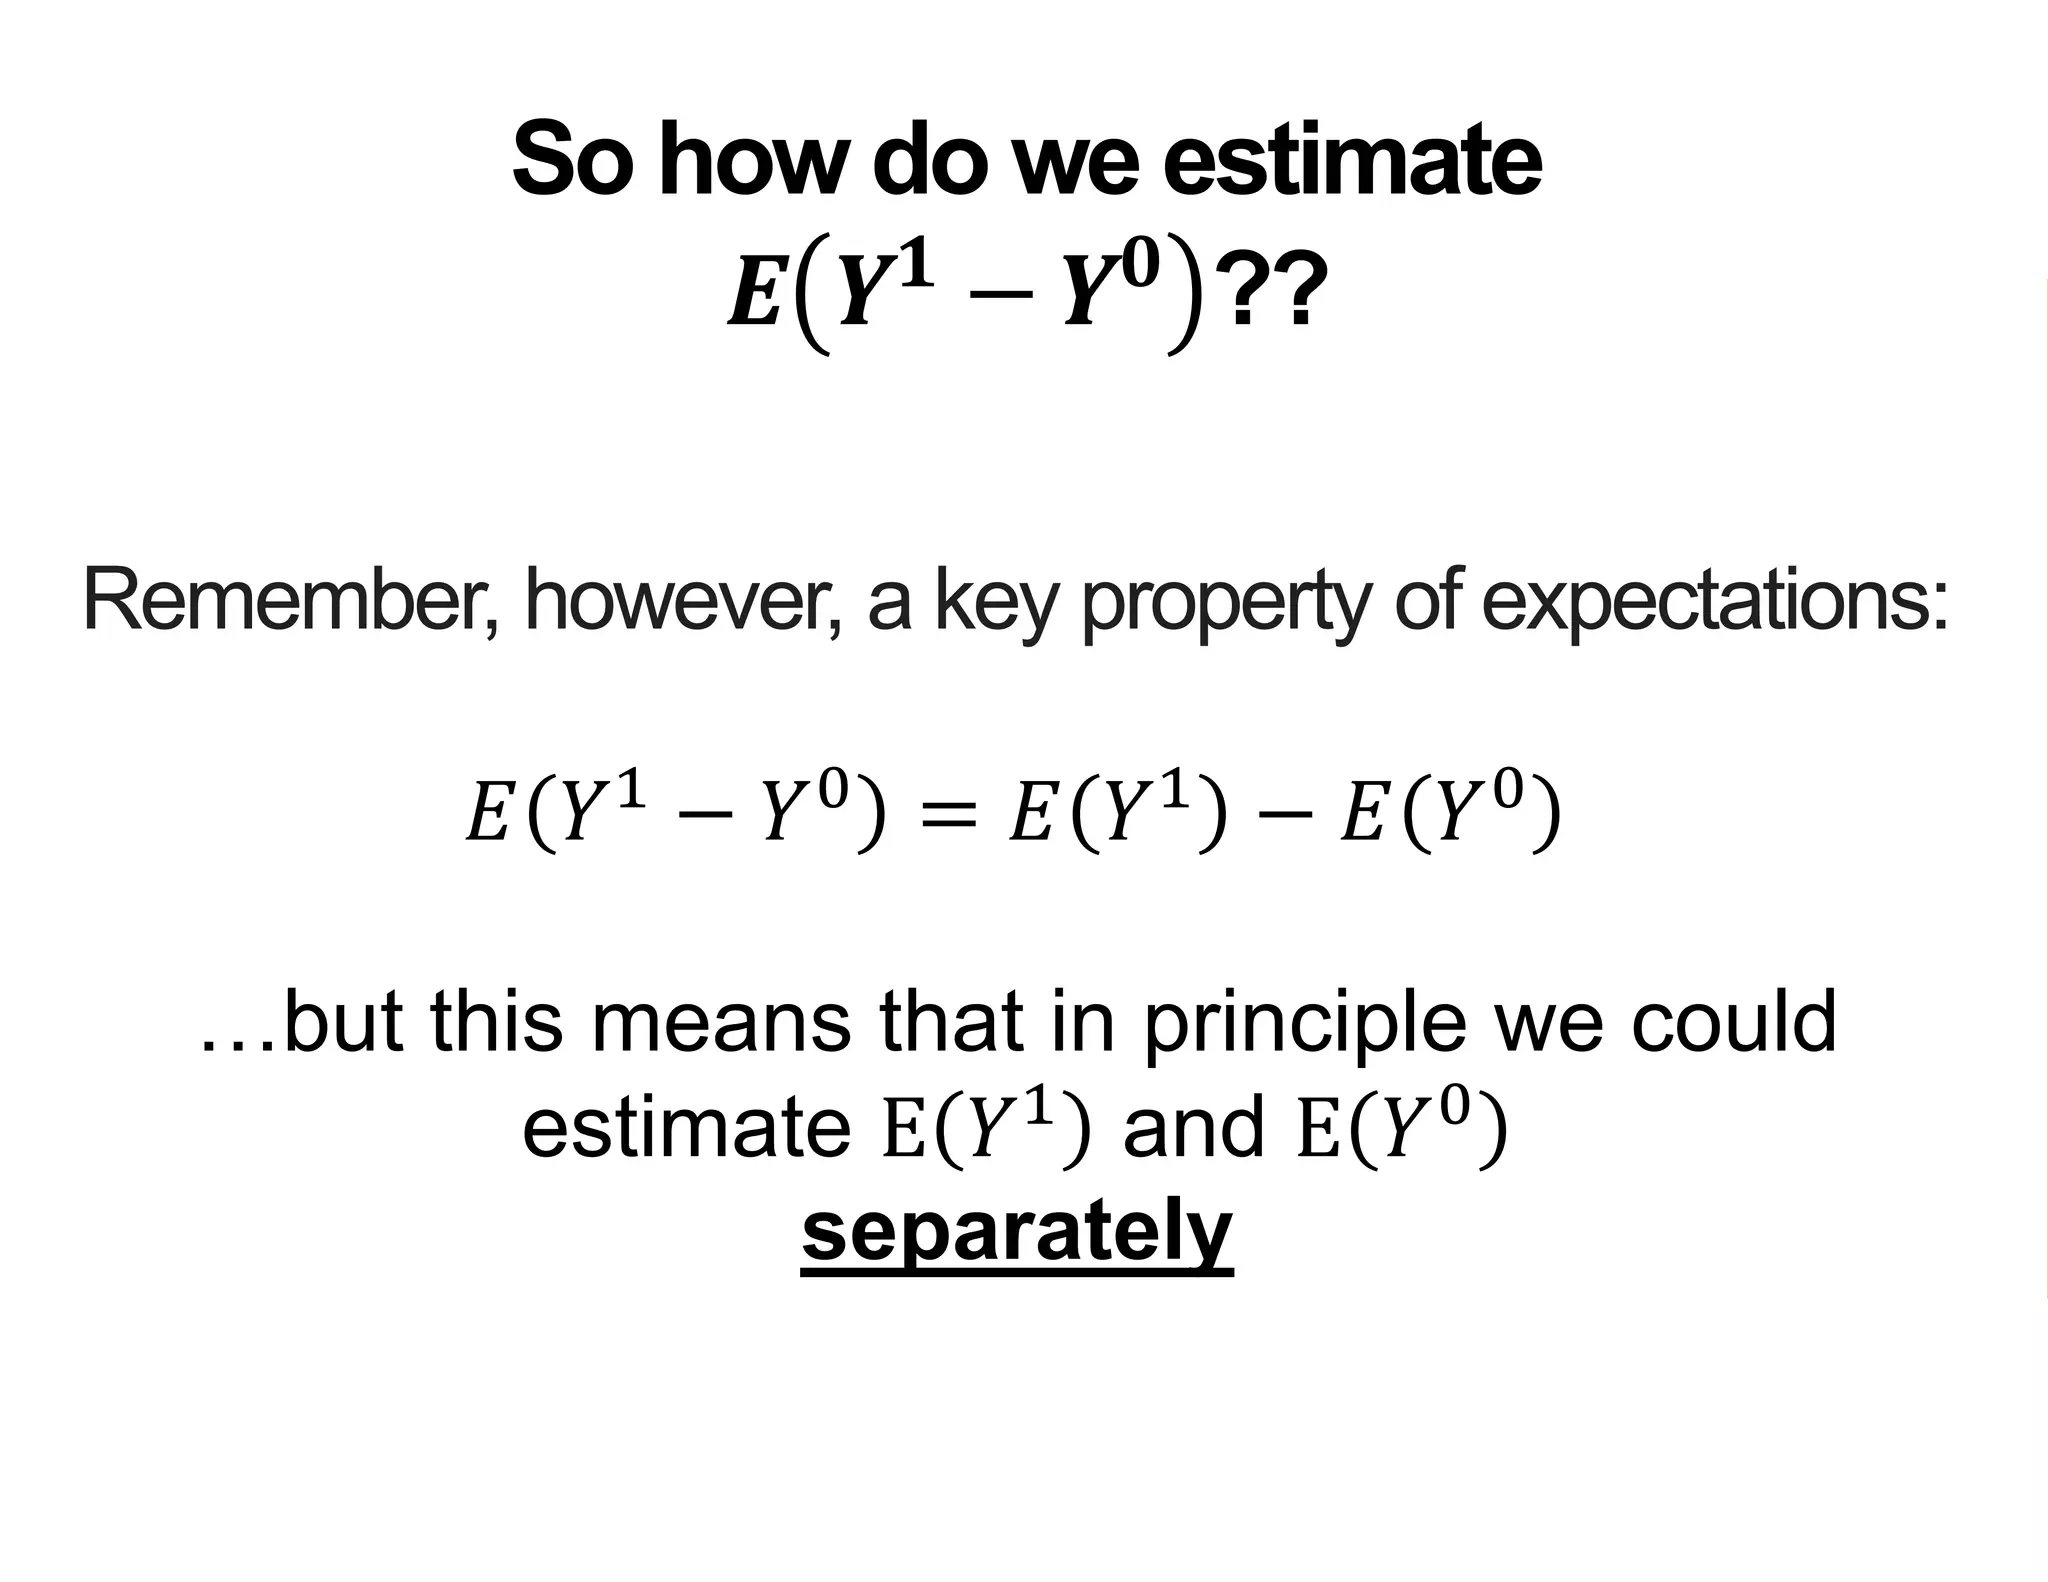
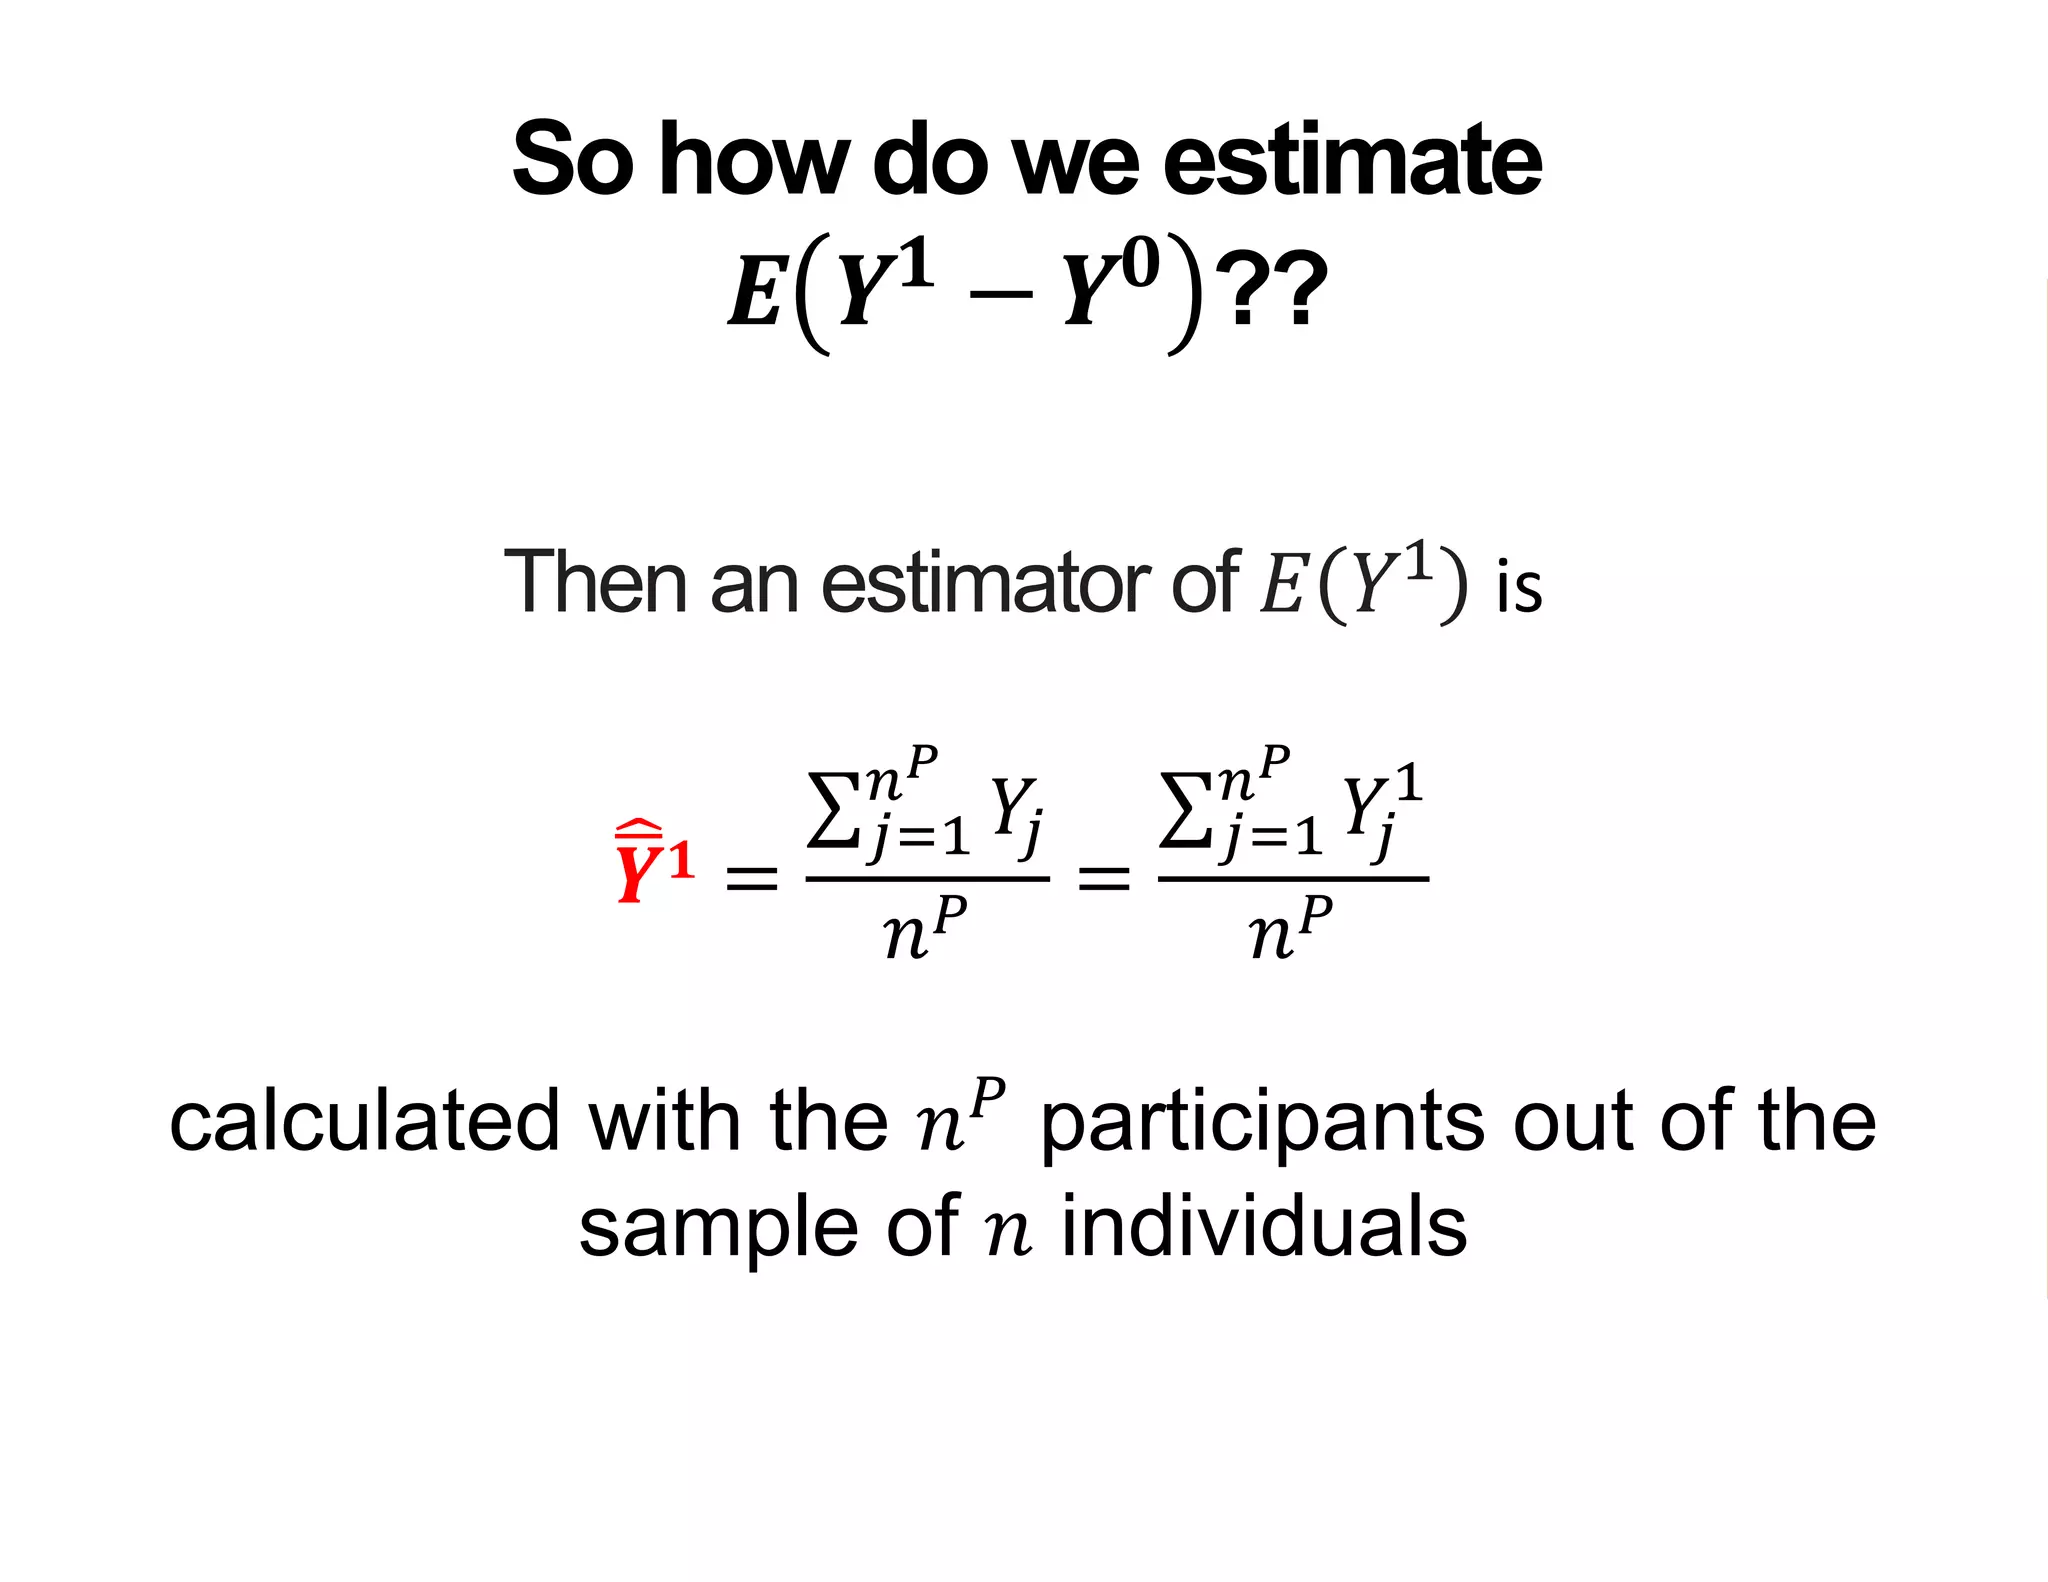
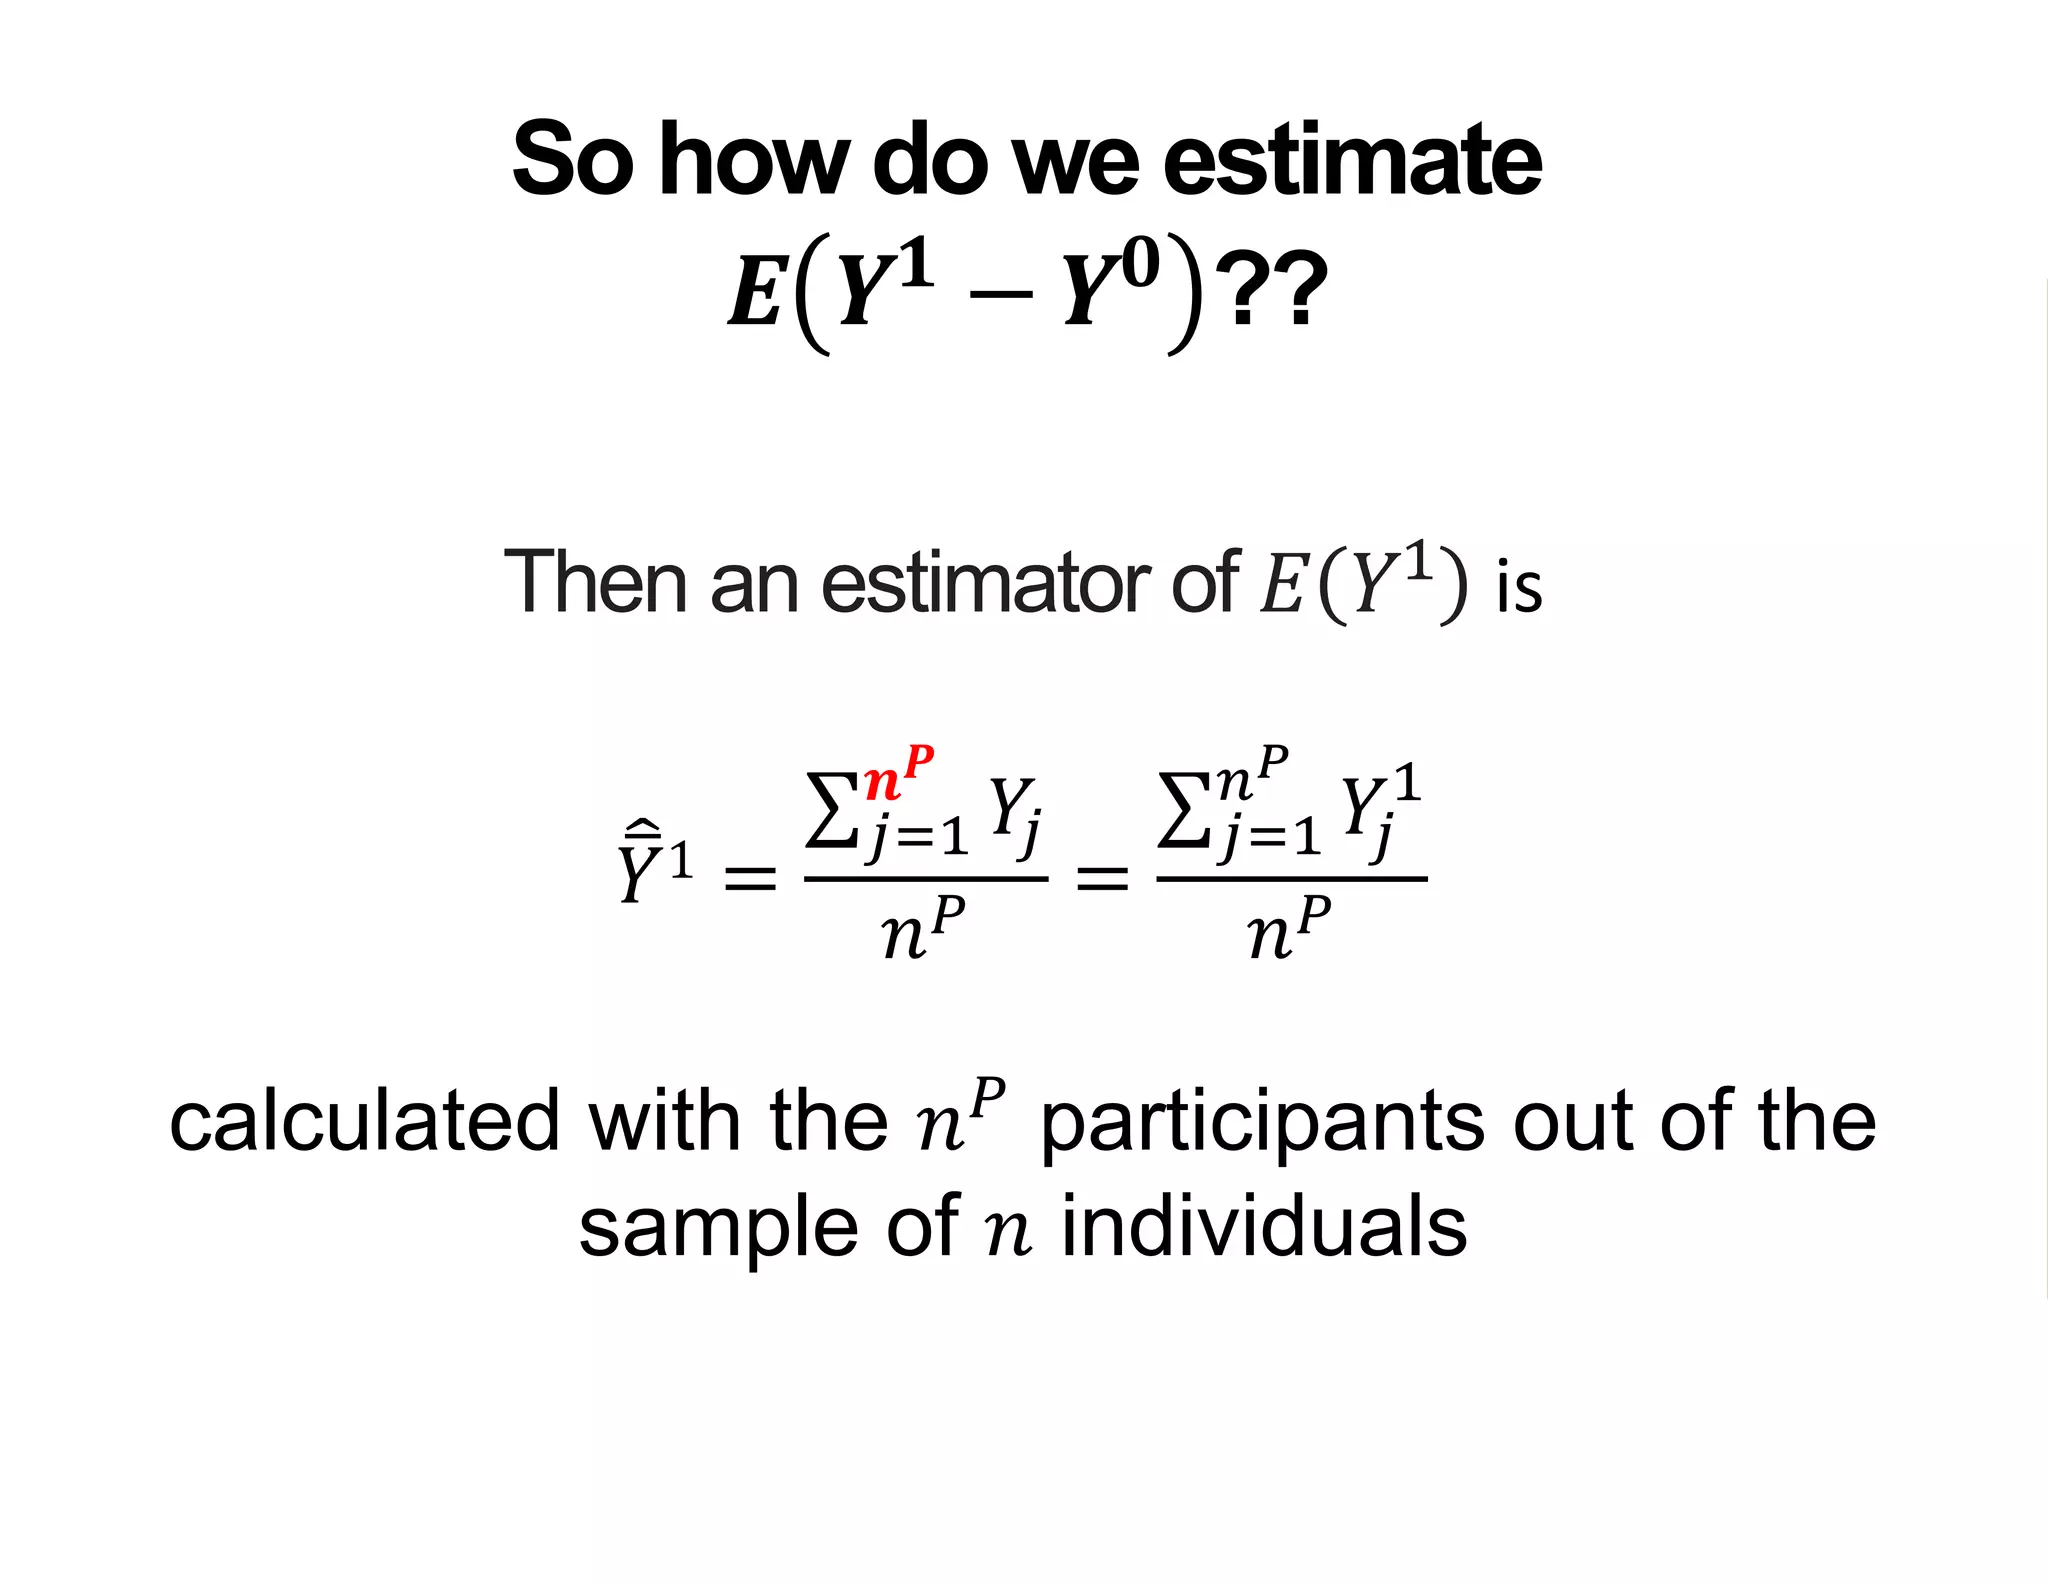
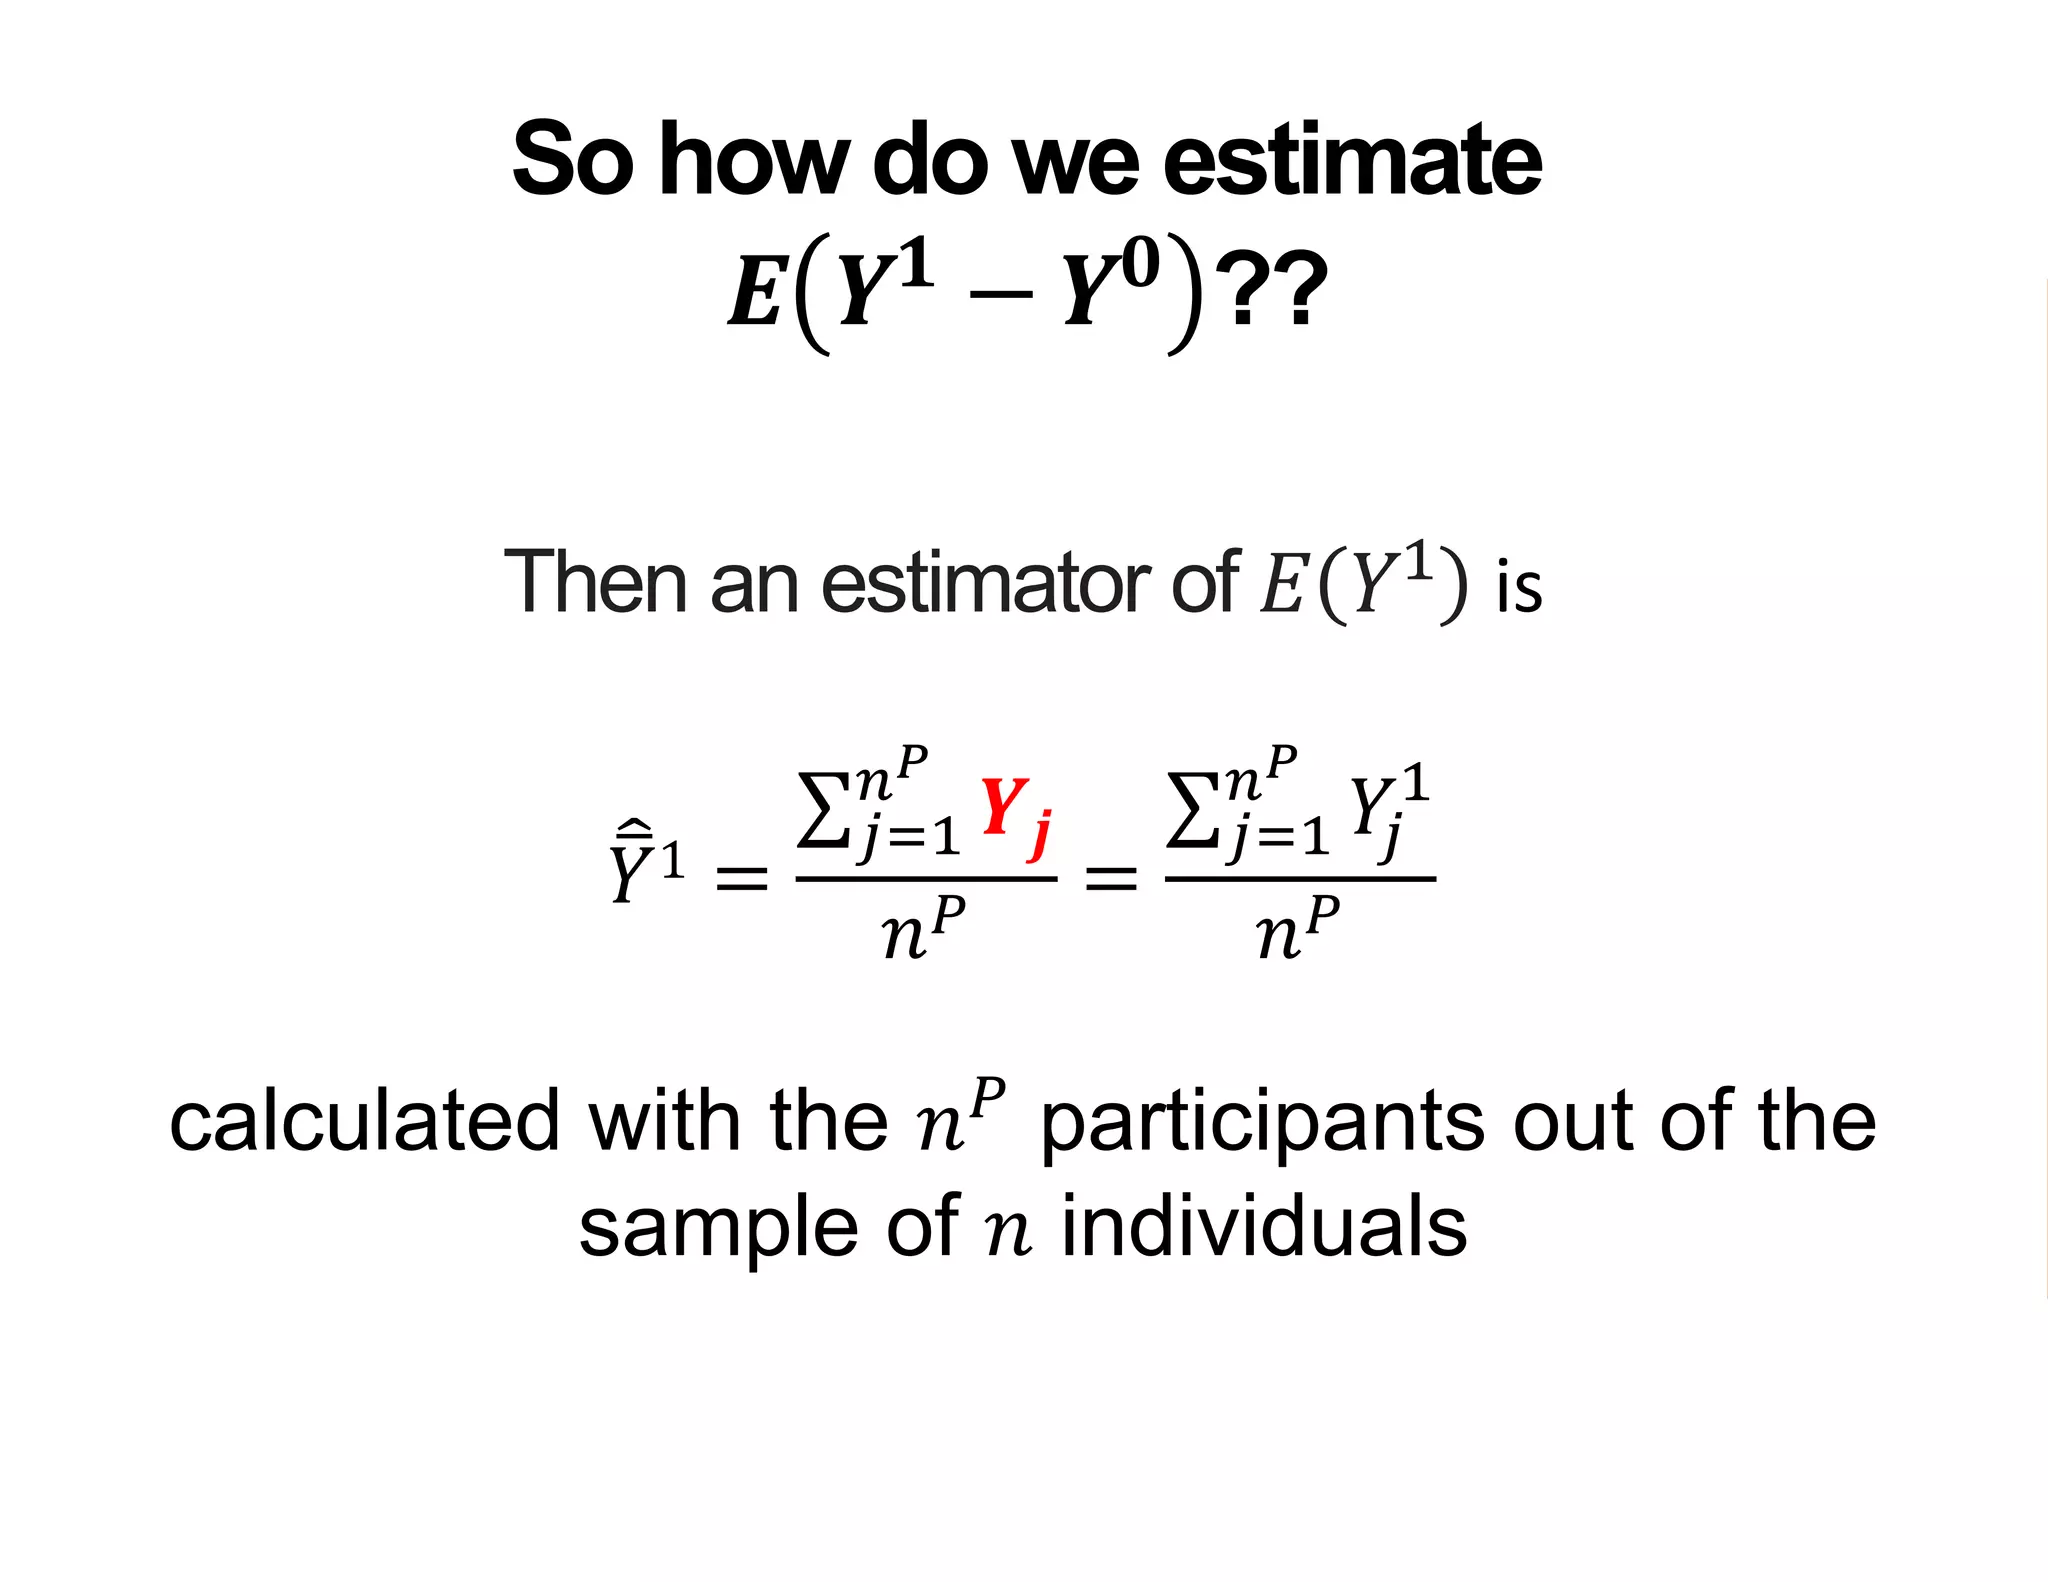
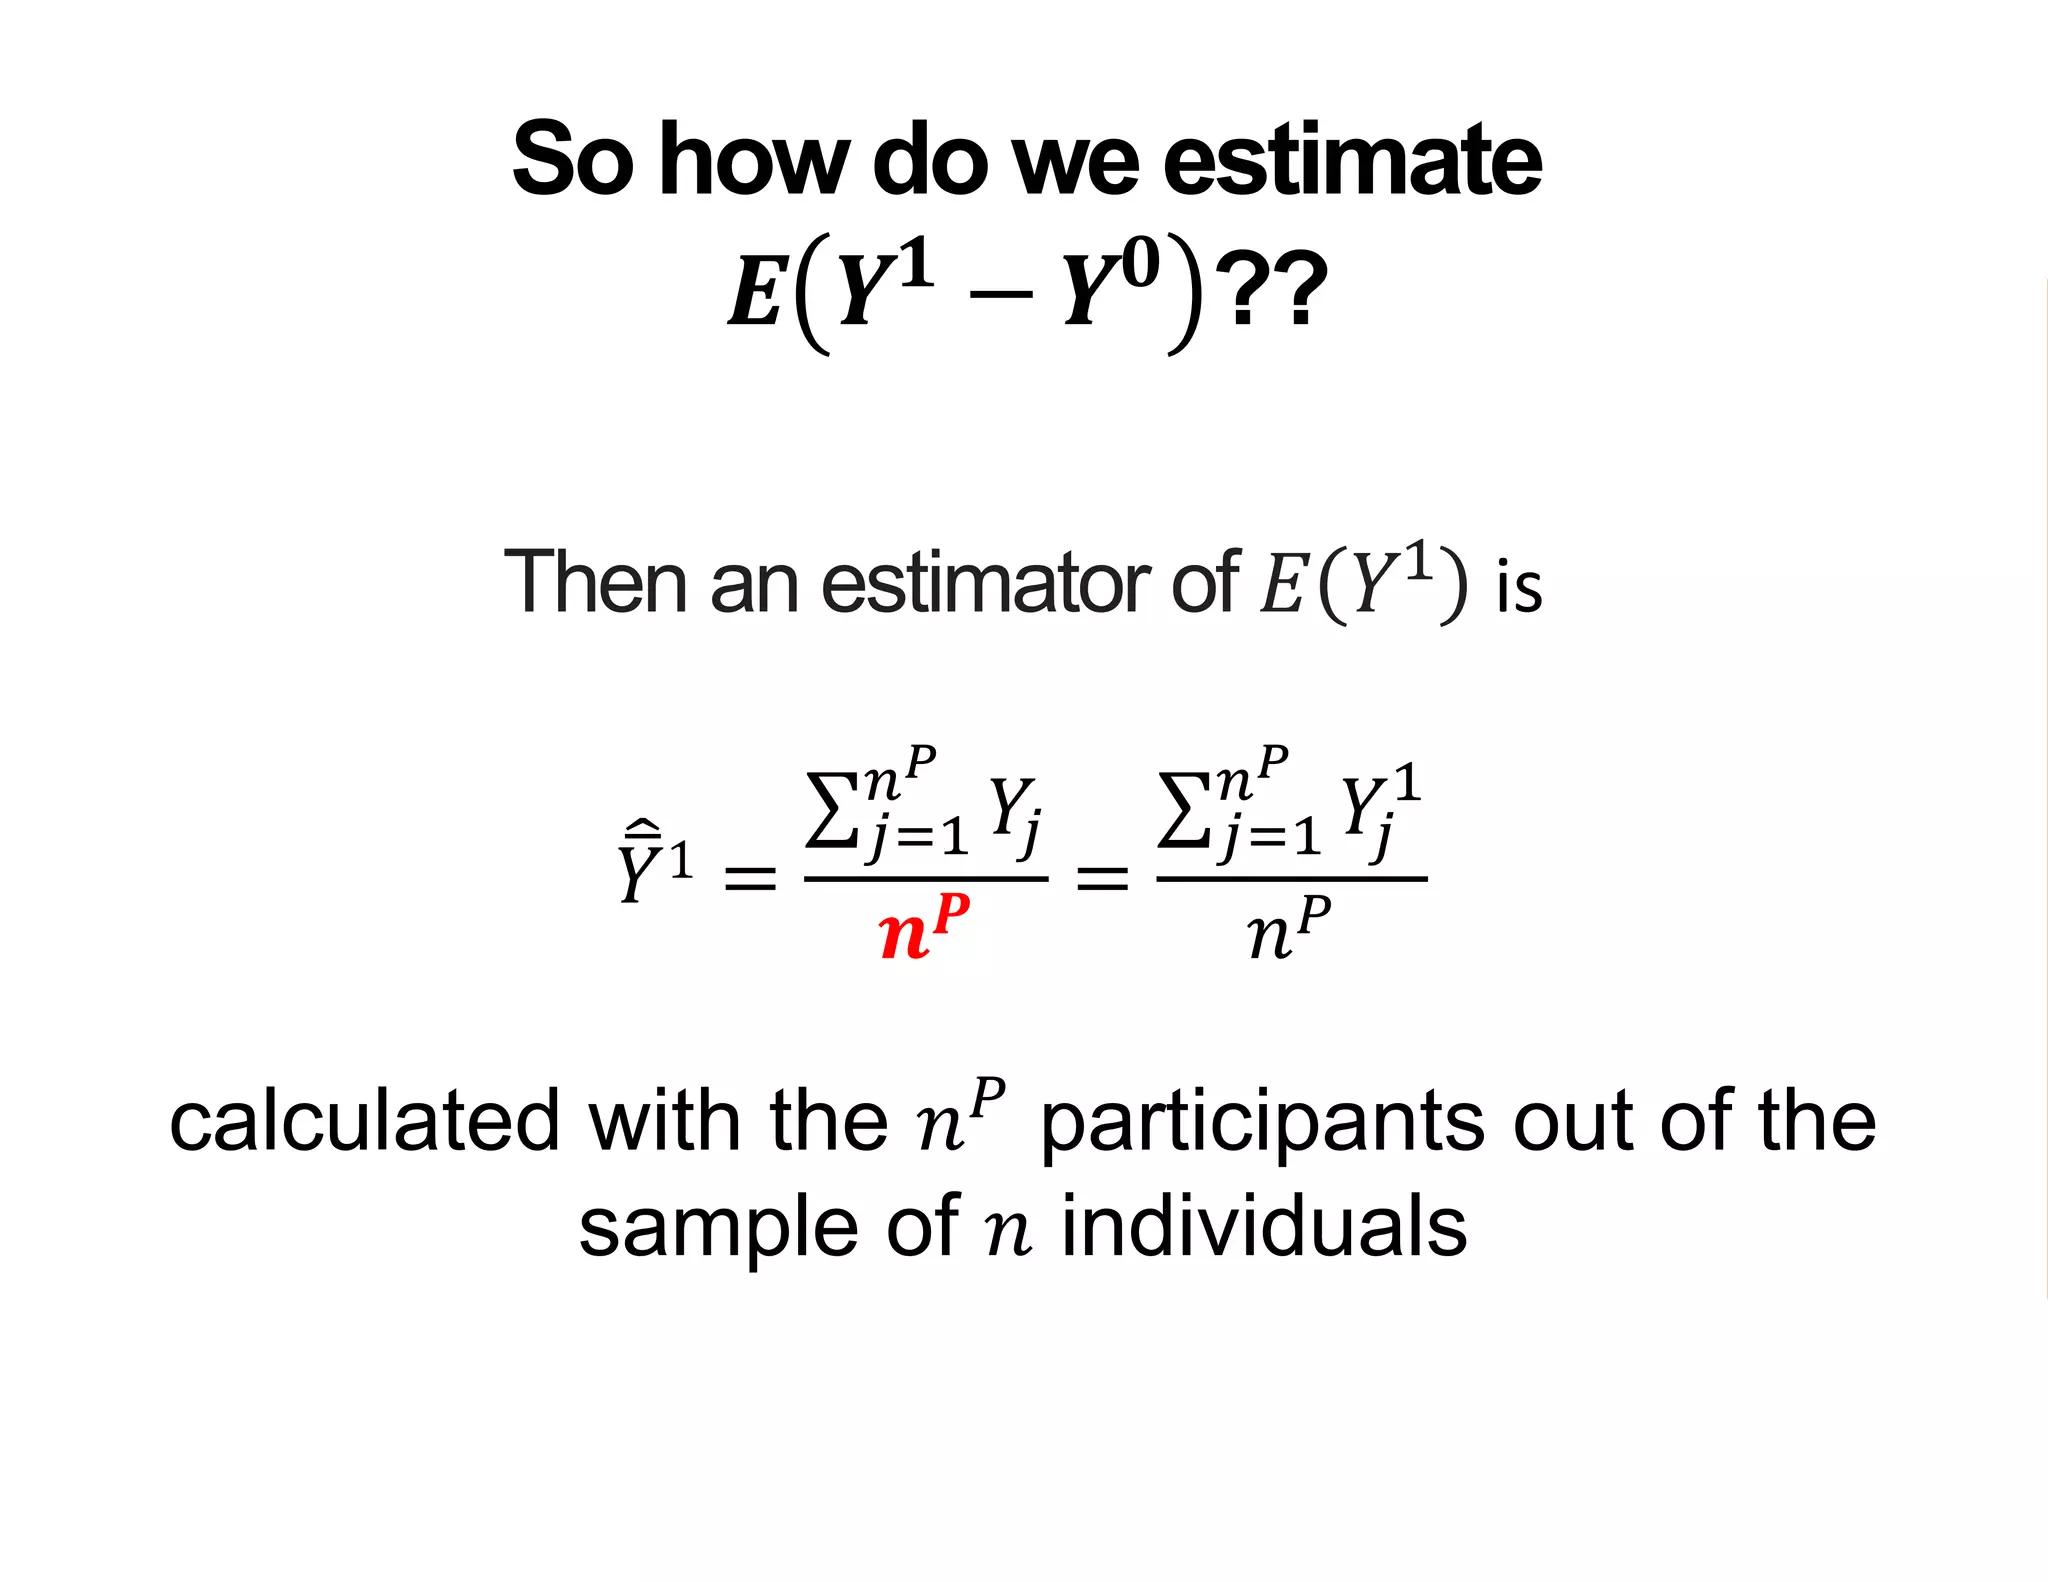
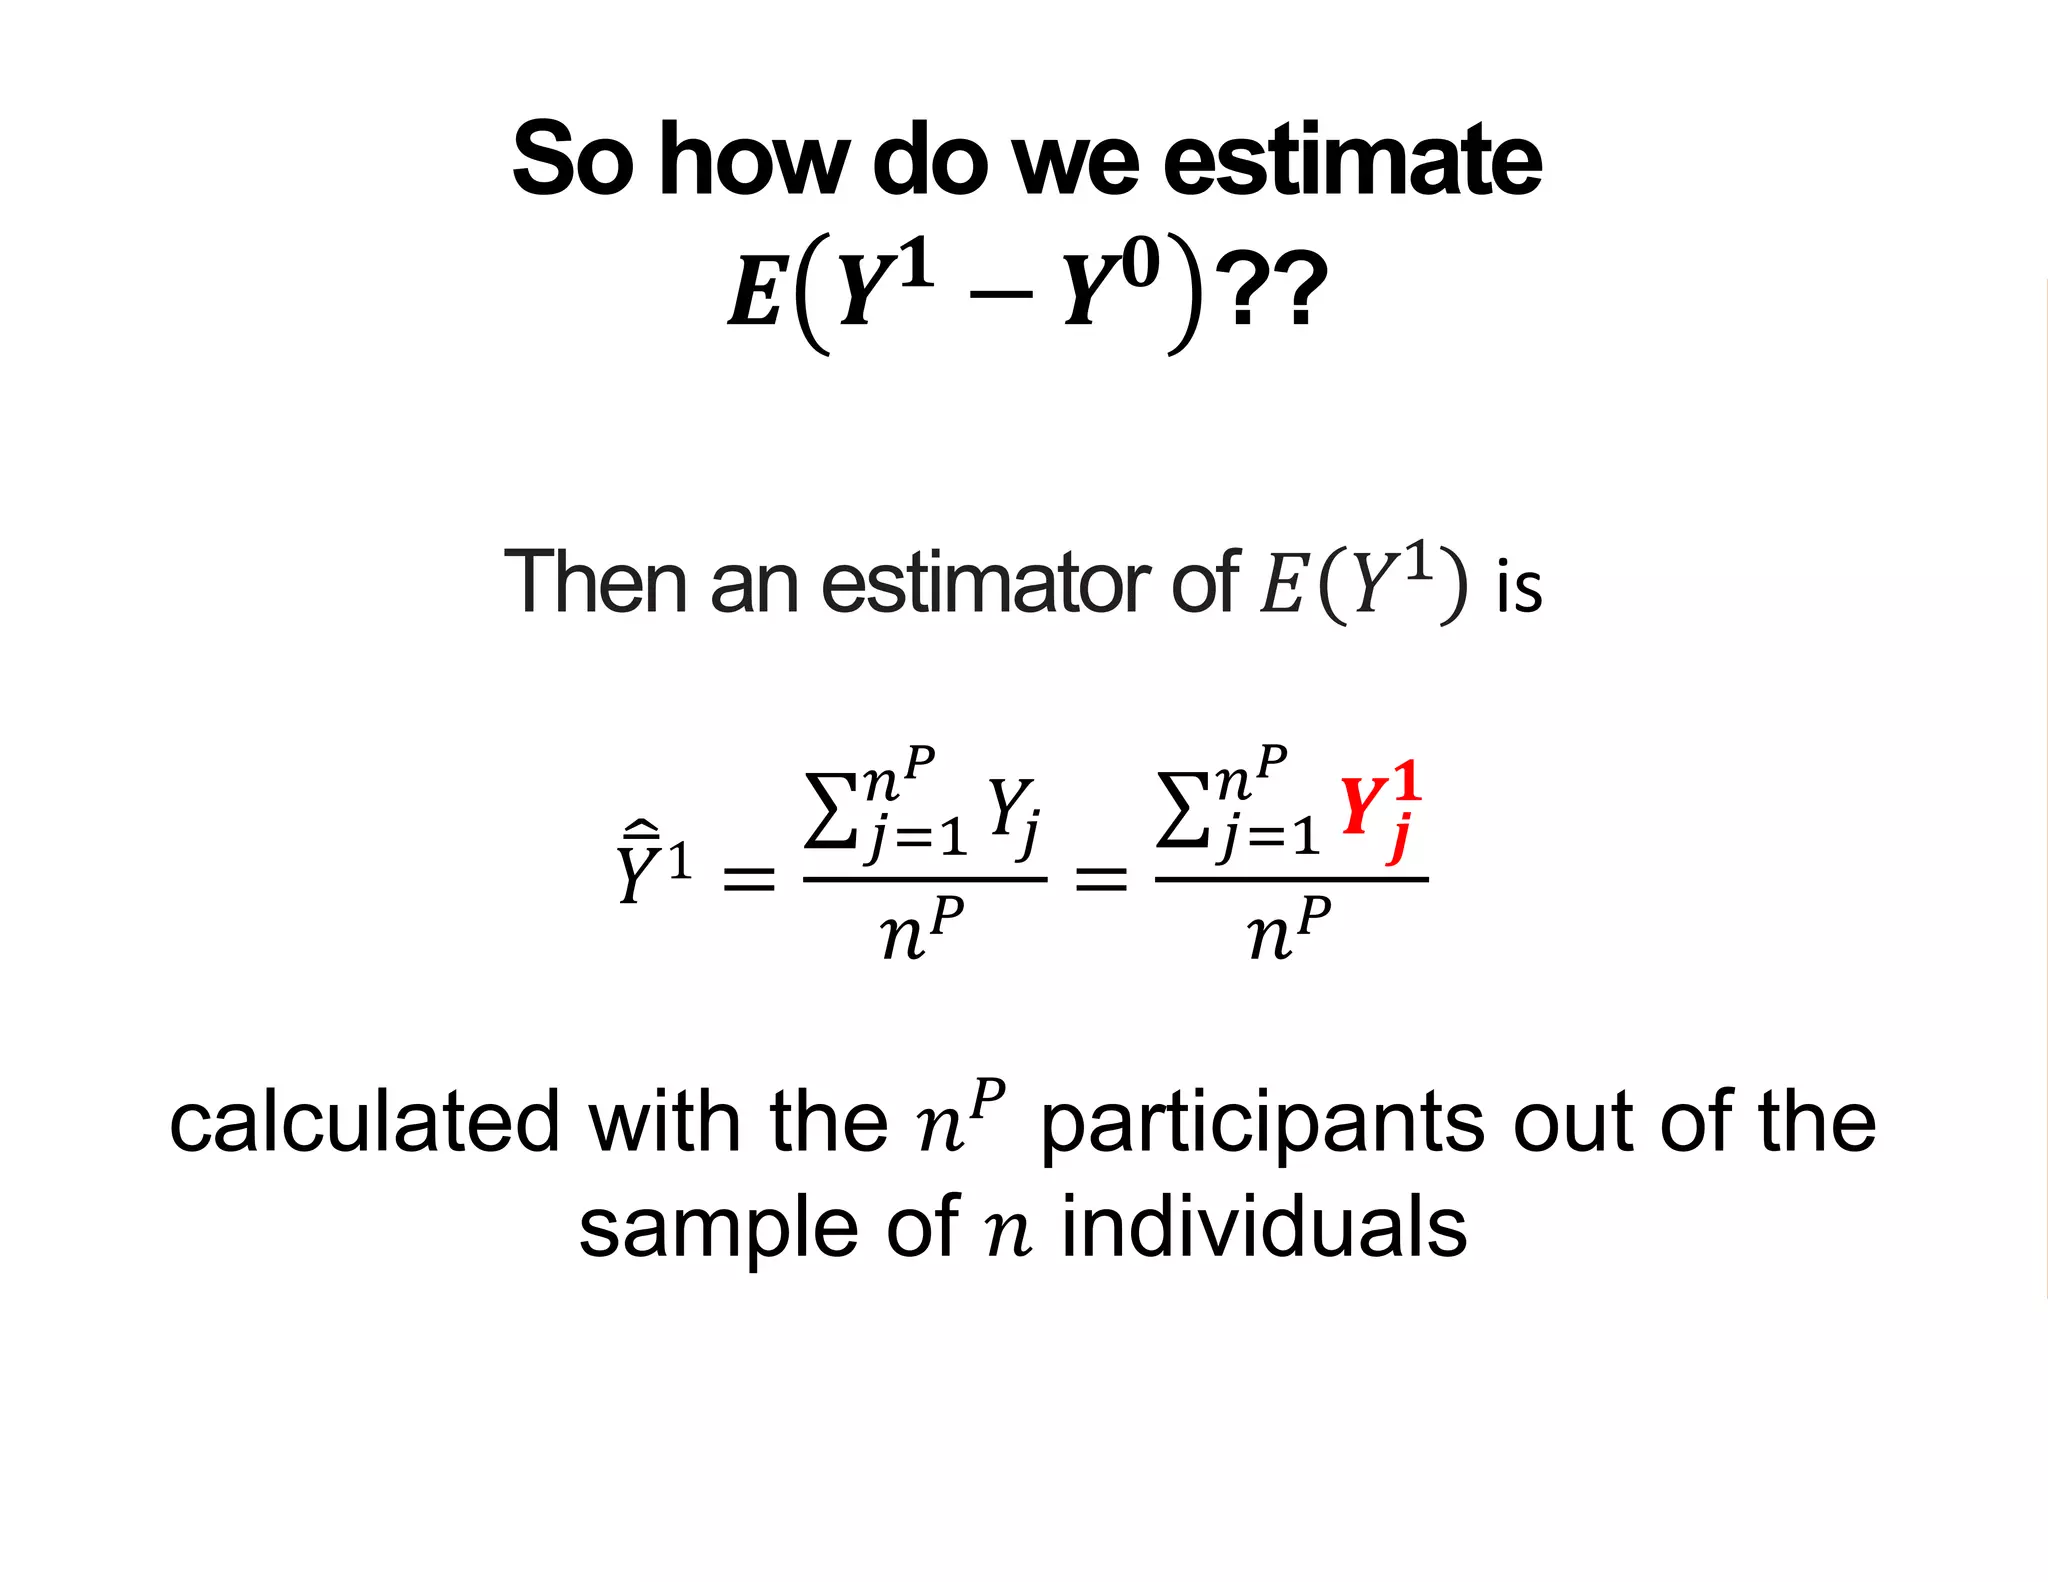
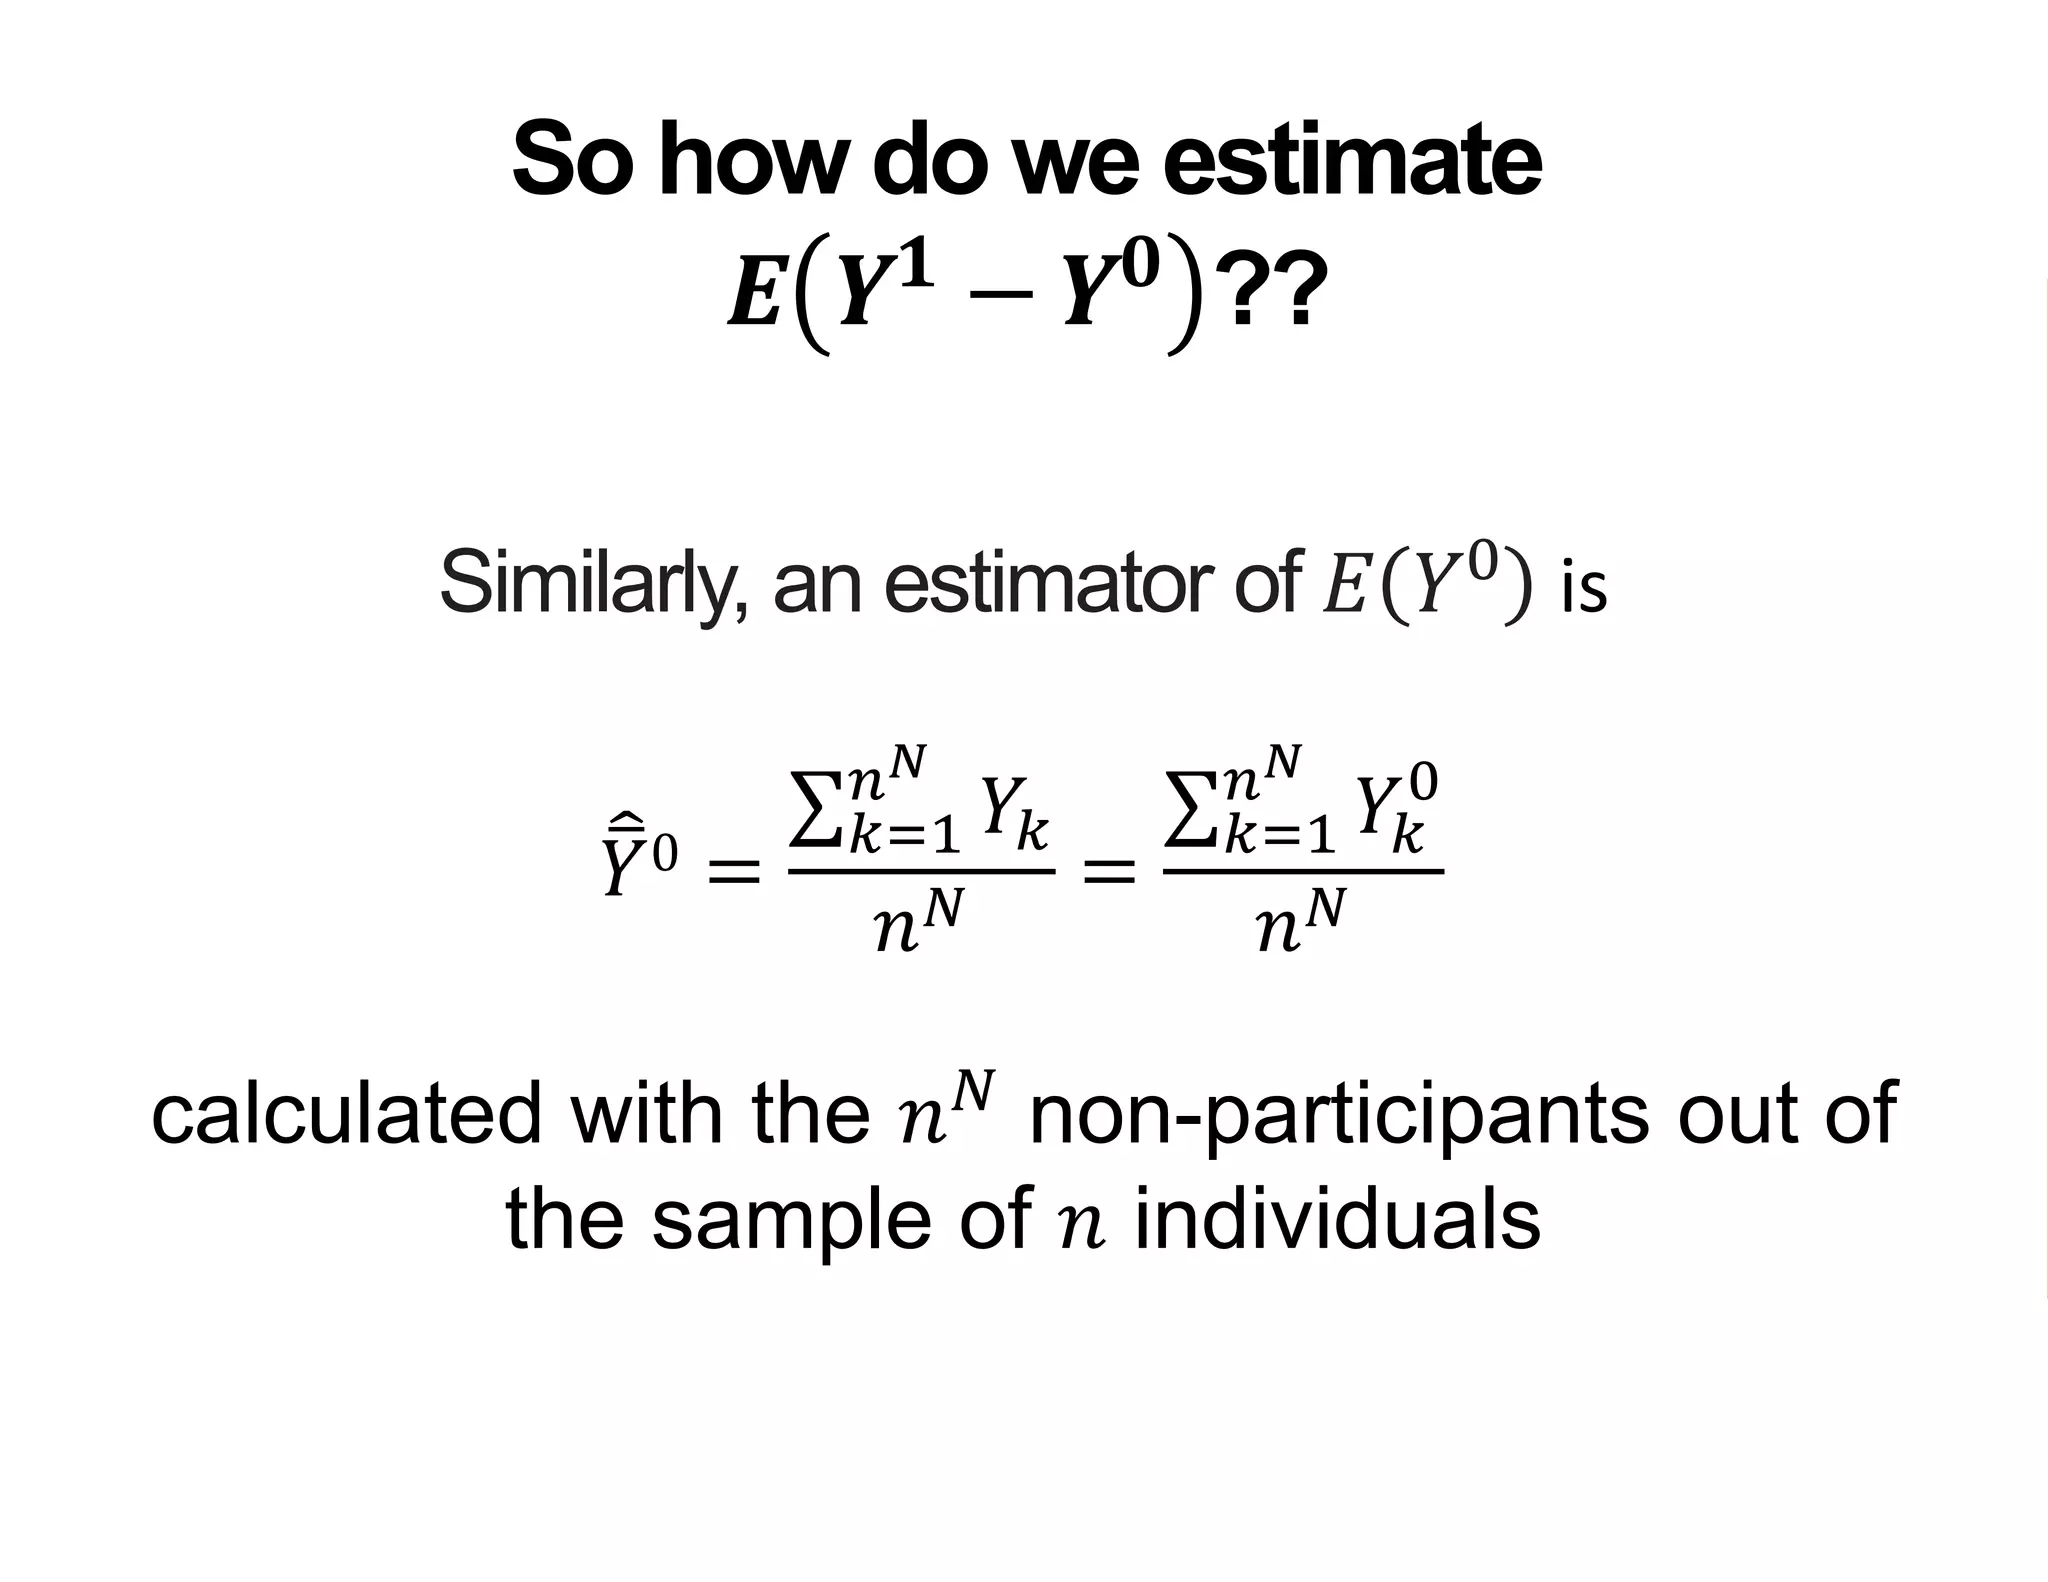
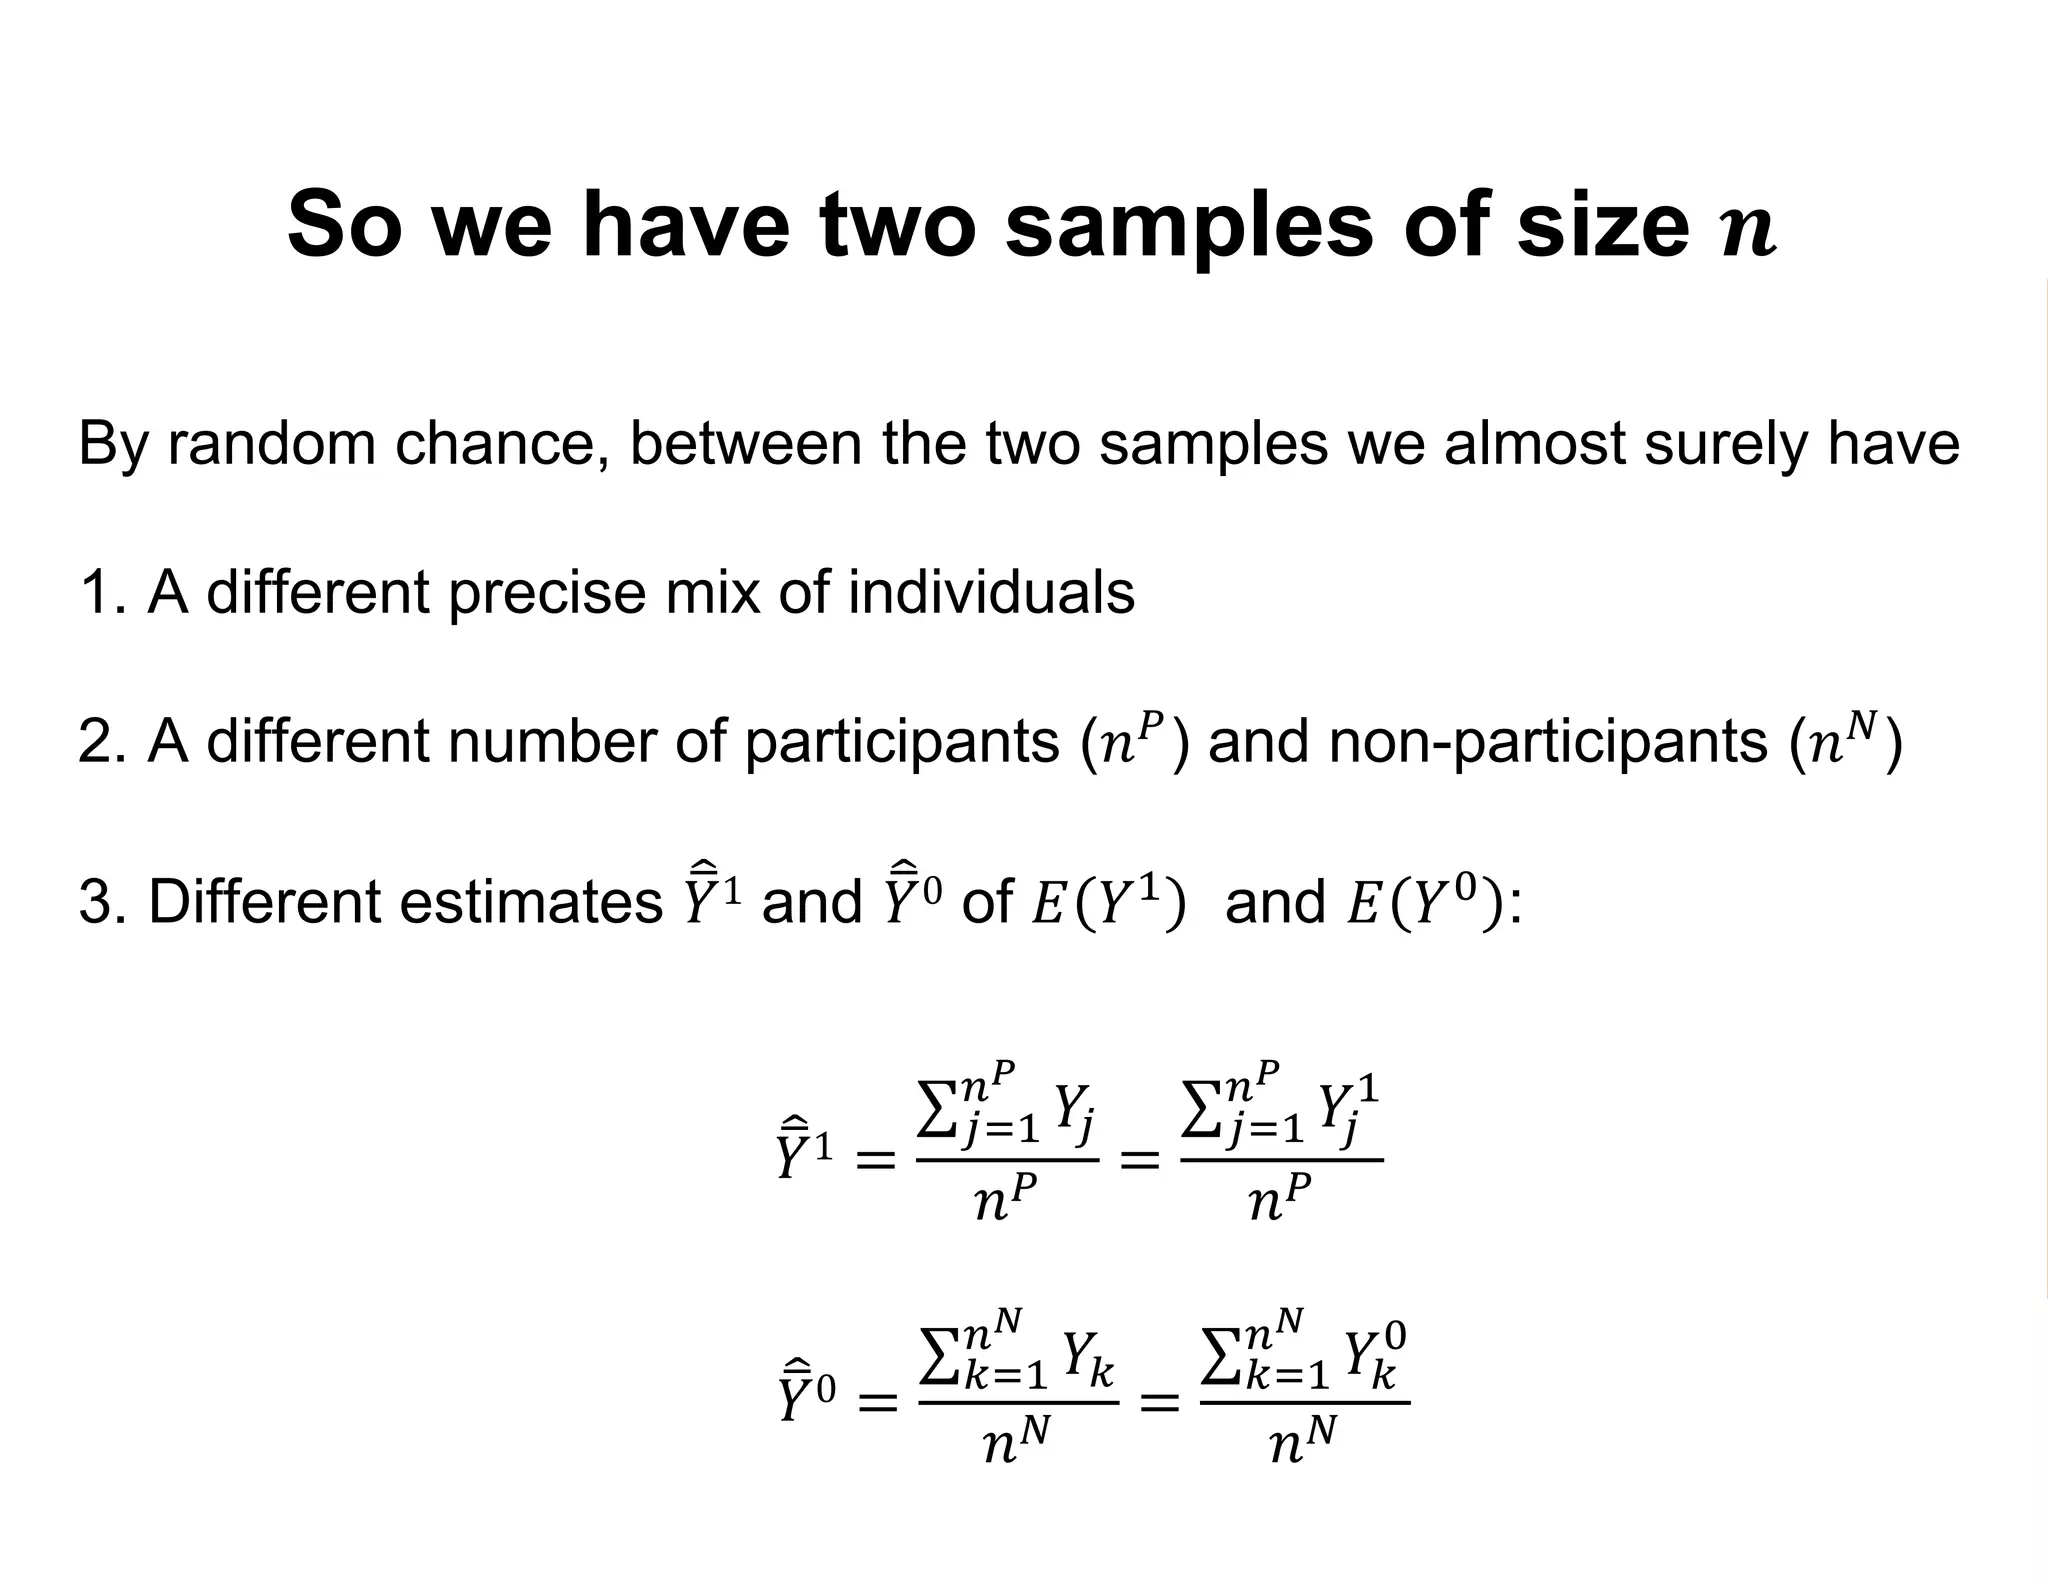
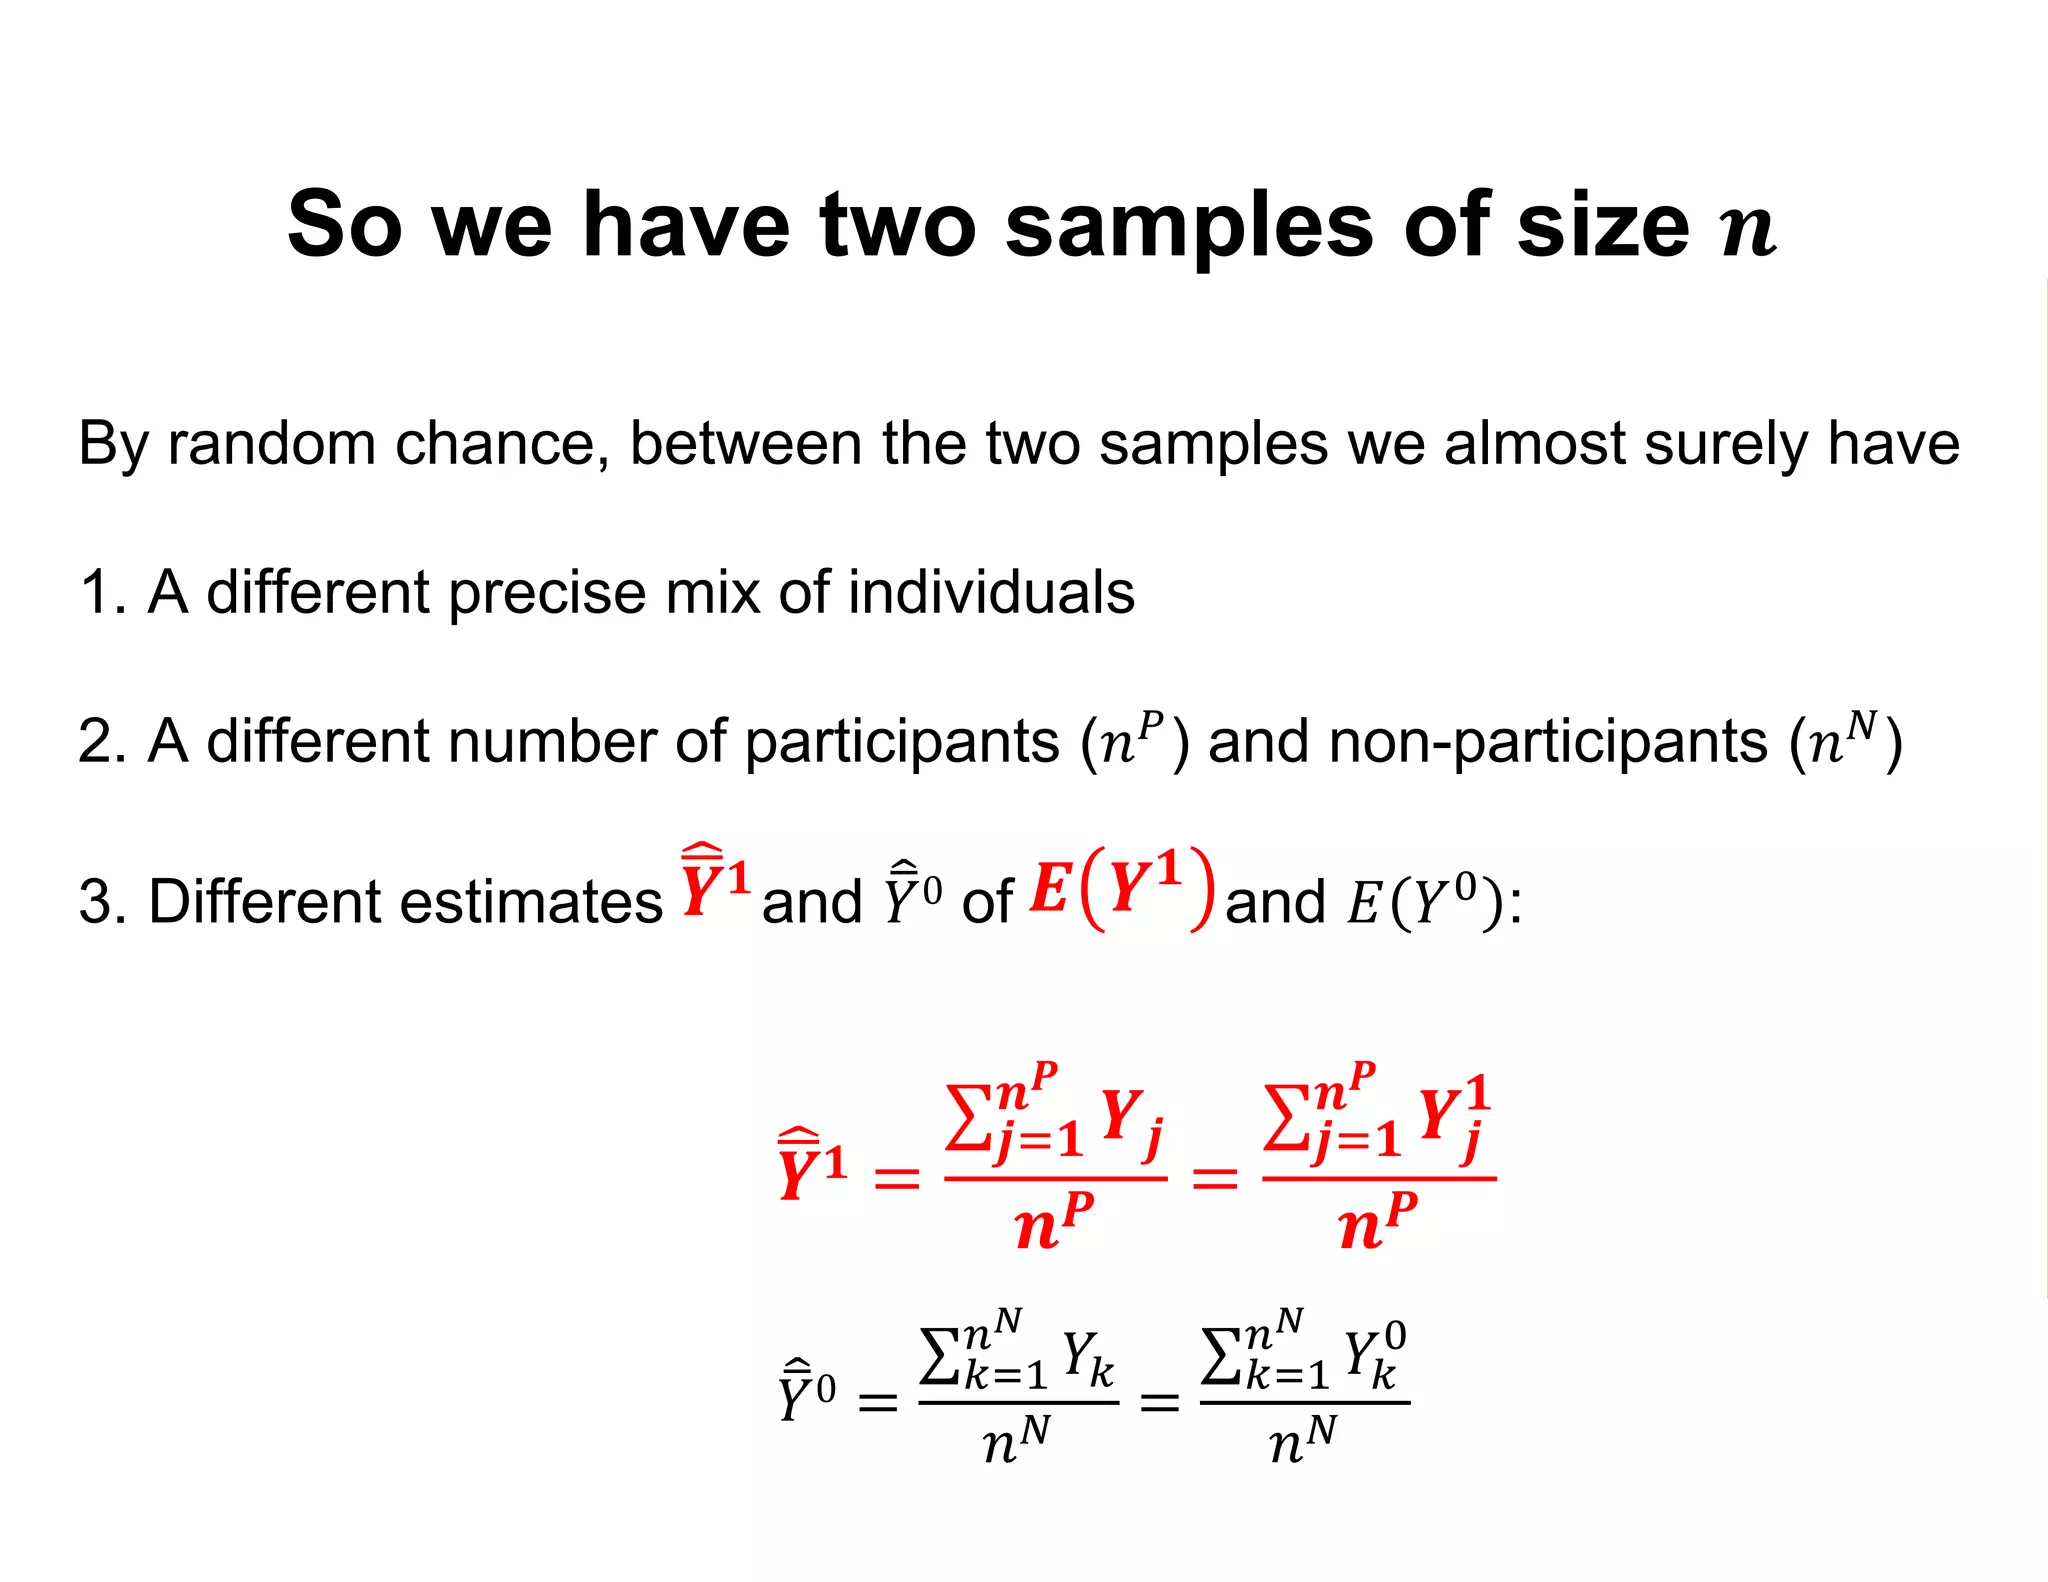
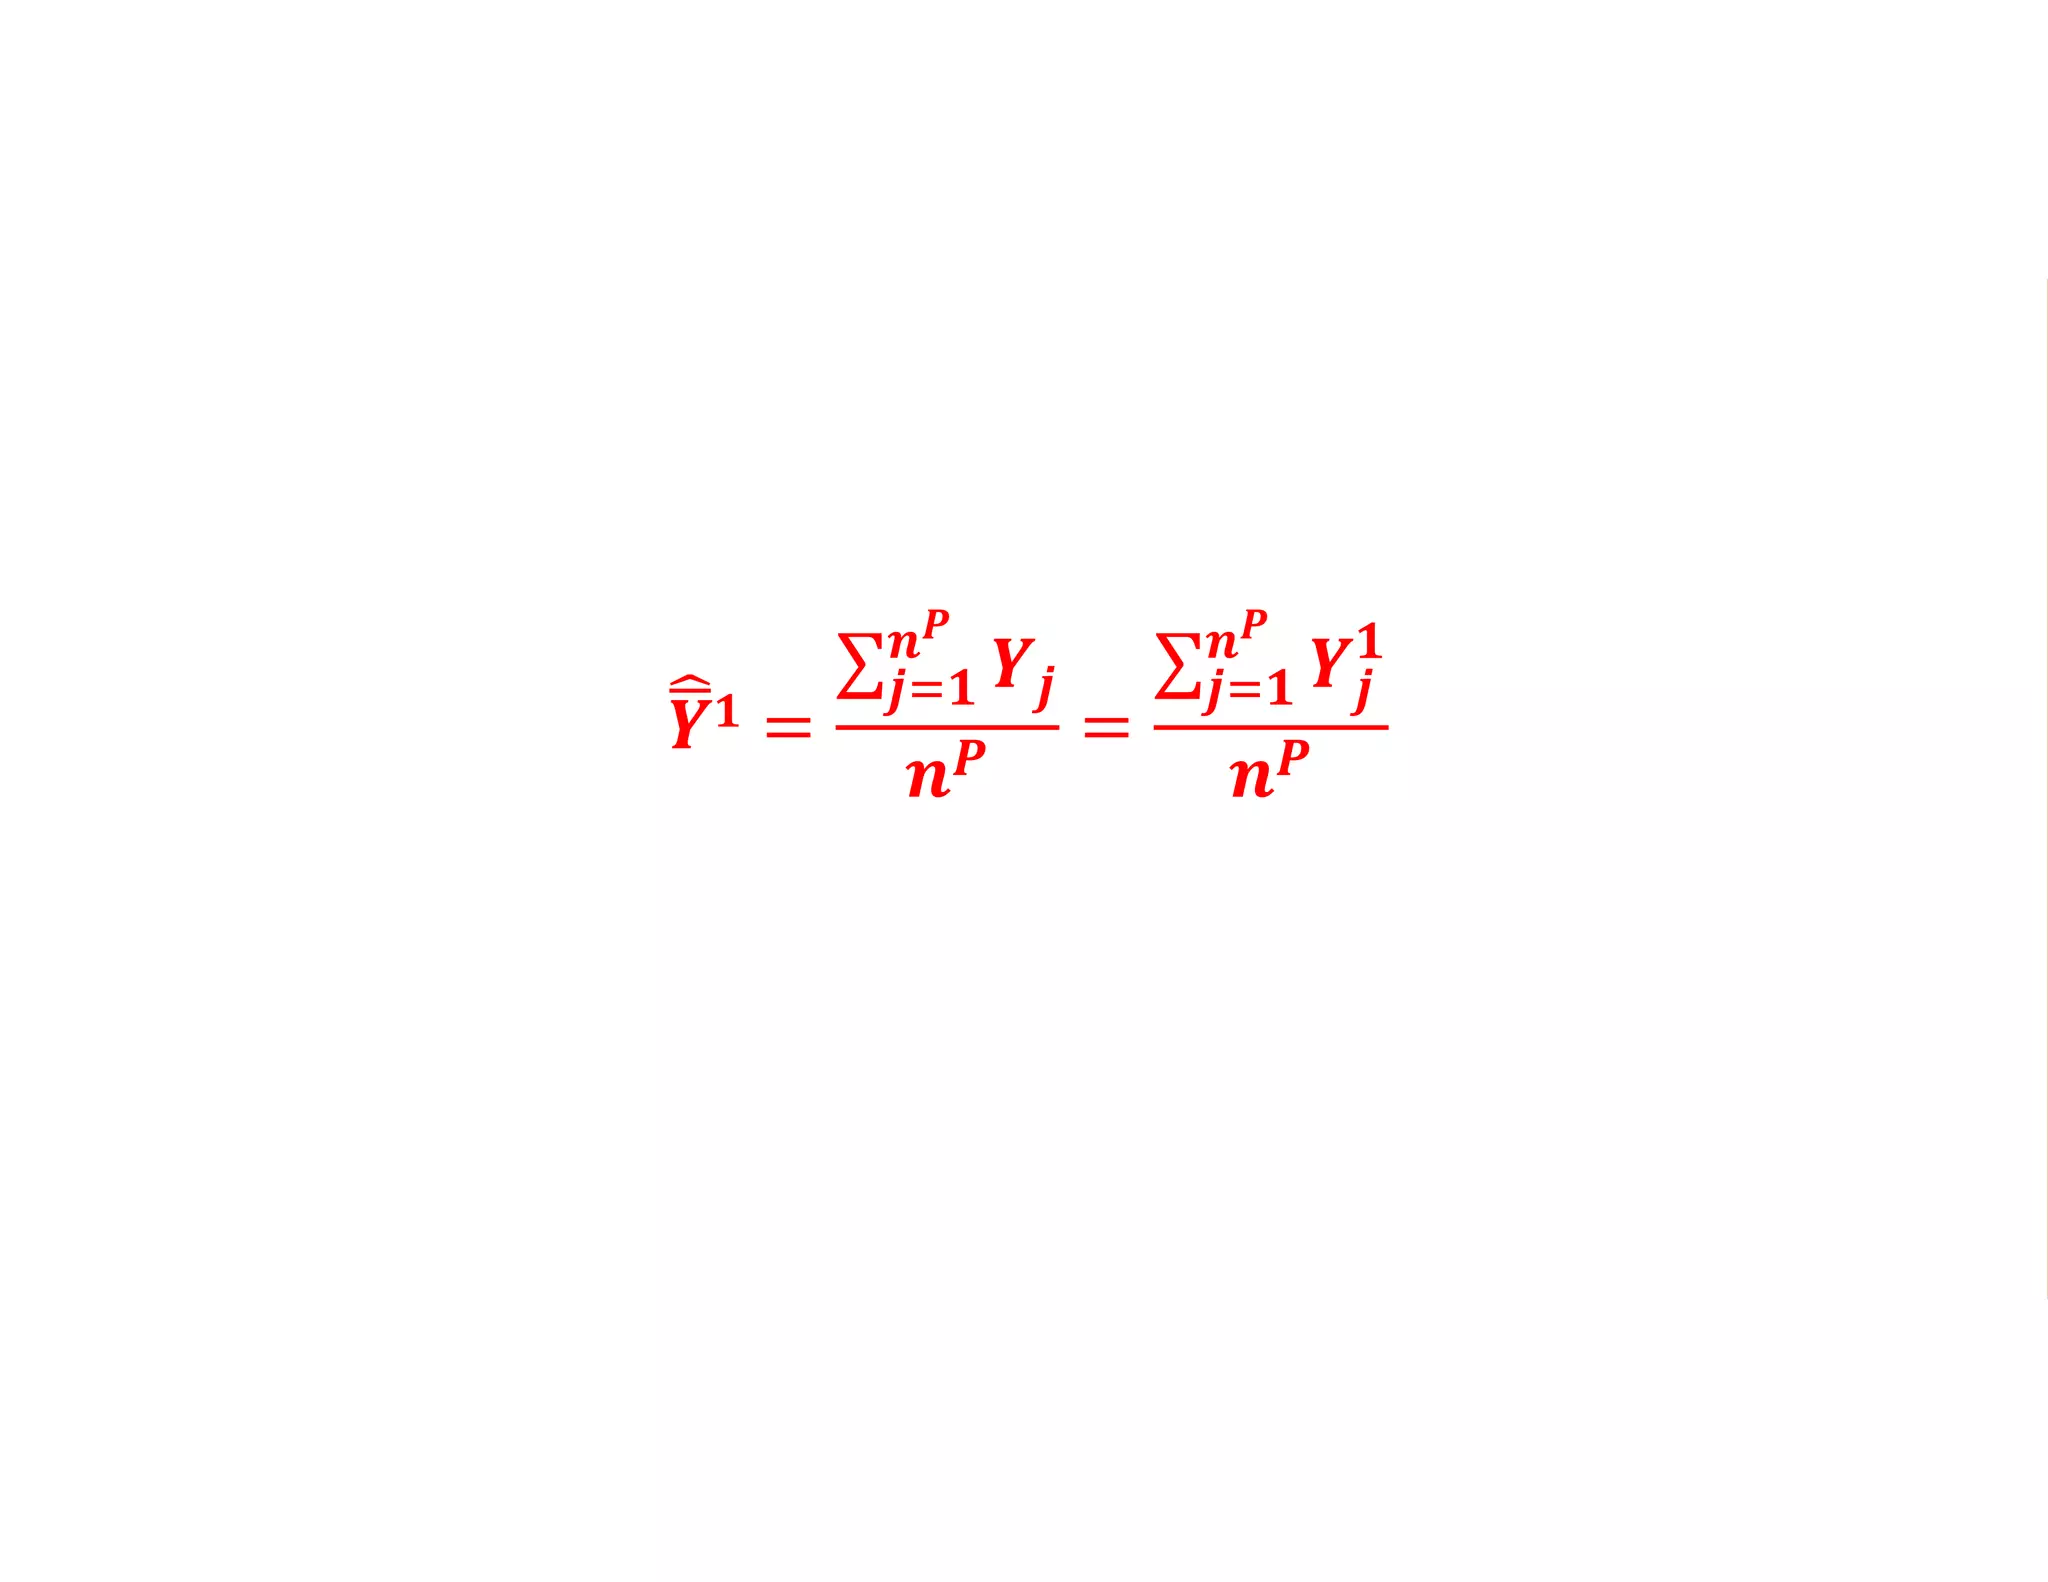
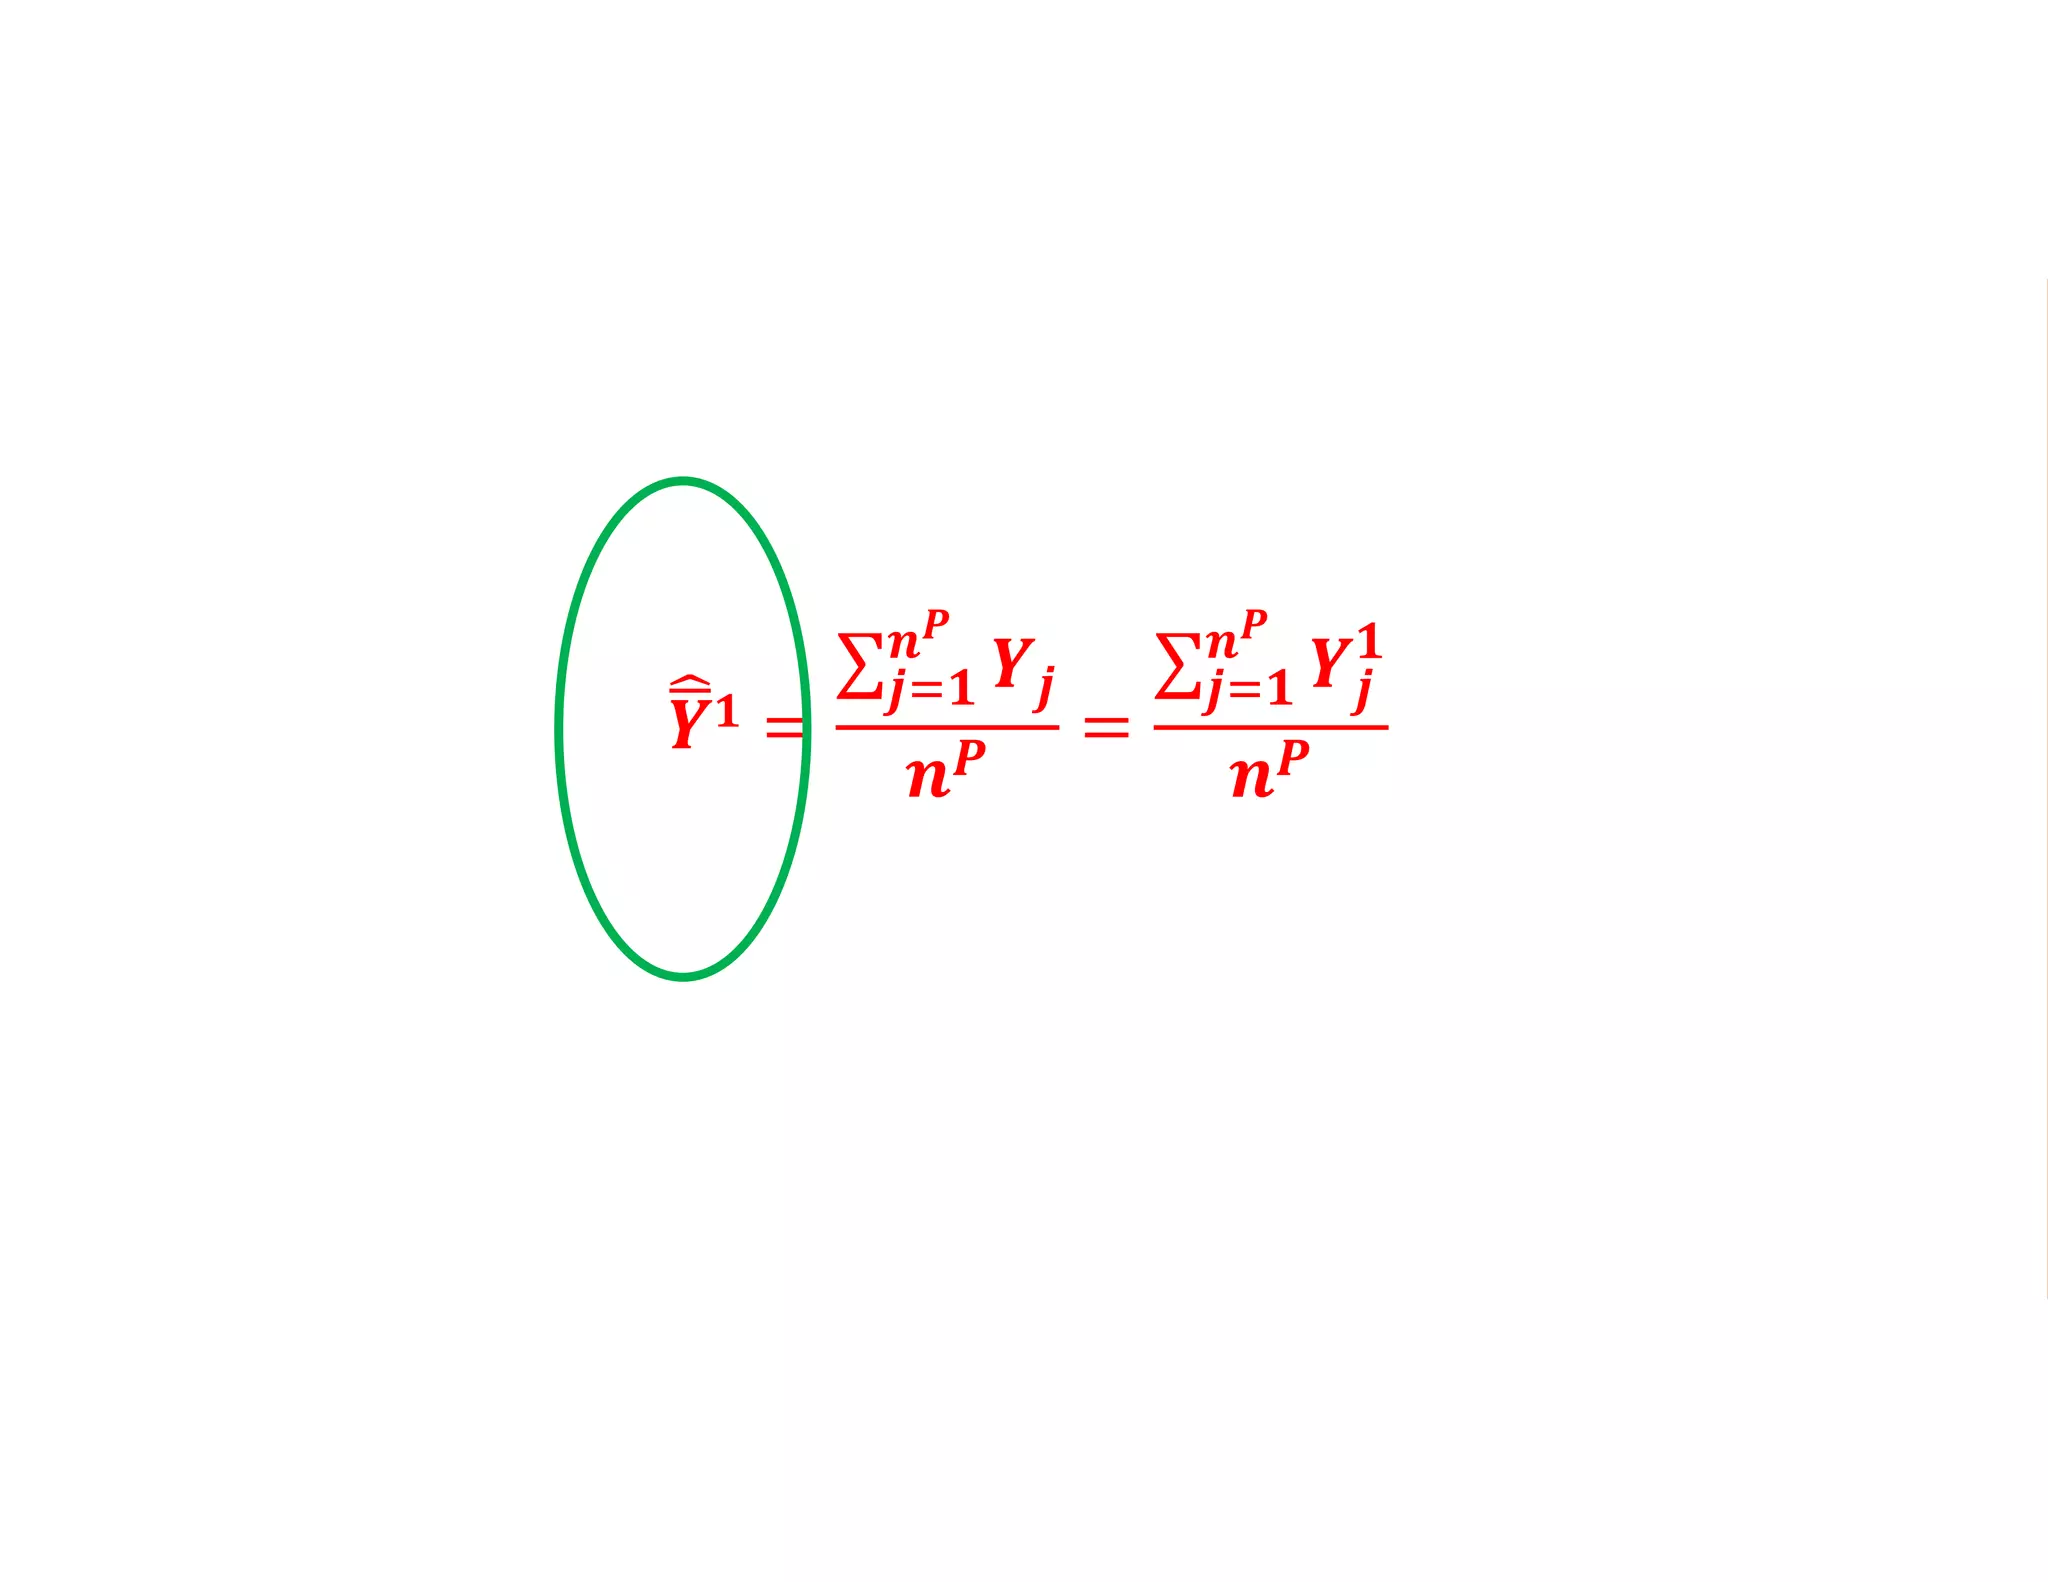
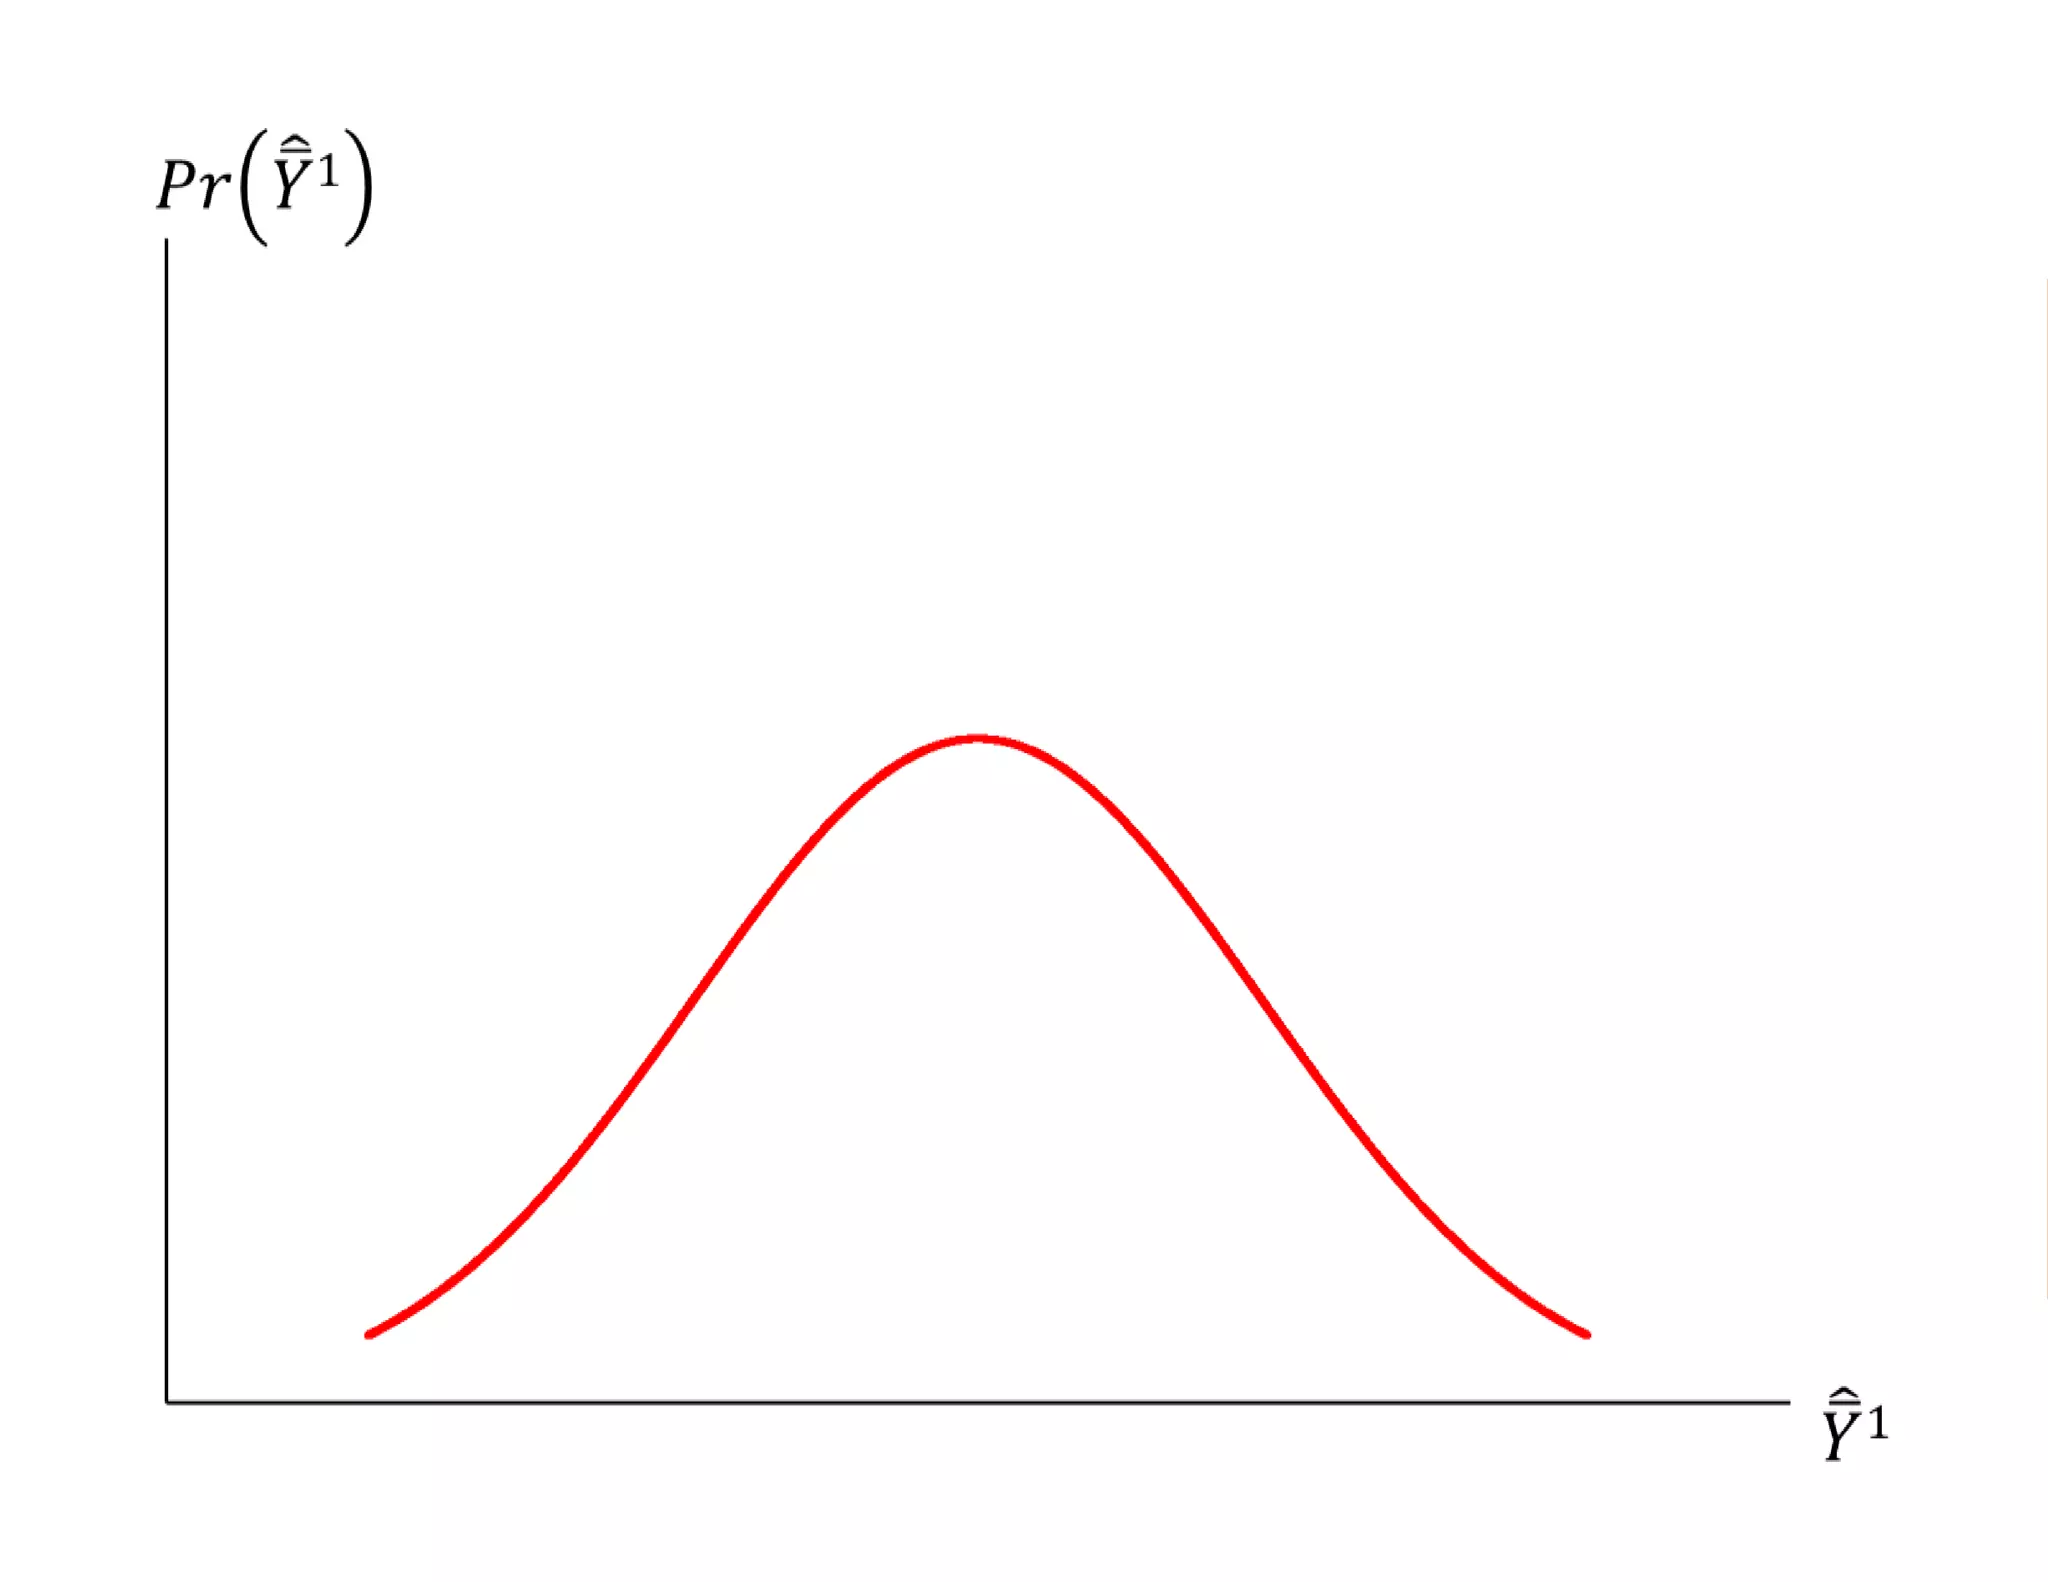
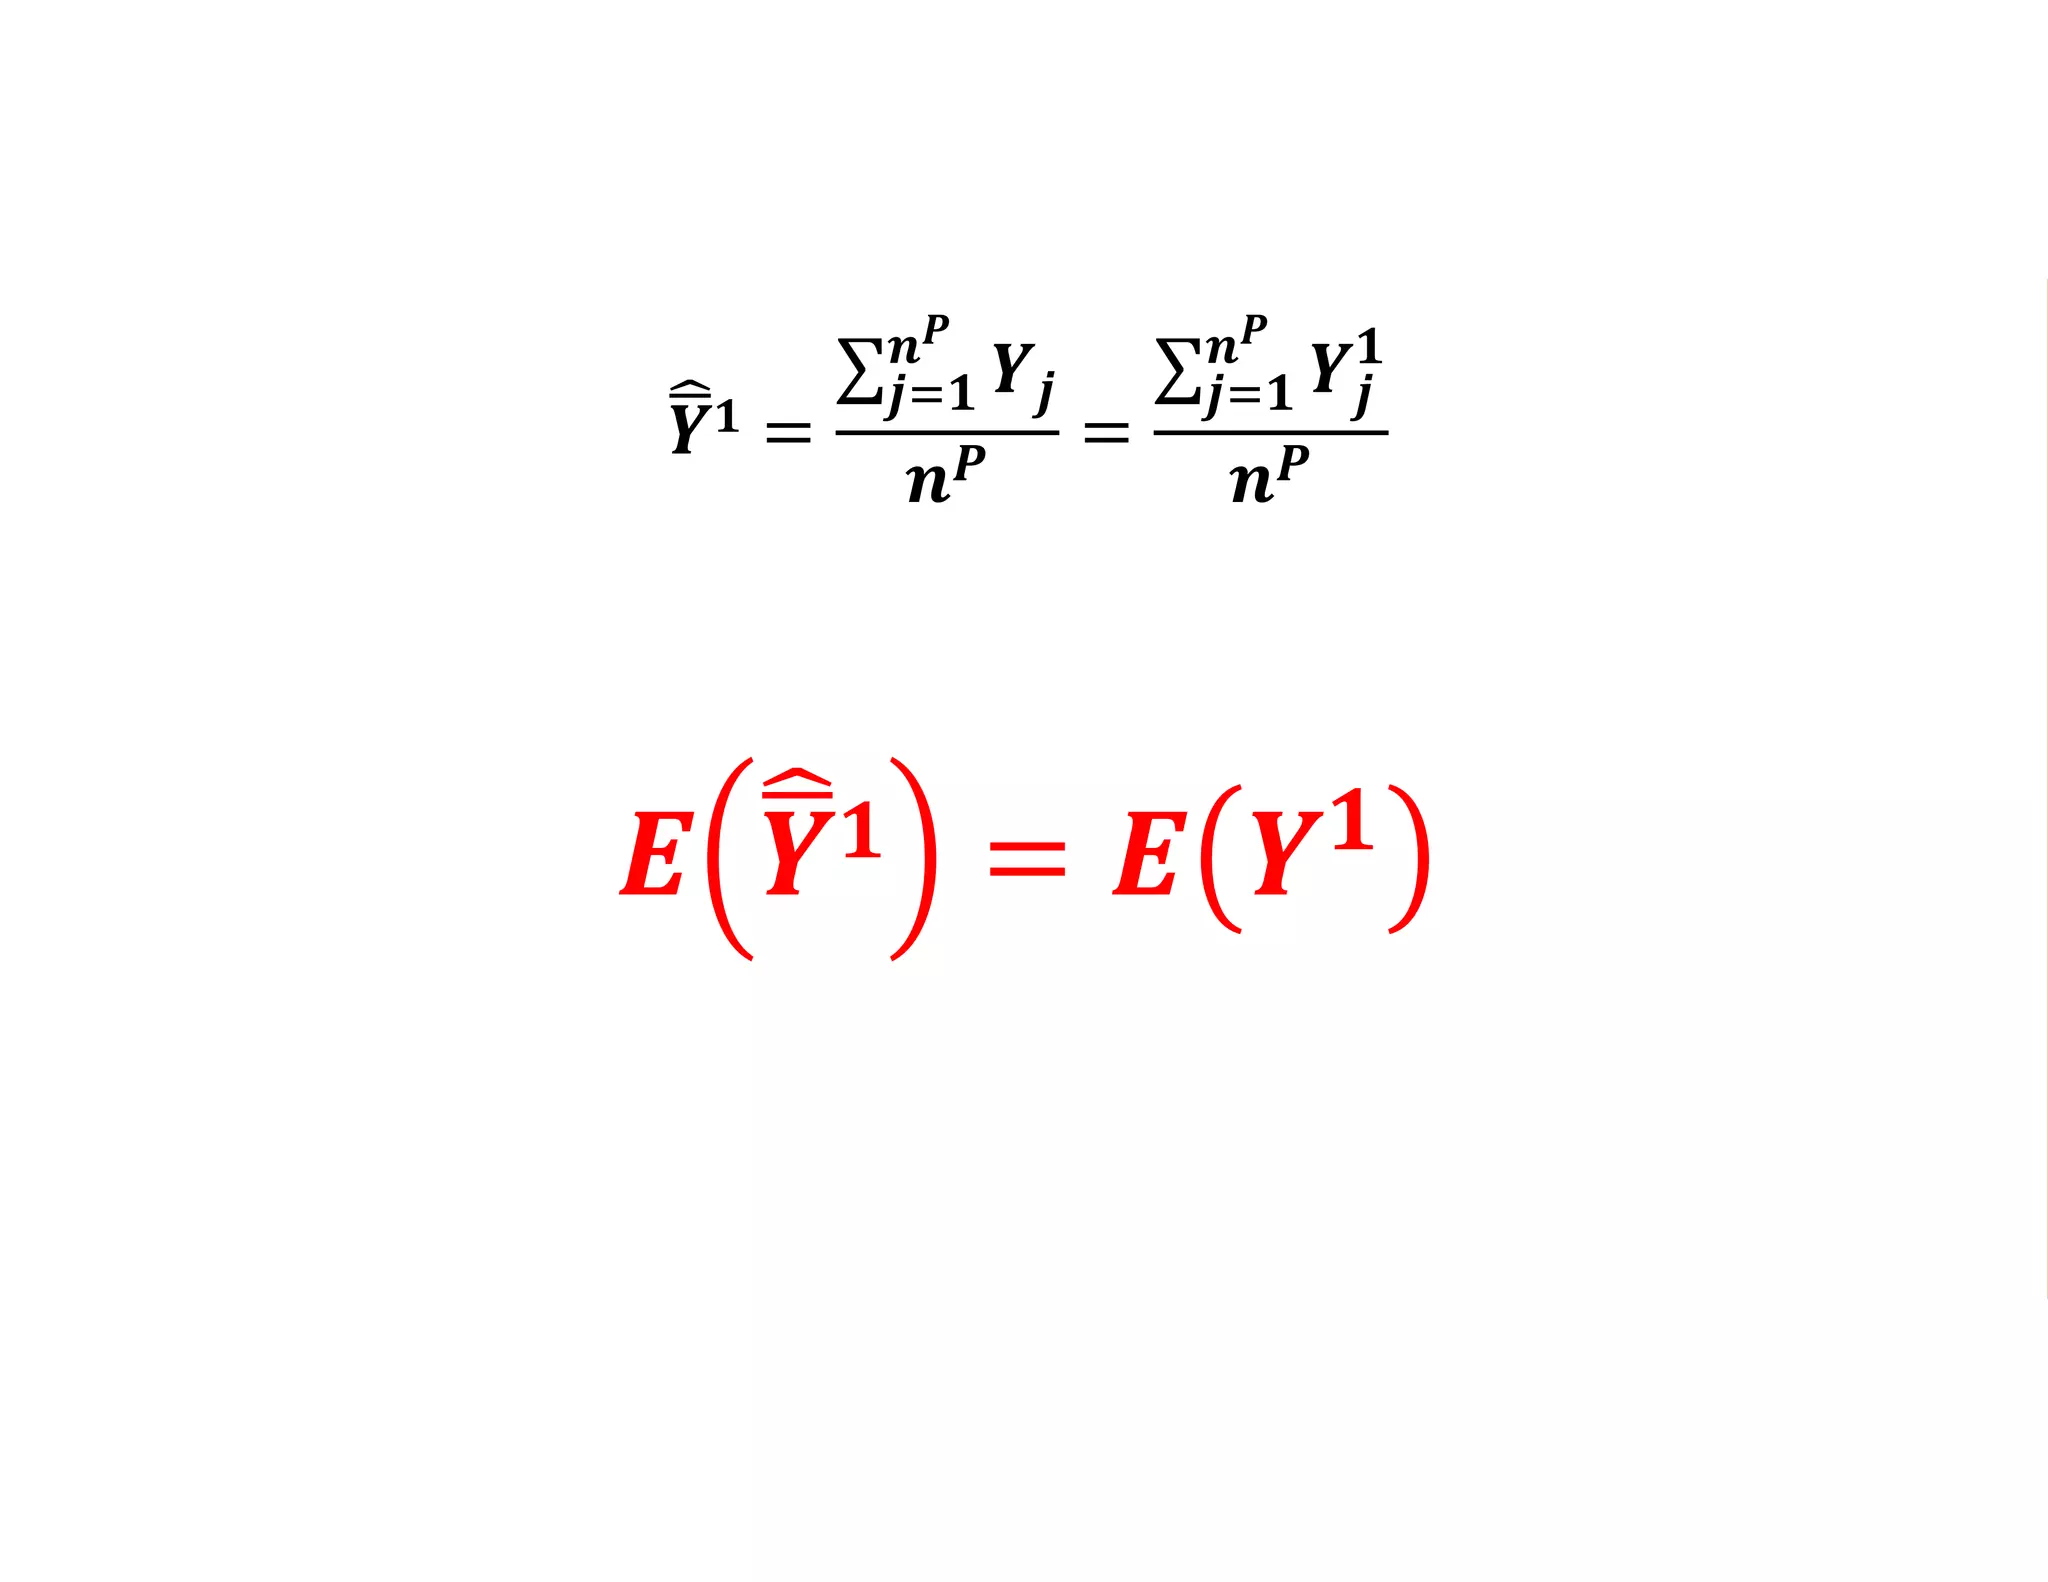
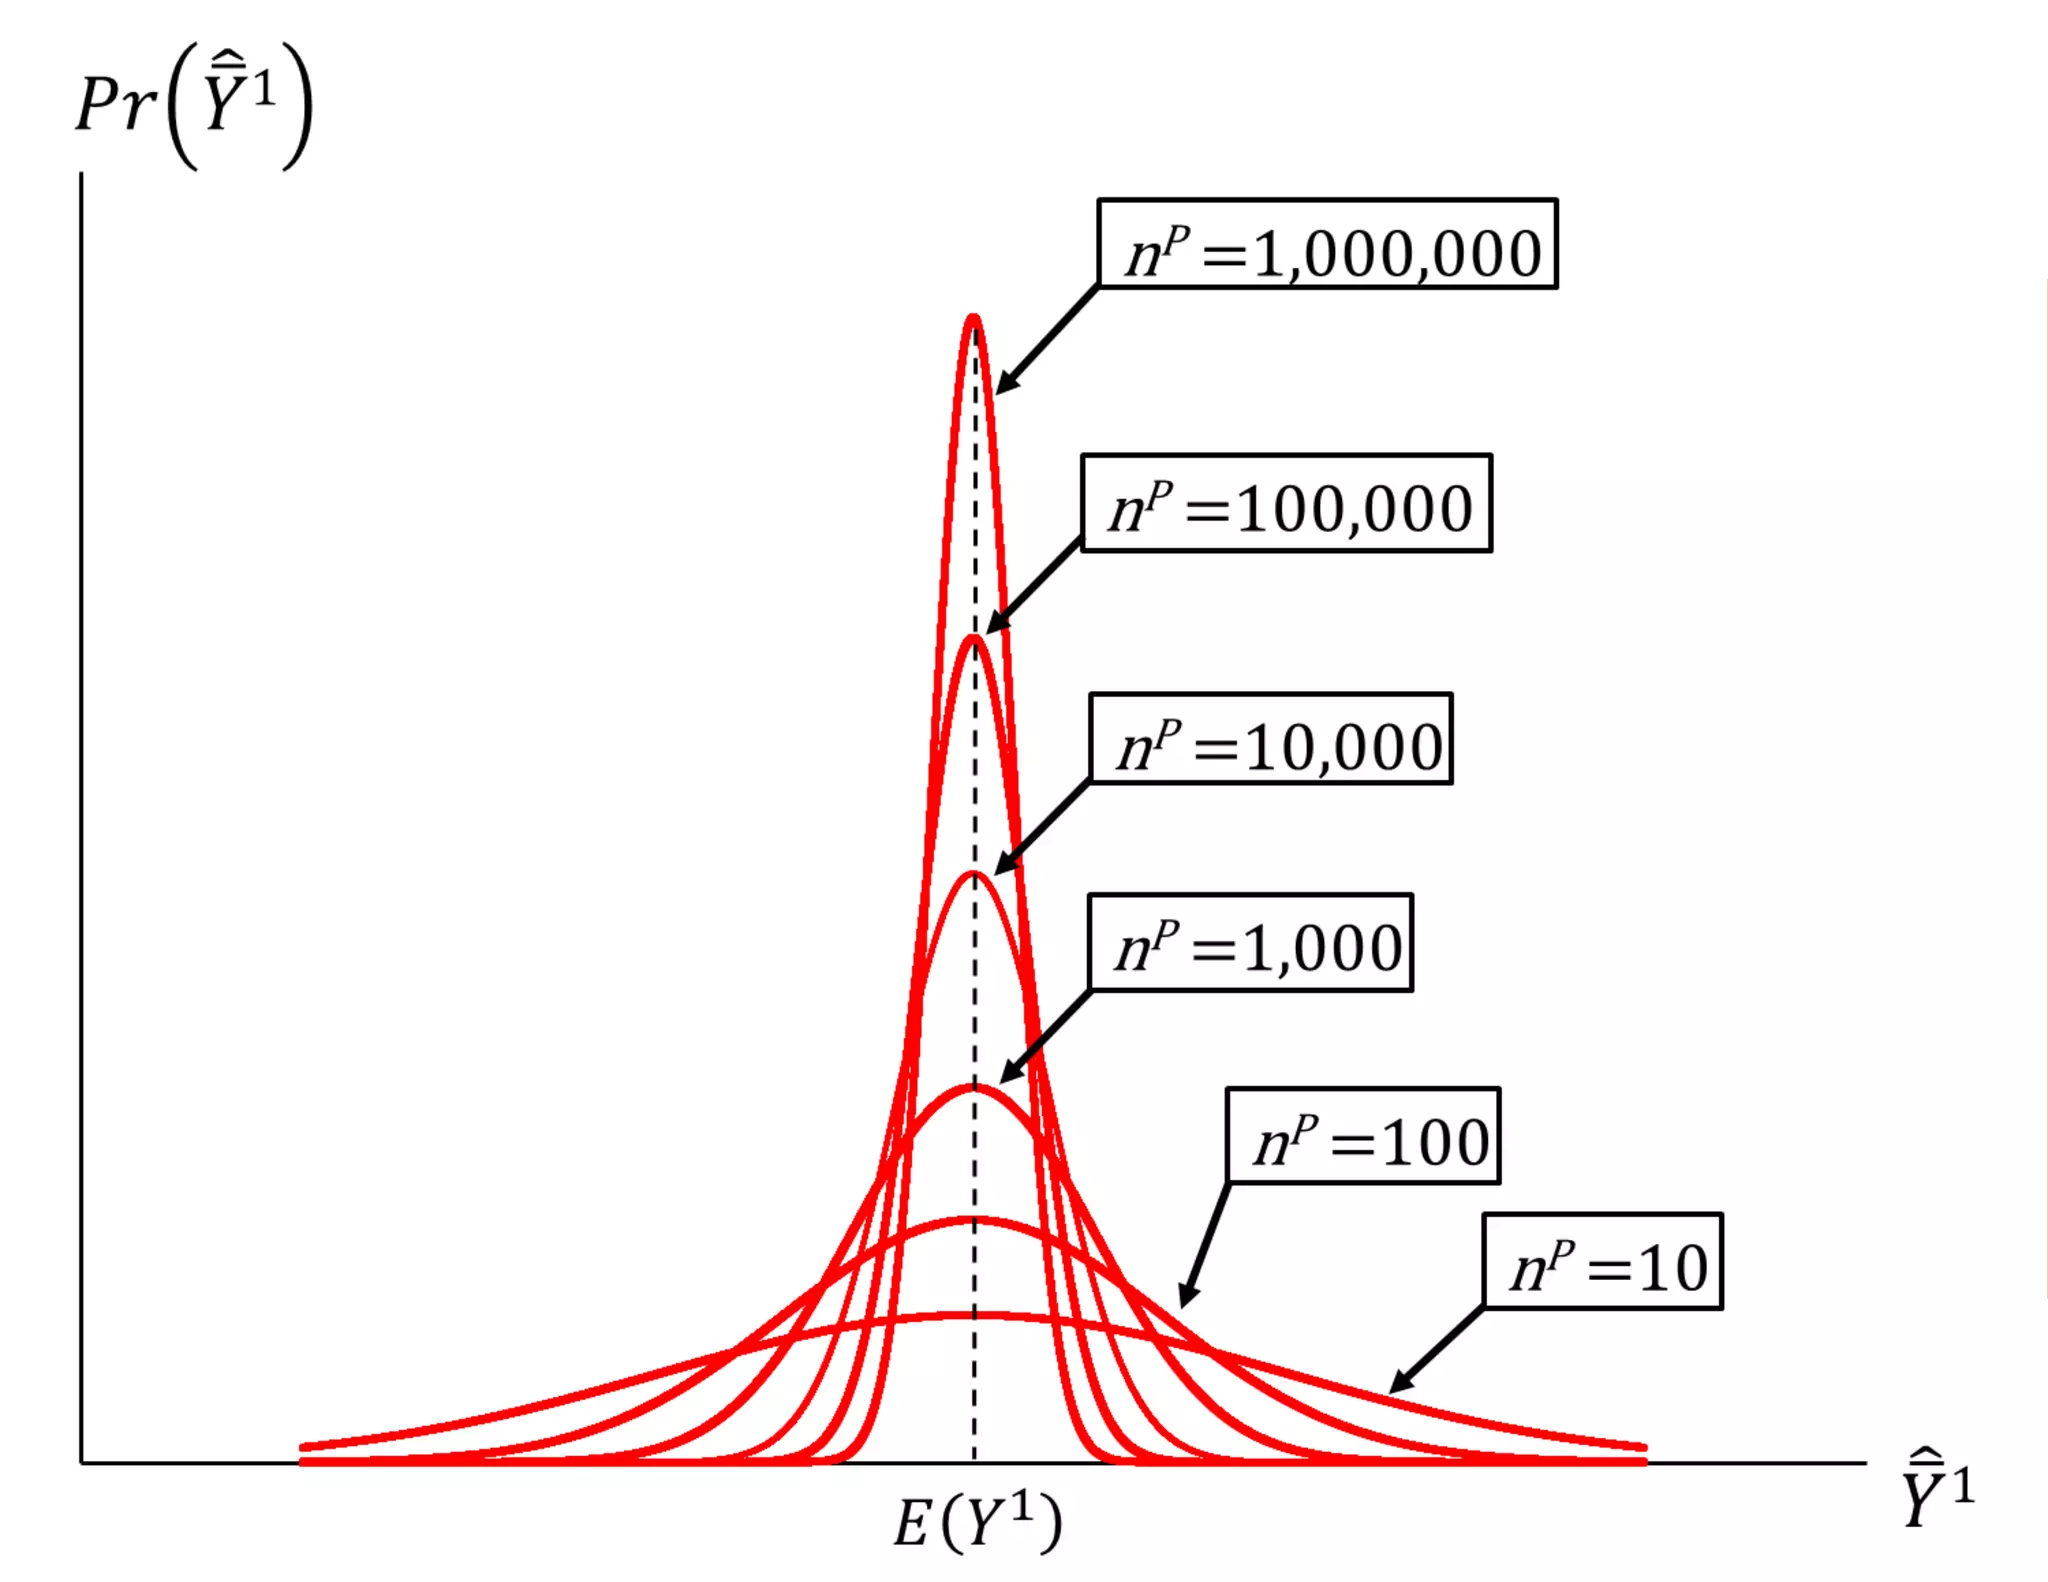
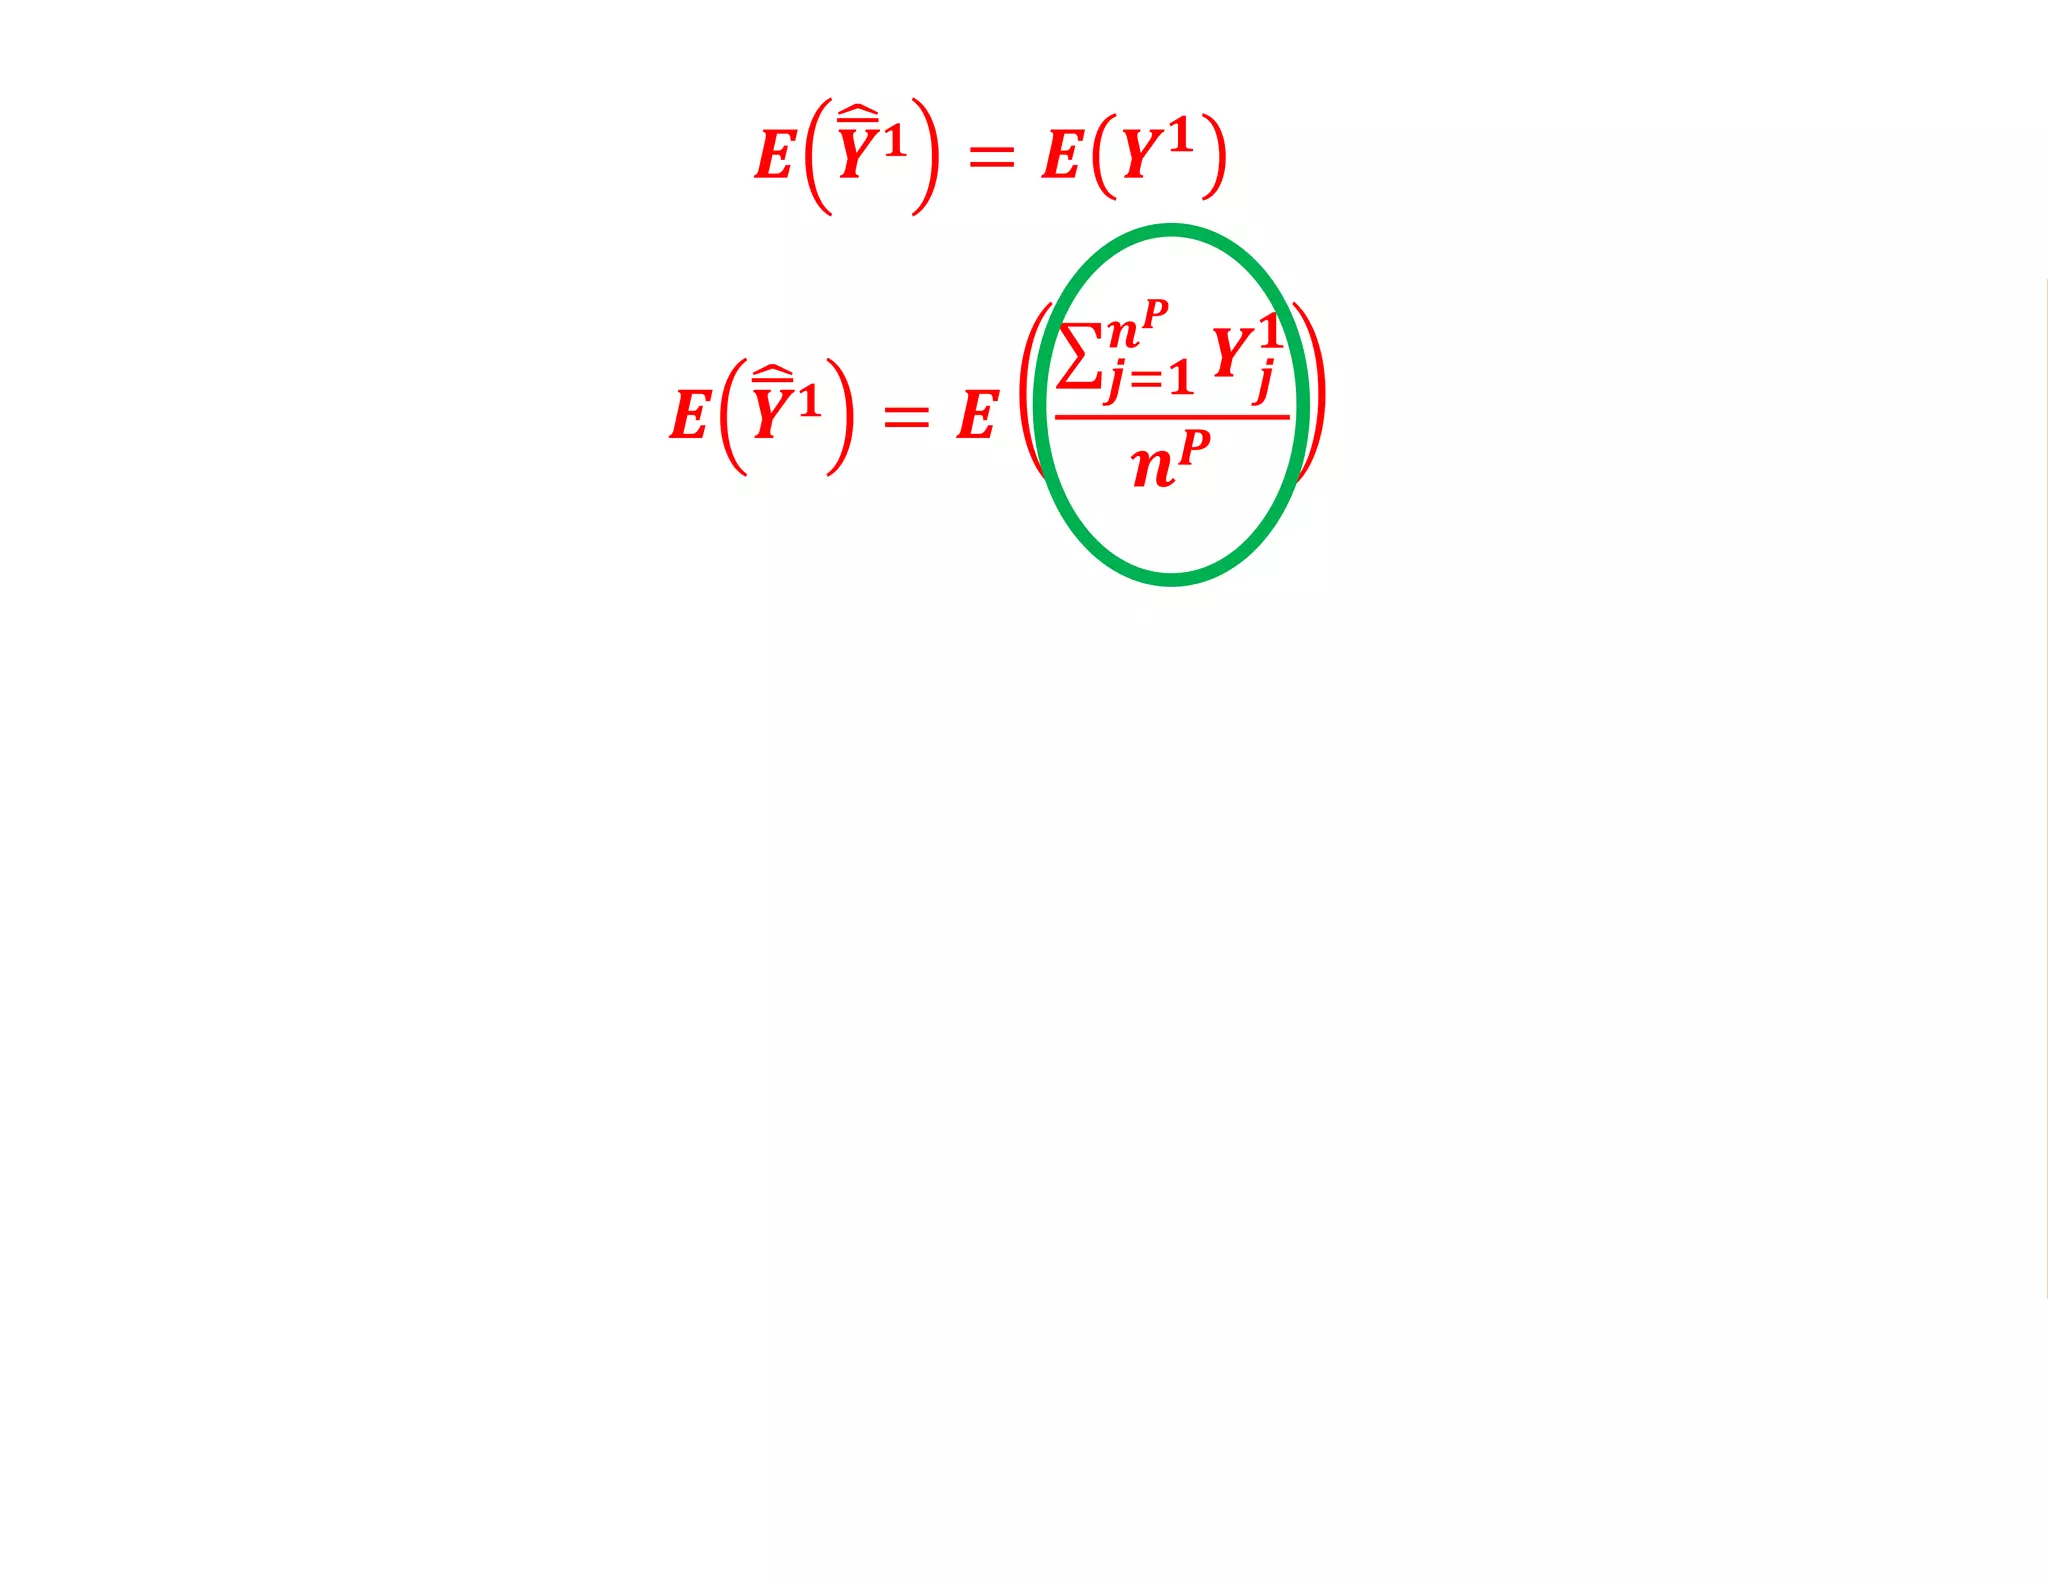
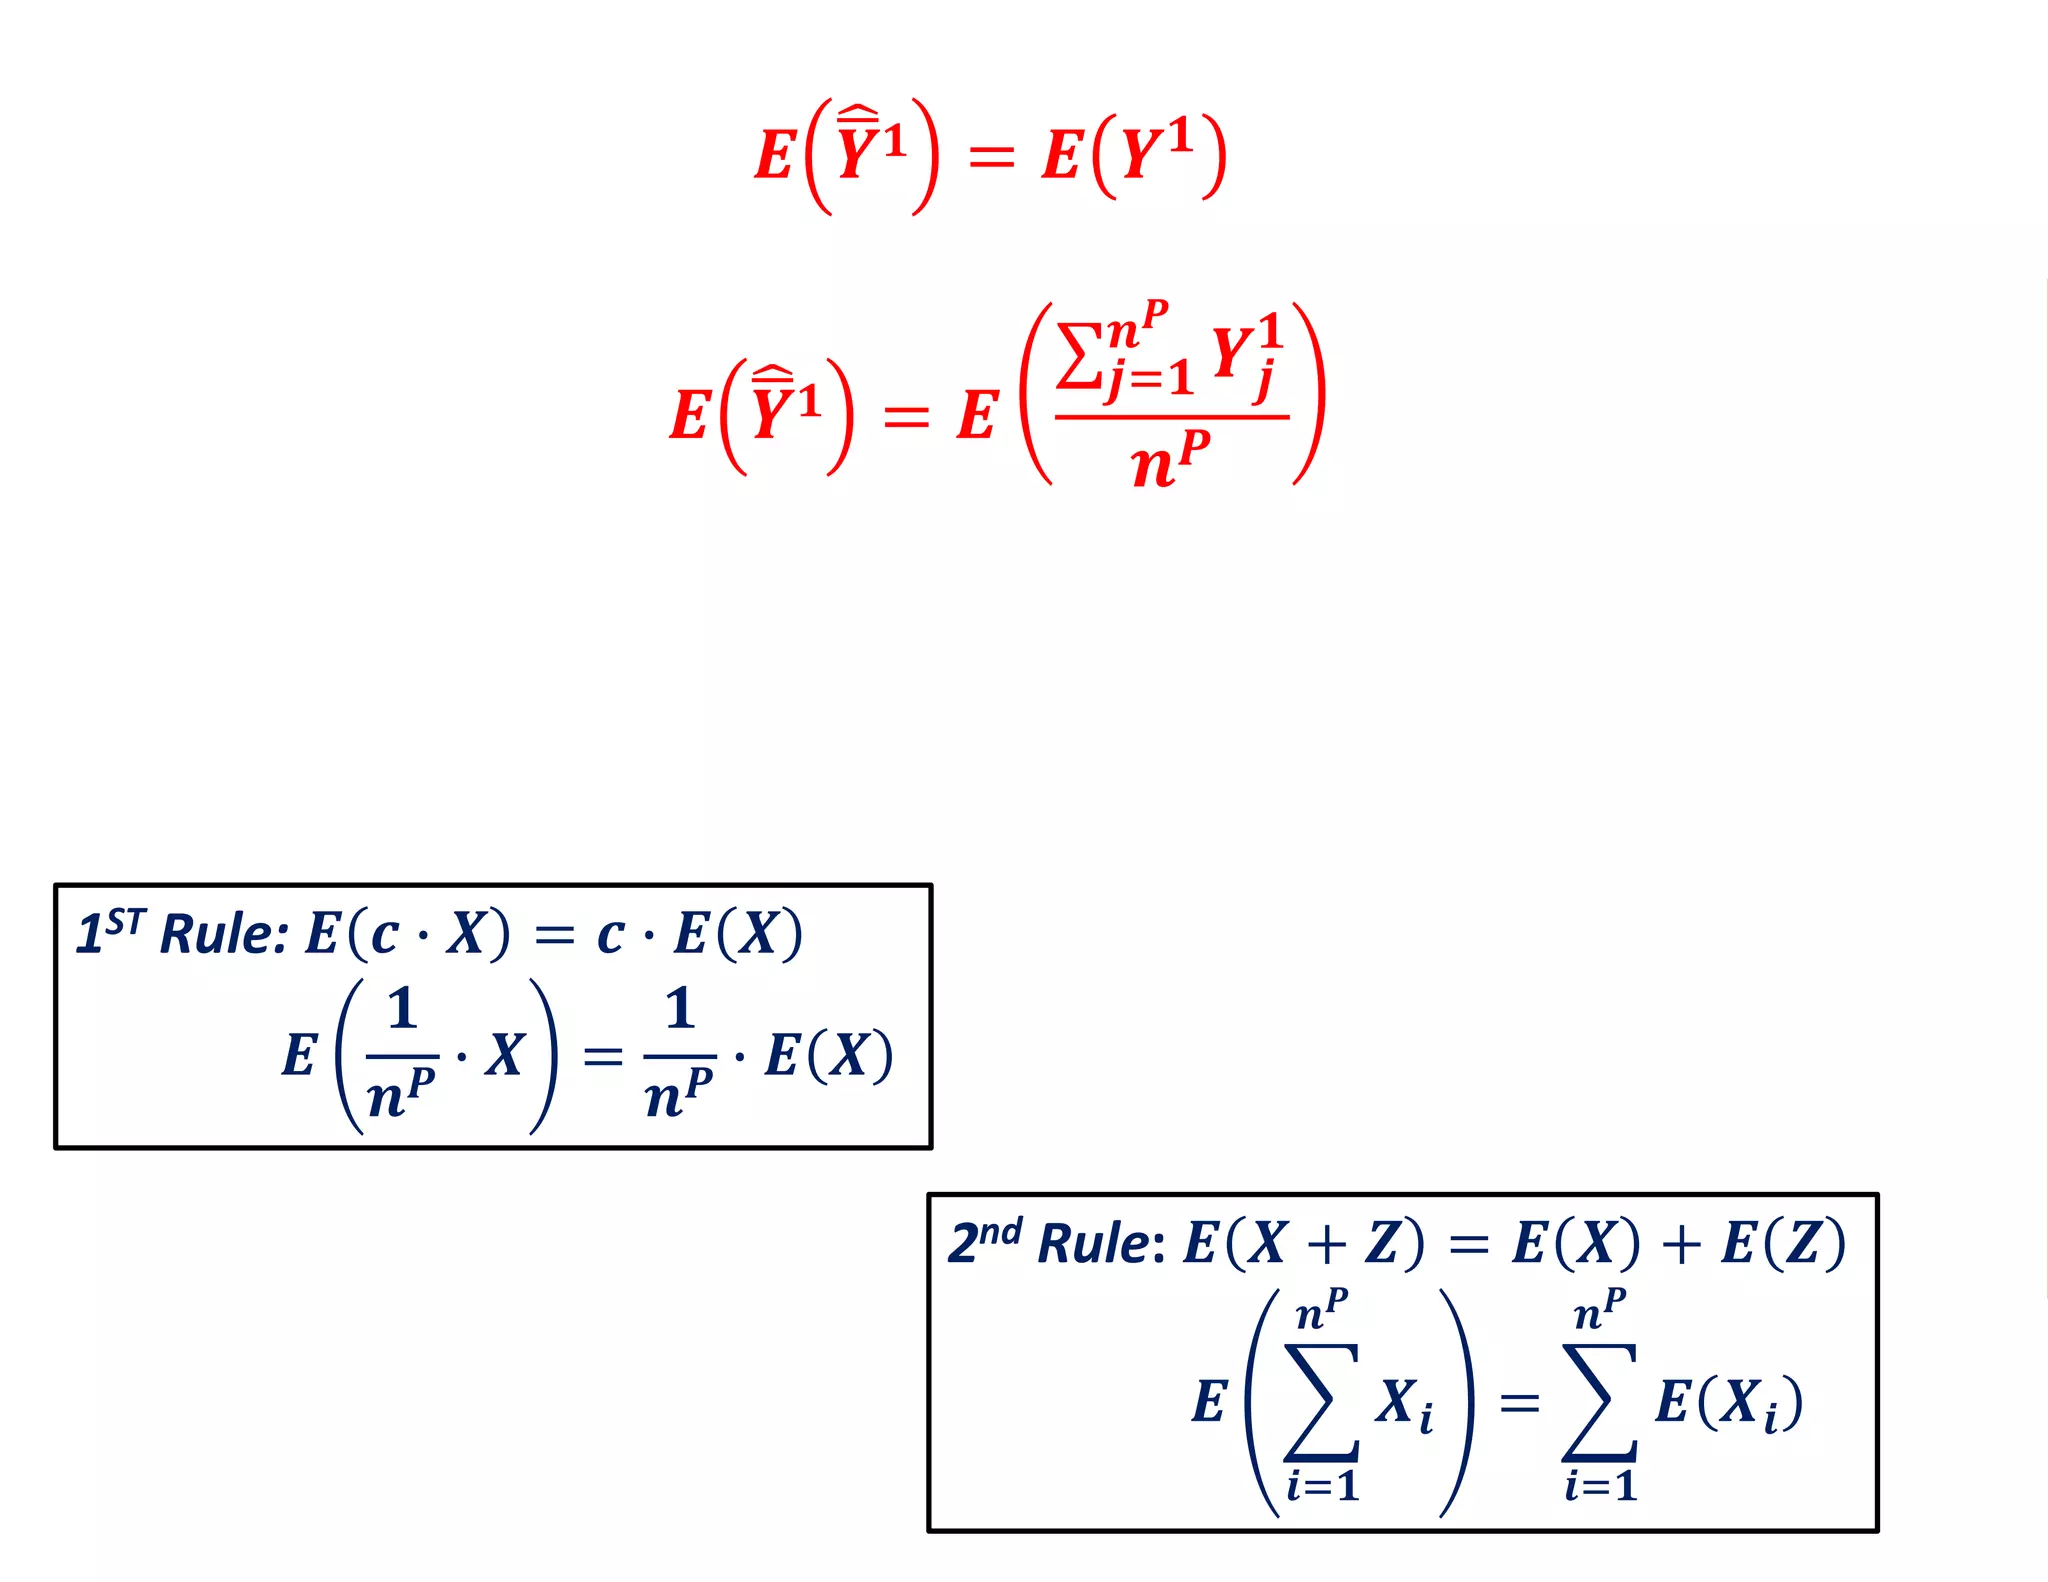
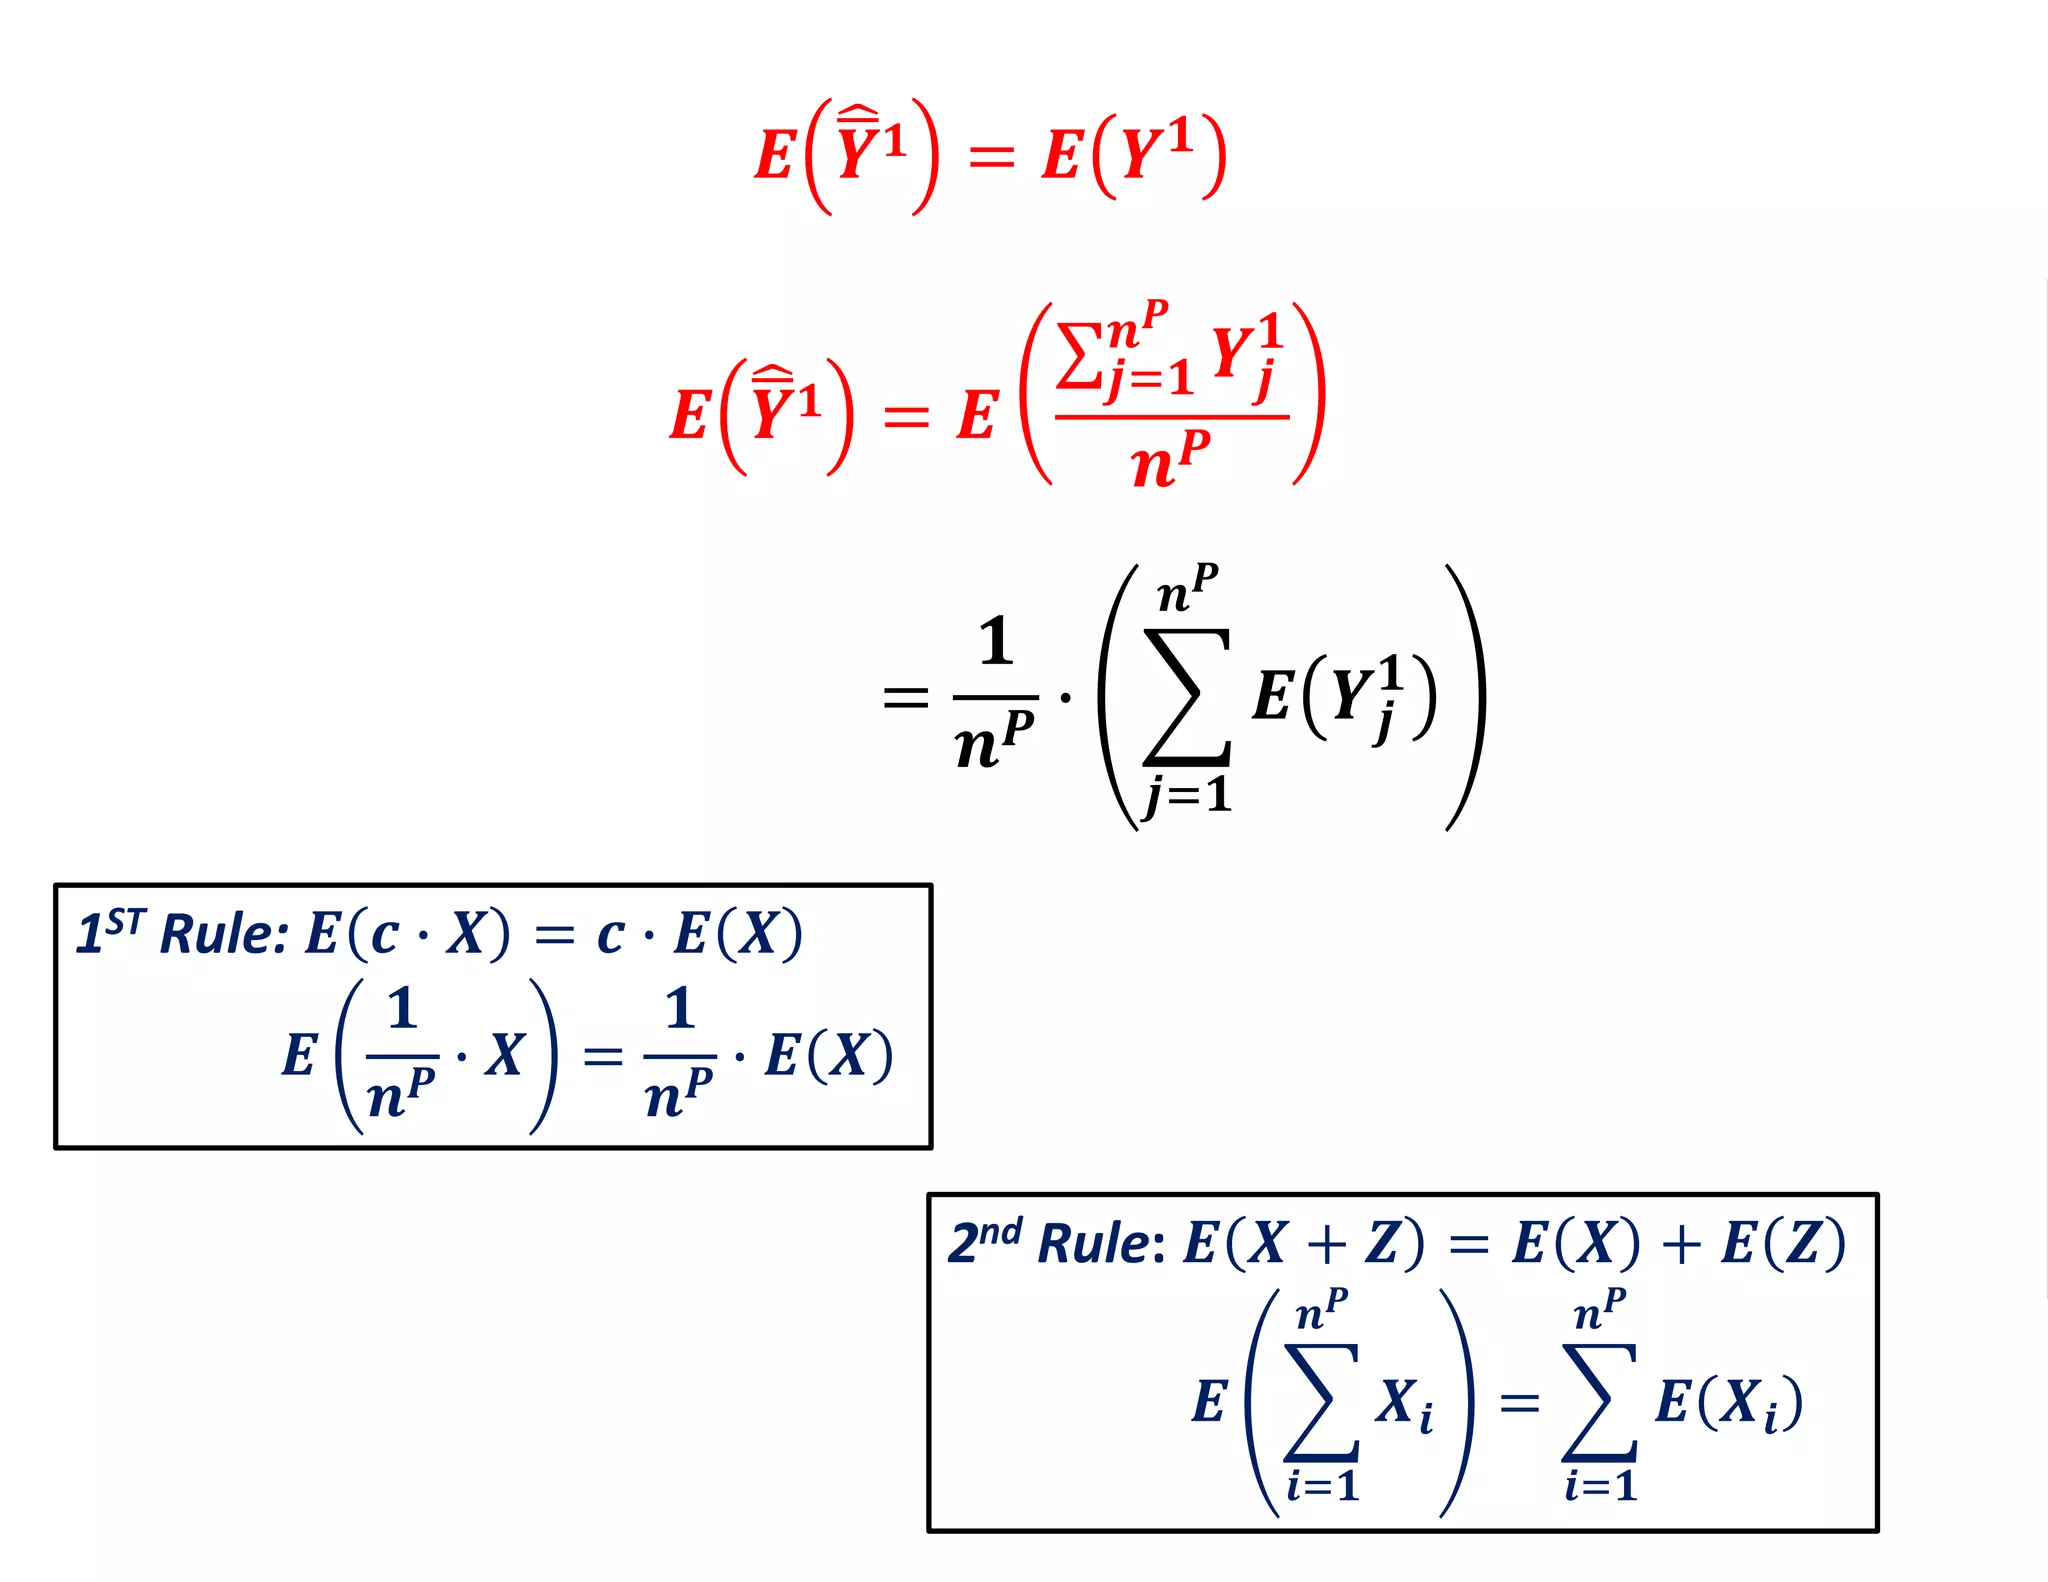
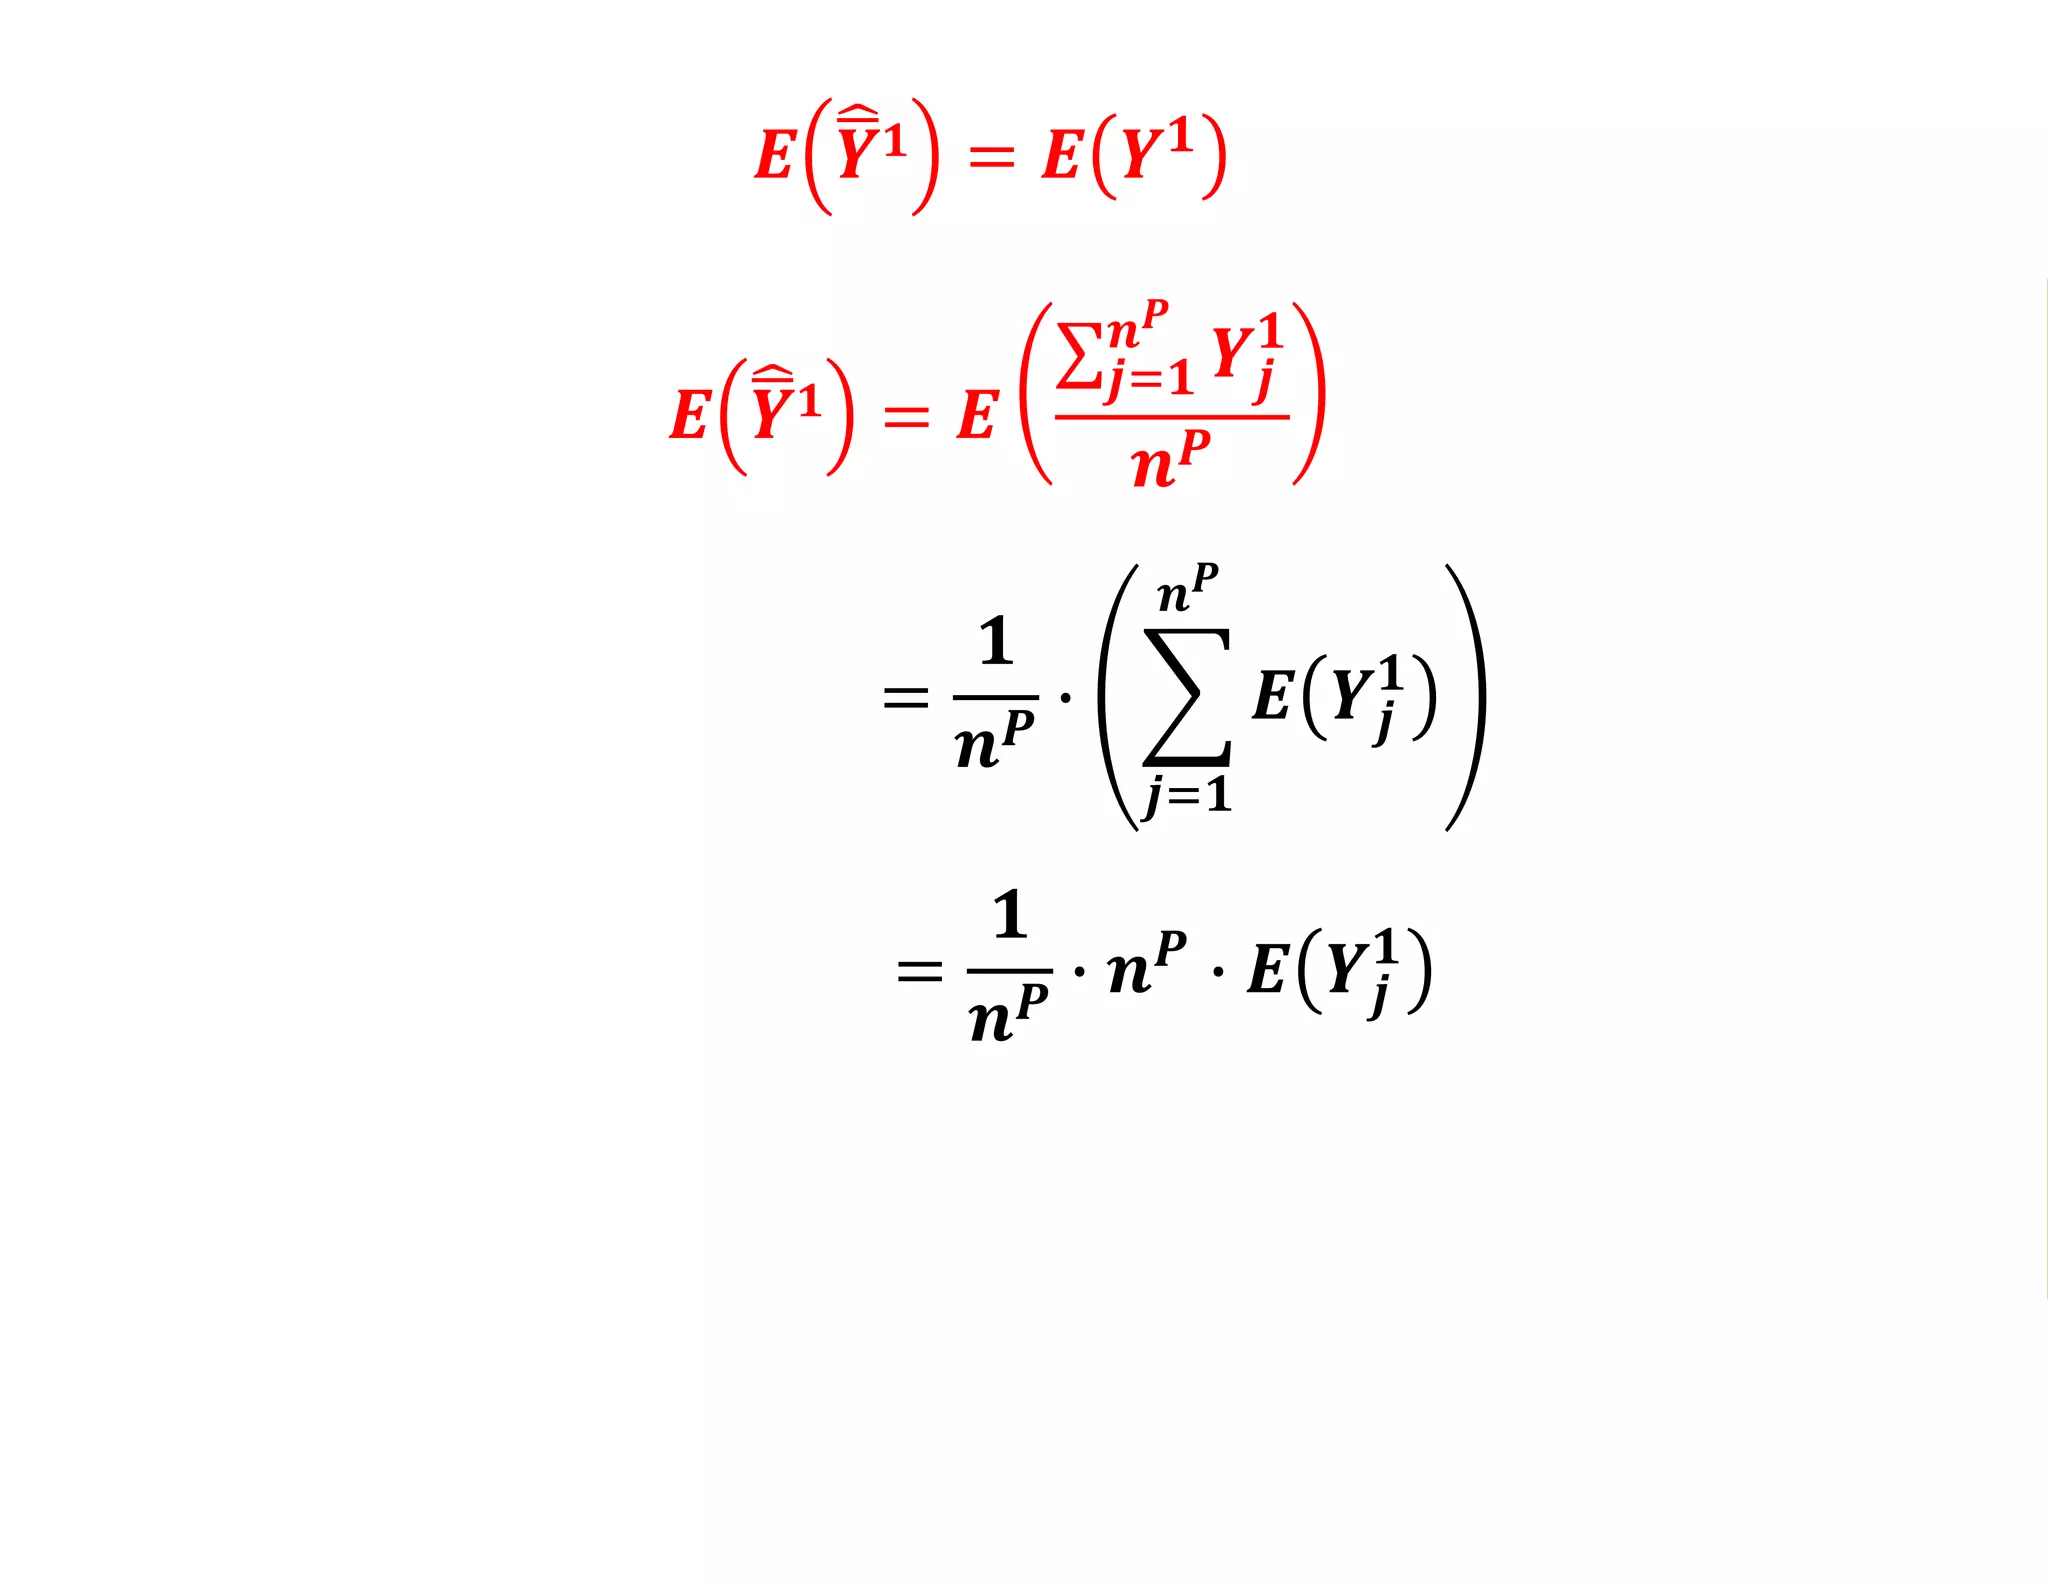
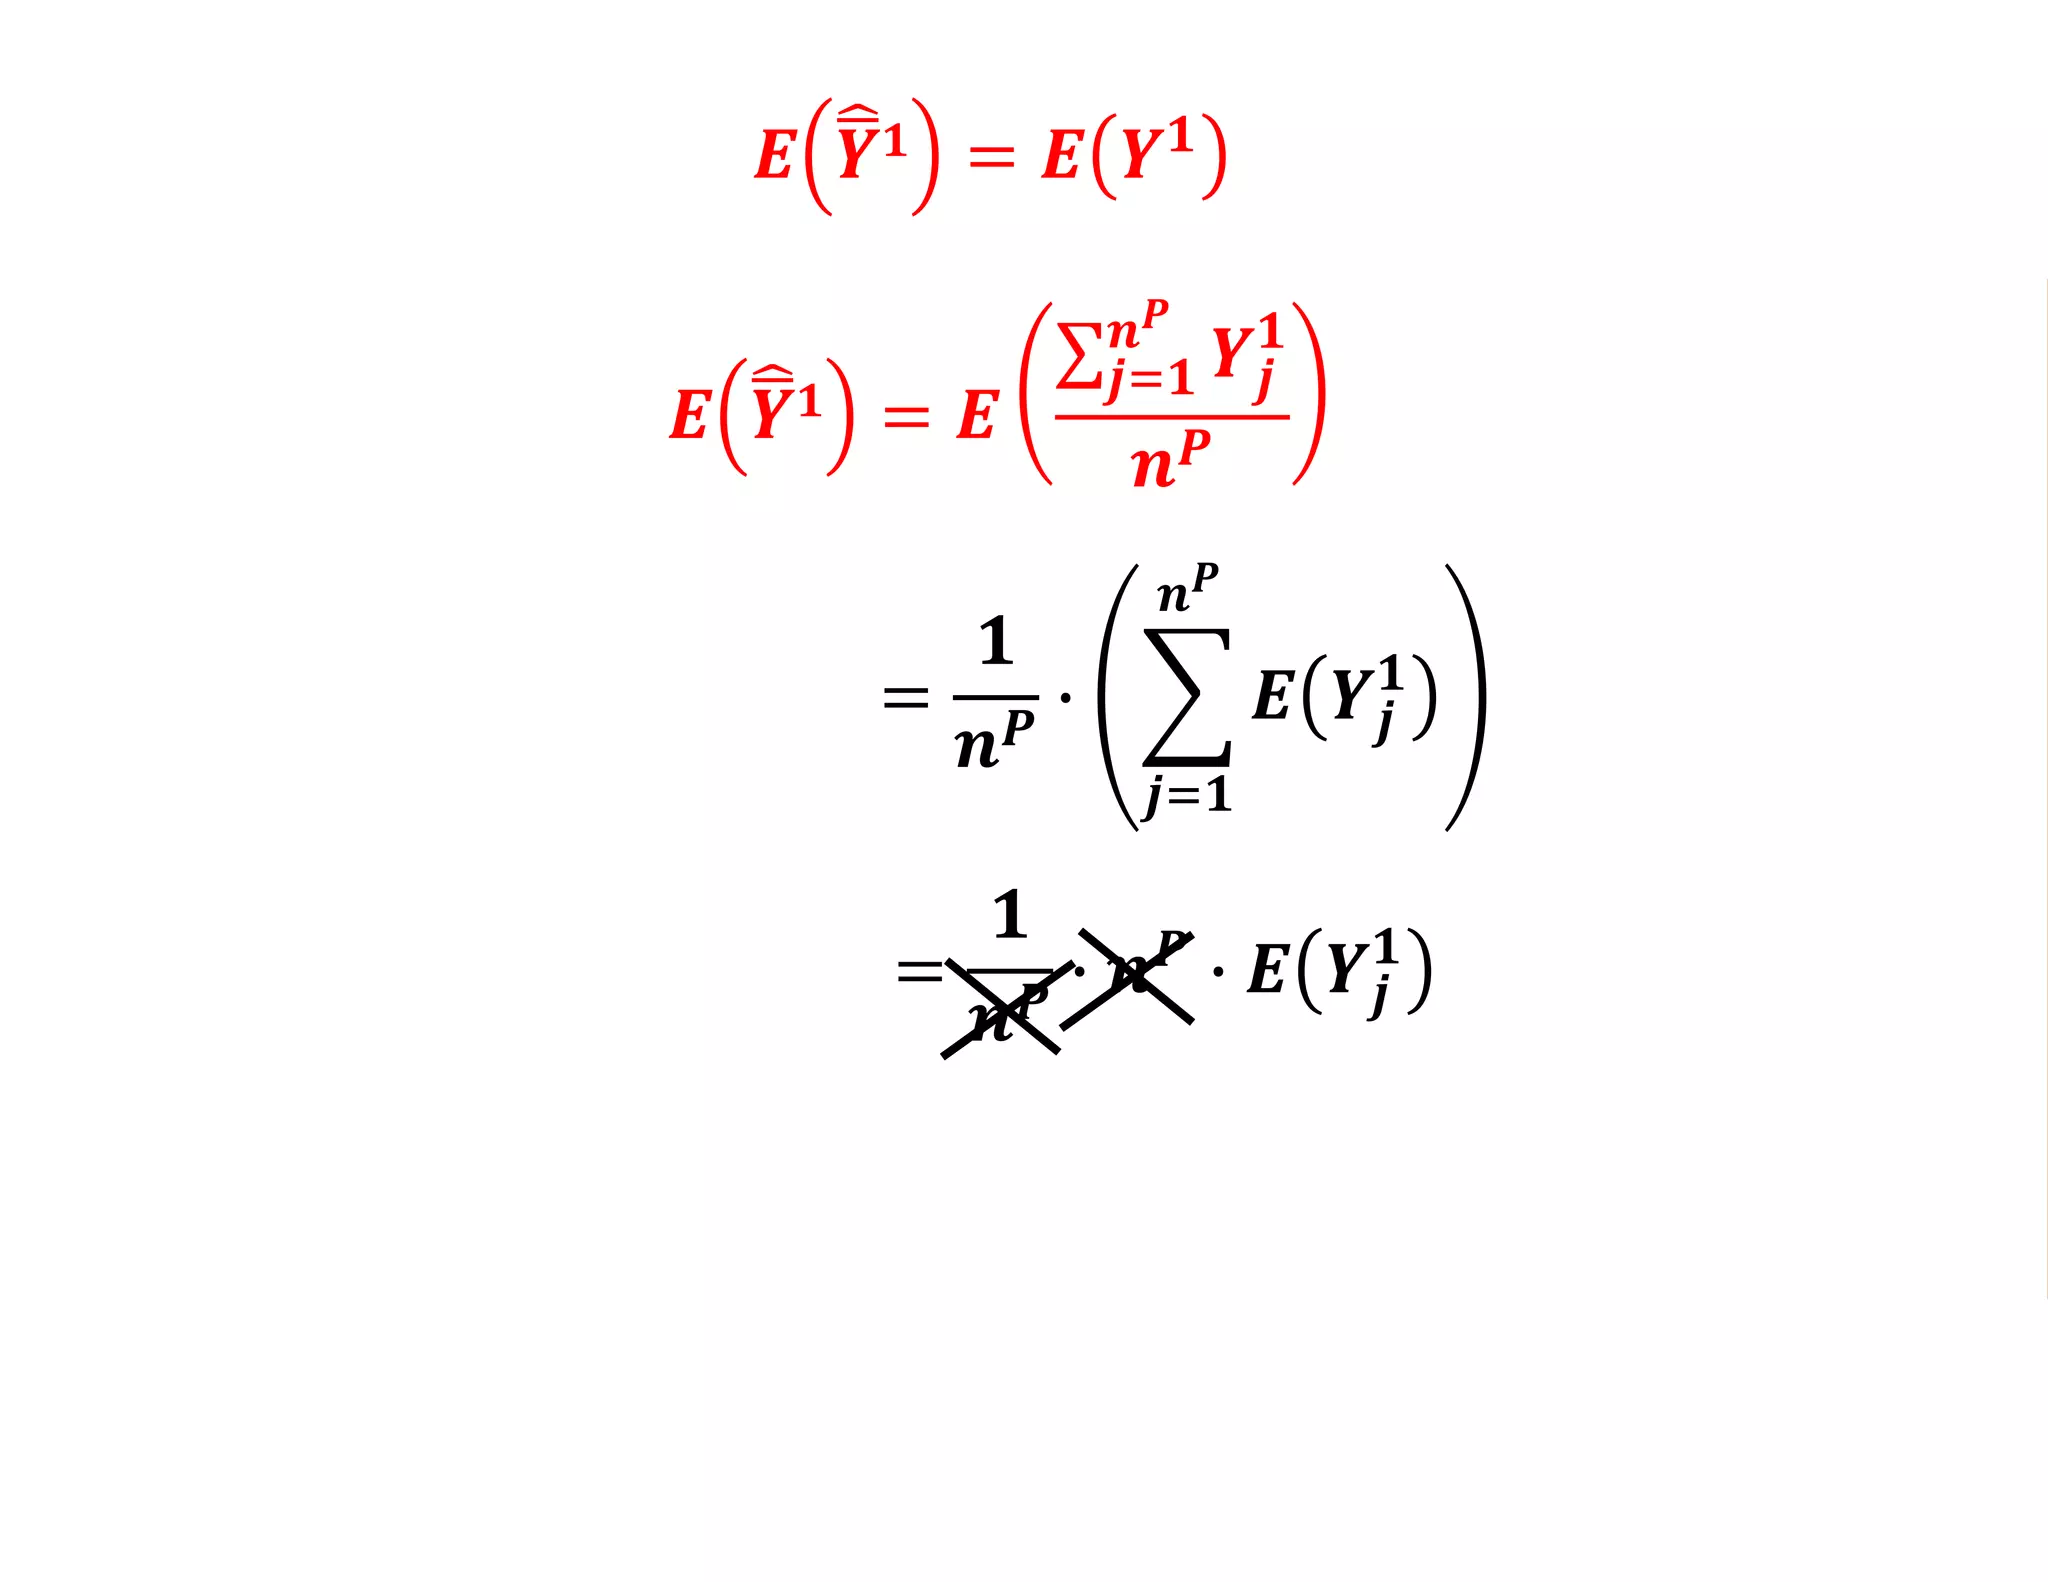
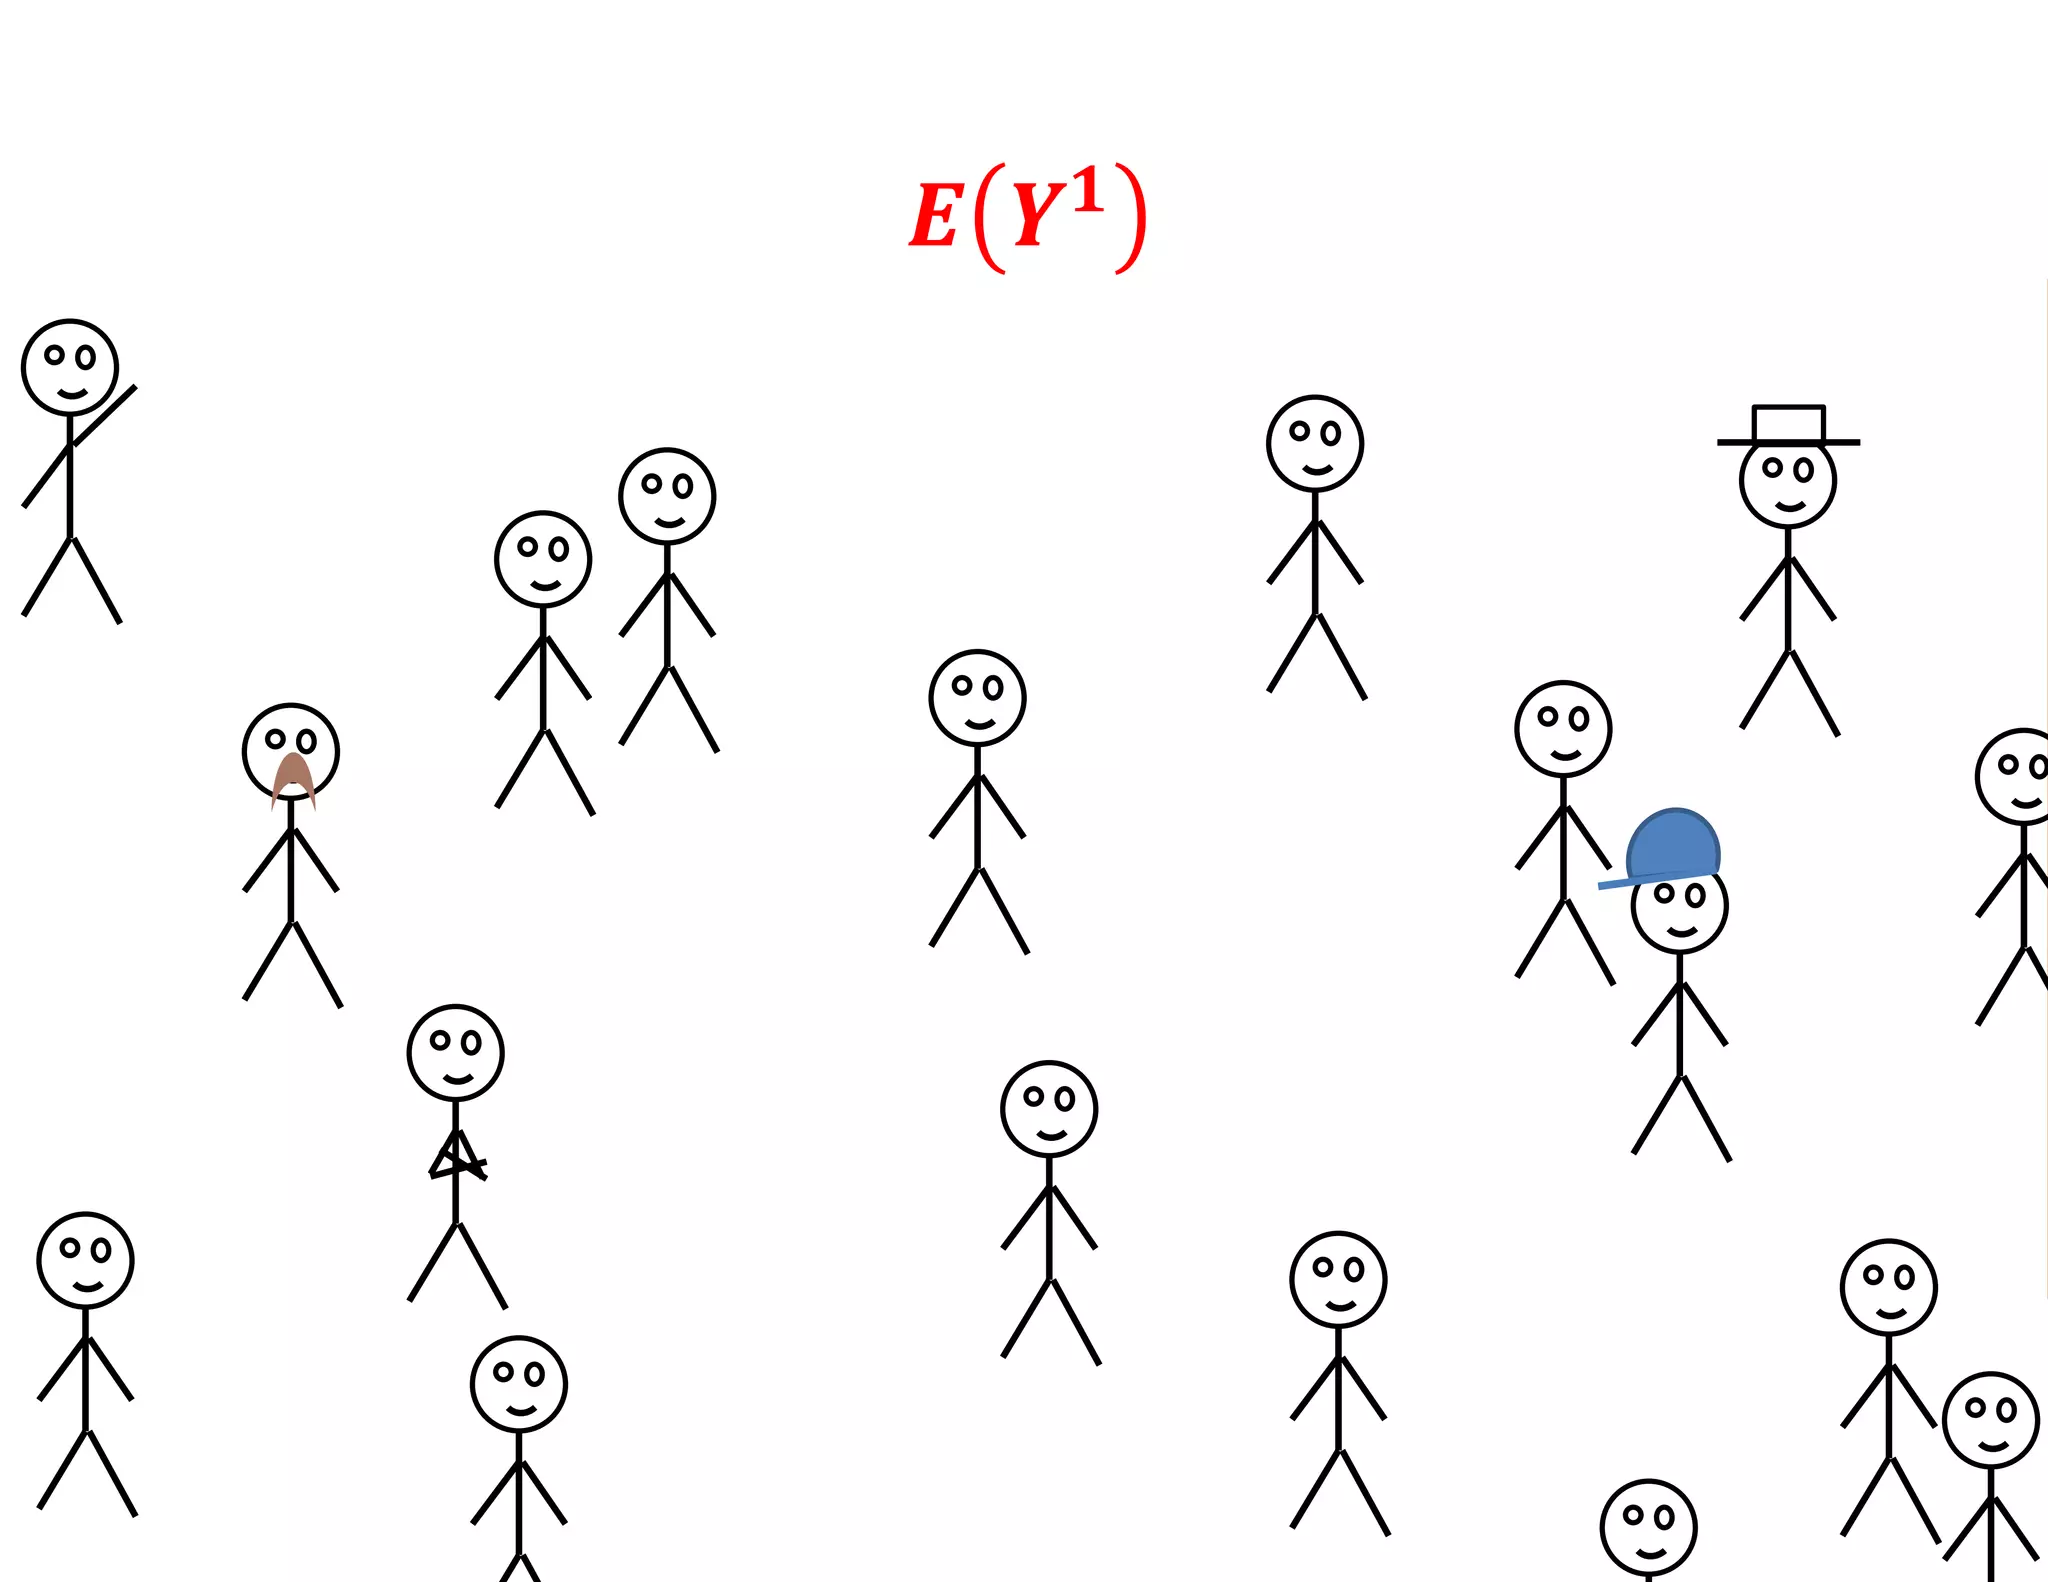
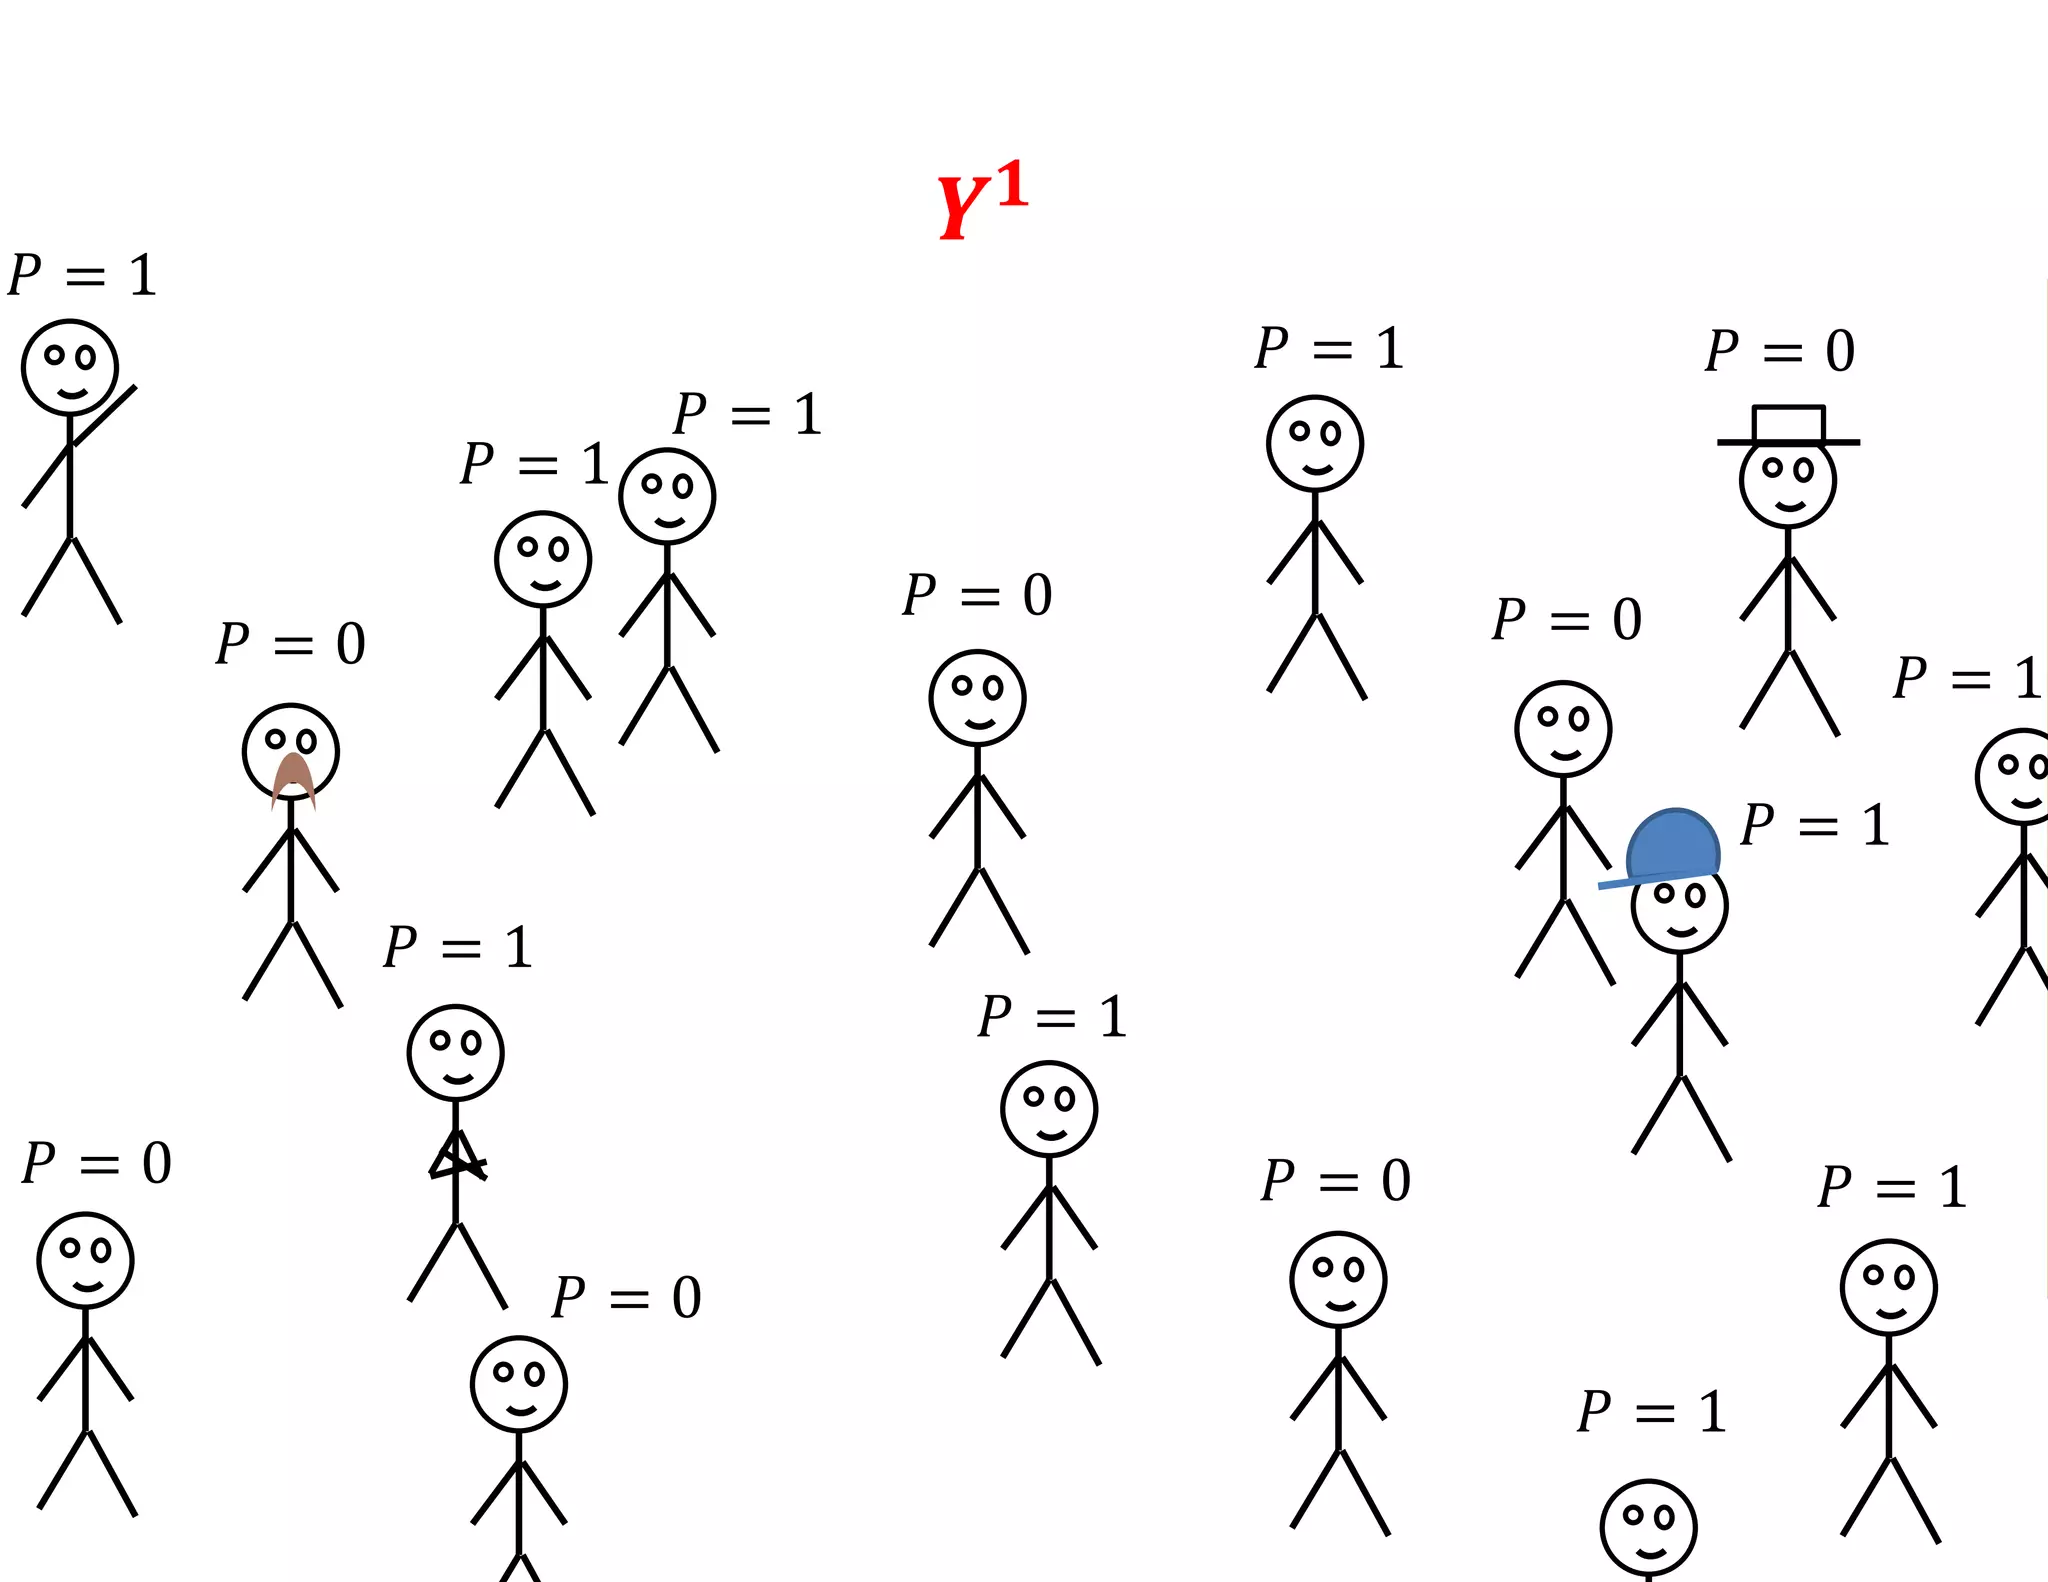
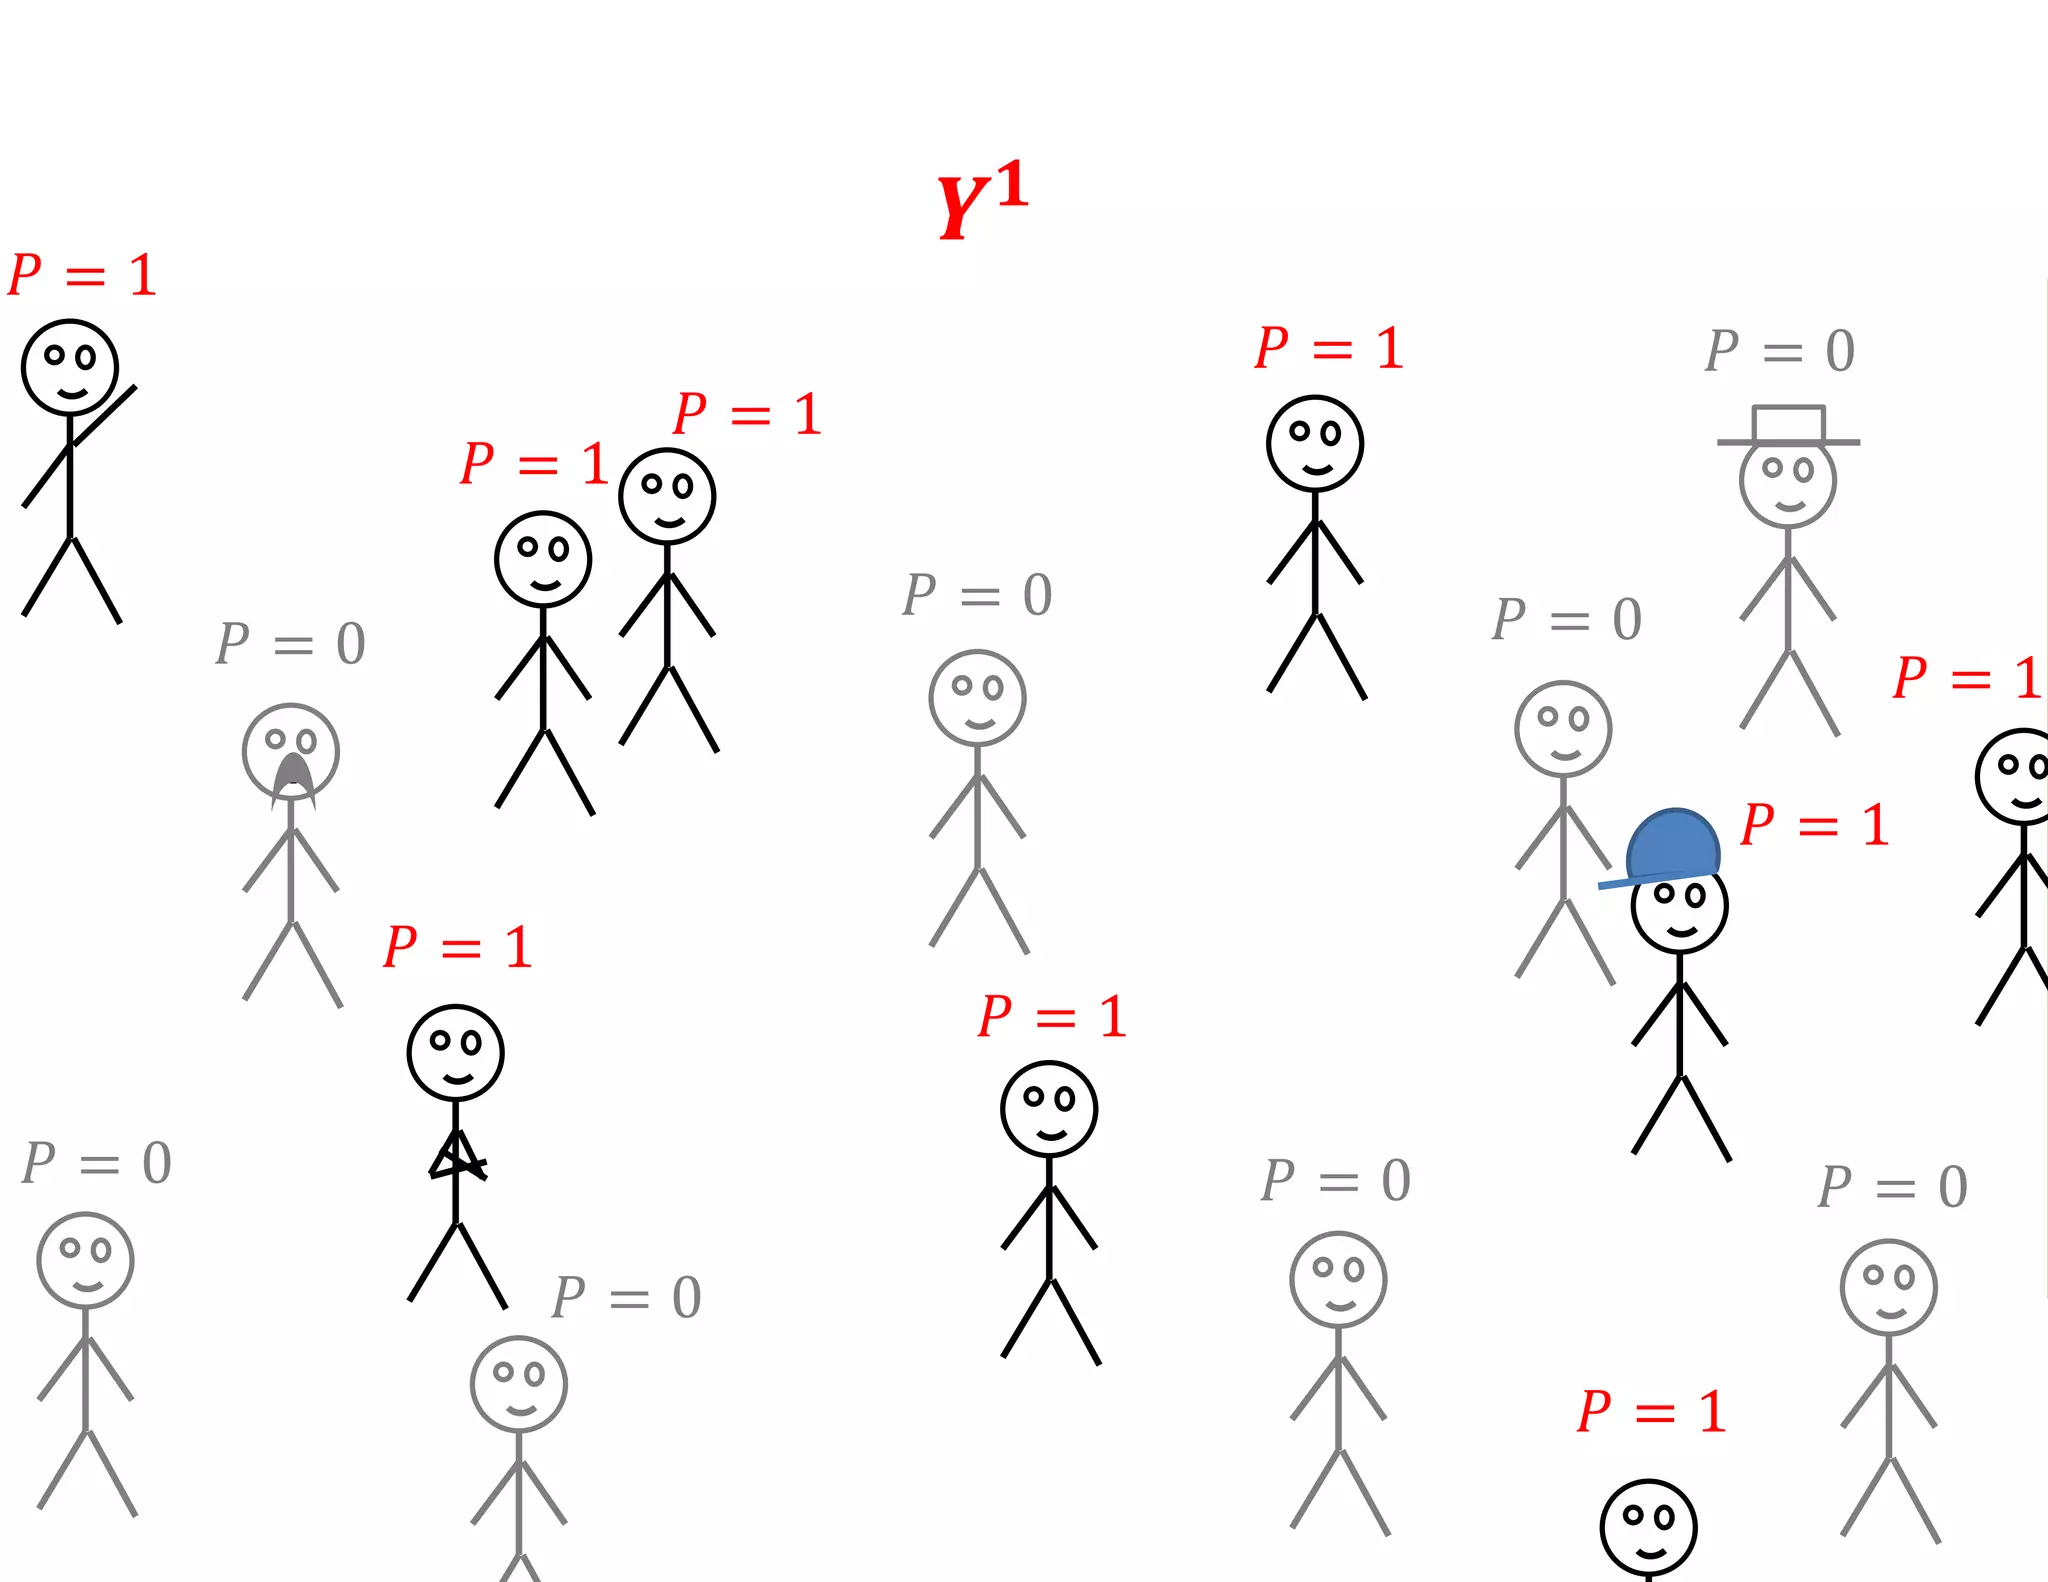
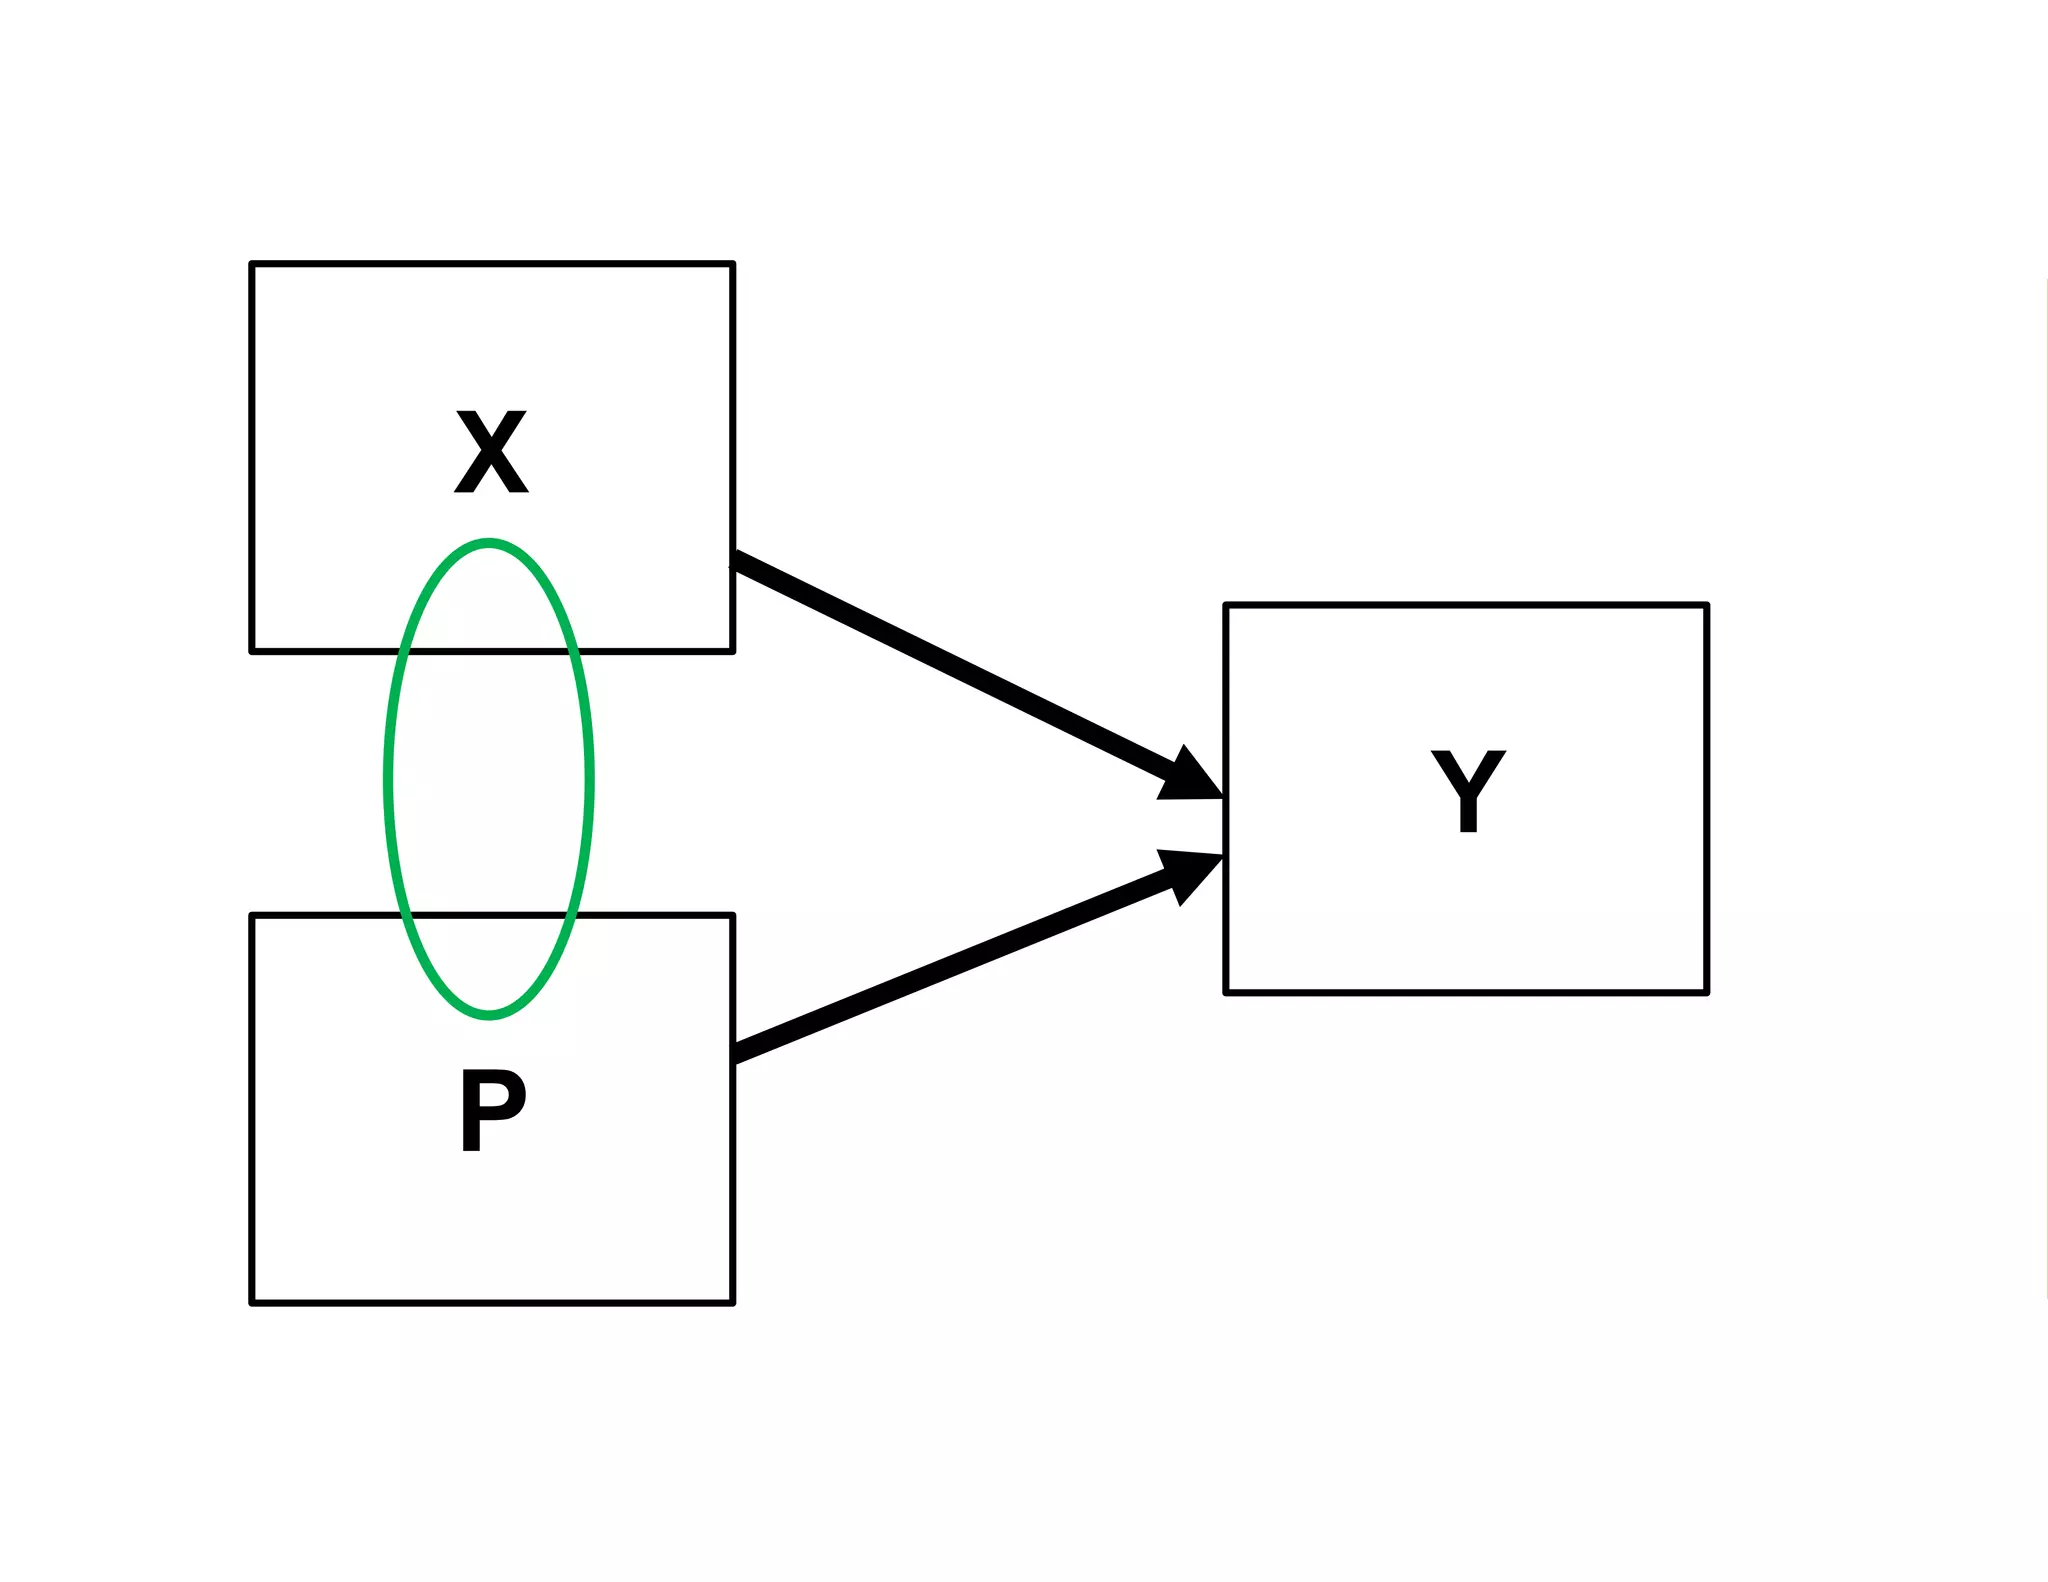
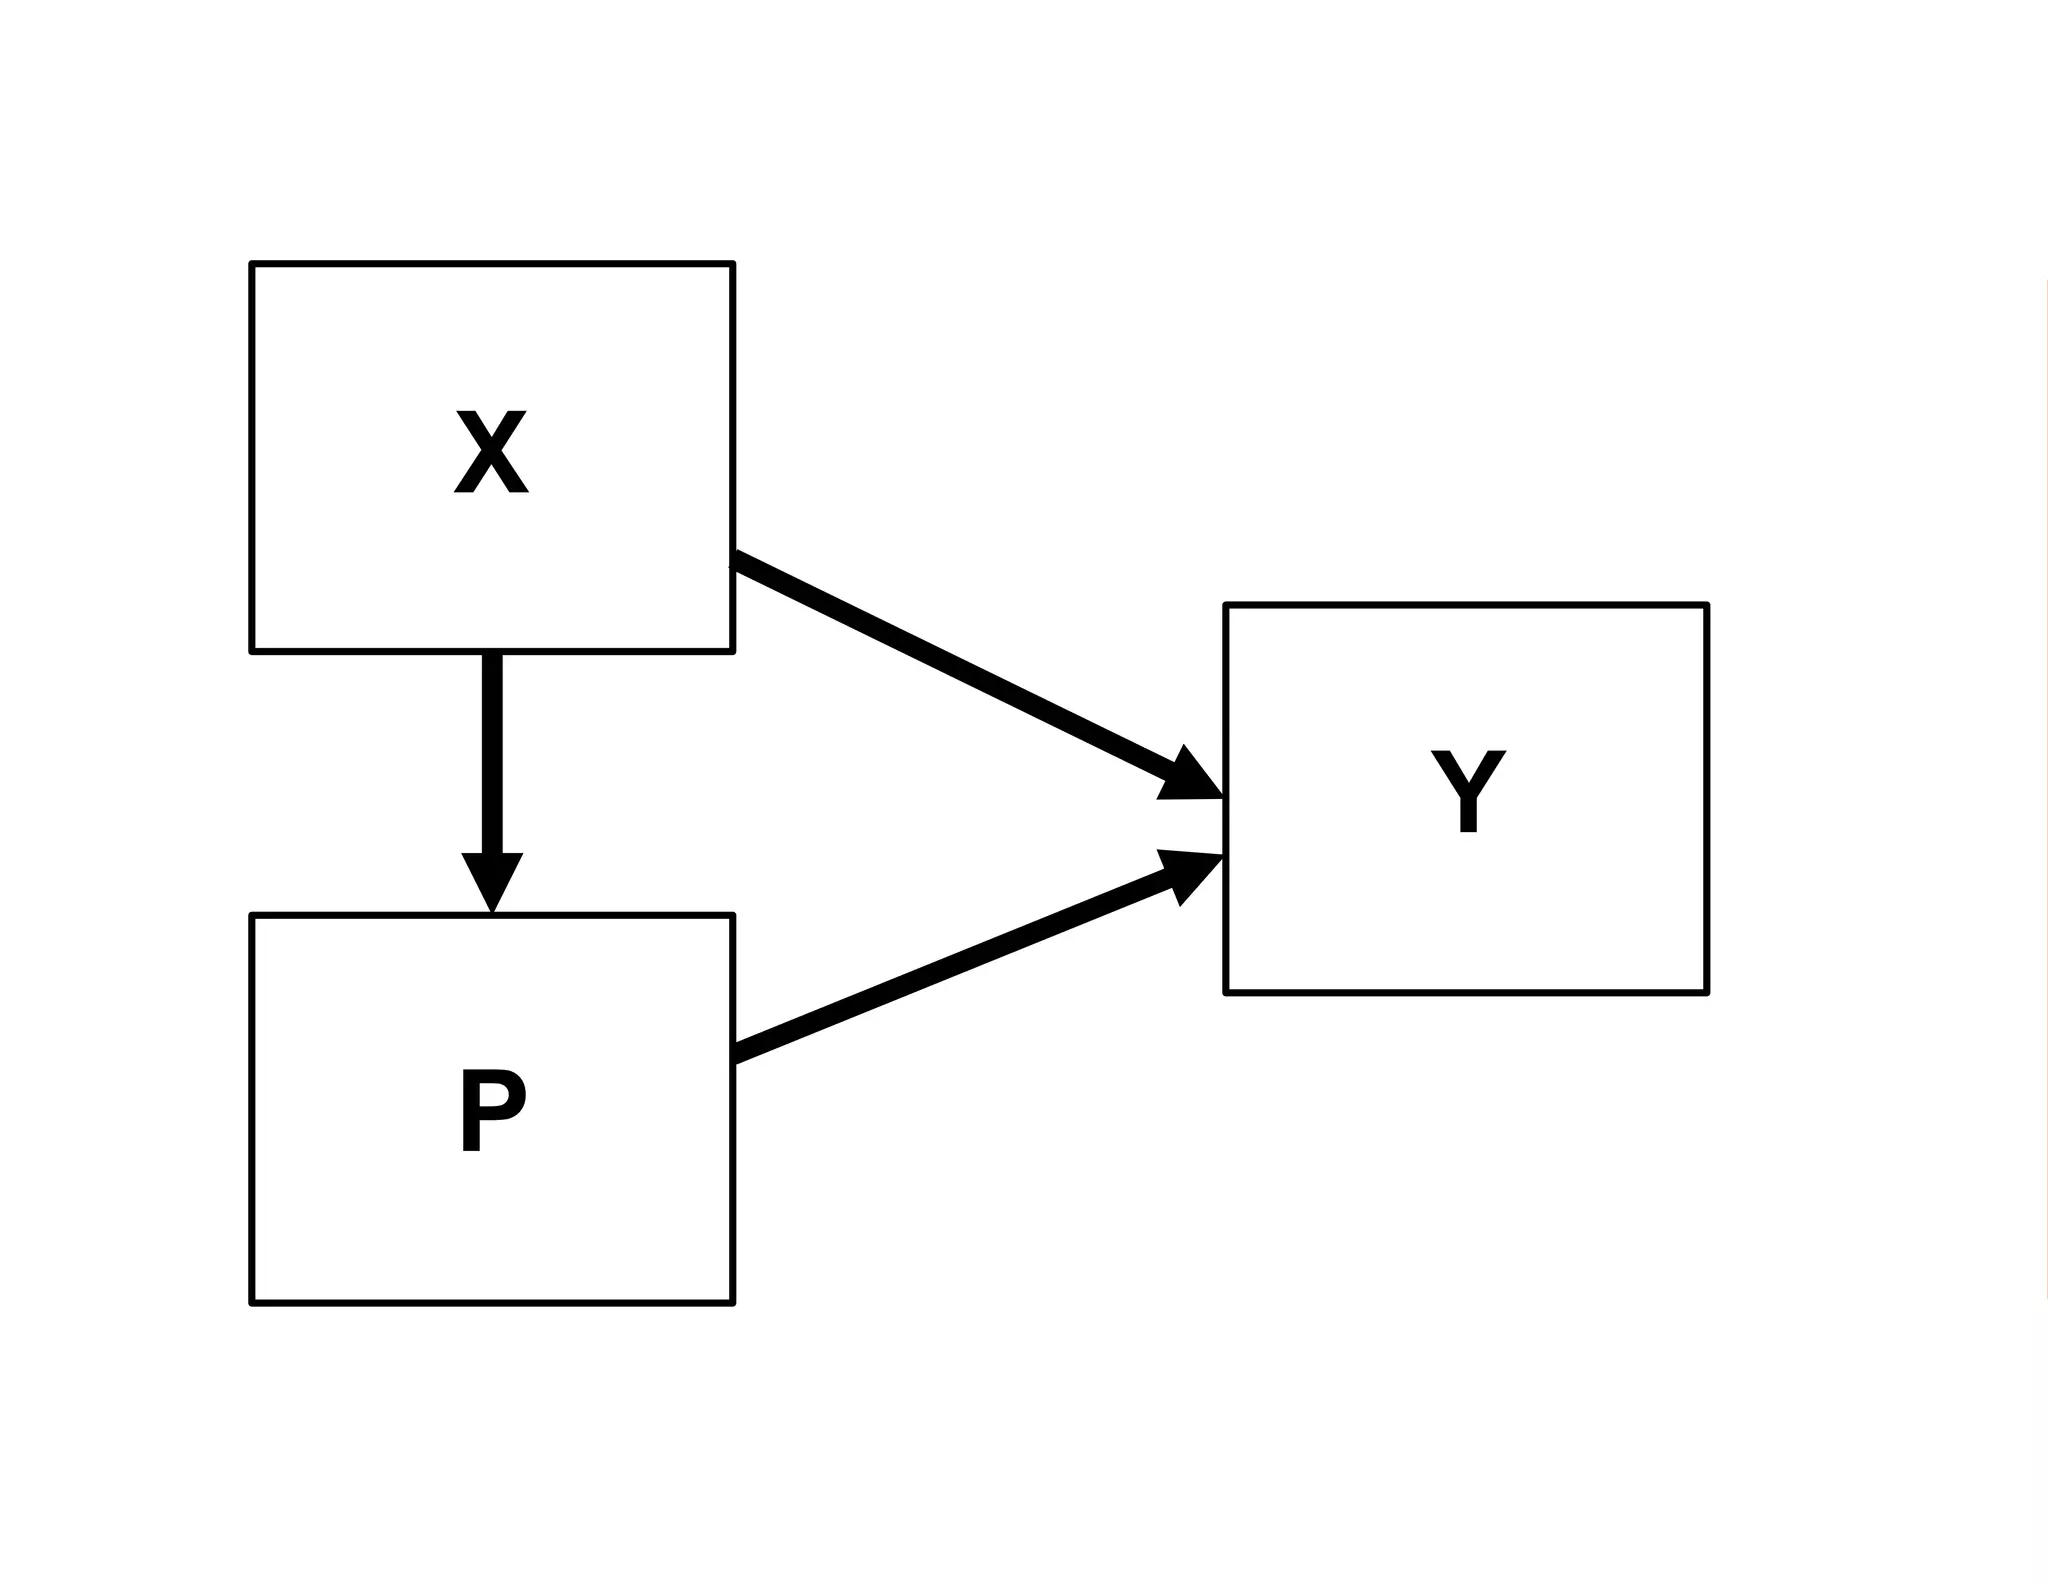
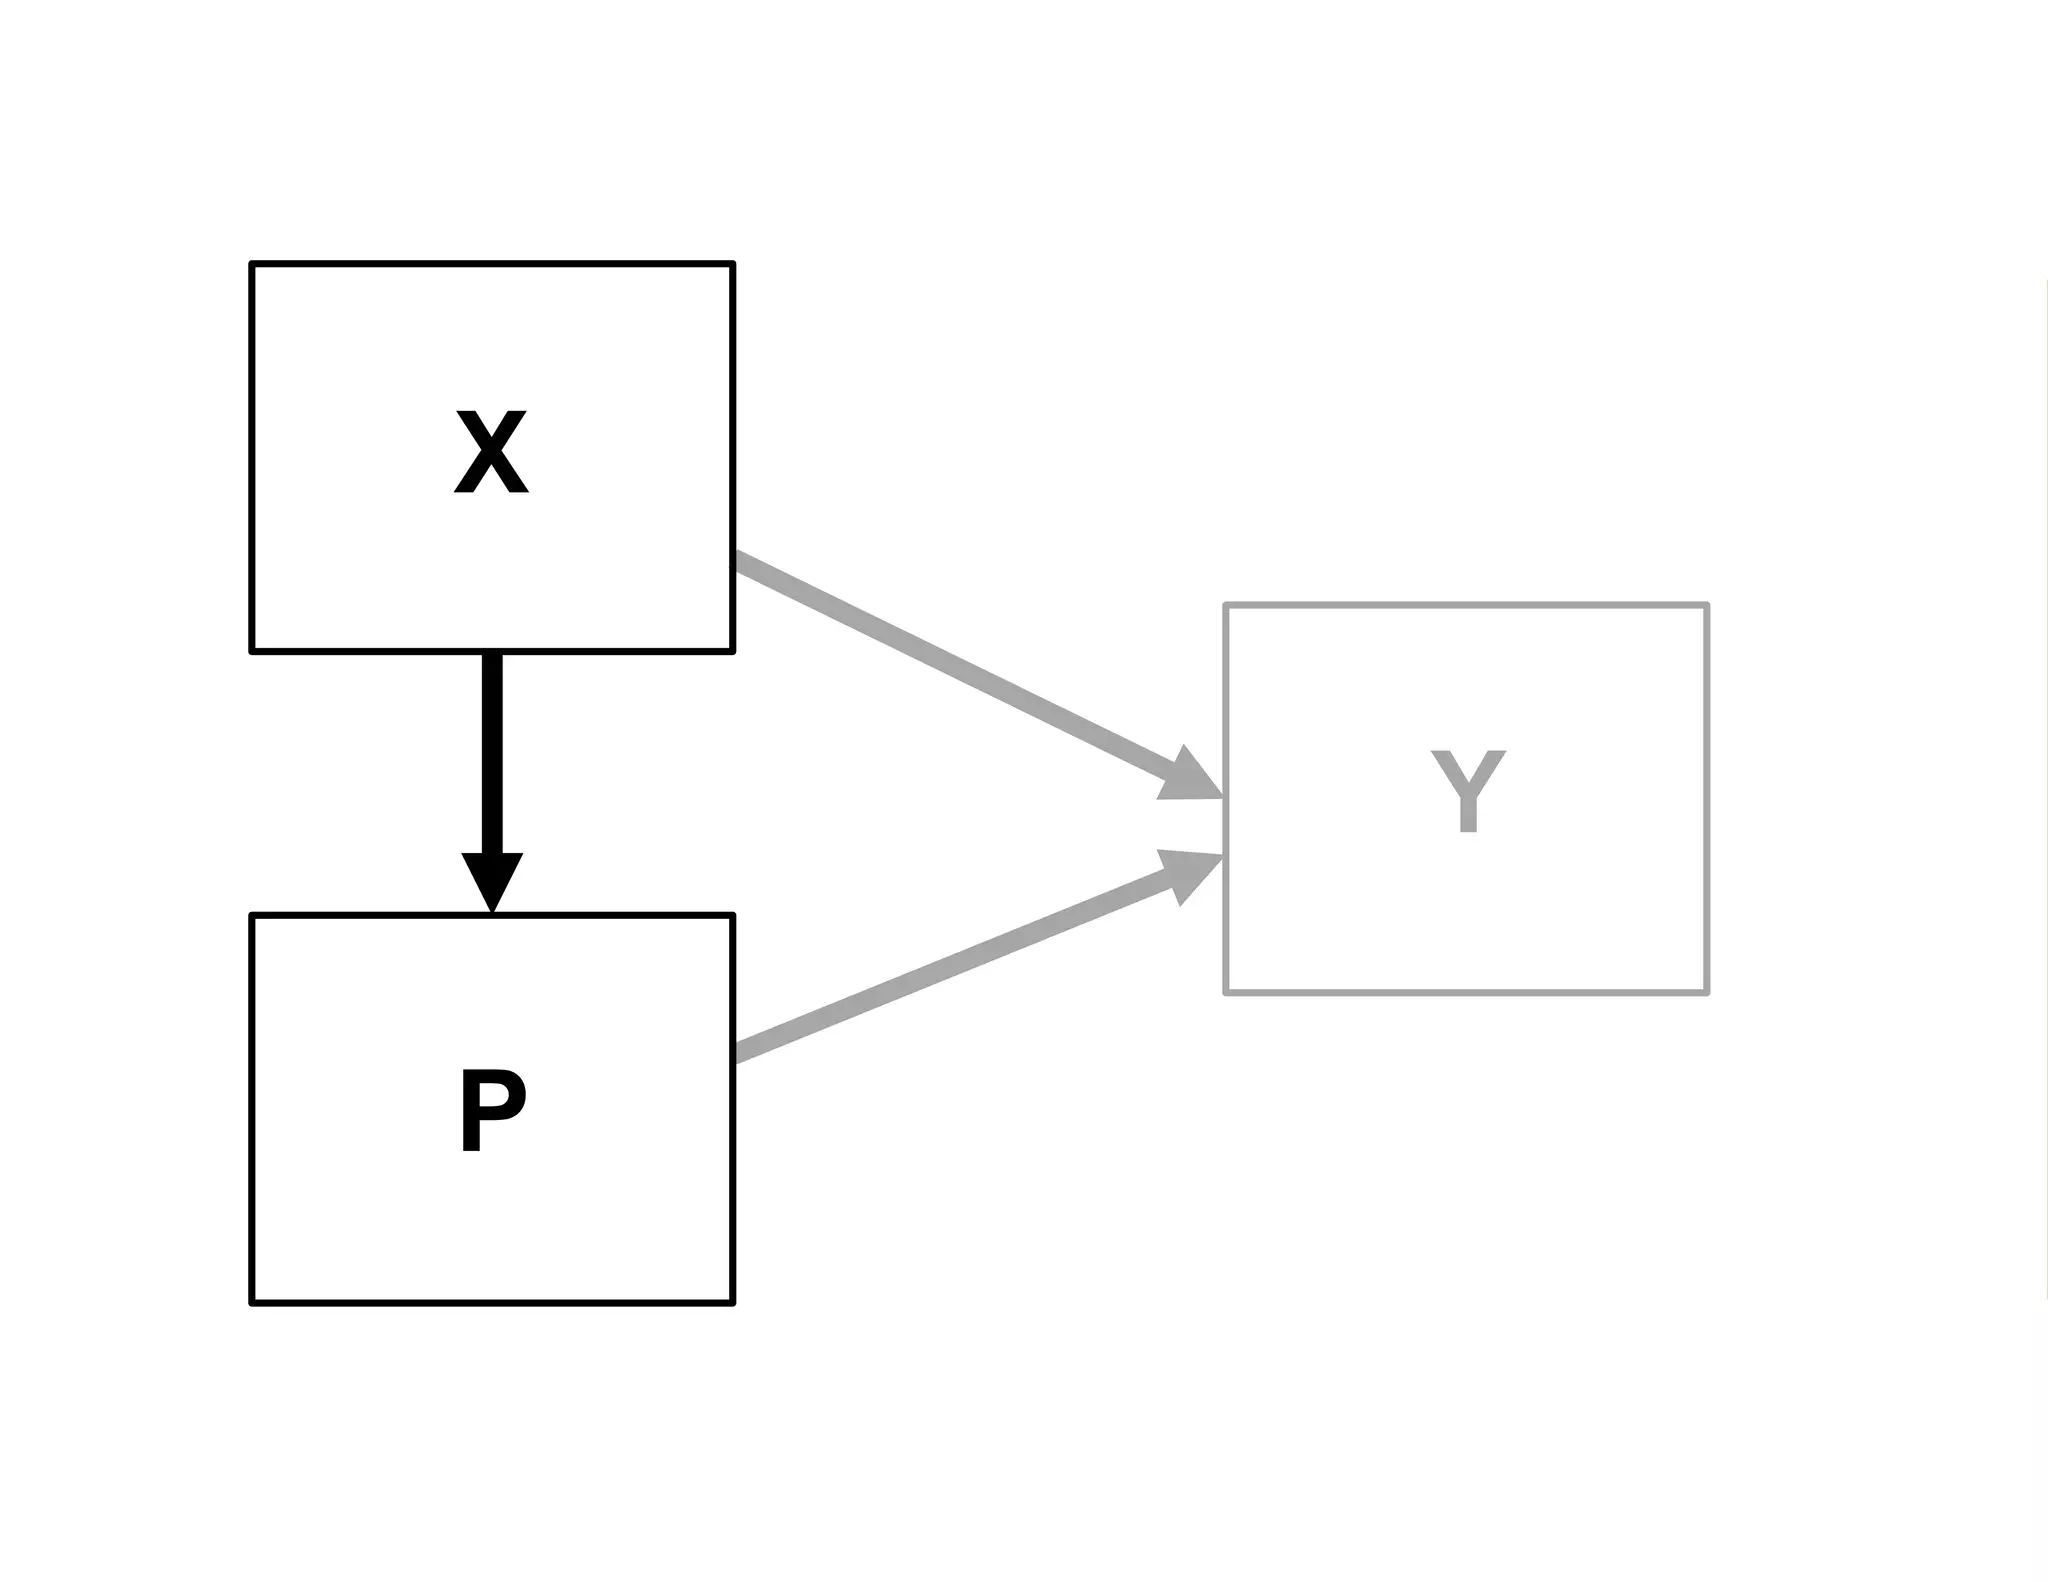
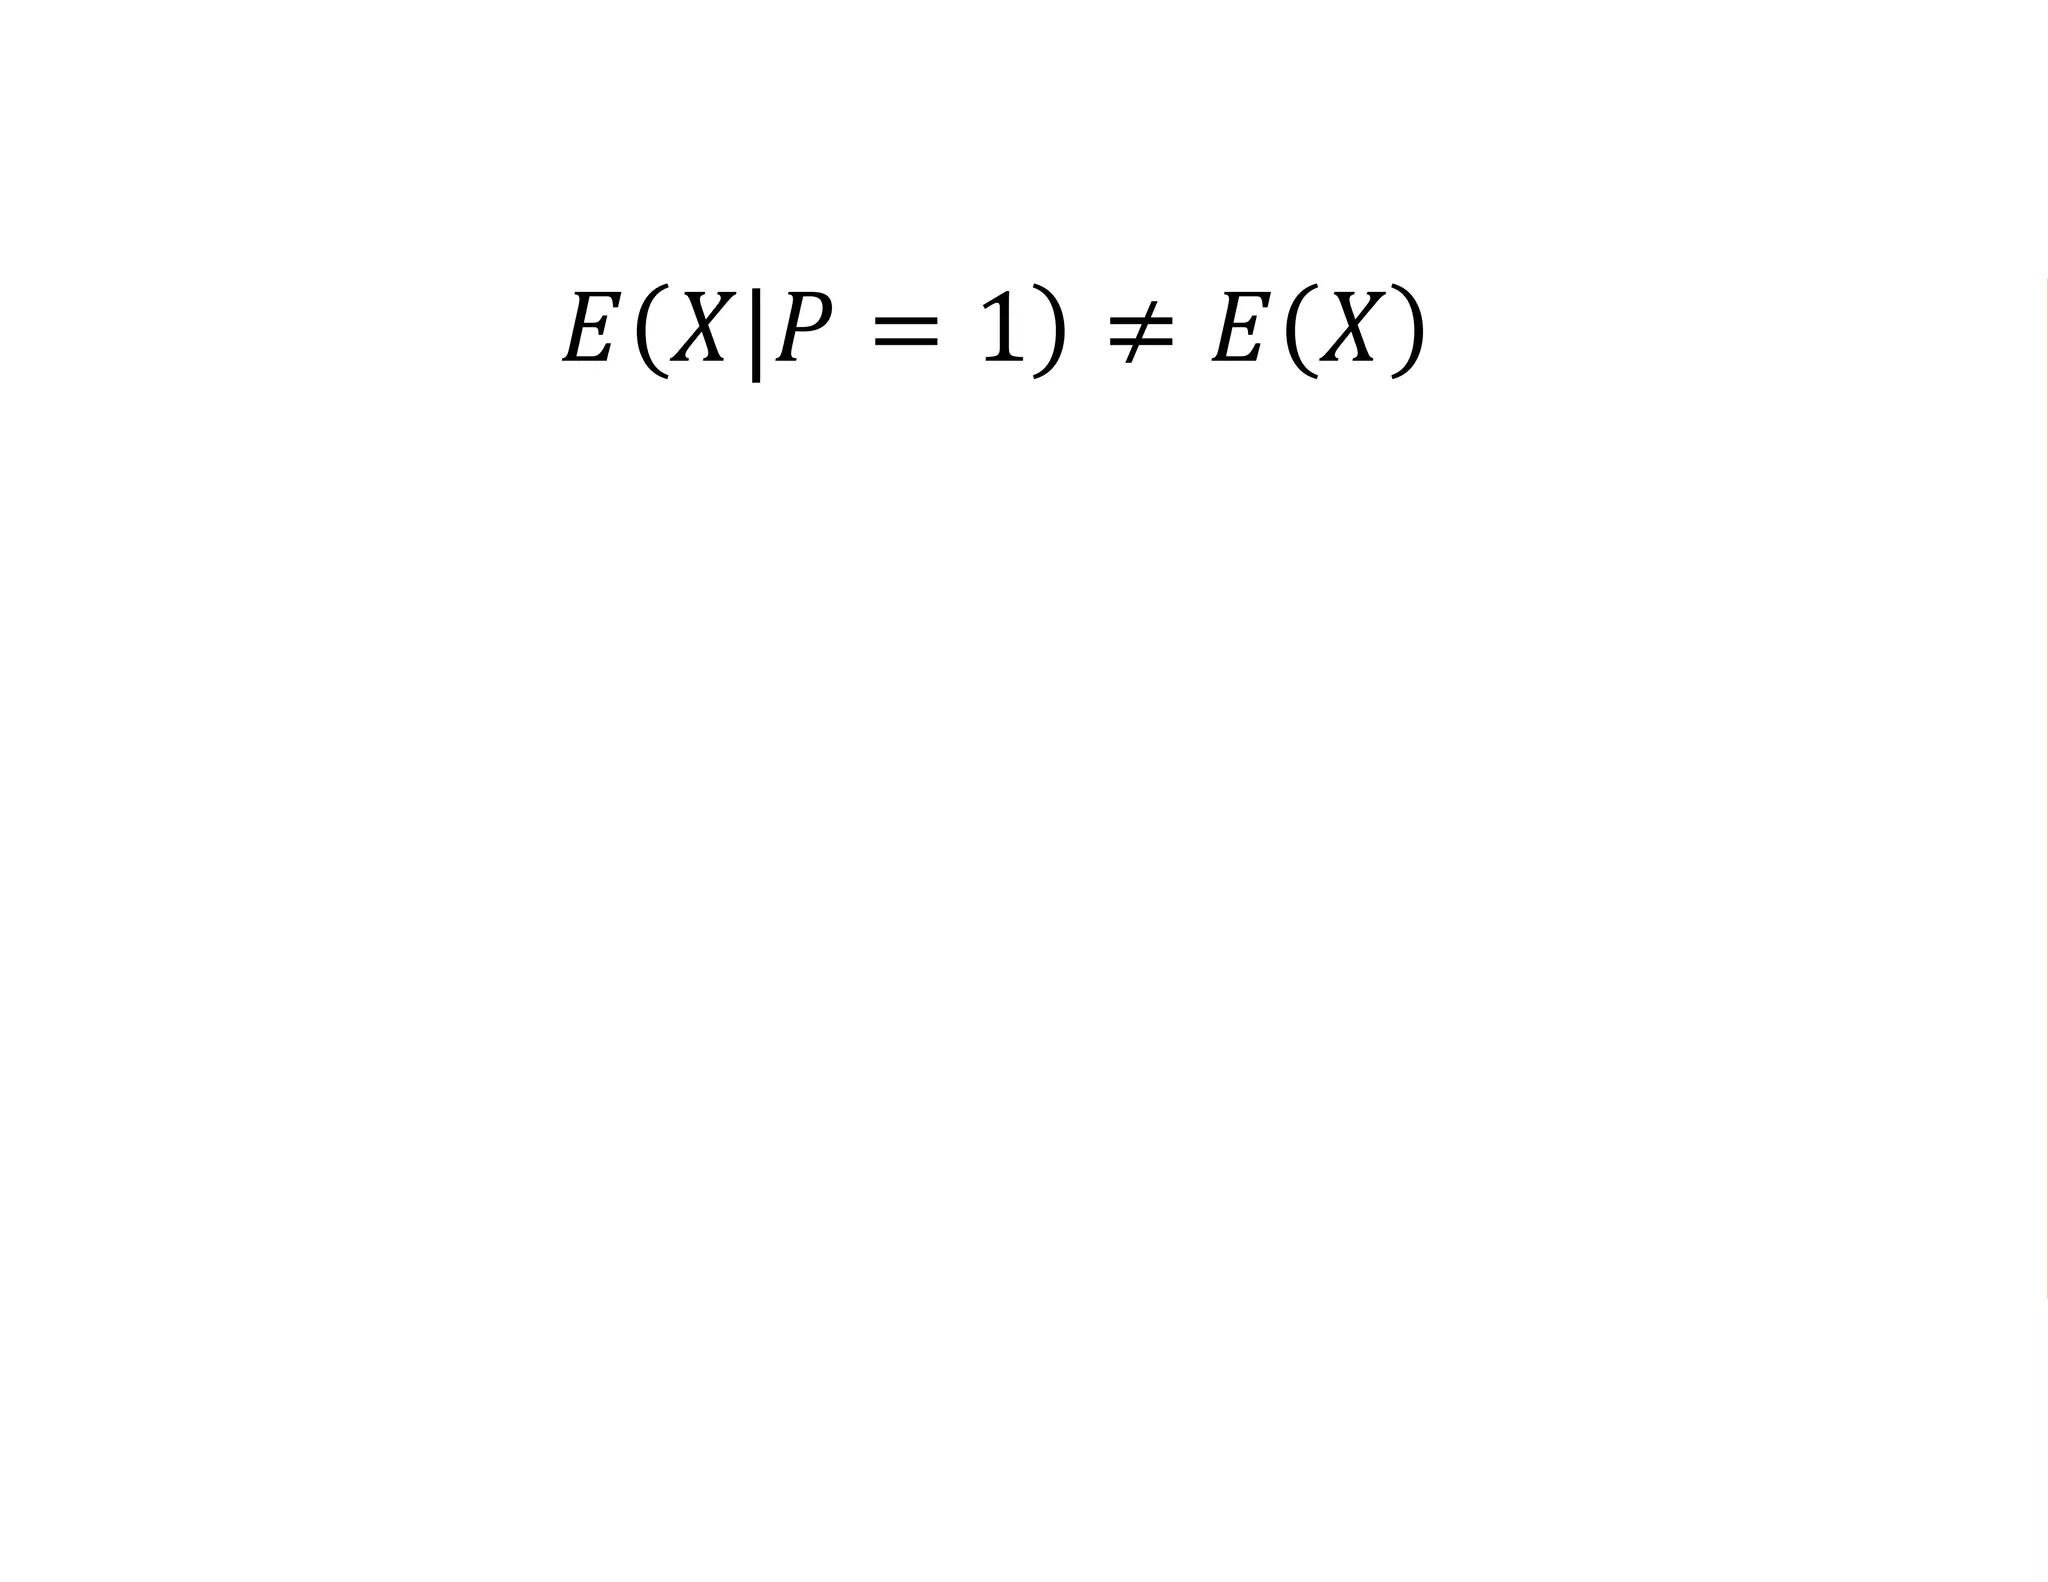
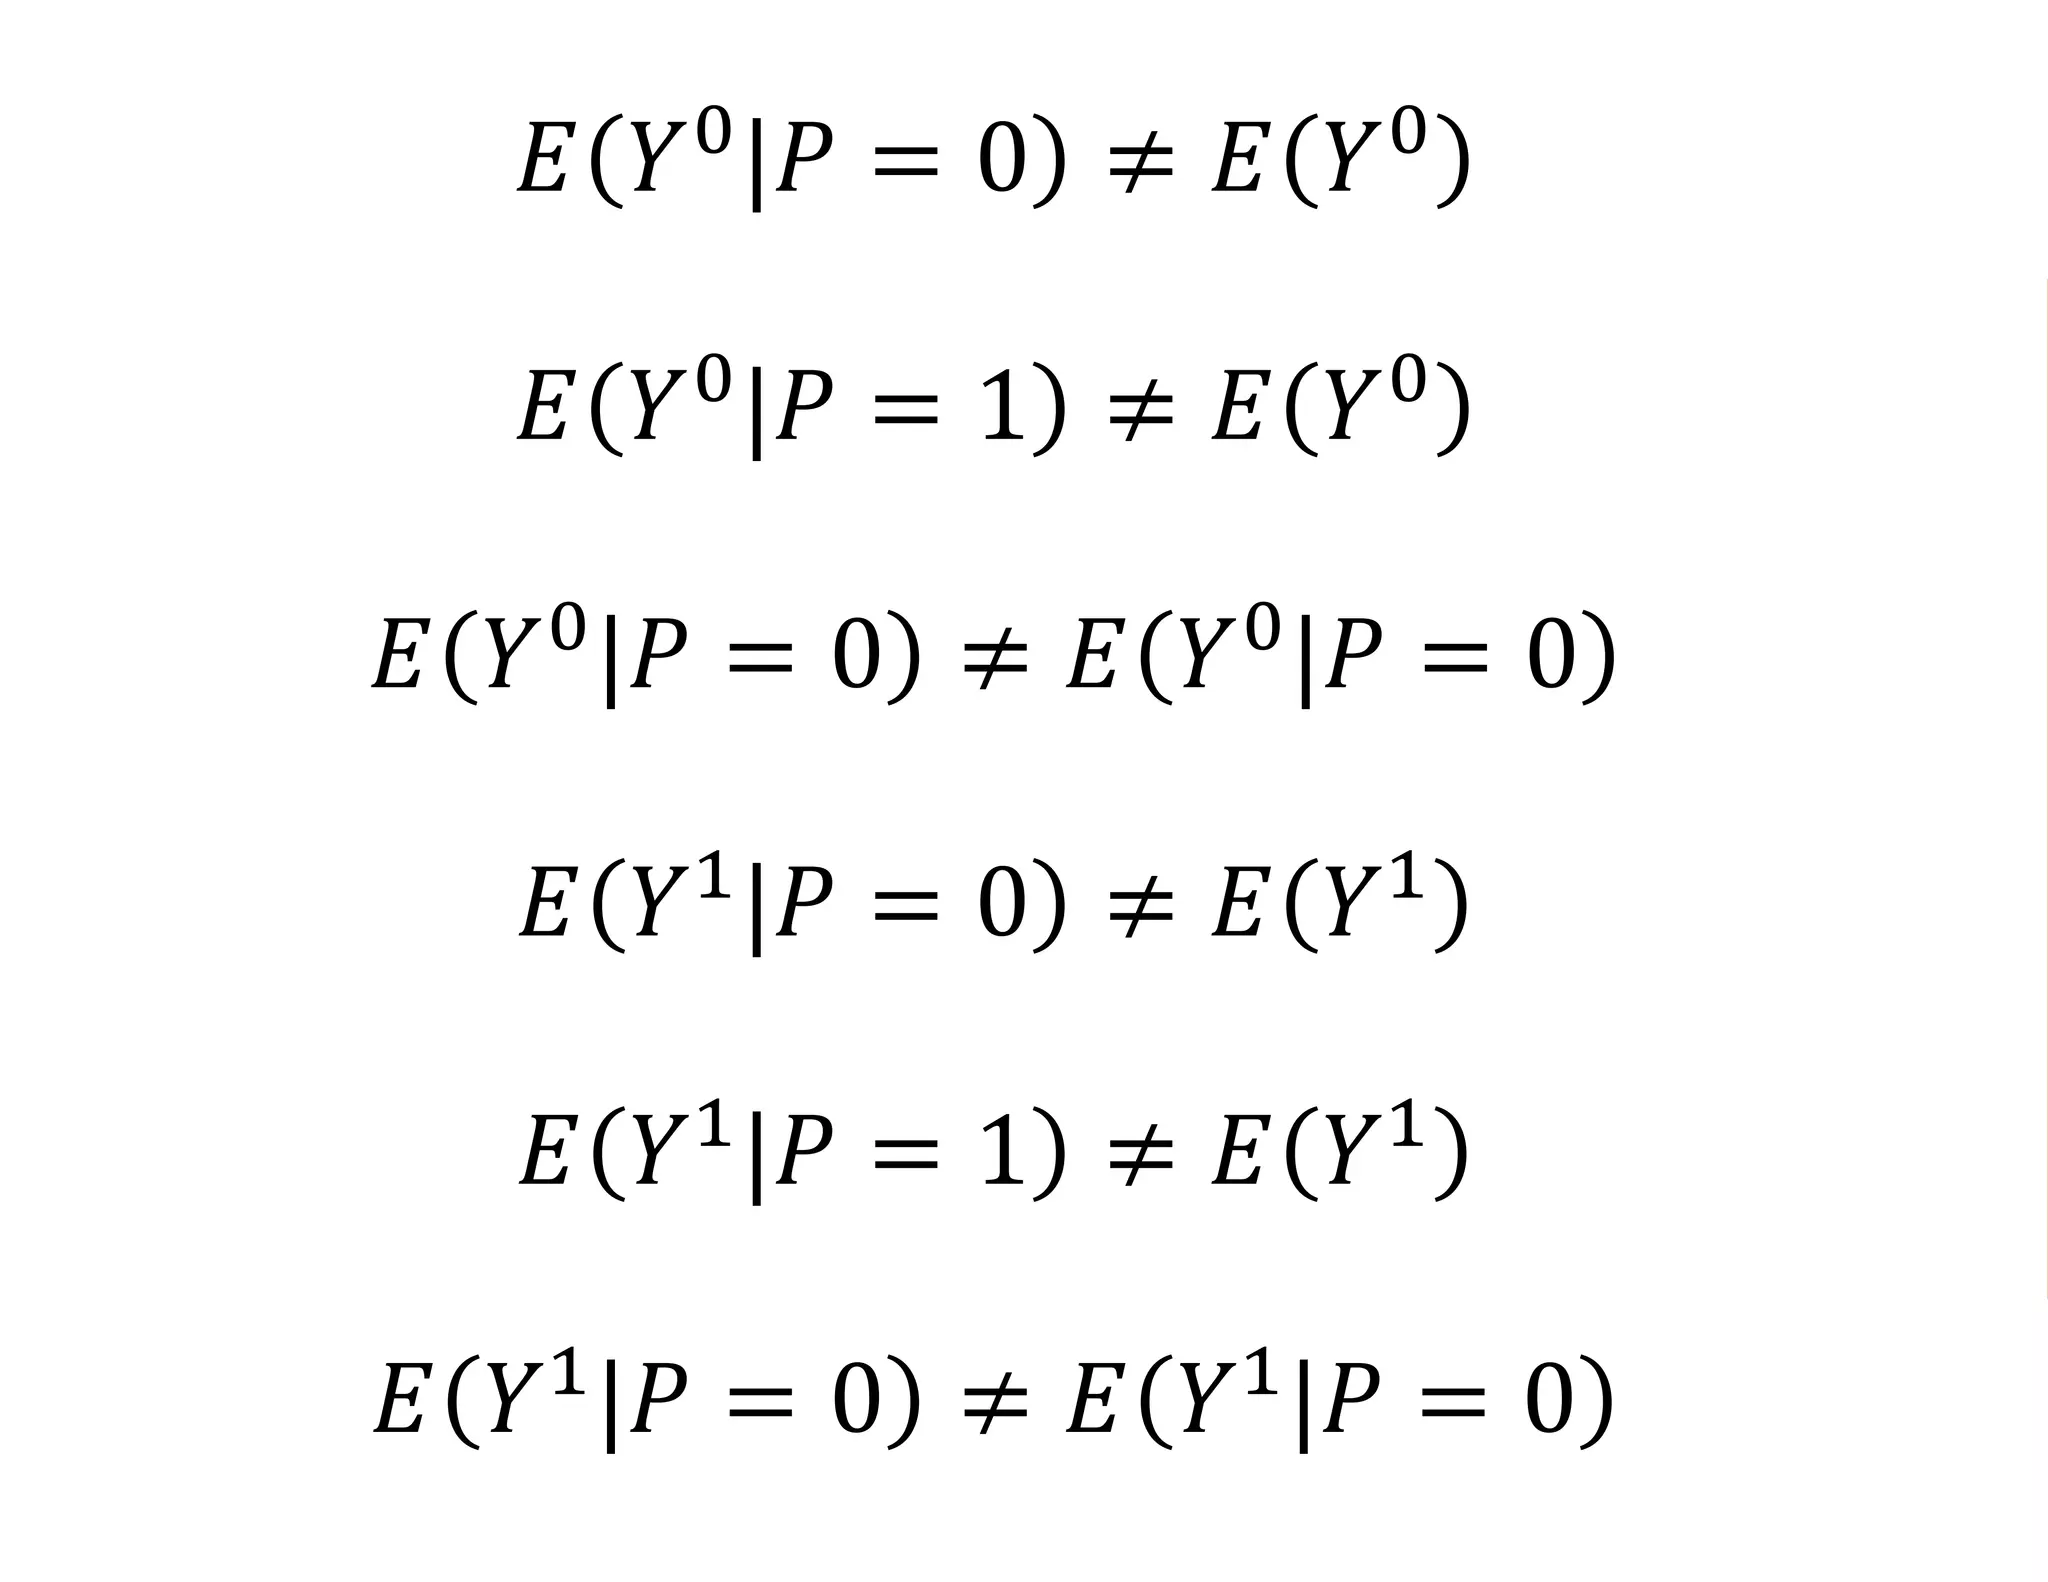
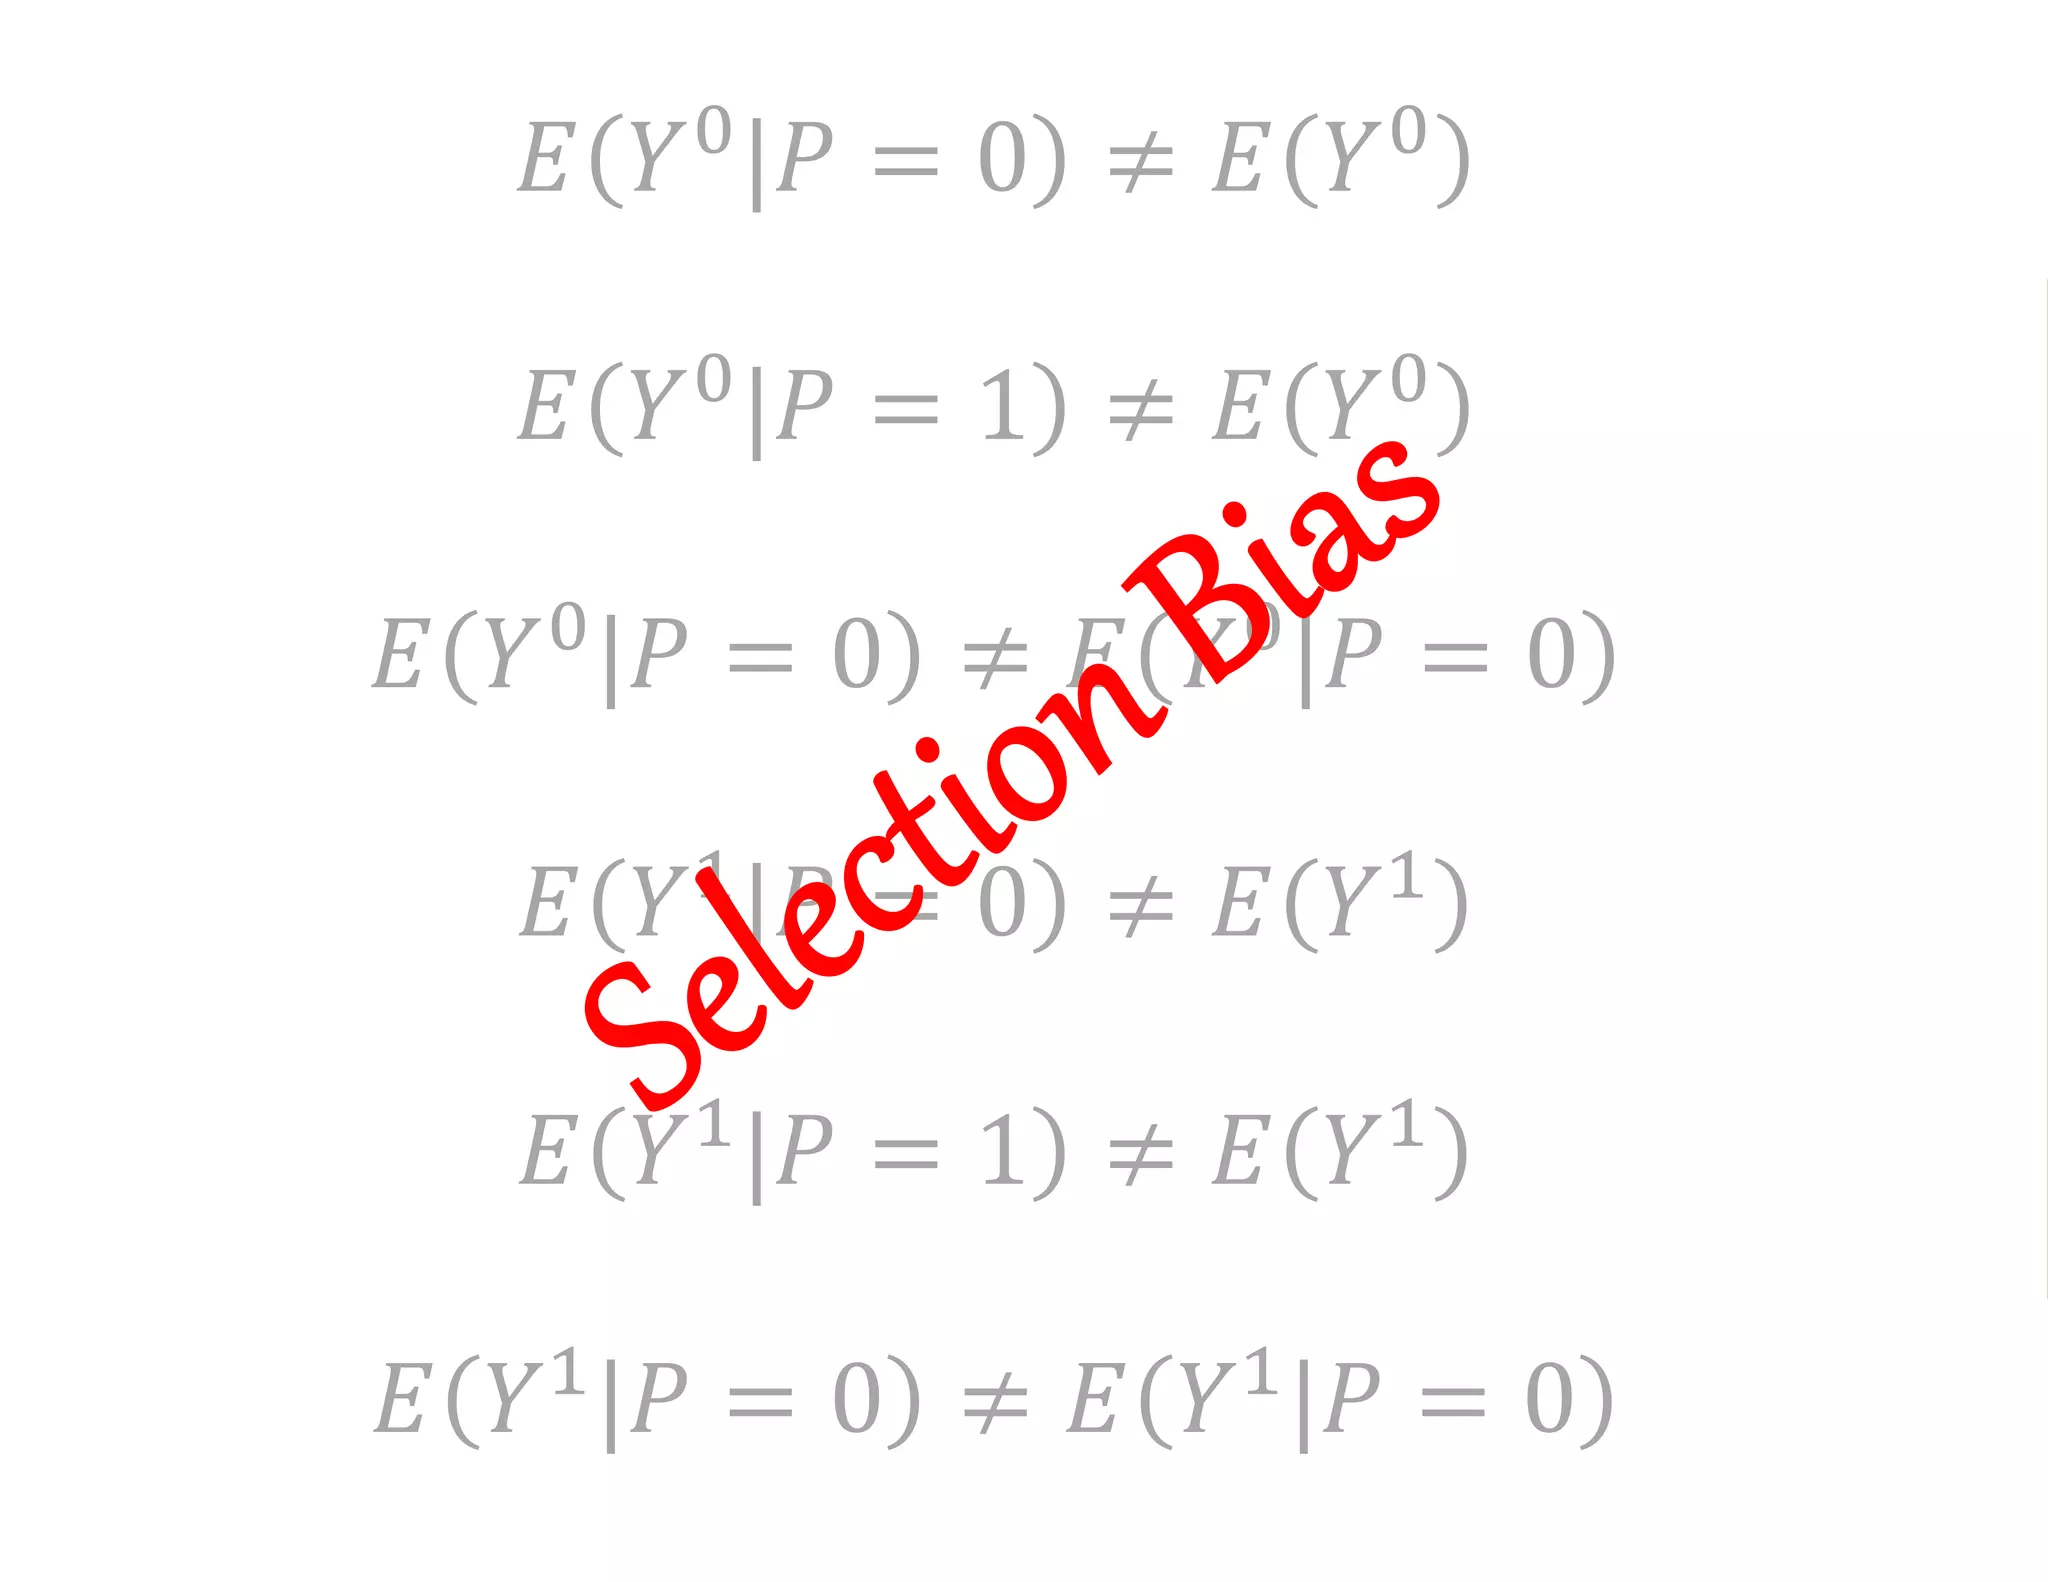
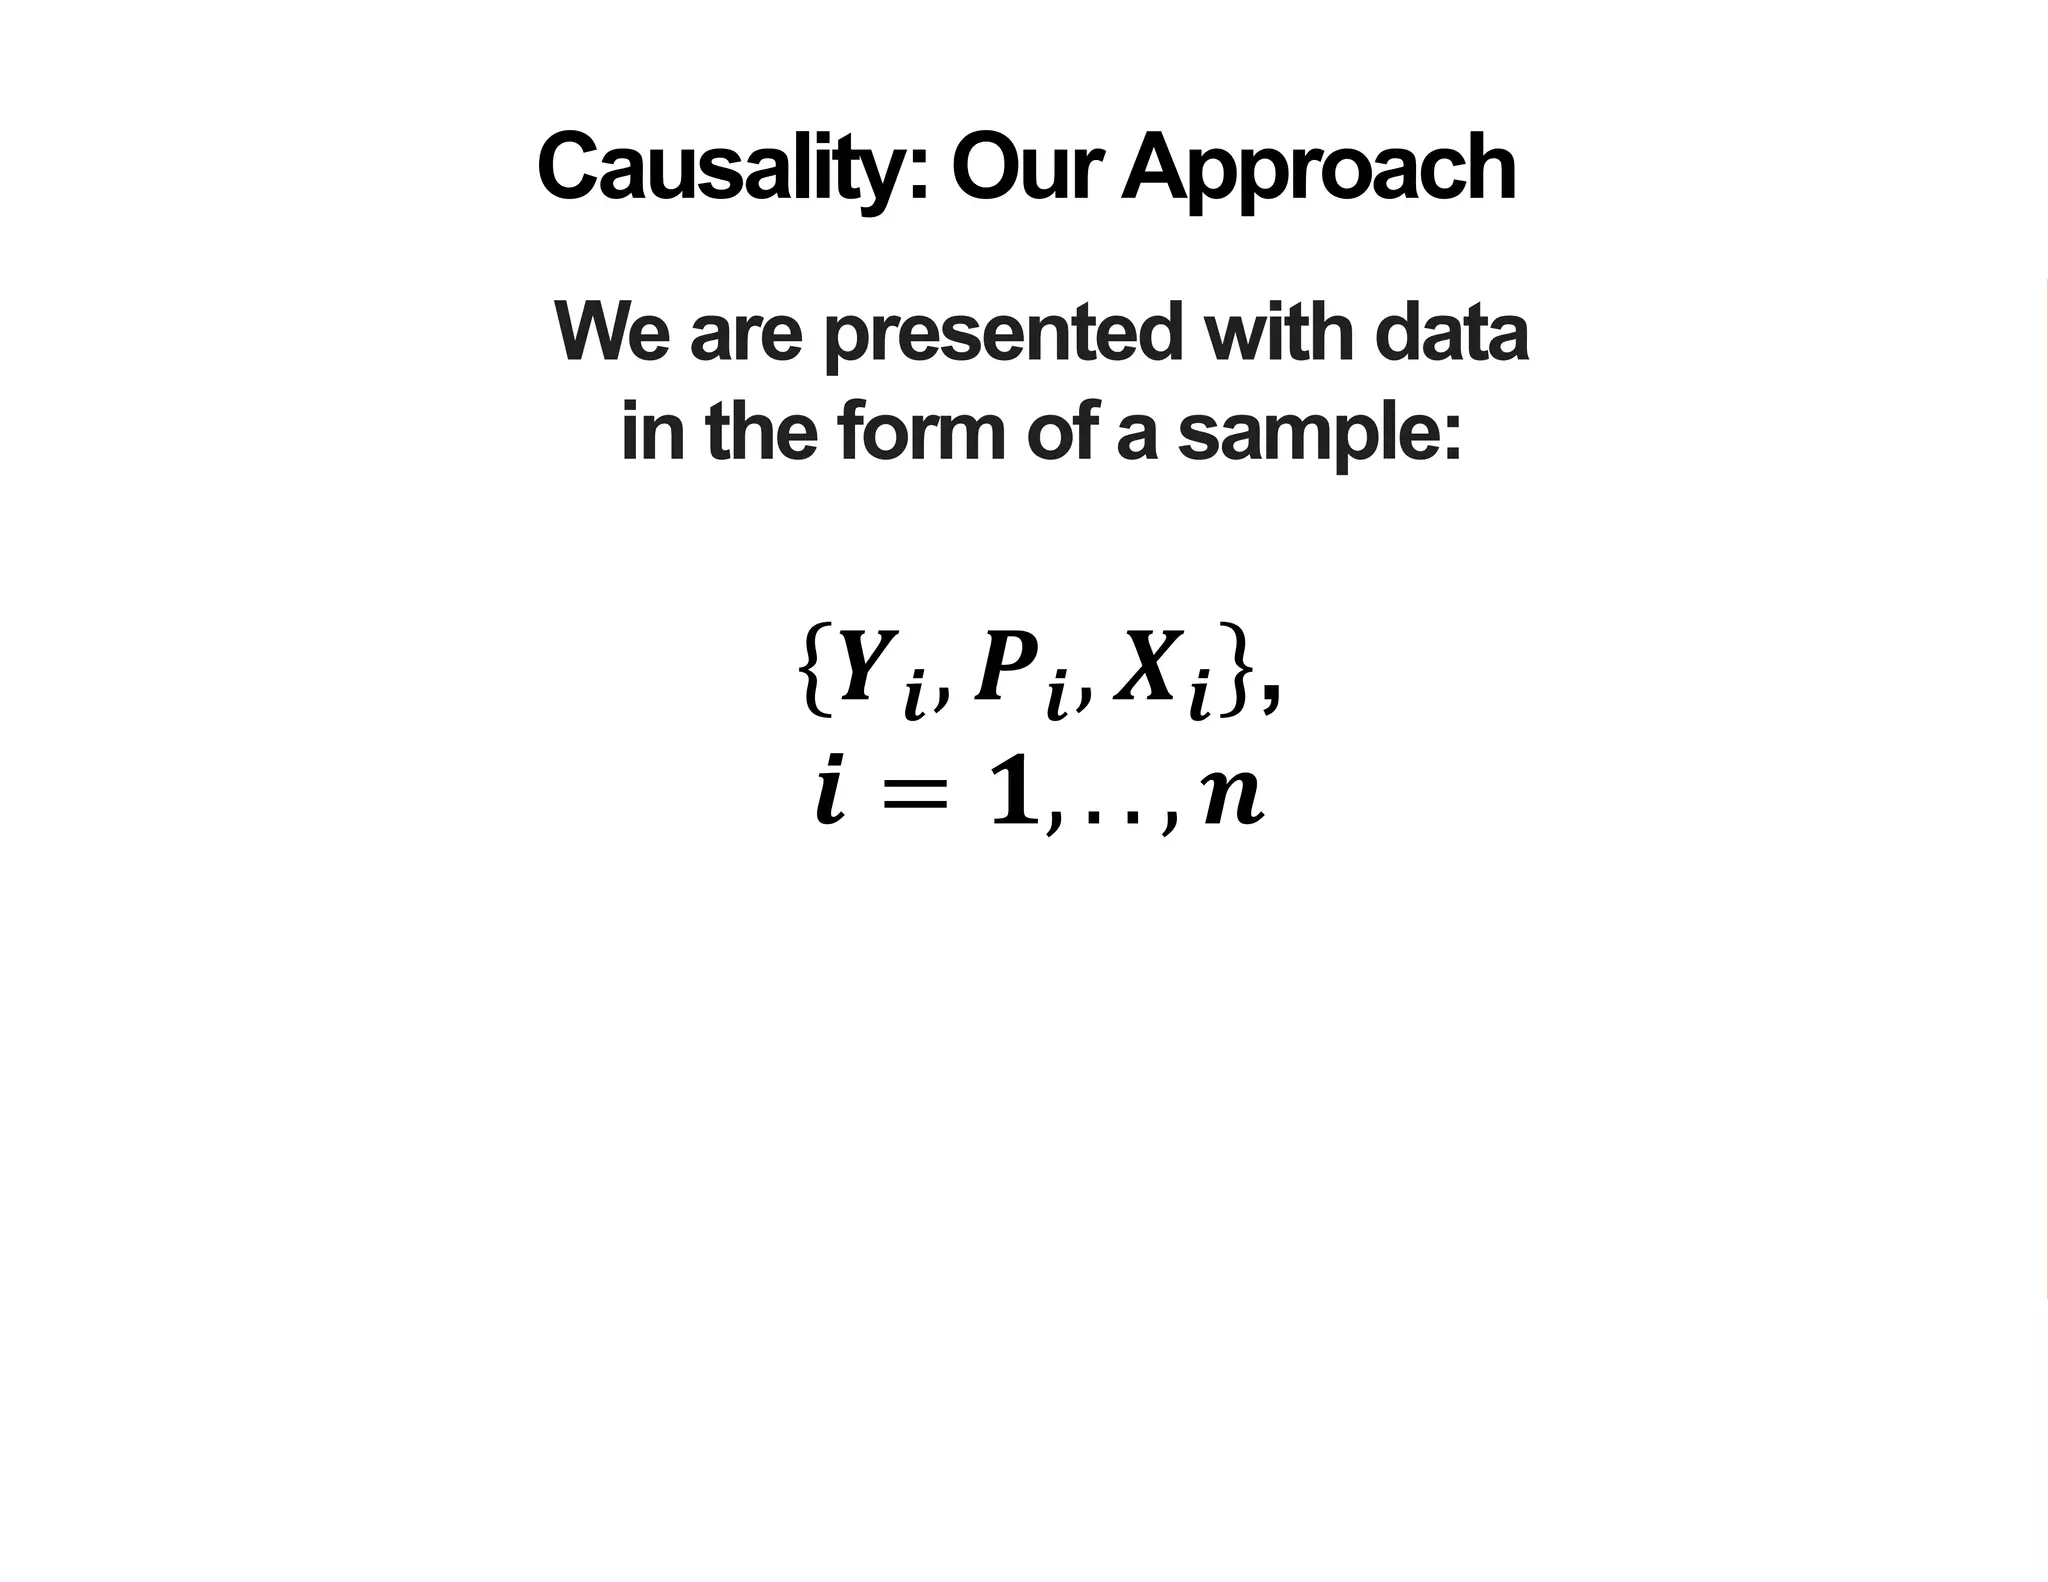
- Estimating the average treatment effect is challenging because for each individual we only observe one potential outcome (either Yi1 or Yi0 but not both). The document explores how to separately estimate the expected outcomes under treatment and non-treatment to calculate the average treatment effect.


![Functions-of-Random-Variables-in-Social-Work-Research [Autosaved].pptx](https://cdn.slidesharecdn.com/ss_thumbnails/functions-of-random-variables-in-social-work-researchautosaved-251213105202-6c244816-thumbnail.jpg?width=640&height=640&fit=bounds)


