This document summarizes the results of a cross-sectional baseline survey assessing malaria data quality and use in health centers in Madagascar that were selected as Centers of Excellence to improve data practices. The survey found that while reporting completeness and timeliness were high, data accuracy remained an issue. Baseline performance on data quality indicators was similar between the intervention sites that would implement Centers of Excellence and control sites. The implementation of Centers of Excellence aims to drive improvements in data quality, analysis, and use for decision-making in Madagascar.
This Data for Impact webinar took place October 29, 2020. Learn more at https://www.data4impactproject.org/resources/webinars/use-of-routine-data-for-economic-evaluations/
Data for Impact hosted a one-hour webinar sharing guidance for using routine data in evaluations. More: https://www.data4impactproject.org/resources/webinars/routine-data-use-in-evaluation-practical-guidance/
Lessons learned in using process tracing for evaluationMEASURE Evaluation
Access the recording for this Data for Impact (D4I) webinar at https://www.data4impactproject.org/lessons-learned-in-using-process-tracing-for-evaluation/
Evaluation of the Impact of a Social Support Strategy on Treatment OutcomesMEASURE Evaluation
Shared at a data dissemination and data use workshop on the results of the impact evaluation of the Strengthening Tuberculosis Control in Ukraine project. Access another presentation at https://www.slideshare.net/measureevaluation/evaluation-of-the-tbhiv-integration-strategy-on-treatment-outcomes.
Evaluating Impact: Lessons Learned from MEASURE EvaluationMEASURE Evaluation
During a September presentation at South Africa’s Department of Planning, Monitoring and Evaluation, Dr. Jason Smith shared experiences and lessons learned on evaluating impact from MEASURE Evaluation Phase III implementation
Collecting the PEPFAR OVC MER Essential Survey Indicators: Frequently Asked Q...MEASURE Evaluation
Gretchen Bachman and Christine Fu (USAID); Lisa Parker, Jenifer Chapman, Lisa Marie Albert, Walter Obiero, and Susan Settergren from MEASURE Evaluation. January 2017 Webinar.
OVC_HIVSTAT and Linkages to Care for Strengthened Collection, Analysis, and U...MEASURE Evaluation
This webinar focused on explaining the HIV Risk Assessment cascade and how it is related to OVC_HIVSTAT disaggregates. The presenters also provided guidance for how OVC_HIVSTAT data can be analyzed to enhance program outcomes.
Evaluation of the TB-HIV Integration Strategy on Treatment OutcomesMEASURE Evaluation
Shared at a data dissemination and data use workshop on the results of the impact evaluation of the Strengthening Tuberculosis Control in Ukraine project. Access another presentation at https://www.slideshare.net/measureevaluation/evaluation-of-the-impact-of-a-social-support-strategy-on-treatment-outcomes/.
Decision Support System Enabled Data Warehouses for Improving the Analytic Ca...MEASURE Evaluation
“Decision Support Systems for Improving the Analytic Capacity of HIS in Developing Countries”
Mike Edwards (MEASURE Evaluation), Presenter. Co-author: Theo Lippeveld (MEASURE Evaluation)
Presentation given
826 Unertl et al., Describing and Modeling WorkflowResearch .docxevonnehoggarth79783
826 Unertl et al., Describing and Modeling Workflow
Research Paper �
Describing and Modeling Workflow and Information Flow in
Chronic Disease Care
KIM M. UNERTL, MS, MATTHEW B. WEINGER, MD, KEVIN B. JOHNSON, MD, MS,
NANCY M. LORENZI, PHD, MA, MLS
A b s t r a c t Objectives: The goal of the study was to develop an in-depth understanding of work practices,
workflow, and information flow in chronic disease care, to facilitate development of context-appropriate
informatics tools.
Design: The study was conducted over a 10-month period in three ambulatory clinics providing chronic disease
care. The authors iteratively collected data using direct observation and semi-structured interviews.
Measurements: The authors observed all aspects of care in three different chronic disease clinics for over 150
hours, including 157 patient-provider interactions. Observation focused on interactions among people, processes,
and technology. Observation data were analyzed through an open coding approach. The authors then developed
models of workflow and information flow using Hierarchical Task Analysis and Soft Systems Methodology. The
authors also conducted nine semi-structured interviews to confirm and refine the models.
Results: The study had three primary outcomes: models of workflow for each clinic, models of information flow
for each clinic, and an in-depth description of work practices and the role of health information technology (HIT)
in the clinics. The authors identified gaps between the existing HIT functionality and the needs of chronic disease
providers.
Conclusions: In response to the analysis of workflow and information flow, the authors developed ten guidelines
for design of HIT to support chronic disease care, including recommendations to pursue modular approaches to
design that would support disease-specific needs. The study demonstrates the importance of evaluating workflow
and information flow in HIT design and implementation.
� J Am Med Inform Assoc. 2009;16:826 – 836. DOI 10.1197/jamia.M3000.
Introduction
Health information technology (HIT) can enhance efficiency,
increase patient safety, and improve patient outcomes.1,2
However, features of HIT intended to improve patient care
can lead to rejection of HIT,3 or can produce unexpected
negative consequences or unsafe workarounds if poorly
aligned with workflow.4,5
More than 90 million people in the United States, or 30% of
the population, have chronic diseases.6 HIT can assist with
longitudinal management of chronic disease by, for exam-
Affiliations of the authors: Department of Biomedical Informatics
(KMU, MBW, KBJ, NML), Center for Perioperative Research in
Quality (KMU, MBW, KBJ), Institute of Medicine and Public Health,
VA Tennessee Valley Healthcare System and the Departments of
Anesthesiology and Medical Education (MBW), Department of
Pediatrics (KBJ), Vanderbilt University, Nashville, TN.
This research was supported by a National Library of Medicine
Training Grant, Number T15 .
PCMH implementation, highly associated with important outcomes for both patients and providers. The rate of emergency department visits was significantly
lower in sites with more PCMH effective implementation. Efficient PCMH implementation favorably associated with patient satisfaction, staff burnout, quality of care, and use of health care services.
NUR 440 Evidence TableStudy CitationDesignMethodSample.docxvannagoforth
NUR 440 Evidence Table
Study Citation
Design
Method
Sample
Data Collection
Data Analysis
Validity
Reliability
Magill, S. S., O’Leary, E., Janelle, S. J., Thompson, D. L., Dumyati, G., Nadle, J., & Ray, S. M. (2018). Changes in prevalence of health care–associated infections in US Hospitals. New England Journal of Medicine, 379(18), 1732-1744.
Longitudinal and multivariable log-binomial regression modeling
At Emerging Infections Program sites in 10 states, we recruited up to 25 hospitals in each site area, prioritizing hospitals that had participated in the 2011 survey.
Random samples of patients in acute care locations were selected from hospitals’ morning censuses on the survey date with the use of the method that had been used in the 2011 survey
Trained staff of the Emerging Infections Program sites reviewed medical records on the survey date or retrospectively to collect basic demographic and clinical data.
In 2015, a total of 12,299 patients in 199 hospitals were surveyed, as compared with 11,282 patients in 183 hospitals in 2011. Pneumonia, gastrointestinal infections and surgical-site infections were the most common health care–associated infections.
The CDC determined the survey to be a non-research activity.
Point-prevalence surveys of health care–associated infections in health care settings complement location- or infection-specific National Healthcare Safety Network data.
Zuarez-Easton, S., Zafran, N., Garmi, G., & Salim, R. (2017). Postcesarean wound infection: prevalence, impact, prevention, and management challenges. International journal of women's health, 9, 81.
Randomized trials, cohort, case–control, review, and meta-analysis were eligible.
Several electronic databases were searched from inception through June 2016: MEDLINE, PubMed, Ovid, and the Cochrane Library.
100,000 maternities compared to the period between 2003 and 2005
Data was collected through maternal comorbidities, appropriate antibiotic prophylaxis, and evidence-based surgical techniques practices.
Cesarean delivery is one of the most frequent surgical interventions performed worldwide and accounts for up to 60% of deliveries in a number of countries
Two authors (SZE and RS) selected articles first through focused review of abstracts. Eligible studies underwent full-text review.
The research Reviewed maternal death in the UK over a period of 3 years (2006–2008).
Chu, K., Maine, R., & Trelles, M. (2015). Cesarean section surgical site infections in sub-Saharan Africa: a multi-country study from Medecins Sans Frontieres. World journal of surgery, 39(2), 350-355.
Logistic regression was used to model determinants of SSI.
This study included data from four emergency obstetric programs supported by Medecins sans Frontieres, from Burundi, the Democratic Republic of Congo (DRC), and Sierra Leone.
1,276 women underwent CS.
Data were prospectively collected using a standardized paper form and then entered into an electronic database.
Baseline characteristics w ...
Managing missing values in routinely reported data: One approach from the Dem...MEASURE Evaluation
This Data for Impact webinar was held in December 2020. Access the recording and learn more at https://www.data4impactproject.org/resources/webinars/managing-missing-values-in-routinely-reported-data-one-approach-from-the-democratic-republic-of-the-congo/
Ozempic: Preoperative Management of Patients on GLP-1 Receptor Agonists Saeid Safari
Preoperative Management of Patients on GLP-1 Receptor Agonists like Ozempic and Semiglutide
ASA GUIDELINE
NYSORA Guideline
2 Case Reports of Gastric Ultrasound
Title: Sense of Taste
Presenter: Dr. Faiza, Assistant Professor of Physiology
Qualifications:
MBBS (Best Graduate, AIMC Lahore)
FCPS Physiology
ICMT, CHPE, DHPE (STMU)
MPH (GC University, Faisalabad)
MBA (Virtual University of Pakistan)
Learning Objectives:
Describe the structure and function of taste buds.
Describe the relationship between the taste threshold and taste index of common substances.
Explain the chemical basis and signal transduction of taste perception for each type of primary taste sensation.
Recognize different abnormalities of taste perception and their causes.
Key Topics:
Significance of Taste Sensation:
Differentiation between pleasant and harmful food
Influence on behavior
Selection of food based on metabolic needs
Receptors of Taste:
Taste buds on the tongue
Influence of sense of smell, texture of food, and pain stimulation (e.g., by pepper)
Primary and Secondary Taste Sensations:
Primary taste sensations: Sweet, Sour, Salty, Bitter, Umami
Chemical basis and signal transduction mechanisms for each taste
Taste Threshold and Index:
Taste threshold values for Sweet (sucrose), Salty (NaCl), Sour (HCl), and Bitter (Quinine)
Taste index relationship: Inversely proportional to taste threshold
Taste Blindness:
Inability to taste certain substances, particularly thiourea compounds
Example: Phenylthiocarbamide
Structure and Function of Taste Buds:
Composition: Epithelial cells, Sustentacular/Supporting cells, Taste cells, Basal cells
Features: Taste pores, Taste hairs/microvilli, and Taste nerve fibers
Location of Taste Buds:
Found in papillae of the tongue (Fungiform, Circumvallate, Foliate)
Also present on the palate, tonsillar pillars, epiglottis, and proximal esophagus
Mechanism of Taste Stimulation:
Interaction of taste substances with receptors on microvilli
Signal transduction pathways for Umami, Sweet, Bitter, Sour, and Salty tastes
Taste Sensitivity and Adaptation:
Decrease in sensitivity with age
Rapid adaptation of taste sensation
Role of Saliva in Taste:
Dissolution of tastants to reach receptors
Washing away the stimulus
Taste Preferences and Aversions:
Mechanisms behind taste preference and aversion
Influence of receptors and neural pathways
Impact of Sensory Nerve Damage:
Degeneration of taste buds if the sensory nerve fiber is cut
Abnormalities of Taste Detection:
Conditions: Ageusia, Hypogeusia, Dysgeusia (parageusia)
Causes: Nerve damage, neurological disorders, infections, poor oral hygiene, adverse drug effects, deficiencies, aging, tobacco use, altered neurotransmitter levels
Neurotransmitters and Taste Threshold:
Effects of serotonin (5-HT) and norepinephrine (NE) on taste sensitivity
Supertasters:
25% of the population with heightened sensitivity to taste, especially bitterness
Increased number of fungiform papillae
HOT NEW PRODUCT! BIG SALES FAST SHIPPING NOW FROM CHINA!! EU KU DB BK substit...GL Anaacs
Contact us if you are interested:
Email / Skype : kefaya1771@gmail.com
Threema: PXHY5PDH
New BATCH Ku !!! MUCH IN DEMAND FAST SALE EVERY BATCH HAPPY GOOD EFFECT BIG BATCH !
Contact me on Threema or skype to start big business!!
Hot-sale products:
NEW HOT EUTYLONE WHITE CRYSTAL!!
5cl-adba precursor (semi finished )
5cl-adba raw materials
ADBB precursor (semi finished )
ADBB raw materials
APVP powder
5fadb/4f-adb
Jwh018 / Jwh210
Eutylone crystal
Protonitazene (hydrochloride) CAS: 119276-01-6
Flubrotizolam CAS: 57801-95-3
Metonitazene CAS: 14680-51-4
Payment terms: Western Union,MoneyGram,Bitcoin or USDT.
Deliver Time: Usually 7-15days
Shipping method: FedEx, TNT, DHL,UPS etc.Our deliveries are 100% safe, fast, reliable and discreet.
Samples will be sent for your evaluation!If you are interested in, please contact me, let's talk details.
We specializes in exporting high quality Research chemical, medical intermediate, Pharmaceutical chemicals and so on. Products are exported to USA, Canada, France, Korea, Japan,Russia, Southeast Asia and other countries.
Anti ulcer drugs and their Advance pharmacology ||
Anti-ulcer drugs are medications used to prevent and treat ulcers in the stomach and upper part of the small intestine (duodenal ulcers). These ulcers are often caused by an imbalance between stomach acid and the mucosal lining, which protects the stomach lining.
||Scope: Overview of various classes of anti-ulcer drugs, their mechanisms of action, indications, side effects, and clinical considerations.
Prix Galien International 2024 Forum ProgramLevi Shapiro
June 20, 2024, Prix Galien International and Jerusalem Ethics Forum in ROME. Detailed agenda including panels:
- ADVANCES IN CARDIOLOGY: A NEW PARADIGM IS COMING
- WOMEN’S HEALTH: FERTILITY PRESERVATION
- WHAT’S NEW IN THE TREATMENT OF INFECTIOUS,
ONCOLOGICAL AND INFLAMMATORY SKIN DISEASES?
- ARTIFICIAL INTELLIGENCE AND ETHICS
- GENE THERAPY
- BEYOND BORDERS: GLOBAL INITIATIVES FOR DEMOCRATIZING LIFE SCIENCE TECHNOLOGIES AND PROMOTING ACCESS TO HEALTHCARE
- ETHICAL CHALLENGES IN LIFE SCIENCES
- Prix Galien International Awards Ceremony
Title: Sense of Smell
Presenter: Dr. Faiza, Assistant Professor of Physiology
Qualifications:
MBBS (Best Graduate, AIMC Lahore)
FCPS Physiology
ICMT, CHPE, DHPE (STMU)
MPH (GC University, Faisalabad)
MBA (Virtual University of Pakistan)
Learning Objectives:
Describe the primary categories of smells and the concept of odor blindness.
Explain the structure and location of the olfactory membrane and mucosa, including the types and roles of cells involved in olfaction.
Describe the pathway and mechanisms of olfactory signal transmission from the olfactory receptors to the brain.
Illustrate the biochemical cascade triggered by odorant binding to olfactory receptors, including the role of G-proteins and second messengers in generating an action potential.
Identify different types of olfactory disorders such as anosmia, hyposmia, hyperosmia, and dysosmia, including their potential causes.
Key Topics:
Olfactory Genes:
3% of the human genome accounts for olfactory genes.
400 genes for odorant receptors.
Olfactory Membrane:
Located in the superior part of the nasal cavity.
Medially: Folds downward along the superior septum.
Laterally: Folds over the superior turbinate and upper surface of the middle turbinate.
Total surface area: 5-10 square centimeters.
Olfactory Mucosa:
Olfactory Cells: Bipolar nerve cells derived from the CNS (100 million), with 4-25 olfactory cilia per cell.
Sustentacular Cells: Produce mucus and maintain ionic and molecular environment.
Basal Cells: Replace worn-out olfactory cells with an average lifespan of 1-2 months.
Bowman’s Gland: Secretes mucus.
Stimulation of Olfactory Cells:
Odorant dissolves in mucus and attaches to receptors on olfactory cilia.
Involves a cascade effect through G-proteins and second messengers, leading to depolarization and action potential generation in the olfactory nerve.
Quality of a Good Odorant:
Small (3-20 Carbon atoms), volatile, water-soluble, and lipid-soluble.
Facilitated by odorant-binding proteins in mucus.
Membrane Potential and Action Potential:
Resting membrane potential: -55mV.
Action potential frequency in the olfactory nerve increases with odorant strength.
Adaptation Towards the Sense of Smell:
Rapid adaptation within the first second, with further slow adaptation.
Psychological adaptation greater than receptor adaptation, involving feedback inhibition from the central nervous system.
Primary Sensations of Smell:
Camphoraceous, Musky, Floral, Pepperminty, Ethereal, Pungent, Putrid.
Odor Detection Threshold:
Examples: Hydrogen sulfide (0.0005 ppm), Methyl-mercaptan (0.002 ppm).
Some toxic substances are odorless at lethal concentrations.
Characteristics of Smell:
Odor blindness for single substances due to lack of appropriate receptor protein.
Behavioral and emotional influences of smell.
Transmission of Olfactory Signals:
From olfactory cells to glomeruli in the olfactory bulb, involving lateral inhibition.
Primitive, less old, and new olfactory systems with different path
The prostate is an exocrine gland of the male mammalian reproductive system
It is a walnut-sized gland that forms part of the male reproductive system and is located in front of the rectum and just below the urinary bladder
Function is to store and secrete a clear, slightly alkaline fluid that constitutes 10-30% of the volume of the seminal fluid that along with the spermatozoa, constitutes semen
A healthy human prostate measures (4cm-vertical, by 3cm-horizontal, 2cm ant-post ).
It surrounds the urethra just below the urinary bladder. It has anterior, median, posterior and two lateral lobes
It’s work is regulated by androgens which are responsible for male sex characteristics
Generalised disease of the prostate due to hormonal derangement which leads to non malignant enlargement of the gland (increase in the number of epithelial cells and stromal tissue)to cause compression of the urethra leading to symptoms (LUTS
Flu Vaccine Alert in Bangalore Karnatakaaddon Scans
As flu season approaches, health officials in Bangalore, Karnataka, are urging residents to get their flu vaccinations. The seasonal flu, while common, can lead to severe health complications, particularly for vulnerable populations such as young children, the elderly, and those with underlying health conditions.
Dr. Vidisha Kumari, a leading epidemiologist in Bangalore, emphasizes the importance of getting vaccinated. "The flu vaccine is our best defense against the influenza virus. It not only protects individuals but also helps prevent the spread of the virus in our communities," he says.
This year, the flu season is expected to coincide with a potential increase in other respiratory illnesses. The Karnataka Health Department has launched an awareness campaign highlighting the significance of flu vaccinations. They have set up multiple vaccination centers across Bangalore, making it convenient for residents to receive their shots.
To encourage widespread vaccination, the government is also collaborating with local schools, workplaces, and community centers to facilitate vaccination drives. Special attention is being given to ensuring that the vaccine is accessible to all, including marginalized communities who may have limited access to healthcare.
Residents are reminded that the flu vaccine is safe and effective. Common side effects are mild and may include soreness at the injection site, mild fever, or muscle aches. These side effects are generally short-lived and far less severe than the flu itself.
Healthcare providers are also stressing the importance of continuing COVID-19 precautions. Wearing masks, practicing good hand hygiene, and maintaining social distancing are still crucial, especially in crowded places.
Protect yourself and your loved ones by getting vaccinated. Together, we can help keep Bangalore healthy and safe this flu season. For more information on vaccination centers and schedules, residents can visit the Karnataka Health Department’s official website or follow their social media pages.
Stay informed, stay safe, and get your flu shot today!
Surat @ℂall @Girls ꧁❤8527049040❤꧂@ℂall @Girls Service Vip Top Model Safe
Malaria Data Quality and Use in Selected Centers of Excellence in Madagascar: Results from a Cross-Sectional Baseline Survey
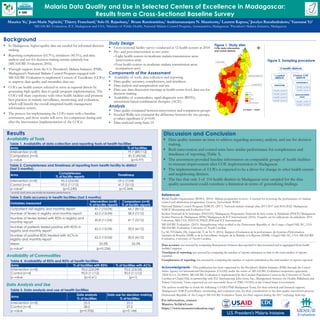
1. Malaria Data Quality and Use in Selected Centers of Excellence in Madagascar:
Results from a Cross-Sectional Baseline Survey
Background
ƒ In Madagascar, higher-quality data are needed for informed decision
making.
ƒ Reporting completeness (65.3%), timeliness (45.5%), and data
analysis and use for decision making remain relatively low
(MEASURE Evaluation, 2016).
ƒ Through support from the U.S. President’s Malaria Initiative (PMI),
Madagascar’s National Malaria Control Program engaged with
MEASURE Evaluation to implement Centers of Excellence (COEs)
to improve data quality and streamline data use.
ƒ COEs are health centers selected to serve as regional drivers by
generating high-quality data to guide program implementation. The
COEs will share experience with other health facilities and promote
best practices in malaria surveillance, monitoring, and evaluation,
which will benefit the overall integrated health management
information system.
ƒ The process for implementing the COEs starts with a baseline
assessment, and those results will serve for comparison during and
after the intervention (implementation of the COEs).
Maurice Ye,1
Jean-Marie Ngbichi,1
Thierry Franchard,2
Solo H. Rajaobary,2
Brune Ramiranirina,2
Andriamananjara N. Mauricette,2
Laurent Kapesa,3
Jocelyn Razafindrakoto,3
Yazoumé Yé1
1
MEASURE Evaluation, ICF, Madagascar and USA; 2
Ministry of Public Health, National Malaria Control Program, Antananarivo, Madagascar; 3
President’s Malaria Initiative, Madagascar
Results
References
World Health Organization (WHO). (2010). Malaria programme reviews: A manual for reviewing the performance of malaria
control and elimination programmes. Geneva, Switzerland: WHO.
National Malaria Control Program (NMCP). (2017). National malaria strategic plan 2013-2017 and 2018-2022. Madagascar:
NMCP, Monitoring and Evaluation Unit.
Institut National de la Statistique (INSTAT)/Madagascar, Programme National de lutte contre le Paludisme (PNLP)/Madagascar,
Institut Pasteur de Madagascar (IPM)/Madagascar, & ICF International. (2016). Enquête sur les indicateurs du paludisme 2016.
Calverton, MD, USA: INSTAT, PNLP, IPM and ICF International.
MEASURE Evaluation. (2019). Strengthening: what worked in the Democratic Republic of the Congo. Chapel Hill, NC, USA:
MEASURE Evaluation, University of North Carolina.
Ly, M., N’Gbichi, JM., Lippeveld, T., & Yé Y. (2016). Rapport d’évaluation de la performance du Système d’Information
Sanitaire de Routine (SISR) et de la Surveillance Intégrée de la Maladie et la Riposte (SIMR). Chapel Hill, NC, USA: MEASURE
Evaluation, University of North Carolina.
Data accuracy was assessed by comparing discrepancies between data reported to data recounted and re-aggregated from health
facilities’ registers.
Timeliness of reporting was assessed by comparing the number of reports submitted on time to the total number of reports
expected.
Completeness of reporting was assessed by comparing the number of reports submitted to the total number of reports expected.
Acknowledgments—This publication has been supported by the President’s Malaria Initiative (PMI) through the United
States Agency for International Development (USAID) under the terms of MEASURE Evaluation cooperative agreement
AIDOAA-L-14-00004. MEASURE Evaluation is implemented by the Carolina Population Center at the University of North
Carolina at Chapel Hill, in partnership with ICF International; John Snow, Inc.; Management Sciences for Health; Palladium; and
Tulane University. Views expressed are not necessarily those of PMI, USAID, or the United States Government.
The authors would like to thank the following: USAID/PMI Madagascar Team, for their technical and financial support;
Madagascar’s NMCP surveillance, monitoring, and evaluation unit, for their contributions to the data quality assessment process;
Democratic Republic of the Congo’s MEASURE Evaluation Team, for their support during the 2017 exchange field trip.
For information, contact:
Maurice.Ye2@icf.com
https://www.measureevaluation.org/
Study Design
ƒ Cross-sectional facility survey conducted in 12 health centers in 2018
ƒ Pre- and post-intervention in two arms:
- Eight health centers in moderate malaria transmission areas
(intervention arm)
- Four health centers in moderate malaria transmission areas
(comparison arm)
Components of the Assessment
ƒ Availability of tools: data collection and reporting
ƒ Data quality: accuracy, completeness, and timeliness
ƒ Data analysis and interpretation and use
ƒ Data use: data discussion meetings at health center level, data use for
decision making
ƒ Availability of commodities: rapid diagnostic tests (RDTs),
artemisinin-based combination therapies (ACTs)
Analysis
ƒ Data quality compared between intervention and comparison groups
ƒ Kruskal-Wallis test estimated the difference between the two groups,
p-values significant if p0.05
ƒ Data analyzed using Stata 14
Figure 1. Study sites
COEs study intervention
and control districts
Figure 2. Sampling procedure
3 health districts
2 future COE
districts
1 control
districts
ANKAZOBE
Health center II
Health center II
Health center II
Health center II
Health center II
Health center II
Health center II
Health center II
ANTSIRABE II
Table 1. Availability of data collection and reporting tools at health facilities
Arms % of facilities
Intervention (n=8) 79.7 (89/112)
Comparison (n=4) 81.0 (45/56)
p-value (p=0.97)
Availability of Tools
Table 2. Completeness and timeliness of reporting from health facility to district
(last 3 months)
Arms
Completeness
% of facility reports
Timeliness
Intervention (n=8) 95.3 (23/24) 29.2 (7/24)
Control (n=4) 95.0 (11/12) 41.7 (5/12)
p-value* (p=0.240) (p=0.364)
* p0.05, both arms are similar for baseline performance
Table 3. Data accuracy in health facilities (last 3 months)
Variables measured
Intervention (n=8)
% of facility reports
Comparison (n=4)
% of facility reports
Outpatient visit registry and monthly report 41.7 (10/24) 66.7 (8/12)
Number of fevers in registry and monthly report 62.5 (15/24) 58.3 (7/12)
Number of fevers tested with RDTs in registry and
monthly report
45.8 (11/24) 41.7 (5/12)
Number of patients tested positive with RDTs in
registry and monthly report
62.5 (15/24) 50.0 (6/12)
Number of positive RDTs treated with ACTs in
registry and monthly report
62.5 (15/24) 50.0 (6/12)
Mean 55.0% 53.3%
p-value* (p=0.236)
Discussion and Conclusion
ƒ Data quality remains an issue to address regarding accuracy, analysis, and use for decision
making.
ƒ Both intervention and control arms have similar performance for completeness and
timeliness of reporting (Table 3).
ƒ The assessment provided baseline information on comparable groups of health facilities
to measure improvement after COE implementation in Madagascar.
ƒ The implementation of COEs is expected to be a driver for change in other health centers
and neighboring districts.
ƒ The fact that only 3 of 114 health districts in Madagascar were sampled for the data
quality assessment could constitute a limitation in terms of generalizing findings.
Table 4. Availability of RDTs and RDTs at health facilities
Arms % of facilities with RDTs % of facilities with ACTs
Intervention (n=8) 96.0 (23/24) 95.0 (23/24)
Control (n=4) 90.0 (11/12) 90.0 (11/12)
p-value (p=0.61) (p=1)
Availability of Commodities
Data Analysis and Use
Table 5. Data analysis and use at health facilities
Arms
Data analysis
% of facilities
Data use for decision making
% of facilities
Intervention (n=8) 25.0 25.5
Control (n=4) 28.0 27.0
p-value (p=0.926) (p=0.144)