This document discusses the importance of graphics in multimedia presentations. It provides definitions of multimedia and graphics, and explains that graphics are a key element of multimedia. Graphics can convey information visually through images, drawings and photographs. The document outlines the basic elements of graphics, including lines, shapes, space, texture and color. It also discusses some common graphic file formats and software for working with graphics.
The 12 Principles of Animation were developed by Disney animators to make animation more realistic and appealing. The principles include squash and stretch, anticipation, staging, straight ahead and pose-to-pose, follow through and overlapping action, slow in and slow out, arcs, secondary action, timing, exaggeration, solid drawing, and appeal. Understanding and applying these principles can help animators design scenes that effectively illustrate the principles in action.
Basic overview of the 3D animation workflow. From workspace to modeling, texturing, animating and rendering. This is part of a course introduction to digital graphics and animation.
Nelson Zagalo from the University of Minho in Portugal gave a presentation on compositing at the University of Maribor in Slovenia. Compositing involves combining visual elements from different sources to create a single image, often making elements appear part of the same scene. It is used for special effects in film and to connect real and artificial images. Traditional film techniques included physical compositing, multiple exposures, rear projection, and matting. Digital techniques include blend operations, keying, alpha channels, mattes, masks, nesting, color correction, and motion tracking. Zagalo provided examples of how these techniques have been used in famous films.
Multimedia involves combining different content forms such as text, audio, images, animation, video, and interactivity into one application or piece of media. There are five main elements in a complete multimedia system. Animation is the rapid display of images to create an illusion of movement, with each image being a frame. There are two main types of animation: 2D animation which involves moving drawings on a background either by changing drawings on clear sheets (cel animation) or moving objects along predetermined paths, and 3D animation which involves modeling, animating, and rendering 3D objects and scenes. The 12 basic principles of animation that help create realistic movement are timing, secondary action, follow through, straight ahead vs pose-to-pose action
The document discusses storyboarding techniques for planning film productions. A storyboard is a visual plan that represents each shot of a film through illustrations and includes information like camera movements, cuts between shots, and brief descriptions of the action. Storyboards are created during pre-production and are used on set by the director, assistant director, cinematographer, camera operator, and lighting technician to ensure shots are framed correctly and the lighting matches the vision.
This document provides an overview of 3D computer animation, including a brief history, definitions, benefits, software used, careers, and examples. It discusses how 3D animation works by storing individual images that are played back at 30 frames per second to create movement. Common software includes Maya, 3DS Max, and Softimage. The field is growing rapidly and is used extensively in movies, games, and visual effects. Careers include 3D modelers, animators, and art directors. Pixar, Disney, and Dreamworks are examples of companies that produce computer animated films like Toy Story, Shrek, and Harry Potter.
A collection of static images joined together and shown consecutively so that they appear to move.
Animation is about storytelling by bringing things to life (making them move).
The document discusses and provides examples of different animation techniques including traditional hand drawn animation, stop motion animation using cutouts, clay, and other materials, computer animation, sand animation, and drawn on film animation. Traditional hand drawn animation involves individually drawing each frame, while stop motion animation involves physically manipulating objects frame by frame. Computer animation uses digital techniques, and drawn on film animation creates images directly onto film. Claymation and sand animation are types of stop motion that involve sculpting clay or manipulating sand to create animated sequences.
This is a general overview of the animation process. Covering the initial planning stage, pre-production, shot planning and output. Presented as part of a course introduction to digital graphics and animation series.
Computer animation is the process of generating animated images using computer graphics. Modern computer animation typically uses 3D graphics to create virtual worlds where characters and objects can move and interact in a realistic manner. There are three main types of animation: traditional (hand-drawn), stop motion (manipulating real-world objects), and computer animation. Computer animation encompasses both 2D and 3D techniques and has largely replaced traditional animation due to being faster and less expensive to produce. Pixar and DreamWorks are notable studios that have produced highly successful computer animated feature films.
The document discusses the process and equipment used for animation. It covers pre-production steps like storyboarding, character design, and voice recording. During production, animators create key drawings and in-betweeners add frames. Cleanup artists refine drawings and inbetweeners ensure fluidity. Post-production involves digital ink and paint before final approval.
This document discusses animation, including its history, types, and applications. It notes that animation creates the illusion of movement by rapidly displaying sequential images. The earliest animated works date back to the 1900s. There are three main types of animation: hand drawn, stop motion, and computer animation. Hand drawn animation involves drawing each frame by hand, while stop motion manipulates real-world objects one frame at a time. Computer animation can be 2D or 3D, with 3D animation creating realistic objects using textures and lighting. Popular animation software includes Maya and ZBrush. Animation has many uses including in video games, TV, online media, simulations, and movies, which can cost $1-20 million to produce.
An introduction to Animation. What is Animation? What allows us to experience movements in an animation? How different types of animations are made? What are some uses of animation and what is the impact of animation on society?
Develop the most important skills you need to create a video. Join Master Trainer, Rich Harrington, as he introduces you to the basics of editing with Adobe Premiere Pro. Topics include accessing your footage, creating a timeline, and editing techniques that will make your videos stand out.
This document provides an introduction to using Adobe Photoshop for photography. It discusses key skills like asset management, file types and sizes, cropping tools, and dodging and burning tools. It also covers transferring images into Photoshop, opening and browsing files, checking file sizes, and using selection, zoom and adjustment tools to manipulate images. The document concludes with instructions on saving edited files separately from originals.
This document provides an introduction to using Adobe Photoshop CS. It explains how to open and set up documents, navigate the interface, and use basic tools. The interface is outlined, including the menu bar, toolbox, options bar, and palettes like layers, history and navigator. Common tools like selection, alteration and drawing tools are described. Basic functions like working with layers, colors and modes are also introduced. The goal is to get users started using Photoshop's core features for image editing.
- Animation is the illusion of movement created by displaying a series of images in rapid succession. The first animated film was created in the 1890s using a praxinoscope.
- Walt Disney's Snow White in 1937 is considered the first full-length animated feature film. Pixar's Toy Story in 1995 was the first computer-animated feature film.
- There are several types of animation including traditional 2D animation, 3D animation, stop-motion, and clay animation. Each type uses different techniques to create the illusion of movement.
This document defines and provides examples of key cinematic techniques related to mise-en-scene. It discusses lighting techniques including key lighting, fill lighting, and high key and low key lighting. It also covers setting, color, facial expressions, body language, gestures, costumes, makeup, props, and how these elements are used to represent characters. The document is intended as a study guide to help understand and identify important mise-en-scene elements in film.
3D modelling and animation using Autodesk mayaParvesh Taneja
This document provides a summary of a student project report on 3D modeling and animation using Autodesk Maya. The report includes chapters on the basics of 3D modeling and different types of modeling. It also covers an introduction to animation, various animation techniques, and an overview of Autodesk Maya software capabilities and system requirements.
The document discusses various cinematography techniques related to lighting and space. It describes three-point lighting which uses a key light, back light, and fill light to model a subject. High-key lighting has the fill light close to the key light level, resulting in few shadows, while low-key lighting uses little fill light, creating strong contrasts. It also discusses techniques for manipulating depth of space including deep space, shallow space, and offscreen space.
This presentation contains following topics -
What is Animation?
History?
Types of Animation
Advantages & Disadvantages
Uses
Any request for any presentation is accepted : nbhavsar506@gmail.com
Professional or Business Presentations will me charged.
This document introduces Blender, an open-source 3D modeling and animation software. It covers Blender's interface and various window types. It then discusses modeling tools such as adding objects, transformations, and editing modes. The document also introduces lighting and materials, focusing on nodes. It concludes with rendering, cameras, and resources for further learning.
This document discusses animation techniques and principles. It begins by outlining the structure of animation and principles like persistence of vision. It then discusses different types of animation including 2D, 2.5D, and 3D animation. The document details the process of cel animation including keyframes and tweening. It also discusses computer animation software, file formats for animation, and considerations for using animation effectively.
The document discusses different film theory principles including types of films like realism, classical, and formalism. It also covers various film techniques such as shots, angles, lighting, color, sound, editing, and mise-en-scene. The goal is to understand how to analyze films through an examination of their content and stylistic elements.
Motion graphics are pieces of digital footage or animation that create the illusion of motion or rotation and are usually combined with audio for use in multimedia projects. Motion graphics are usually displayed via electronic media technology, but may also be displayed via manual powered technology (e.g. thaumatrope, the phenakistoscope, stroboscope, zoetrope, praxinoscope, flip book). The term distinguishes still graphics from those with a transforming appearance over time, without over-specifying the form. While any form of experimental or abstract animation can be called motion graphics, the term typically more explicitly refers to the commercial application of animation and effects to video, film, TV, and interactive applications.
Motion graphics extend beyond the most commonly used methods of frame-by-frame footage and animation. Motion graphics can be distinguished from typical animation in that they are not strictly character driven or story based and often represent animated abstract shapes and forms such as logos or logo elements.
Videografi adalah teknik pengambilan gambar dan penyusunan scene untuk membentuk cerita yang mudah dinikmati pemirsa. Dokumen ini menjelaskan proses produksi video mulai dari persiapan seperti menentukan ide, membuat naskah dan storyboard, persiapan peralatan rekaman, teknik pengambilan gambar, hingga tahap pascaproduksi seperti editing, penambahan teks dan suara, serta penyimpanan hasil akhir video. Jenis
This document outlines an assignment for a graphic design course. The assignment tasks students with redesigning websites for adults, teenagers, and kids based on research. Students must submit 3 printed color pages for each demographic along with documentation discussing the original websites and reasons for redesign. The documentation should include screenshots of the original websites and address formatting requirements for the printed submission.
This document discusses fundamental typography concepts including size, lines, leading, tracking, and kerning. It explains that size is measured in inches, millimeters, or pixels and describes the five horizontal text lines: baseline, cap height, ascender height, x-height, and descender height. It also defines leading as the space between lines of text and recommends a leading value of 1.25 to 1.5 times the font size. Finally, it describes tracking as the space between groups of characters that can be loose or tight, and kerning as the microscopic spacing between two characters to allow easy reading flow.
The document discusses various topics related to visual communication and visual arts. It begins by defining visual communication as the communication of ideas through visual means such as images, signs, photography, and web design. It then provides examples of common types of visual art like collage, comics, conceptual art, crafts, decorative art, and more. For each type of visual art, it offers a brief definition and description. The document also discusses visual art techniques and mediums such as decollage, design, drawing, film, graffiti, illustration, installation art, and mixed media; defining and describing each one.
1) The document discusses graphics communication and defines it as the process of creating, producing, and distributing visual materials like photographs, drawings, diagrams, and typography to convey information, concepts, and emotions.
2) Graphics communication relies on graphical aids and can be either functional or artistic. Common graphical aids mentioned include photographs, drawings, line art, diagrams, typography, and graphs.
3) Communication design is concerned with how different media like print, electronic, or presentations communicate with people. Graphic design focuses on visual communication and presentation.
Raster graphics are bitmap images composed of grids of pixels with a fixed resolution that cannot be resized without quality loss. Common raster formats include GIFs for animations and simple graphics, JPEGs for photographs, BMPs for editing graphics, PNGs for transparent images, and TIFFs for high resolution printing and storage of raw bitmap data.
Fundamental graphic design by rayn howayekRayn HOWAYEK
Graphic design evolved from a need to effectively communicate ideas and messages to promote information. It combines elements like images, words, colors and formats to visually represent concepts. A graphic designer considers questions like the objective, hierarchy of information, flow of elements, target audience and tone when creating pieces. They use tools including point, line, shape, pattern, texture, space, size, type, color and images guided by principles of balance, rhythm, emphasis and unity. Understanding how perception works helps designers effectively engage audiences.
Anatomy of letterforms
Evolution of letterforms & type classifications
Type terminology typefaces, type styles & type families
Measurements of type
Line spacing
Letter spacing and word spacing
Working with large bodies of type
Alignment for large bodies of type
Choosing and using a typeface
Project Report on Computer (Basics, MS Word, MS Powerpoint, Email)Nikhil Dhawan
Computers are really great, in every field, every walk of life we are depended on them, Even we think that we know about them (Computers) a lot but when there is the thing that we have to write a report on computers we all started finding it on the Air (Internet).
Project Report on Computer (Basics, Word, Power point and Email)
So, making it clear and easily understandable to students and even other people who want to prepare a report, I wrote this Simple Knowledge Giving Report on Computers it Includes About Computers, Its Components, MS Word, MS PowerPoint & Email.
You only have to remove the headers and footers and then enjoy the free content. No editing required, I Ensure it is 100% Approved report with great content in it.
Hope You will enjoy it.
An urban area is characterized by higher population density and vast human features in comparison to areas surrounding it. Urban areas may be cities, towns or conurbations, but the term is not commonly extended to rural settlements such as villages. Any portion of earth’s surface where physical conditions are homogeneous can be considered as a Region in geographic sense, ranging from a single feature region to compage, depending on the
criteria used for delineation. In practice, a prefix is added to highlight the attributes on which the region has been defined, for example, agriculture region, resource region, city region, planning region.
All the daily activities of human beings are carried out on land. Proper organization of these activities i.e. planning will help the human being in leading a richer and fuller life in livable surroundings or environment. "Planning" means the scientific, aesthetic, and orderly disposition of land, resources, facilities and services with a view to securing the physical, economic and social efficiency, health and well-being of urban and rural communities.
The document provides a history of writing systems from early pictographs to the development of alphabets and discusses the invention of the printing press. It then explains the role of typography in graphic design in communicating messages and includes definitions of key typographic terms such as typefaces, serifs, and measurements like points and picas.
When a thing has to be communicated, there are various sources to do it and humans have probably utilized everything from cave paintings to static words till images in order depict their messages and thoughts.
Marketing involves identifying and satisfying customer needs in a profitable manner. The marketing process discovers unfulfilled customer needs and brings products to market to meet those needs. This process can be modeled as a sequence of steps. Marketing also involves using a mix of promotion, price, place, and product to target different market segments that are often defined by geographic, demographic, psychographic, and behavioral factors. When developing new products and services, organizations must consider characteristics like intangibility, inseparability, heterogeneity, and perishability that are core to services. The new product development process progresses through different stages as well.
Multimedia is an interactive medium that provides information to users through multiple formats like text, audio, video, graphics and animation. It allows for interaction between users and digital content. Multimedia is used in education, training, business presentations, advertising and documentaries. It represents information in an attractive and engaging way through a combination of formats. Components of multimedia include text, graphics in various formats, audio and video. Multimedia provides linear experiences that play in chronological order as well as non-linear experiences that allow free navigation of content.
Multimedia combines various digital media types such as text, audio, images, animation, and video into an integrated multi-sensory interactive application or presentation. It is defined as a combination of text, graphics, sound, animation, and video delivered by computer. The key elements of multimedia include text, graphics, audio, animation, and video. Multimedia can be interactive, allowing user control, or linear with no user control over content. Authoring tools are used to develop and integrate different media elements into a multimedia project. Multimedia has various applications and uses in fields such as business, education, entertainment, and public spaces.
Multimedia is the field concerned with the computer controlled integration of text, graphics, drawings, still and moving images (Video), animation, audio, and any other media where every type of information can be signified, stored, communicated and handled digitally.
This document discusses multimedia and its elements. It defines multimedia as media that uses multiple forms of content like text, audio, graphics, video, and interactivity. The five main categories of multimedia are described as text, graphics, audio, video, and animation. Examples and file formats are provided for each category. Applications of multimedia discussed include entertainment, business, software, and e-learning. Multimedia is said to be an important part of any presentation and its use has increased with the internet and demand for digital content.
This document provides an overview of a textbook about multimedia in the 21st century. It contains 5 chapters that explore various topics related to multimedia, including the internet and multimedia, exploring the world of multimedia, multimedia and society, multimedia and business, and multimedia and education/healthcare. The first chapter examines the concept of multimedia and discusses the integration of text, images, sound, and video using computer technology. It also outlines the historic development of multimedia and provides examples of how it is used in different contexts.
This document discusses multimedia and provides an overview of key topics. It defines multimedia as content that uses a combination of different media types like text, audio, images, video and interactive content. The history of multimedia is explored, noting how newspapers were early adopters of multiple media elements. Multimedia is then categorized as either linear or non-linear, with linear following a set sequence and non-linear allowing free movement. Features of multimedia like text, audio, images, video and animation are described. The document also outlines applications of multimedia in areas like commercial, entertainment, education and engineering. It concludes by discussing the future potential of multimedia.
The document discusses multimedia, defining it as any system that uses multiple physical or digital mediums to present or communicate information. It can include various mediums like text, images, animation, sound, video and interactivity. Multimedia is interactive when the user has control over what content they view and when. It is commonly used in entertainment, education, business and more. It allows for a more engaging experience by combining different content types.
Multimedia is defined as a combination of different forms of media and content, such as text, audio, images, video and interactivity. It is usually experienced through electronic devices and can be either linear or non-linear. Major characteristics of multimedia include it being viewed live or recorded, broadcast digitally or analog, and used for games, simulations or enhancements. Emerging technologies are further enhancing the multimedia experience.
Multimedia refers to any combination of text, graphics, audio, animations, and video delivered via computer. It allows for information to be represented through multiple mediums beyond just text. Multimedia can be linear, like movies, or non-linear with user interactivity like games. The main components of multimedia are text, graphics, audio, animations, and video. Multimedia has applications in education for computer-based training, in business for presentations and marketing, and in entertainment with virtual reality and digital kiosks. While it utilizes our natural senses, multimedia also has disadvantages like requiring powerful computers and high development costs. Multimedia authoring tools help create interactive multimedia projects.
Unit four Image processing multimedia System.pptdejen6
After studying this chapter, the reader will be able to recognize components of multimedia, understand multimedia production, and create interactive applications using multimedia tools. It defines multimedia and explains its importance. It identifies the necessary hardware and software to run multimedia and differentiates multimedia from hypermedia. It lists and explains the stages of multimedia authoring and identifies common sound, image, and video file formats.
Multimedia is defined as using multiple forms of media like text, audio, graphics, animation, and video to inform or entertain users. It combines elements like text, sound, images, animation, and video. Multimedia can be linear or non-linear. It has various applications in creative industries, commercial use, education, engineering, homes, industries, medicine, and public places. It is used for purposes like advertising, training, simulations, reference materials, and providing information.
Multimedia is the representation of information using multiple digital media types like text, audio, video, graphics and animation. It provides an interactive experience for users. Multimedia has various components - text, graphics, audio, video and animation. It is used extensively in education, business, advertising and documentaries.
Rich content refers to digital content that encourages user engagement through elements like audio, visuals and interactivity. Examples of rich content include static images, animated GIFs, and videos. Interactive multimedia allows users to control and manipulate different media types and provides interactivity through applications like videogames, e-commerce sites, maps, and social media.
This document provides an overview of multimedia and discusses several key topics:
1. It defines multimedia and its basic elements of text, images, audio, animation, and video. Interactivity is also a key feature.
2. Hypertext and hypermedia are introduced as forms of linking multimedia components.
3. Examples are given for where multimedia can be used, such as presentations, education, and data analysis.
4. Several multimedia-related professional occupations are described, including animators, sound producers, graphic designers, programmers, writers, and video producers. Each plays an important role in a multimedia project team.
This document introduces multimedia and its history. It defines multimedia as the combination of two or more media, such as graphics, text, audio, video, and animation. Early uses of multimedia involved slide projectors and tape recorders used together. Today, multimedia typically refers to digital media combined on computers. The document discusses the evolution of personal computers that enabled the creation and use of digital multimedia. It also outlines some pioneers of hypermedia and hypertext, such as Ted Nelson and Douglas Engelbart, whose work influenced the development of the modern internet.
The document defines multimedia and its key elements. It discusses how multimedia involves various media like text, graphics, audio, video and animation. It also explains how multimedia applications allow nonlinear interactivity for users to navigate content. Common file formats and authoring tools for developing multimedia are also covered.
The document discusses multimedia systems and their components. It defines multimedia as the integration of different forms of information like text, audio, video, and animation. The key components of a multimedia system are described as text, graphics, audio, video, and animation. Input and output devices used in multimedia applications are also outlined, including monitors, speakers, microphones, cameras, and network interfaces. Finally, popular file formats for text, images, audio and video are briefly explained.
what is multimedia?
- Multimedia is a combination of text, graphic, sound, animation, and video that is delivered interactively to the user by electronic or digitally manipulated means.
Objectives
1. What is Multimedia.
2. Elements of Multimedia.
3. Hyper Media.
4. Linear Multimedia.
5. Non-Linear Multimedia.
6. Authoring Tools.
7. Importance of Multimedia
Multimedia is a combination of different media types like text, graphics, audio, video and animation to effectively communicate ideas. The five main elements of multimedia are text, graphics, audio, video and animation. Multimedia can be linear, with no user interaction, or non-linear and interactive. It has various applications in education, business and entertainment by engaging multiple senses to improve learning, presentations and entertainment.
Multimedia is a combination of text, graphics, audio, video, and animations that are presented to the user interactively via electronic or digital means. It includes elements such as text, graphics, audio, video, and animations. Multimedia can be linear, with no user interactivity, or non-linear, where users have control over content. Authoring tools are used to combine multimedia elements into interactive projects. Multimedia has various important uses in fields such as business, education, entertainment, and public spaces.
This document provides instructions for a typing skills assessment test. It outlines that the test will last 1 hour, candidates should write their name and follow all instructions, and save their work with their name on their desktop. The test includes producing text on various topics related to multimedia using different formatting as indicated, such as capitalization, bolding, font sizes, justification, underlining, and line spacing. Multimedia is described as using multiple media like text, audio, graphics, video and interactivity to convey information across different fields including education, entertainment, engineering, and more.
The Perpustakaan Tun Abdul Razak (PTAR) library website provides access to many of the library's services and resources online. It contains features like bookmarks, practical information about the library's location, training guides, a search function, access to online publications and databases, an online catalogue, links to library friends and other libraries, an "Ask a librarian" function, subject folders, and information about the library's own publications. The website aims to be the main gateway for users to access the library's resources and services virtually. It provides concise and easy navigation to key information, resources, and assistance functions to support users' needs.
Managers must effectively manage their organizations in three key ways:
1. Detect and solve problems to make good decisions and ensure employees work toward objectives.
2. Assess the future and plan for it.
3. There are four processes of management: planning, organizing, leading, and controlling. These processes set goals, determine tasks and structure, manage employees, and monitor performance. Organizing further divides work into departments by function, product, territory, customer, or a matrix to specialize work and increase efficiency.
The document provides an overview of two online databases available through the Perpustakaan Tun Abdul Razak (PTAR) portal: Emerald Management Plus and BLIS (Bernama Library & Infolink Service).
It describes key features of each database, including accessibility, searching techniques like Boolean, truncation and wildcard searches, subject coverage, and accuracy of information. Emerald covers subjects like management, business, and library sciences, while BLIS contains Malaysian news, statistics, reports and biographies. Both databases allow effective searching and retrieval of valid, peer-reviewed academic references.
This document compares and contrasts three types of information agencies: libraries, archives, and museums. It provides details on the Library of Congress, the National Archives and Records Administration in the US, and the Bank Negara Malaysia Money Museum. The key points are:
- Libraries collect, organize and provide access to information resources like books and media to support research and learning. Archives preserve historical government and organizational records. Museums acquire, conserve and exhibit objects related to history, art, science.
- Each agency has a unique collection - the Library of Congress has 147 million catalogued items, the National Archives manages records of the US government and military veterans, and the Money Museum focuses on money, banknotes and coins.
Article review on The National Broadband Initiative Dirz M
The National Broadband Initiative was launched in Malaysia in 2010 to improve broadband access. [1] The document discusses an article that describes the initiative's goals of boosting Malaysia's socioeconomic development and GDP through high-speed broadband connectivity. [2] The article argues that broadband will benefit communities and businesses while attracting foreign investment, and the government aims to connect 50% of households by year's end. [3]
PTAR's library website provides several useful features and services to users. It has a simple and easy to navigate homepage. The website also offers bookmarks, maps and directions to help users virtually visit the library. Training guides and online publications are available to aid users in researching and accessing library resources. While some features work well, improvements could be made to the search functionality and providing clearer guidance on services.
This document discusses the importance of bibliographies and provides an example bibliography on the topic of economics. It begins by defining what a bibliography is and its key functions, such as enabling fact checking, helping readers locate sources, and giving credit to other authors. It then provides a categorized bibliography listing various source types related to economics, such as books, journals, reports, and more. The document discusses arranging sources alphabetically and including both English and Malay language materials to serve Malaysian users. It also addresses the intended audiences and limitations faced in compiling the economic sources bibliography.
Understanding User Needs and Satisfying ThemAggregage
https://www.productmanagementtoday.com/frs/26903918/understanding-user-needs-and-satisfying-them
We know we want to create products which our customers find to be valuable. Whether we label it as customer-centric or product-led depends on how long we've been doing product management. There are three challenges we face when doing this. The obvious challenge is figuring out what our users need; the non-obvious challenges are in creating a shared understanding of those needs and in sensing if what we're doing is meeting those needs.
In this webinar, we won't focus on the research methods for discovering user-needs. We will focus on synthesis of the needs we discover, communication and alignment tools, and how we operationalize addressing those needs.
Industry expert Scott Sehlhorst will:
• Introduce a taxonomy for user goals with real world examples
• Present the Onion Diagram, a tool for contextualizing task-level goals
• Illustrate how customer journey maps capture activity-level and task-level goals
• Demonstrate the best approach to selection and prioritization of user-goals to address
• Highlight the crucial benchmarks, observable changes, in ensuring fulfillment of customer needs
3 Simple Steps To Buy Verified Payoneer Account In 2024SEOSMMEARTH
Buy Verified Payoneer Account: Quick and Secure Way to Receive Payments
Buy Verified Payoneer Account With 100% secure documents, [ USA, UK, CA ]. Are you looking for a reliable and safe way to receive payments online? Then you need buy verified Payoneer account ! Payoneer is a global payment platform that allows businesses and individuals to send and receive money in over 200 countries.
If You Want To More Information just Contact Now:
Skype: SEOSMMEARTH
Telegram: @seosmmearth
Gmail: seosmmearth@gmail.com
Company Valuation webinar series - Tuesday, 4 June 2024FelixPerez547899
This session provided an update as to the latest valuation data in the UK and then delved into a discussion on the upcoming election and the impacts on valuation. We finished, as always with a Q&A
Easily Verify Compliance and Security with Binance KYCAny kyc Account
Use our simple KYC verification guide to make sure your Binance account is safe and compliant. Discover the fundamentals, appreciate the significance of KYC, and trade on one of the biggest cryptocurrency exchanges with confidence.
Structural Design Process: Step-by-Step Guide for BuildingsChandresh Chudasama
The structural design process is explained: Follow our step-by-step guide to understand building design intricacies and ensure structural integrity. Learn how to build wonderful buildings with the help of our detailed information. Learn how to create structures with durability and reliability and also gain insights on ways of managing structures.
Brian Fitzsimmons on the Business Strategy and Content Flywheel of Barstool S...Neil Horowitz
On episode 272 of the Digital and Social Media Sports Podcast, Neil chatted with Brian Fitzsimmons, Director of Licensing and Business Development for Barstool Sports.
What follows is a collection of snippets from the podcast. To hear the full interview and more, check out the podcast on all podcast platforms and at www.dsmsports.net
How to Implement a Strategy: Transform Your Strategy with BSC Designer's Comp...Aleksey Savkin
The Strategy Implementation System offers a structured approach to translating stakeholder needs into actionable strategies using high-level and low-level scorecards. It involves stakeholder analysis, strategy decomposition, adoption of strategic frameworks like Balanced Scorecard or OKR, and alignment of goals, initiatives, and KPIs.
Key Components:
- Stakeholder Analysis
- Strategy Decomposition
- Adoption of Business Frameworks
- Goal Setting
- Initiatives and Action Plans
- KPIs and Performance Metrics
- Learning and Adaptation
- Alignment and Cascading of Scorecards
Benefits:
- Systematic strategy formulation and execution.
- Framework flexibility and automation.
- Enhanced alignment and strategic focus across the organization.
The 10 Most Influential Leaders Guiding Corporate Evolution, 2024.pdfthesiliconleaders
In the recent edition, The 10 Most Influential Leaders Guiding Corporate Evolution, 2024, The Silicon Leaders magazine gladly features Dejan Štancer, President of the Global Chamber of Business Leaders (GCBL), along with other leaders.
[To download this presentation, visit:
https://www.oeconsulting.com.sg/training-presentations]
This presentation is a curated compilation of PowerPoint diagrams and templates designed to illustrate 20 different digital transformation frameworks and models. These frameworks are based on recent industry trends and best practices, ensuring that the content remains relevant and up-to-date.
Key highlights include Microsoft's Digital Transformation Framework, which focuses on driving innovation and efficiency, and McKinsey's Ten Guiding Principles, which provide strategic insights for successful digital transformation. Additionally, Forrester's framework emphasizes enhancing customer experiences and modernizing IT infrastructure, while IDC's MaturityScape helps assess and develop organizational digital maturity. MIT's framework explores cutting-edge strategies for achieving digital success.
These materials are perfect for enhancing your business or classroom presentations, offering visual aids to supplement your insights. Please note that while comprehensive, these slides are intended as supplementary resources and may not be complete for standalone instructional purposes.
Frameworks/Models included:
Microsoft’s Digital Transformation Framework
McKinsey’s Ten Guiding Principles of Digital Transformation
Forrester’s Digital Transformation Framework
IDC’s Digital Transformation MaturityScape
MIT’s Digital Transformation Framework
Gartner’s Digital Transformation Framework
Accenture’s Digital Strategy & Enterprise Frameworks
Deloitte’s Digital Industrial Transformation Framework
Capgemini’s Digital Transformation Framework
PwC’s Digital Transformation Framework
Cisco’s Digital Transformation Framework
Cognizant’s Digital Transformation Framework
DXC Technology’s Digital Transformation Framework
The BCG Strategy Palette
McKinsey’s Digital Transformation Framework
Digital Transformation Compass
Four Levels of Digital Maturity
Design Thinking Framework
Business Model Canvas
Customer Journey Map
Anny Serafina Love - Letter of Recommendation by Kellen Harkins, MS.AnnySerafinaLove
This letter, written by Kellen Harkins, Course Director at Full Sail University, commends Anny Love's exemplary performance in the Video Sharing Platforms class. It highlights her dedication, willingness to challenge herself, and exceptional skills in production, editing, and marketing across various video platforms like YouTube, TikTok, and Instagram.
[To download this presentation, visit:
https://www.oeconsulting.com.sg/training-presentations]
This PowerPoint compilation offers a comprehensive overview of 20 leading innovation management frameworks and methodologies, selected for their broad applicability across various industries and organizational contexts. These frameworks are valuable resources for a wide range of users, including business professionals, educators, and consultants.
Each framework is presented with visually engaging diagrams and templates, ensuring the content is both informative and appealing. While this compilation is thorough, please note that the slides are intended as supplementary resources and may not be sufficient for standalone instructional purposes.
This compilation is ideal for anyone looking to enhance their understanding of innovation management and drive meaningful change within their organization. Whether you aim to improve product development processes, enhance customer experiences, or drive digital transformation, these frameworks offer valuable insights and tools to help you achieve your goals.
INCLUDED FRAMEWORKS/MODELS:
1. Stanford’s Design Thinking
2. IDEO’s Human-Centered Design
3. Strategyzer’s Business Model Innovation
4. Lean Startup Methodology
5. Agile Innovation Framework
6. Doblin’s Ten Types of Innovation
7. McKinsey’s Three Horizons of Growth
8. Customer Journey Map
9. Christensen’s Disruptive Innovation Theory
10. Blue Ocean Strategy
11. Strategyn’s Jobs-To-Be-Done (JTBD) Framework with Job Map
12. Design Sprint Framework
13. The Double Diamond
14. Lean Six Sigma DMAIC
15. TRIZ Problem-Solving Framework
16. Edward de Bono’s Six Thinking Hats
17. Stage-Gate Model
18. Toyota’s Six Steps of Kaizen
19. Microsoft’s Digital Transformation Framework
20. Design for Six Sigma (DFSS)
To download this presentation, visit:
https://www.oeconsulting.com.sg/training-presentations
IMPACT Silver is a pure silver zinc producer with over $260 million in revenue since 2008 and a large 100% owned 210km Mexico land package - 2024 catalysts includes new 14% grade zinc Plomosas mine and 20,000m of fully funded exploration drilling.
Zodiac Signs and Food Preferences_ What Your Sign Says About Your Tastemy Pandit
Know what your zodiac sign says about your taste in food! Explore how the 12 zodiac signs influence your culinary preferences with insights from MyPandit. Dive into astrology and flavors!
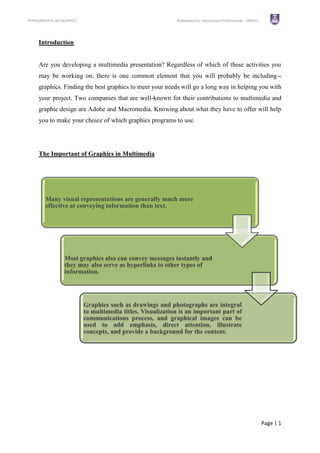
1. FUNDAMENTAL OF GRAPHICS Multimedia for Information Professionals – IMS457 LS
Introduction
Are you developing a multimedia presentation? Regardless of which of these activities you
may be working on, there is one common element that you will probably be including--
graphics. Finding the best graphics to meet your needs will go a long way in helping you with
your project. Two companies that are well-known for their contributions to multimedia and
graphic design are Adobe and Macromedia. Knowing about what they have to offer will help
you to make your choice of which graphics programs to use.
The Important of Graphics in Multimedia
Many visual representations are generally much more
effective at conveying information than text.
Most graphics also can convey messages instantly and
they may also serve as hyperlinks to other types of
information.
Graphics such as drawings and photographs are integral
to multimedia titles. Visualization is an important part of
communications process, and graphical images can be
used to add emphasis, direct attention, illustrate
concepts, and provide a background for the content.
Page | 1
2. FUNDAMENTAL OF GRAPHICS Multimedia for Information Professionals – IMS457 LS
1.0 Multimedia
Definition of Multimedia
Derived from the word ―Multi‖ and ―Media‖.
Multi – means Many, Multiple,
Media - Tools that is used to represent or do a certain things, delivery
medium, a form of mass communication – newspaper, magazine / tv.
Distribution tool & information presentation – text, graphic, voice,
images, music and etc.
Multimedia is a combination of text, graphic, sound, animation, and video that is delivered
interactively to the user by electronic or digitally manipulated means.
Multimedia is the media that uses multiple forms of information content and information
processing (e.g. text, audio, graphics, animation, video, interactivity) to inform or entertain
the user. Multimedia also refers to the use of electronic media to store experience multimedia
content. Multimedia is similar to traditional mixed media in fine art, but with a broader scope.
The term "rich media" is synonymous for interactive multimedia.1
GRAPHICS
AUDIO ANIMATION
MULTIMEDIA
VIDEO TEXT
Chart 1 : The Elements of Multimedia
1
Vaughn, T. (1998). Multimedia: Making It Work. (4th ed.). New York:Osborne-McGraw Hill. (299-300).
Page | 2
3. FUNDAMENTAL OF GRAPHICS Multimedia for Information Professionals – IMS457 LS
1.1 Categories of Multimedia
Multimedia may be broadly divided into linear and non-linear categories. Linear active
content progresses without any navigation control for the viewer such as a cinema
presentation. Non-linear content offers user interactivity to control progress as used with a
computer game or used in self-paced computer based training. Non-linear content is also
known as hypermedia content. Multimedia presentations can be live or recorded. A recorded
presentation may allow interactivity via a navigation system. A live multimedia presentation
may allow interactivity via interaction with the presenter or performer.
1.2 Features of Multimedia
Multimedia presentations may be viewed in person on stage, projected, transmitted,
or played locally with a media player. A broadcast may be a live or recorded
multimedia presentation. Broadcasts and recordings can be either analog or digital
electronic media technology. Digital online multimedia may be downloaded or
streamed. Streaming multimedia may be live or on-demand.
Multimedia games and simulations may be used in a physical environment with
special effects, with multiple users in an online network, or locally with an offline
computer, game system, or simulator. Enhanced levels of interactivity are made
possible by combining multiple forms of media content But depending on what
multimedia content you have it may vary Online multimedia is increasingly becoming
object-oriented and data-driven, enabling applications with collaborative end-user
innovation and personalization on multiple forms of content over time. Examples of
these range from multiple forms of content on web sites like photo galleries with both
images (pictures) and title (text) user-updated, to simulations whose co-efficient,
events, illustrations, animations or videos are modifiable, allowing the multimedia
"experience" to be altered without reprogramming.2
2
Vaughn, T. (1998). Multimedia: Making It Work. (4th ed.). New York:Osborne-McGraw Hill. (299-300).
Page | 3
4. FUNDAMENTAL OF GRAPHICS Multimedia for Information Professionals – IMS457 LS
2.0 The Elements of Multimedia - Graphic
2.1 Introduction
Graphics or still images are the important element of a multimedia project or a web site. In
order to make a multimedia presentation look elegant and complete, it is necessary to spend
ample amount of time to design the graphics and the layouts. Competent, computer literate
skills in graphic art and design are vital to the success of a multimedia project.
2.2 Definition
Graphics is a digital representation of non-text information such as a drawing, chart, or
photograph. It is also called a digital picture or image, and contains no movement or
animation. In simple description, Graphic is two-dimensional figure or illustration Could be
produced manually (by drawing, painting, carving, etc.) or by computer graphics technology.
Used in multimedia to show more clearly what a particular information is all about
(diagrams, picture).3
2.3 Elements of graphics
To create a remarkable graphics, developer must understand graphics and its elements:
Lines Shapes Space Texture Color
Chart 2 : The Elements of Graphics
3
Ulrich, T. (2001, September 22). Linking business coverage with graphics. Designer, 150, 30-33.
Page | 4
5. FUNDAMENTAL OF GRAPHICS Multimedia for Information Professionals – IMS457 LS
2.3.1 Lines
A line is a mark with length and directions. Continuous mark made on some surface by a
moving point. Types of line include: vertical, horizontal, diagonal, straight or ruled, curved,
bent, angular, etc.
Picture 1 : Lines
Lines can be used to:
Organize information.
Highlight or stress words.
Connect pieces of information.
Outline a photo or set it off from other elements.
Create a grid. (A grid is the underlying structure of a page.)
Create a chart or graph.
Create a pattern or rhythm by drawing many lines.
Direct the reader's eye or create a sense of motion. (Create a sense of action by
using a diagonal line.)
Suggest an emotion.
Page | 5
6. FUNDAMENTAL OF GRAPHICS Multimedia for Information Professionals – IMS457 LS
2.3.2 Shapes
Anything that has height and width has shape. Unusual shapes can be used to attract
attention. There are basically three types of shapes. Geometric shapes, such as triangles,
squares, rectangles, and circles, are regular and structured. These shapes work very well as
building blocks for graphic design. Natural shapes, such as animals, plants, and humans, are
irregular and fluid. Abstracted shapes, such as icons, stylized figures, and graphic
illustrations, are simplified versions of natural shapes.
Picture 2 : Shapes
With shape you can:
Crop a photo in an interesting way, such as in an oval.
Symbolize an idea.
Make a block of text more interesting by setting the text into a shape.
Create a new format.
Highlight information. You could add a screened or tinted shape to highlight
important information.
Page | 6
7. FUNDAMENTAL OF GRAPHICS Multimedia for Information Professionals – IMS457 LS
2.3.3 Space
Refers to the distance or area between, around, above, below, or within things. It can be
described as two-dimensional or three-dimensional; as flat, shallow or as positive or negative
space etc.
Picture 3 : Space
Space can be used to:
Give the eye a visual rest.
Create ties between elements.
Highlight an element.
Put a lot of white space around something important to call attention to it.
Make a layout easy to follow.
Make type as legible as possible.
Page | 7
8. FUNDAMENTAL OF GRAPHICS Multimedia for Information Professionals – IMS457 LS
2.3.4 Texture
Texture is the look or feel of a surface. You can add richness and dimension to your layouts
with texture. Visual texture creates an illusion of texture on a printed publication or web
page. Patterns, such as the images printed on wrapping paper, are a type of visual texture.
Tactile texture can actually be felt. Printed publications can be printed on textured paper that
readers can feel.
Picture 4 : Textures
Actual textures can be felt with fingers, while simulated textures will be suggested by an
artist in the painting of different areas of a picture.
Texture can be used to:
Give a printed publication, presentation, or web page a mood or personality.
Create contrast for interest.
Fool the eye.
Provoke emotions.
Create a feeling of richness and depth.
Page | 8
9. FUNDAMENTAL OF GRAPHICS Multimedia for Information Professionals – IMS457 LS
2.3.5 Color
Color in layouts can convey moods, create images, attract attention, and identify objects.
When selecting colors for a publication or a web page, think about what you want the color to
do and what is appropriate for your purpose.
An element of art with three properties:
hue or tint (the color name)
Related to the wavelength of light
intensity (purity and strength of a color)
Related to the purity of light
value (the lightness or darkness of a color)
Related to the amplitude of light
Picture 5 : Hue Color Pyramid
Color can be used to:
Highlight important elements such as headlines and subheads.
Attract the eye.
Signal the reader where to look first.
Create an image or a mood.
Tie a layout together.
Organize.
Group elements together or isolate them.
Provoke emotion.
Page | 9
10. FUNDAMENTAL OF GRAPHICS Multimedia for Information Professionals – IMS457 LS
3.0 Principle of Graphics
Graphic principles, on the other hand, deal with the overall look of the piece and how all the
elements fit in with it. Things like balance, focal point, and unity are three of the most
important graphic principles.
3.0.1 Balance
Balance is an equal distribution of weight. In terms of graphics, this applies to visual
weight. Each element on a layout has visual weight that is determined by its size,
darkness or lightness, and thickness of lines. There are two basic approaches to
balance. The first is symmetrical balance which is an arrangement of elements so that
they are evenly distributed to the left and to the right of center. The second is
asymmetrical balance which is an arrangement of unlike objects of equal weight on
each side of the page. Color, value, size, shape, and texture can be used as balancing
elements.
Symmetrical balance can communicate strength and stability and is appropriate for
traditional and conservative publications, presentations, and web sites. Asymmetrical
balance can imply contrast, variety, movement, surprise, and informality. It is
appropriate for modern and entertaining publications, presentations, and web sites.
To create balance:
Repeat a specific shape at regular intervals, either horizontally or vertically.
Center elements on a page.
Put several small visuals in one area to balance a single large image or block of text.
Use one or two odd shapes and make the rest regular shapes.
Lighten a text-heavy piece with a bright, colorful visual.
Leave plenty of white space around large blocks of text or dark photographs.
Offset a large, dark photograph or illustration with several small pieces of text, each
surrounded by a lot of white space.
Page | 10
11. FUNDAMENTAL OF GRAPHICS Multimedia for Information Professionals – IMS457 LS
3.0.2 Focal Point
Focal point (or Emphasis) is always a favorite, since it usually the largest element on
the page and is meant to draw the eye into the piece. The focal point, or the part of the
design that is most emphasized, doesn’t have to be a large image or blob on the page.
It can be a large blob, but most times it is more subtle and is placed in the overall
design. Accents are also used, which are also considered supporting focal points.
Accents are not usually as strongly emphasized as the main point, but they support the
focal point and add to the overall effectiveness of the design.
To create focal point or emphasis:
Use a series of evenly spaced, square photographs next to an outlined photograph
with an unusual shape.
Put an important piece of text on a curve or an angle while keeping all of the other
type in straight columns.
Use bold, black type for headings and subheads and much lighter text for all other
text. Place a large picture next to a small bit of text.
Reverse (use white type) a headline out of a black or colored box.
Use colored type or an unusual font for the most important information.
Put lists you want to highlight in a sidebar in a shaded box.
3.0.3 Unity
Unity helps all the elements look like they belong together. Readers need visual cues to let
them know the piece is one unit-the text, headline, photographs, graphic images, and captions
all go together.
Unify elements by grouping elements that are close together so that they look like they
belong together. Repeat color, shape, and texture. Use a grid (the underlying structure of a
page) to establish a framework for margins, columns, spacing, and proportions.
Page | 11
12. FUNDAMENTAL OF GRAPHICS Multimedia for Information Professionals – IMS457 LS
To create unity:
Use only one or two typestyles and vary size or weight for contrast throughout
the publication, presentation, or web site.
Be consistent with the type font, sizes, and styles for headings, subheads,
captions, headers, footers, etc. throughout the publication, presentation, or web
site.
Use the same color palette throughout.
Repeat a color, shape, or texture in different areas throughout.
Choose visuals that share a similar color, theme, or shape.
Line up photographs and text with the same grid lines.
Page | 12
13. FUNDAMENTAL OF GRAPHICS Multimedia for Information Professionals – IMS457 LS
4.0 Category of Graphics
Vector-
Drawn Graphics Bitmaps
Chart 3 : Category of Graphics
4.1 Bitmap
A bitmap is a simple information matrix describing the individual dots that are the smallest
elements of resolution on a computer screen or other display or printing device. In other
words, bitmap are made up of pixels in a grid. A one dimensional matrix is required for
monochrome (black and white); greater depth (more bits of information) is required to
describe more than 16 million colors the picture elements may have, as illustrated in
following figure. The state of all the pixels on a computer screen make the image seen by the
viewer, whether in combinations of black and white or colored pixels in a line of text, a
photograph-like picture, or a simple background pattern.
Picture 6 : A matrix describing the individual dots that are the smallest elements (pixels) of resolution on a computer
screen or printer
Bitmap images are resolution dependent. Resolution refers to the number of pixels in an
image and is usually stated as dpi (dots per inch) or ppi (pixels per inch). Bitmap images are
displayed on your computer screen at screen resolution: approximately 100 ppi. However,
when printing bitmaps, your printer needs much more image data than a monitor. In order to
render a bitmap image accurately, the typical desktop printer needs 150-300 ppi. 4
4
Kazak, Sibel. (2001). Multimedia Images : Vector-based vs. bitmap. Good and bad, 26(1), 1-16.
Page | 13
14. FUNDAMENTAL OF GRAPHICS Multimedia for Information Professionals – IMS457 LS
4.2 Vector Drawn
Vector graphics is the creation of digital images through a sequence of commands or
mathematical statements that place lines and shapes in a given two-dimensional or three-
dimensional space. In physics, a vector is a representation of both a quantity and a direction
at the same time. In vector graphics, the file that results from a graphic artist's work is created
and saved as a sequence of vector statements. A vector file is sometimes called a geometric
file. Most images created with tools such as Adobe Illustrator and CorelDraw are in the form
of vector image files. Vector image files are easier to modify than raster image files (which
can, however, sometimes be reconverted to vector files for further refinement).
Animation images are also usually created as vector files. For example, Shockwave's Flash
product lets you create 2-D and 3-D animations that are sent to a requestor as a vector file and
then rasterized "on the fly" as they arrive.
Vector images have many advantages, but the primary disadvantage is that they're unsuitable
for producing photo-realistic imagery. Vector images are usually made up of solid areas of
color or gradients, but they cannot depict the continuous subtle tones of a photograph. That's
why most of the vector images you see tend to have a cartoon-like appearance.5
No distortion occurs in
when we enlarge the clipart
Distortion occurs in,
Picture 7 : Picture showing the distortion on bitmap image. when we enlarge a bitmap image.
5
Kazak, Sibel. (2001). Multimedia Images : Vector-based vs. bitmap. Good and bad, 26(1), 1-16.
Page | 14
15. FUNDAMENTAL OF GRAPHICS Multimedia for Information Professionals – IMS457 LS
5.0 How Bitmaps and Vector Drawn Images Works?
5.0.1 Where do bitmap come from? How are they made?
Bitmaps objects are described by making a bitmap from scratch with paint or drawing
program. It grabs a bitmap from an active computer screen with a screen capture program,
and then paste into a paint program or your application. Capture a bitmap from a photo,
artwork, or a television image using a scanner or video capture device that digitizes the
image. Once made, a bitmap can be copied, altered, e-mailed, and otherwise used in many
creative ways.
5.0.2 Where do vector come from? How are they made?
Vector-drawn objects are described and drawn to the computer screen using a fraction of the
memory space required to describe and store the same object in bitmap form. A vector is a
line that is described by the location of its two endpoints. A simple rectangle, for example,
might be defined as follows:
RECT 0,0,200,200
“Draw a rectangle starting at 0,0 (upper left corner of screen) going 200 pixels horizontally
right and 300 pixels downward, with a RED boundary and filled with BLUE.”
Page | 15
16. FUNDAMENTAL OF GRAPHICS Multimedia for Information Professionals – IMS457 LS
6.0 Generating Bitmap and Vector Graphics (Still Images)
Still images may be small or large, or even full screen. Whatever their form, still images are
generated by the computer in two ways: as bitmap (or paint graphics) and as vector-drawn (or
just plain drawn) graphics. Bitmaps are used for photo-realistic images and for complex
drawing requiring fine detail. Vector-drawn objects are used for lines, boxes, circles,
polygons, and other graphic shapes that can be mathematically expressed in angles,
coordinates, and distances. A drawn object can be filled with color and patterns, and you can
select it as a single object. Typically, image files are compressed to save memory and disk
space; many image formats already use compression within the file itself – for example, GIF,
JPEG, and PNG. Still images may be the most important element of our multimedia project.
6.0.1 Generating Bitmap
The abilities and feature of image-editing programs for both the Macintosh and Windows
range from simple to complex. The Macintosh does not ship
with a painting tool, and Windows provides only the
rudimentary Paint (see following figure), so you will need to
acquire this very important software separately – often bitmap
editing or painting programs come as part of a bundle when
you purchase your computer, monitor, or scanner.
Capturing and Editing Images
The image that is seen on a computer monitor is digital bitmap
stored in video memory, updated about every 1/60 second or
faster, depending upon monitor’s scan rate. When the images
are assembled for multimedia project, it may often be needed
to capture and store an image directly from screen. It is
possible to use the Prt Scr key available in the keyboard to
capture a image.
Picture 8 : The Windows Paint accessory
provides rudimentary bitmap editing
Page | 16
17. FUNDAMENTAL OF GRAPHICS Multimedia for Information Professionals – IMS457 LS
Scanning Images
After scanning through countless clip art collections, if it is not possible to find the unusual
background you want for a screen about gardening. Open the scan in an image-editing
program and experiment with different filters, the contrast, and various special effects. Be
creative, and don’t be afraid to try strange combinations – sometimes mistakes yield the most
intriguing results.
6.0.2 Generating Vector
Most multimedia authoring systems provide for use of vector-drawn objects such as lines,
rectangles, ovals, polygons, and text. Computer-aided design (CAD) programs have
traditionally used vector-drawn object systems for creating the highly complex and geometric
rendering needed by architects and engineers.
Graphic artists designing for print media use vector-drawn objects because the same
mathematics that put a rectangle on your screen can also place that rectangle on paper
without jaggies. (Jaggies is the informal name for artifacts in raster images, most frequently
from aliasing, which in turn is often caused by non-linear mixing effects producing high-
frequency components and/or missing or poor anti-aliasing filtering prior to sampling).6
This requires the higher resolution of the printer, using a
page description language such as PostScript. Programs
for 3-D animation also use vector-drawn graphics. For
example, the various changes of position, rotation, and
shading of light required to spin the extruded. Vector
graphics editors typically allow rotation, movement,
mirroring, stretching, skewing, affine transformations,
changing of z-order and combination of primitives into
more complex objects. Vector graphics are ideal for
simple or composite drawings that need to be device-
independent, or do not need to achieve photo-realism. For
Picture 9 : Example showing effect of
vector graphics example, the PostScript and PDF page description
languages use a vector graphics model.
6
Don, M. (1998). The antialiasing problem in graphics. London:Ray Tracing.
Page | 17
18. FUNDAMENTAL OF GRAPHICS Multimedia for Information Professionals – IMS457 LS
6.1 Vector-based vs. Bitmap Graphics
As stated above, vector-based images are resolution independent. You can easily resize
vector images to a thumbnail sketch or a billboard-sized graphic. They just keep their
smoothness when resized and do not lose detail and proportion. Smooth curves are easy to
define in vector-based programs and they retain their smoothness and continuity even when
enlarged. You can also change vector-based images into bitmap formats when needed. On the
other hand, bitmap images provide photo-realistic images that require complex color
variations. They are not easily scalable though. The disadvantage of bitmap images comes
when you want to resize the picture. Increasing the size of a bitmap has the effect of
increasing individual pixels, making lines and shapes appear rough and chunky. Reducing the
size of a bitmap also distorts the original image because pixels are removed to reduce the
overall image size. Moreover, since a bitmap image is created as a set of arranged pixels, its
parts cannot be manipulated individually. The following picture (Figure 3) very well
illustrates the difference between vector-based and bitmap images when they are resized.
Vector-based Image Bitmap Image
Picture 10 : Vector-based image vs. Bitmap image when enlarged by 300%: While the vector-based object is scaled
without any loss in quality, the bitmap image has some pixelation (i.e. jaggies seen above).
Another advantage of using vector-based graphics in designing multimedia and
a Web site is smaller file size. It does not take up so much space because they only
contain data about the points, lines, and curves which form the object. However, most of
you probably have come across the problem of slow download speeds for Web graphics,
which are bitmap image formats.
Page | 18
19. FUNDAMENTAL OF GRAPHICS Multimedia for Information Professionals – IMS457 LS
Hence, vector-based images are great for the Web since they can be resized to any proportion
without loosing the quality of the original image and also the files are very small. Therefore,
one disadvantage of vector-based images is that they cannot provide the realism of a
photograph due to the nature of line drawn images. Whereas, bitmap image formats give a
realistic result for representation of the real world, vector-based images can only come as
close as cartoon-style drawings of the objects.7
Bitmap Graphics Vector Graphics
Pixel-based Mathematically based
More realistic images Graphics are not realistic
Bigger file size Small file size
Suffer from distortion problem No distortion problem (can resize
image)
Not easily scalable Easily scalable due to its use of
mathematics formulas
Difficult to convert to vector Can be converted to bitmap image
graphics easily
Table 1 : The advantages and disadvantages of both categories.
7
Kazak, Sibel. (2001). Multimedia Images : Vector-based vs. bitmap. Good and bad, 26(1), 1-16.
Page | 19
20. FUNDAMENTAL OF GRAPHICS Multimedia for Information Professionals – IMS457 LS
7.0 Editing Tools for Graphics
Graphic art software is a subclass of application software used for graphic design, multimedia
development, specialized image development, general image editing, or simply to access
graphic files. Art software uses either raster or vector graphic reading and editing methods to
create, edit, and view art.
Many artists and other creative professionals today use personal computers rather than
traditional media. Using graphic art software may be more efficient than rendering using
traditional media by requiring less hand–eye coordination, requiring less visualization skill,
and utilizing the computer's quicker (sometimes more accurate) automated rendering
functions to create images. However, advanced level computer styles, effects and editing
methods may require a steeper learning curve of computer technical skills than what was
required to learn traditional hand rendering and visualization skills. The potential of the
software to enhance or hinder creativity may depend on the intuitiveness of the interface.
7.0.1 Bitmap Editing Tools.
Popular editing tools for bitmap graphic, as below ;
• Microsoft Paint
• Adobe Photoshop
• Corel Paint Shop Pro
• Corel Photo Paint
• Ulead PhotoImpact
7.0.2 Vector Editing Tools.
Popular editing tools for vector graphic, as below ;
• Adobe Illustrator
• CorelDRAW
• Xara Xtreme
• Serif DrawPlus
Page | 20
21. FUNDAMENTAL OF GRAPHICS Multimedia for Information Professionals – IMS457 LS
8.0 Color
Color is a vital component of multimedia. Management of color is both a subjective and a
technical exercise. Picking the right colors and combinations of colors for our project can
involve many tries until we feel the result is right.
The tools we use to describe color are different when the color is printed than from when it is
projected.
Projected color is additive.
Printed color is subtractive.
The letters of the mnemonic ROY G. BIV, learned by many of us to remember the colors of
the rainbow, are the ascending frequencies of the visible light spectrum: red, orange, yellow,
green, blue, indigo, and violet. Ultraviolet light, on the other hand, is beyond the higher end
of the visible spectrum and can be damaging to humans.
The color white is a noisy mixture of all the color frequencies in the visible spectrum. The
cornea of the eye acts as a lens to focus light rays onto the retina. The light rays stimulate
many thousands of specialized nerves called rods and cones that cover the surface of the
retina. The eye can differentiate among millions of colors, or hues, consisting of combination
of red, green, and blue.
8.0.1 Additive Color
In additive color model, a color is created by combining
colored light sources in three primary colors: red, green
and blue (RGB). This is the process used for a TV or
computer monitor.
Picture 11 : A picture showing Additive Color
Page | 21
22. FUNDAMENTAL OF GRAPHICS Multimedia for Information Professionals – IMS457 LS
8.0.2. Subtractive Color
In subtractive color method, a new color is created
by combining colored media such as paints or ink
that absorb (or subtract) some parts of the color
spectrum of light and reflect the others back to the
eye. Subtractive color is the process used to create
color in printing. The printed page is made up of
tiny halftone dots of three primary colors, cyan,
magenta and yellow (CMY).
Picture 12 : A picture showing Subtractive Color
Page | 22
23. FUNDAMENTAL OF GRAPHICS Multimedia for Information Professionals – IMS457 LS
9.0 Graphics Quality
Did you know that, by creating a circle with vector programs allows you to specify only one
color for the entire circle; but creating a bitmap circle allows you to change the color of every
pixel in the circle. Thus the bitmap can be more photorealistic. The trade-off is that bitmap
graphic files are larger than vector files. File size is a function of the image size, color depth
and the resolution.
Graphics quality can be determined by evaluating the aspects below:
Image Size Color Depth Resolutions
Figure 1 : Determining the quality of graphics
9.0.1 Image Size
Image size refers to the height and width of the image, measured in inches, centimeters, dots,
or any other unit of measure. Image size is a little tricky to grasp due to the fact that the
resolution of an image can vary. For example, it is not of much help to know that an image is
3 by 5 inches if you do not know how many dots per inch make up the image. And, an image
of 3 by 5 inches at 100 dots per inch contains the same
amount of image data as does an image of 6 by 10
inches at 50 dots per inch.
Alternatively, if the image size is measured in dots or
pixels, then you know exactly how much image data
exists because a 300 pixel by 500 pixel image contains
15,000 pixels no matter how many pixels you designate
per inch.
Picture 13 : The illustration on image sizes.
Page | 23
24. FUNDAMENTAL OF GRAPHICS Multimedia for Information Professionals – IMS457 LS
9.0.2 Color Depth
Color depth / bit depth is the range of colors available for pixels. We are essentially referring
to how many different colors can exist within a particular image. An image with the
shallowest (to use a non-technical term) color depth can contain only two different colors.
Those two colors, however, can be chosen from a master color set of over 16 million colors.
The actual colors that are used within an image make up the color palette for that image. For
instance, an image of the shallowest color depth could have a palette of orange and blue.
Therefore, every dot in the image would either be orange, or blue.
2 16
256 16.7 Million
Picture 14 : Color Depth
Page | 24
25. FUNDAMENTAL OF GRAPHICS Multimedia for Information Professionals – IMS457 LS
9.0.3 Resolutions
You can think of a bitmapped image as a piece of graph paper, of any size, that has had each
square filled in by a color. In computer jargon, the squares are called dots or pixels. The term
pixel was derived from the term picture element. The resolution of the image refers to the
number of dots per inch (dpi) there are in the image. For example, the resolution of an image
could be 100 dpi.
Resolution can vary, and may initially be determined by the hardware used to digitize an
image. Resolution can be decreased, but not without losing image detail. The resolution of an
image can also be increased, but to do so the computer just guesses at what the added
resolution data should look like. This technique is called interpolation. Resolution can really
only be increased by redigitizing the image at a higher resolution. Beware! Some digitizers,
especially flatbed scanners, claim high scanning resolutions that are actually achieved
through interpolation.
72 dpi graphic The same image after
being reduced to 36 dpi
Picture 15 : The sample on resolutions.
Page | 25
26. FUNDAMENTAL OF GRAPHICS Multimedia for Information Professionals – IMS457 LS
10.0 Image File Format for Graphics
Image file formats are standardized means of organizing and storing digital images. Image
files are composed of either pixels, vector (geometric) data, or a combination of the two.
Whatever the format, the files are rasterized to pixels when displayed on most graphic
displays. The pixels that constitute an image are ordered as a grid (columns and rows); each
pixel consists of numbers representing magnitudes of brightness and color.
Table 2 : Well known and various of file format available.
Microsoft Windows DIB .bmp .dib .rle
Microsoft Palette .pal
Autocad format 2D .dxf
Apple Macintosh .pict .pic .pct
Windows Meta file .wmf
Table 3 : Other available file formats.8
8
Parker, R. (1998). Looking Good in Print. Scottsdale, AZ: Coriolis Creative Professionals Press.
Page | 26
27. FUNDAMENTAL OF GRAPHICS Multimedia for Information Professionals – IMS457 LS
10.1 Types of format
10.1.1 TIFF
Versatility and compatibility make the TIFF image format the optimum choice for
almost any project. It works on both the Mac and PC platforms, supports almost any
picture bit depth, and allows various forms of compression.
This flexibility also makes the TIFF format a Pandora's box. There are so many
versions and types of compression for the TIFF file format that no current system can
decode all of them. Furthermore, there's no way to tell how a TIFF will behave until
you attempt to manipulate it. Try to use LZW compression or no compression at all
for best results.
10.1.2 JPG
Because of its good image quality and compression, the JPEG file format is becoming
increasingly popular in desktop publishing. (QuarkXPress has added a JPEG import
filter in XPress 3.3.) Developed by the Joint Photographic Experts Group, the JPEG
format is expected to become an international standard for encoding digitized
photographs. JPEG's major difference from all other current file formats is that it uses
Lossy compression.
Even though JPEG is relatively new, a second format already exists-JFIF is a new
TIFF subformat that embeds a JPEG image into a TIFF file. The JFIF file format has
yet to become popular because it's much more complex without offering more
capability.
10.1.3 GIF
The GIF file format uses a relatively basic form of file compression (Lempel Zev
Welch, or LZW) that squeezes out inefficiencies in the data storage without losing
data or distorting the image. The LZW compression scheme is best at compressing
images with large fields of homogeneous color. It is less efficient at compressing
complicated pictures with many colors and complex textures
Page | 27
28. FUNDAMENTAL OF GRAPHICS Multimedia for Information Professionals – IMS457 LS
10.1.4 BMP
The BMP file format is available in almost all Windows-based graphics applications,
although it's primarily used in Windows application development.
10.1.5 PNG
Because of its high compression rate (unsurpassed among ``lossless'' formats -- lossy
JPEG is better for photos) PNG is the standard file format that online services use for
storing 1- to 8-bit images, succeeding GIF (which is a proprietary format and thus
increasingly discarded).
10.1.6 PSD
This is the native Photoshop file format created by Adobe. In this format, you can
save multiple alpha channels and paths along with your primary image. You can't
import this format directly into most desktop publishing applications. 9
9
Parker, R. (1998). Looking Good in Print. Scottsdale, AZ: Coriolis Creative Professionals Press.
Page | 28
29. FUNDAMENTAL OF GRAPHICS Multimedia for Information Professionals – IMS457 LS
11.0 Hardware Used To Acquire Graphics.
11.0.1 Scanners and digital imaging products.
Image / Graphics Scanner often abbreviated to just scanner—is a device that optically scans
images, printed text, handwriting, or an object, and converts it to a image. It is Important to
check the optical resolution of the scanner- measured in dots per inch (DPI)
Many forms of scanner
Drum
Flat-bed
Negative / slide
Hand-held
11.0.2 Digital Camera
A digital camera (or digicam) is a camera that takes
video or still photographs, or both, digitally by
recording images via an electronic image sensor. It is
the main device used in the field of digital photography.
Digital cameras can do things film cameras cannot:
displaying images on a screen immediately after they
are recorded, storing thousands of images on a single
small memory device, and deleting images to free
storage space. The majority, including most compact
cameras, can record moving video with sound as well as
still photographs. Some can crop and stitch pictures and perform other elementary image
editing. It uses digital memory instead of film. Images are transferred to computer via a cable
and it can be very high resolution
Page | 29
30. FUNDAMENTAL OF GRAPHICS Multimedia for Information Professionals – IMS457 LS
11.0.3 Graphic Tablet and Pen
A graphics tablet (or digitizer, digitizing tablet,
graphics pad, drawing tablet) is a computer input
device that enables a user to hand-draw images and
graphics, similar to the way a person draws images
with a pencil and paper. These tablets may also be
used to capture data or handwritten signatures. It can
also be used to trace an image from a piece of paper
which is taped or otherwise secured to the surface.
Capturing data in this way, either by tracing or
entering the corners of linear poly-lines or shapes is
called digitizing.10
10
Anonymous. (n.d.). CEMCA. In Hardware and Software for Multimedia Development. Retrieved October 22, 2011, from http://www.cemca.org/EMHandbook/Section3.pdf .
Page | 30
31. FUNDAMENTAL OF GRAPHICS Multimedia for Information Professionals – IMS457 LS
12.0 Conclusion
Graphics are required in our everyday’s life. The strong meaning of graphic stimulates a
person to reach at the same moment. All over the world, graphic are being designed by the
millions of graphic designers to attract people and increase the sales of a business activity.
To make a graphic really attractive and adorable, proper arrangement of graphics needs to be
done. A graphic becomes meaningful when it defines the text given below properly and
images to produce a coherent and interesting piece of work, according to the end goal.
In the multimedia presentation, graphics will help in improving the look of the layout of a
projector, attract the viewers, convey the message of the project and stimulate their senses
effectively. As simple it may seem, it is lot of hard work. Fonts, color, size and arrangement
of text and graphics are re-looked at and sent for proofreading. Graphic also need to take care
of the things including its balance, color, contrast, emphasis, movement, pattern, proportion,
proximity, repetition, rhythm, texture, unity, and white space. In this growing world, the
scope of graphic designing has changed a lot. Latest technologies have created new means in
this area and new developments can be seen. Now, with the usage of new software and
printing technologies, graphic generating has become more .flexible and practical. Graphic
have become an essential part of any multimedia designing. So, if you want to design a
customized multimedia that states your needs and requirements, make sure you keep the
graphics as per the demands so that it will benefit your business needs.
Finally, you need to decide what image format should be used in order to make your project
better. As discussed above, you may consider what features of images will meet the needs of
your project. If you want photo-realistic images, then the solution will be the use of bitmaps.
However, if the download speed of graphics is important for you and your audience and the
graphics are supposed to be resized and manipulated, then you should consider vector-based
formats.
A suggestion, try everything in the areas of design elements and principles to hone skills. We
can always take away things from multimedia elements to make it more effective, but that
takes practice too. There are many great multmedia design books that can guide the user
through the process and really make it easier. Examples of good design are always important
so we can see what has been done and what has been done effectively.
Page | 31
32. FUNDAMENTAL OF GRAPHICS Multimedia for Information Professionals – IMS457 LS
13.0 References
Vaughn, T. (1998). Multimedia: Making It Work. (4th ed.). New York: Osborne-McGraw
Hill.
Ulrich, T. (2001, September 22). Linking business coverage with graphics. Designer, 150,
30-33.
Kazak, Sibel. (2001). Multimedia Images : Vector-based vs. bitmap. Good and bad, 26(1), 1-
16.
Anonymous. (n.d.). CEMCA. In Hardware and Software for Multimedia Development.
Retrieved October 22, 2011, from http://www.cemca.org/EMHandbook/Section3.pdf.
Don, M. (1998). The antialiasing problem in graphics. London:Ray Tracing.
Valencia, R. R. (1999). Dealing with Multimedia-Colors. Washington, DC: American
Technology Association.
Bergmann, P. G. (1998). Colours. In The new encyclopedia britannica (Vol. 26, pp. 501-
508). Chicago, IL: Encyclopedia Britannica.
Parker, R. (1998). Looking Good in Print. Scottsdale, AZ: Coriolis Creative Professionals
Press.
Siebert, L. and Ballard, L. (1992). Making a Good Layout. Cincinnati, OH: North Light
Books.
Page | 32