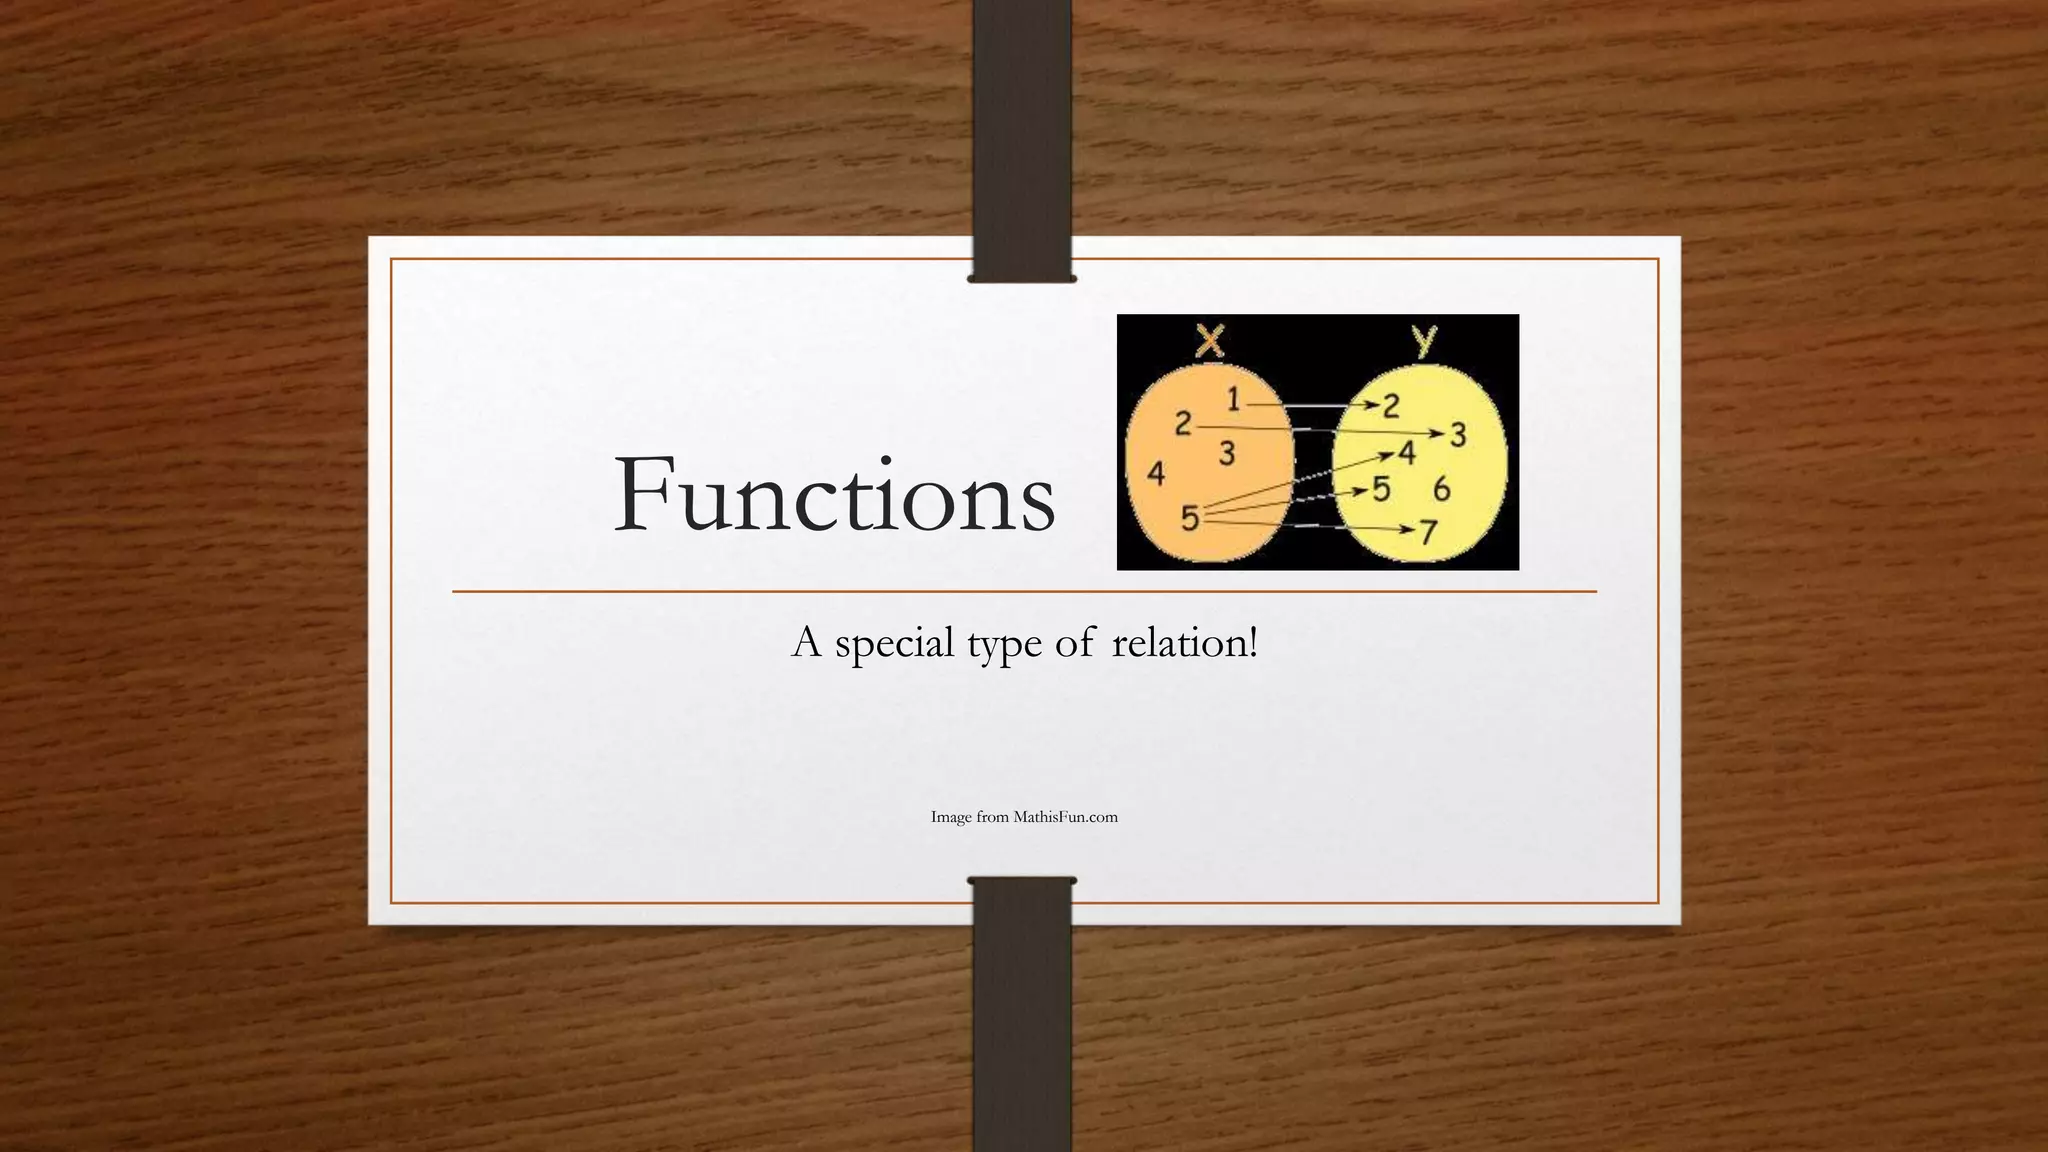
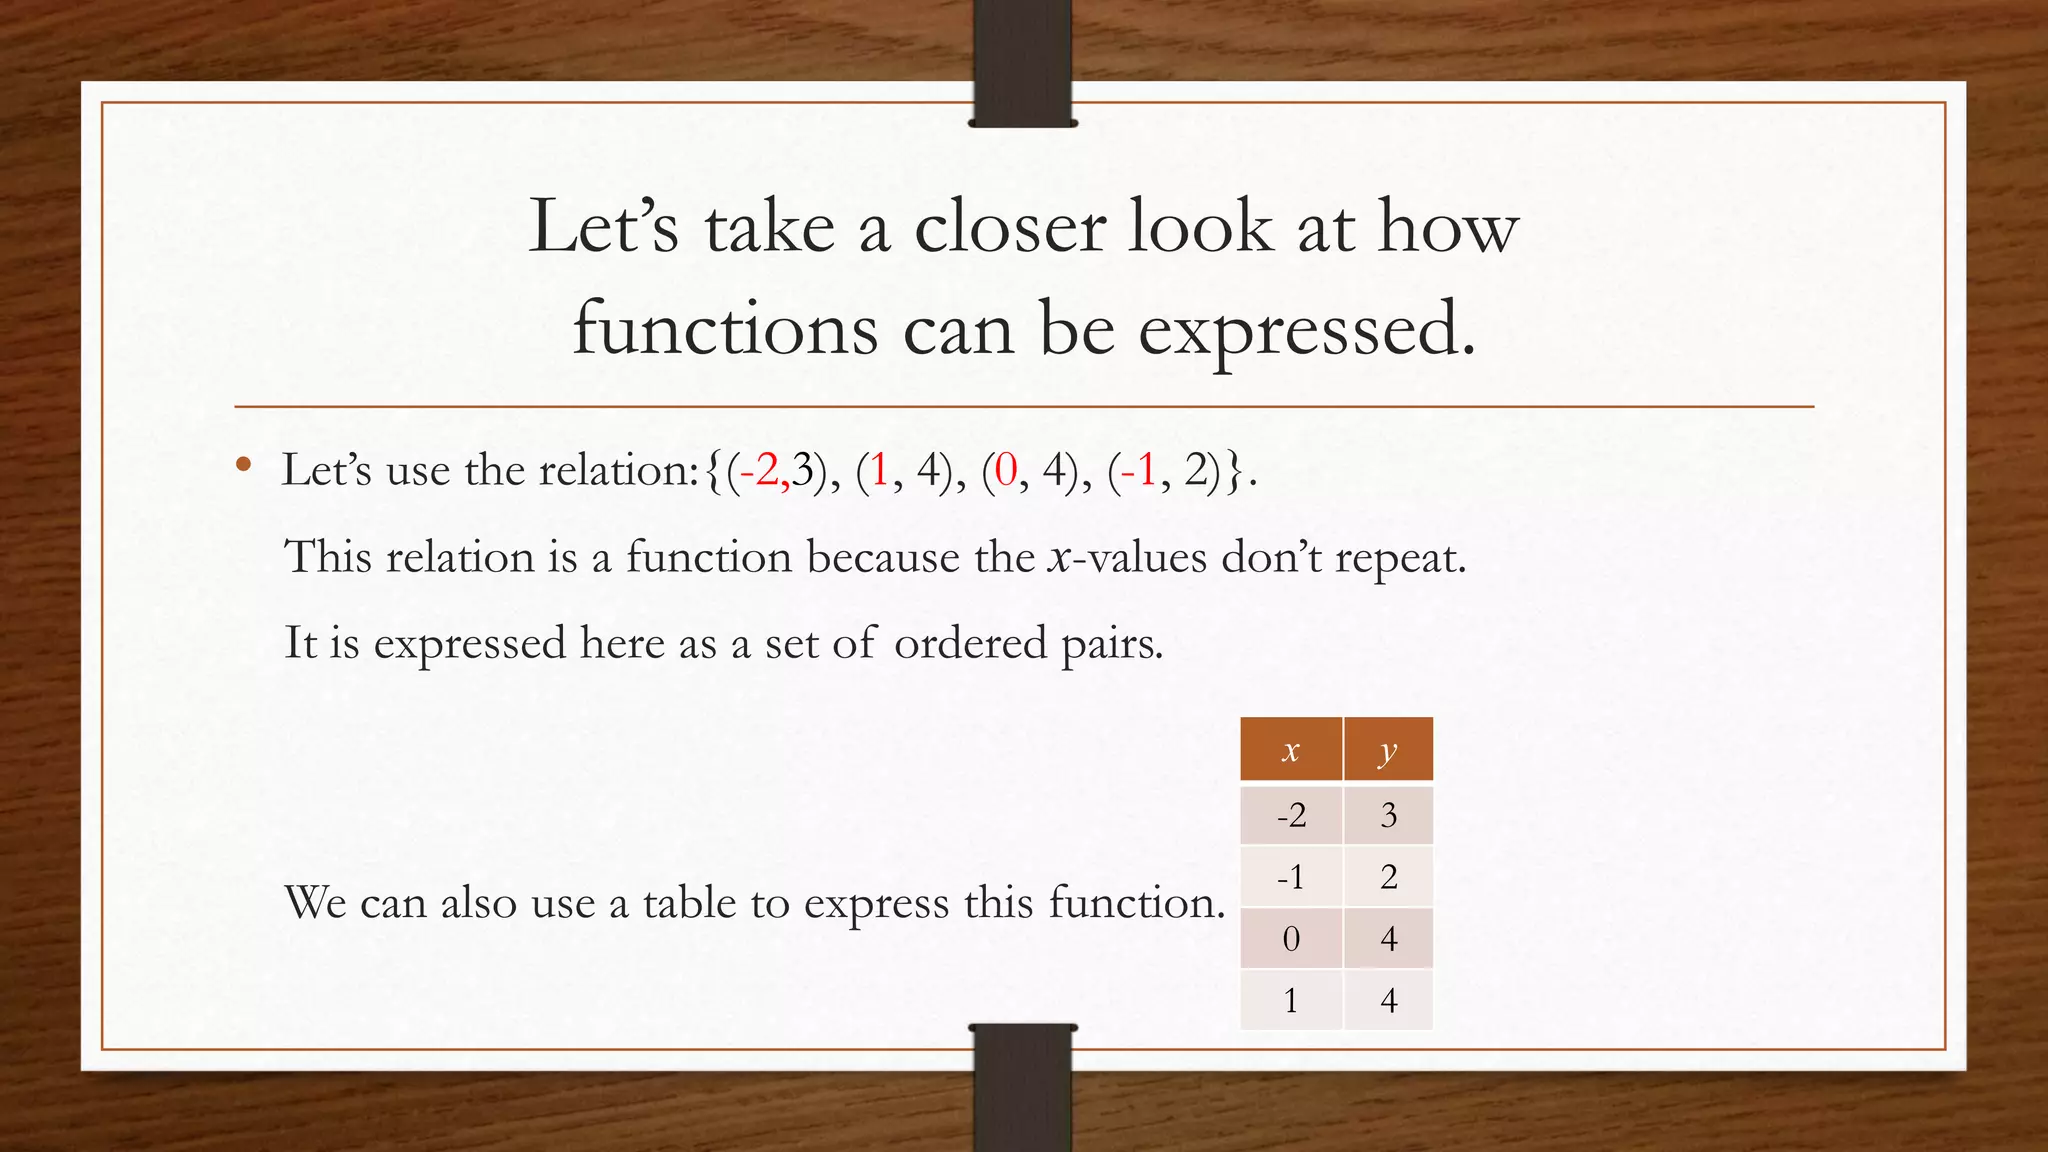
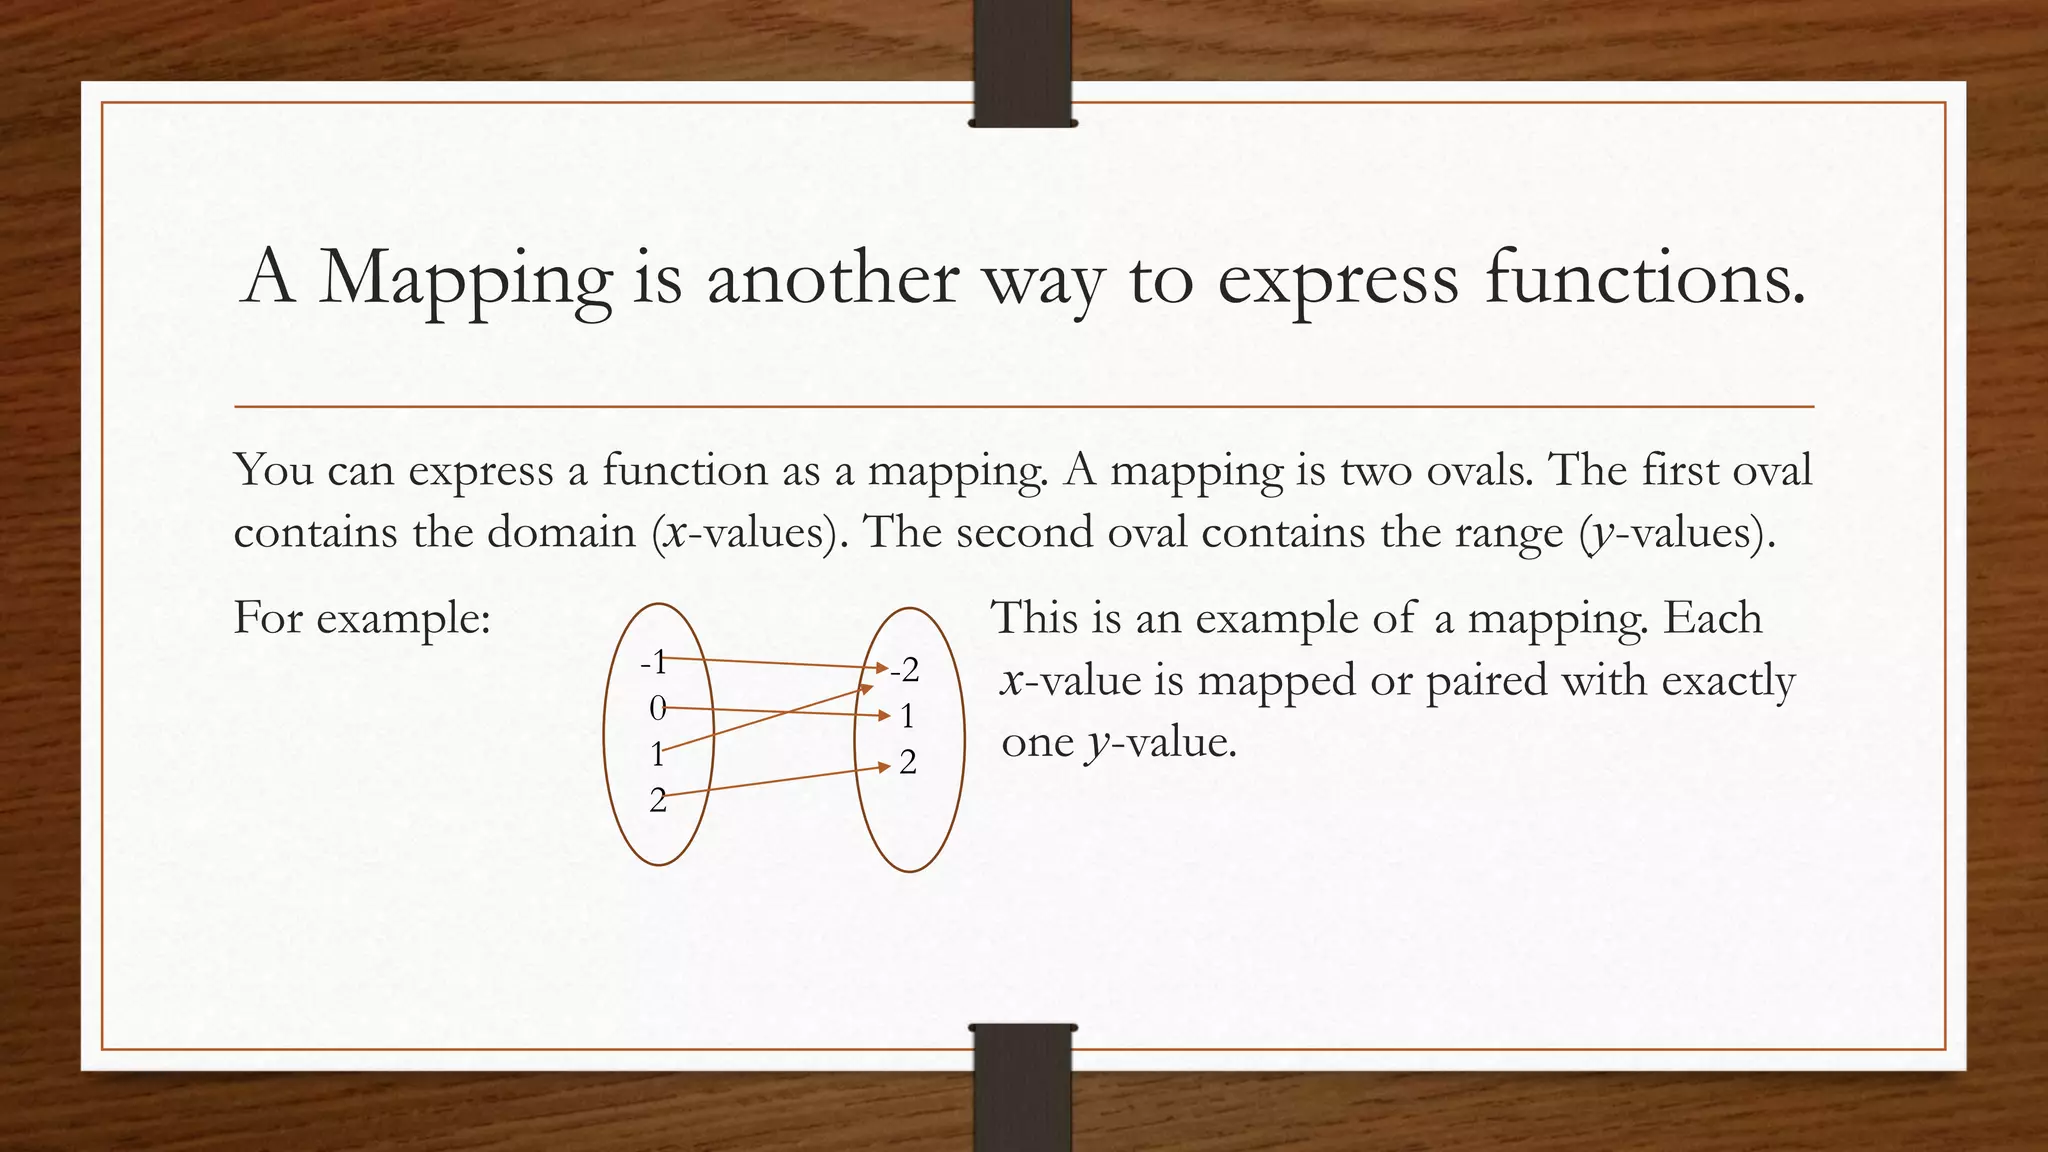
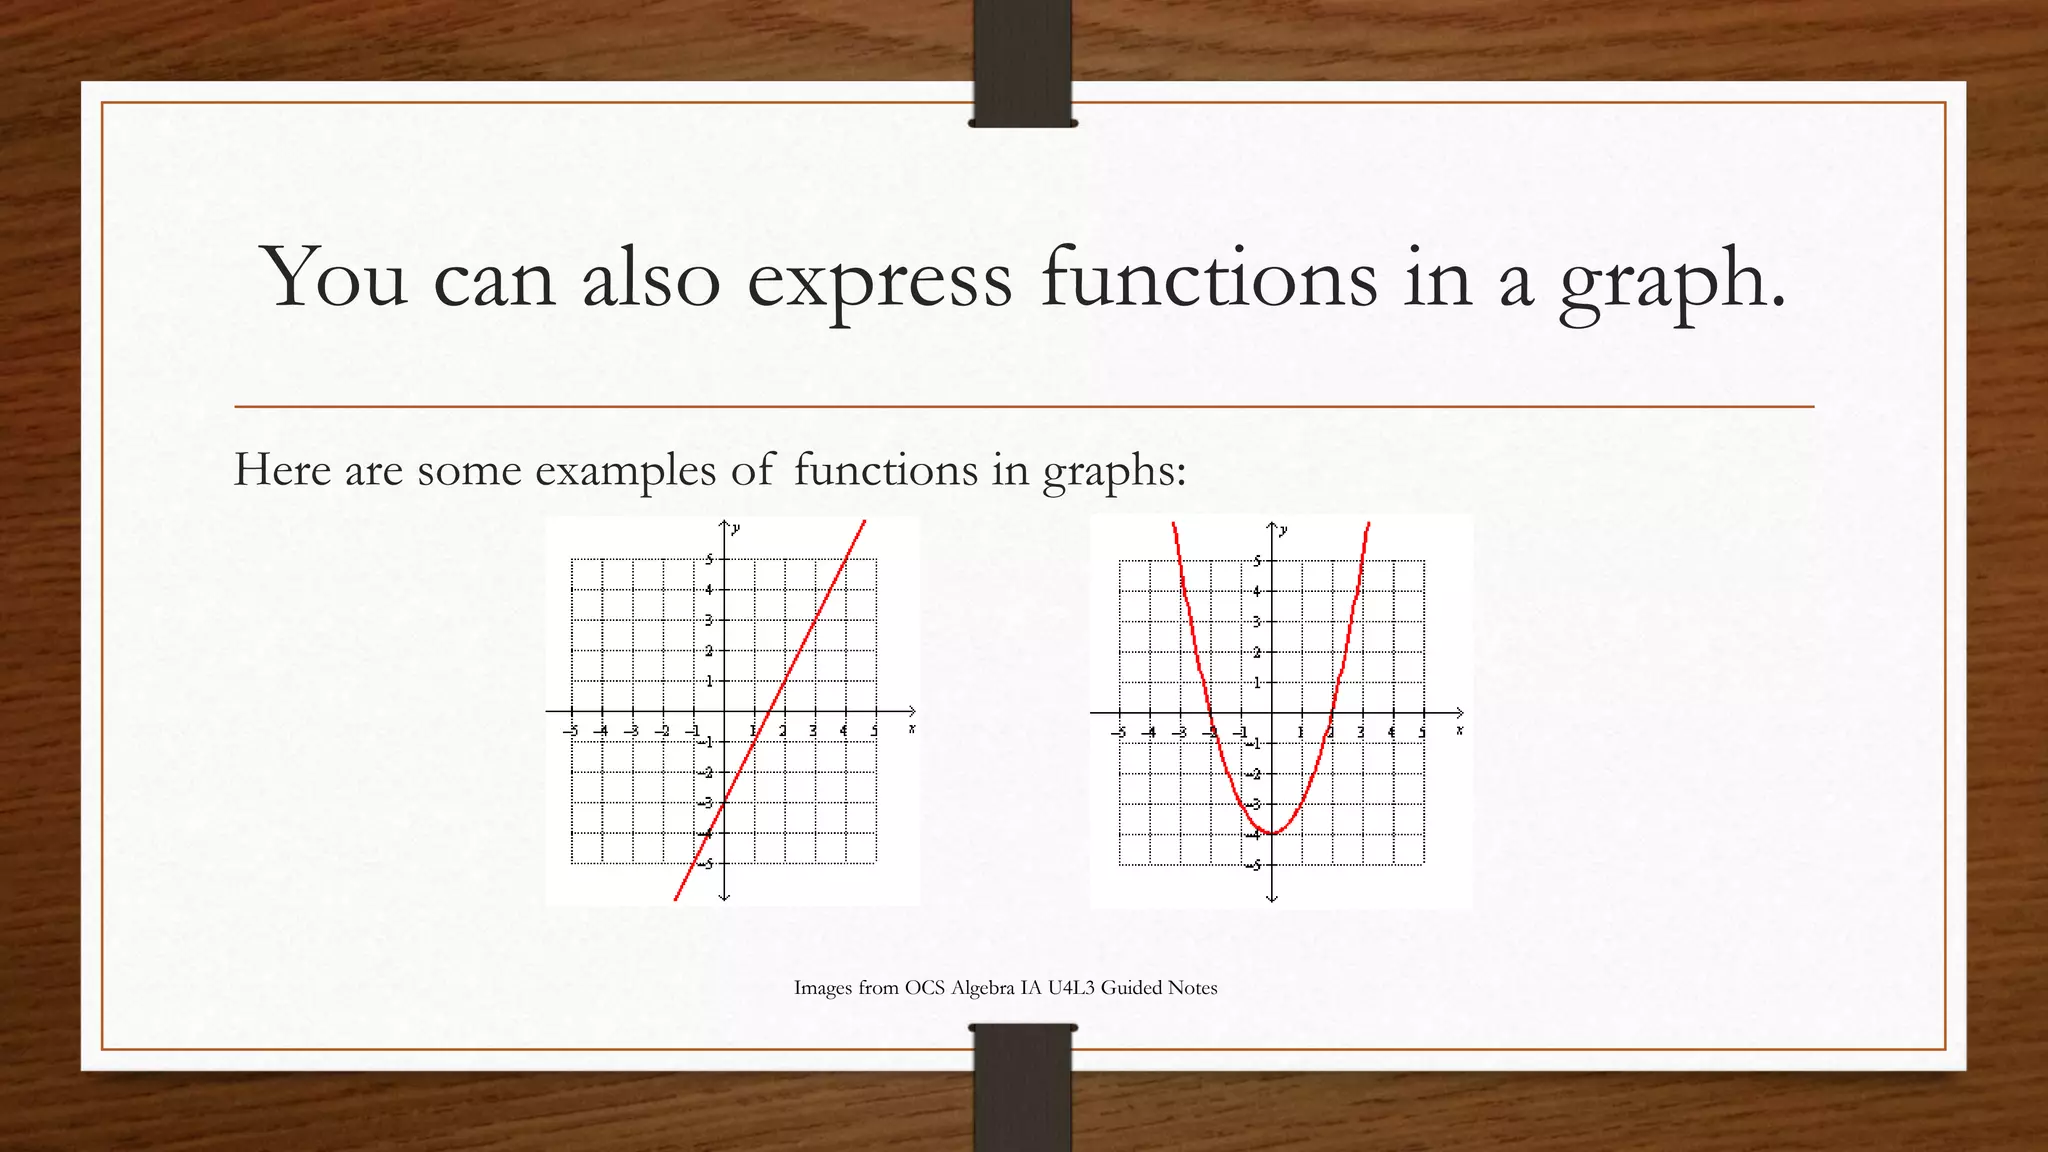
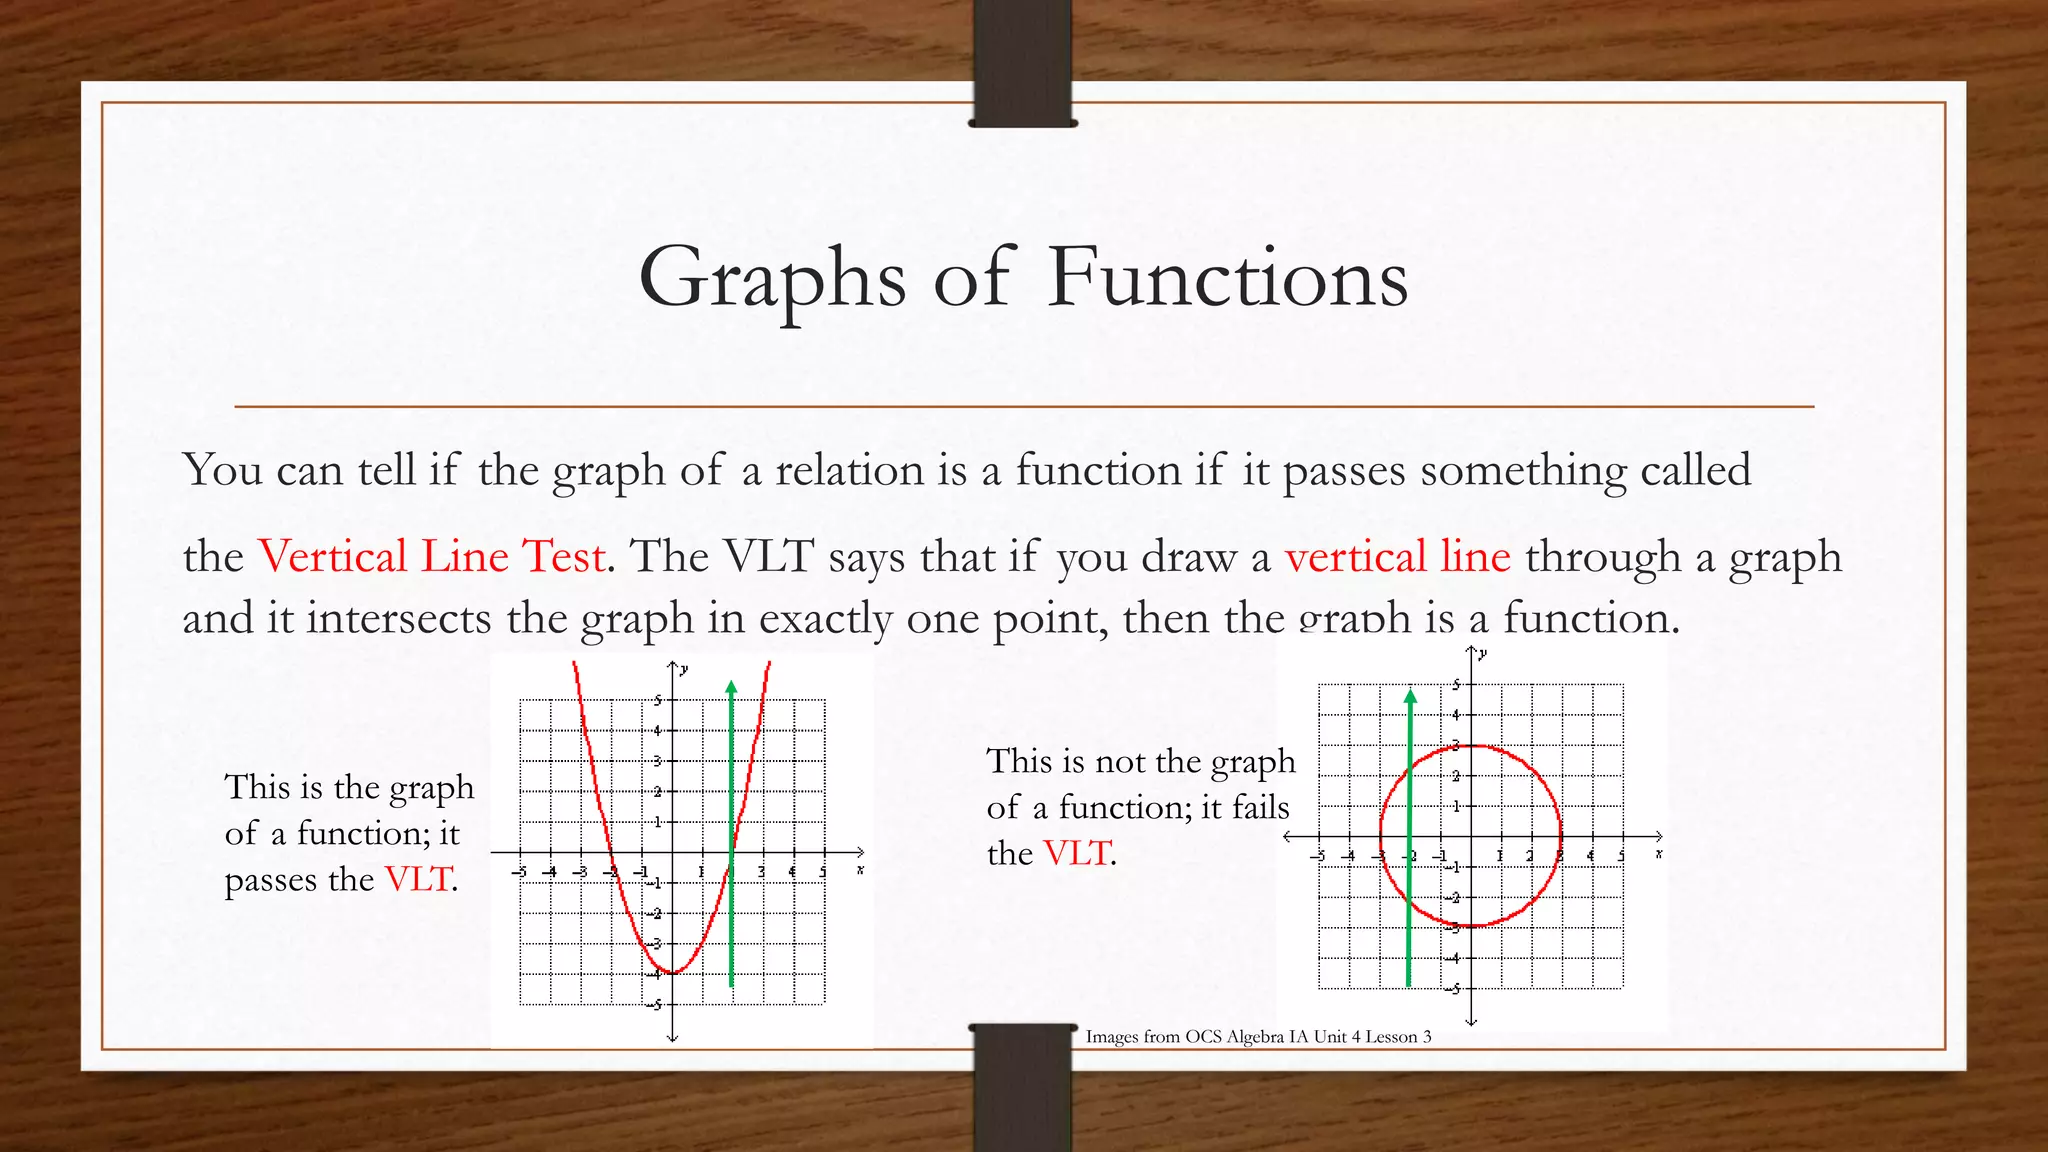
2. Let’s review relations!
• A relation is a set of ordered pairs. {(1,2), (2,-3), (-2,4), (-1,0)} is an example
of a relation.
• The x-values in each coordinate make up what is referred to as the domain.
{-2, -1, 1, 2} is the domain of the relation.
• The y-values in each coordinate make up what is referred to as the range.
{-3, 0, 2, 4} is the range of the relation.
3. So What Are Functions?
•
•
•
•
•
Functions are relations, so they are sets of ordered pairs!
What makes them special is that the x-values don’t repeat!
Each x-value is paired with exactly one y-value.
There are many ways to express functions.
They can be expressed as ordered pairs, in tables, in a graph, or as a mapping.
4. Let’s take a closer look at how
functions can be expressed.
• Let’s use the relation:{(-2,3), (1, 4), (0, 4), (-1, 2)}.
This relation is a function because the x-values don’t repeat.
It is expressed here as a set of ordered pairs.
x
-2
We can also use a table to express this function.
y
3
-1
2
0
4
1
4
5. A Mapping is another way to express functions.
You can express a function as a mapping. A mapping is two ovals. The first oval
contains the domain (x-values). The second oval contains the range (y-values).
For example:
-1
0
1
2
-2
1
2
This is an example of a mapping. Each
x-value is mapped or paired with exactly
one y-value.
6. You can also express functions in a graph.
Here are some examples of functions in graphs:
Images from OCS Algebra IA U4L3 Guided Notes
7. Graphs of Functions
You can tell if the graph of a relation is a function if it passes something called
the Vertical Line Test. The VLT says that if you draw a vertical line through a graph
and it intersects the graph in exactly one point, then the graph is a function.
This is the graph
of a function; it
passes the VLT.
This is not the graph
of a function; it fails
the VLT.
Images from OCS Algebra IA Unit 4 Lesson 3