UNIT 1 Overview
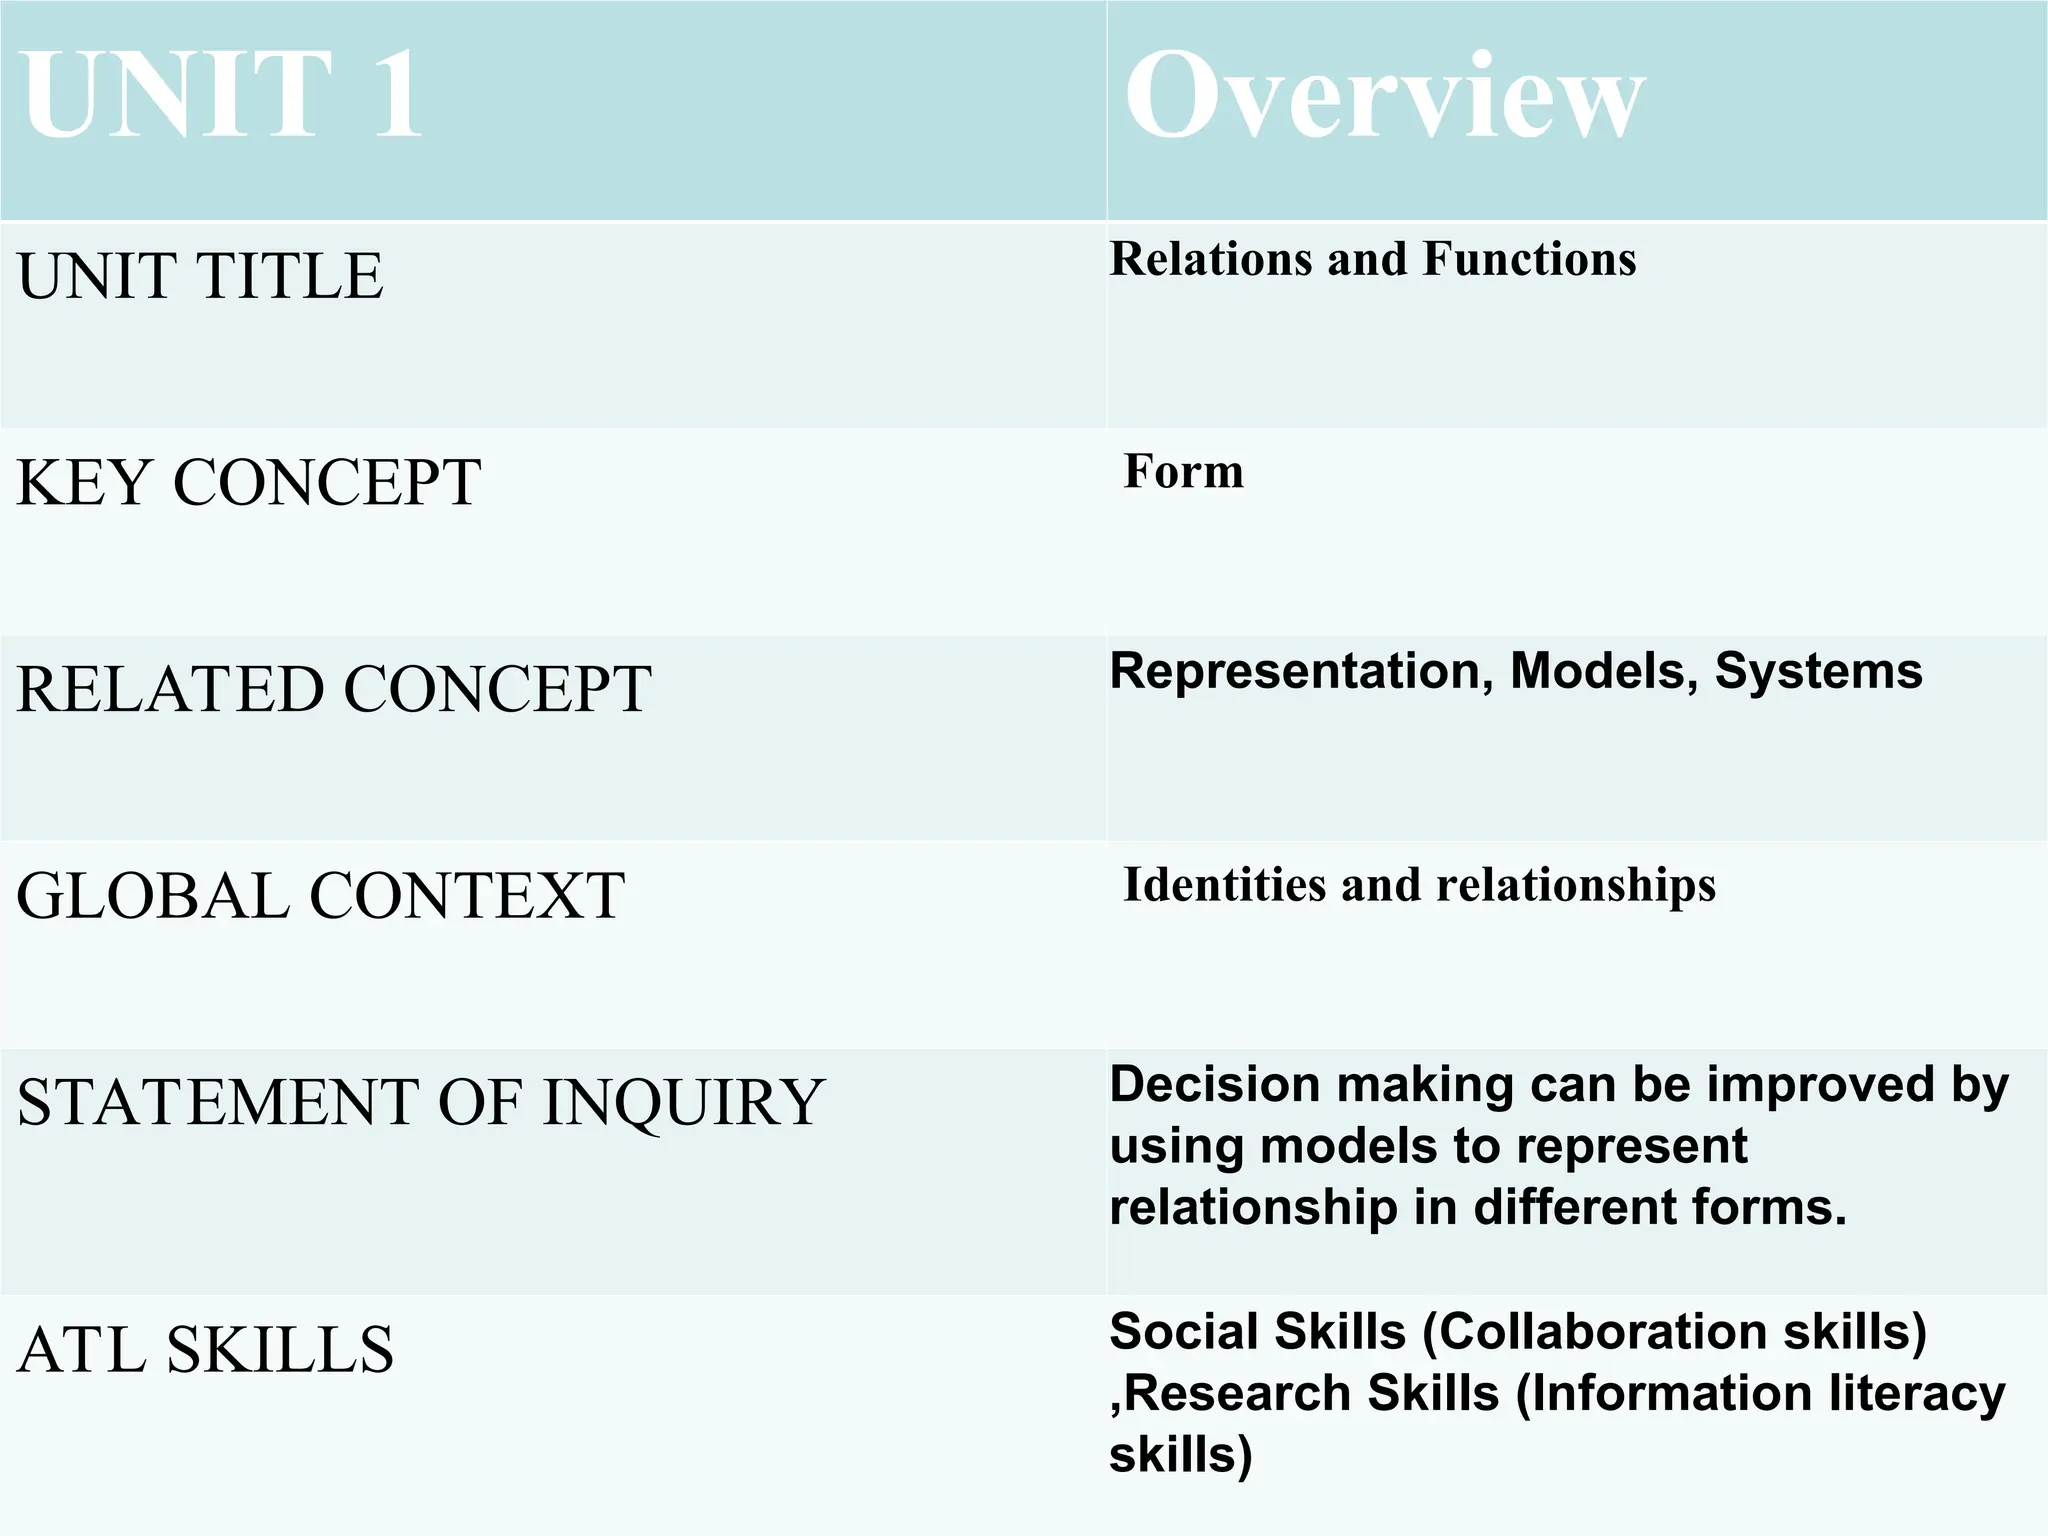
UNITTITLE Relations and Functions
KEY CONCEPT Form
RELATED CONCEPT Representation, Models, Systems
GLOBAL CONTEXT Identities and relationships
STATEMENT OF INQUIRY Decision making can be improved by
using models to represent
relationship in different forms.
ATL SKILLS Social Skills (Collaboration skills)
,Research Skills (Information literacy
skills)
3.
Animal
Average
Lifetime
(years)
Maximum
Lifetime
(years)
Cat 12 28
Cow15 30
Deer 8 20
Dog 12 20
Horse 20 50
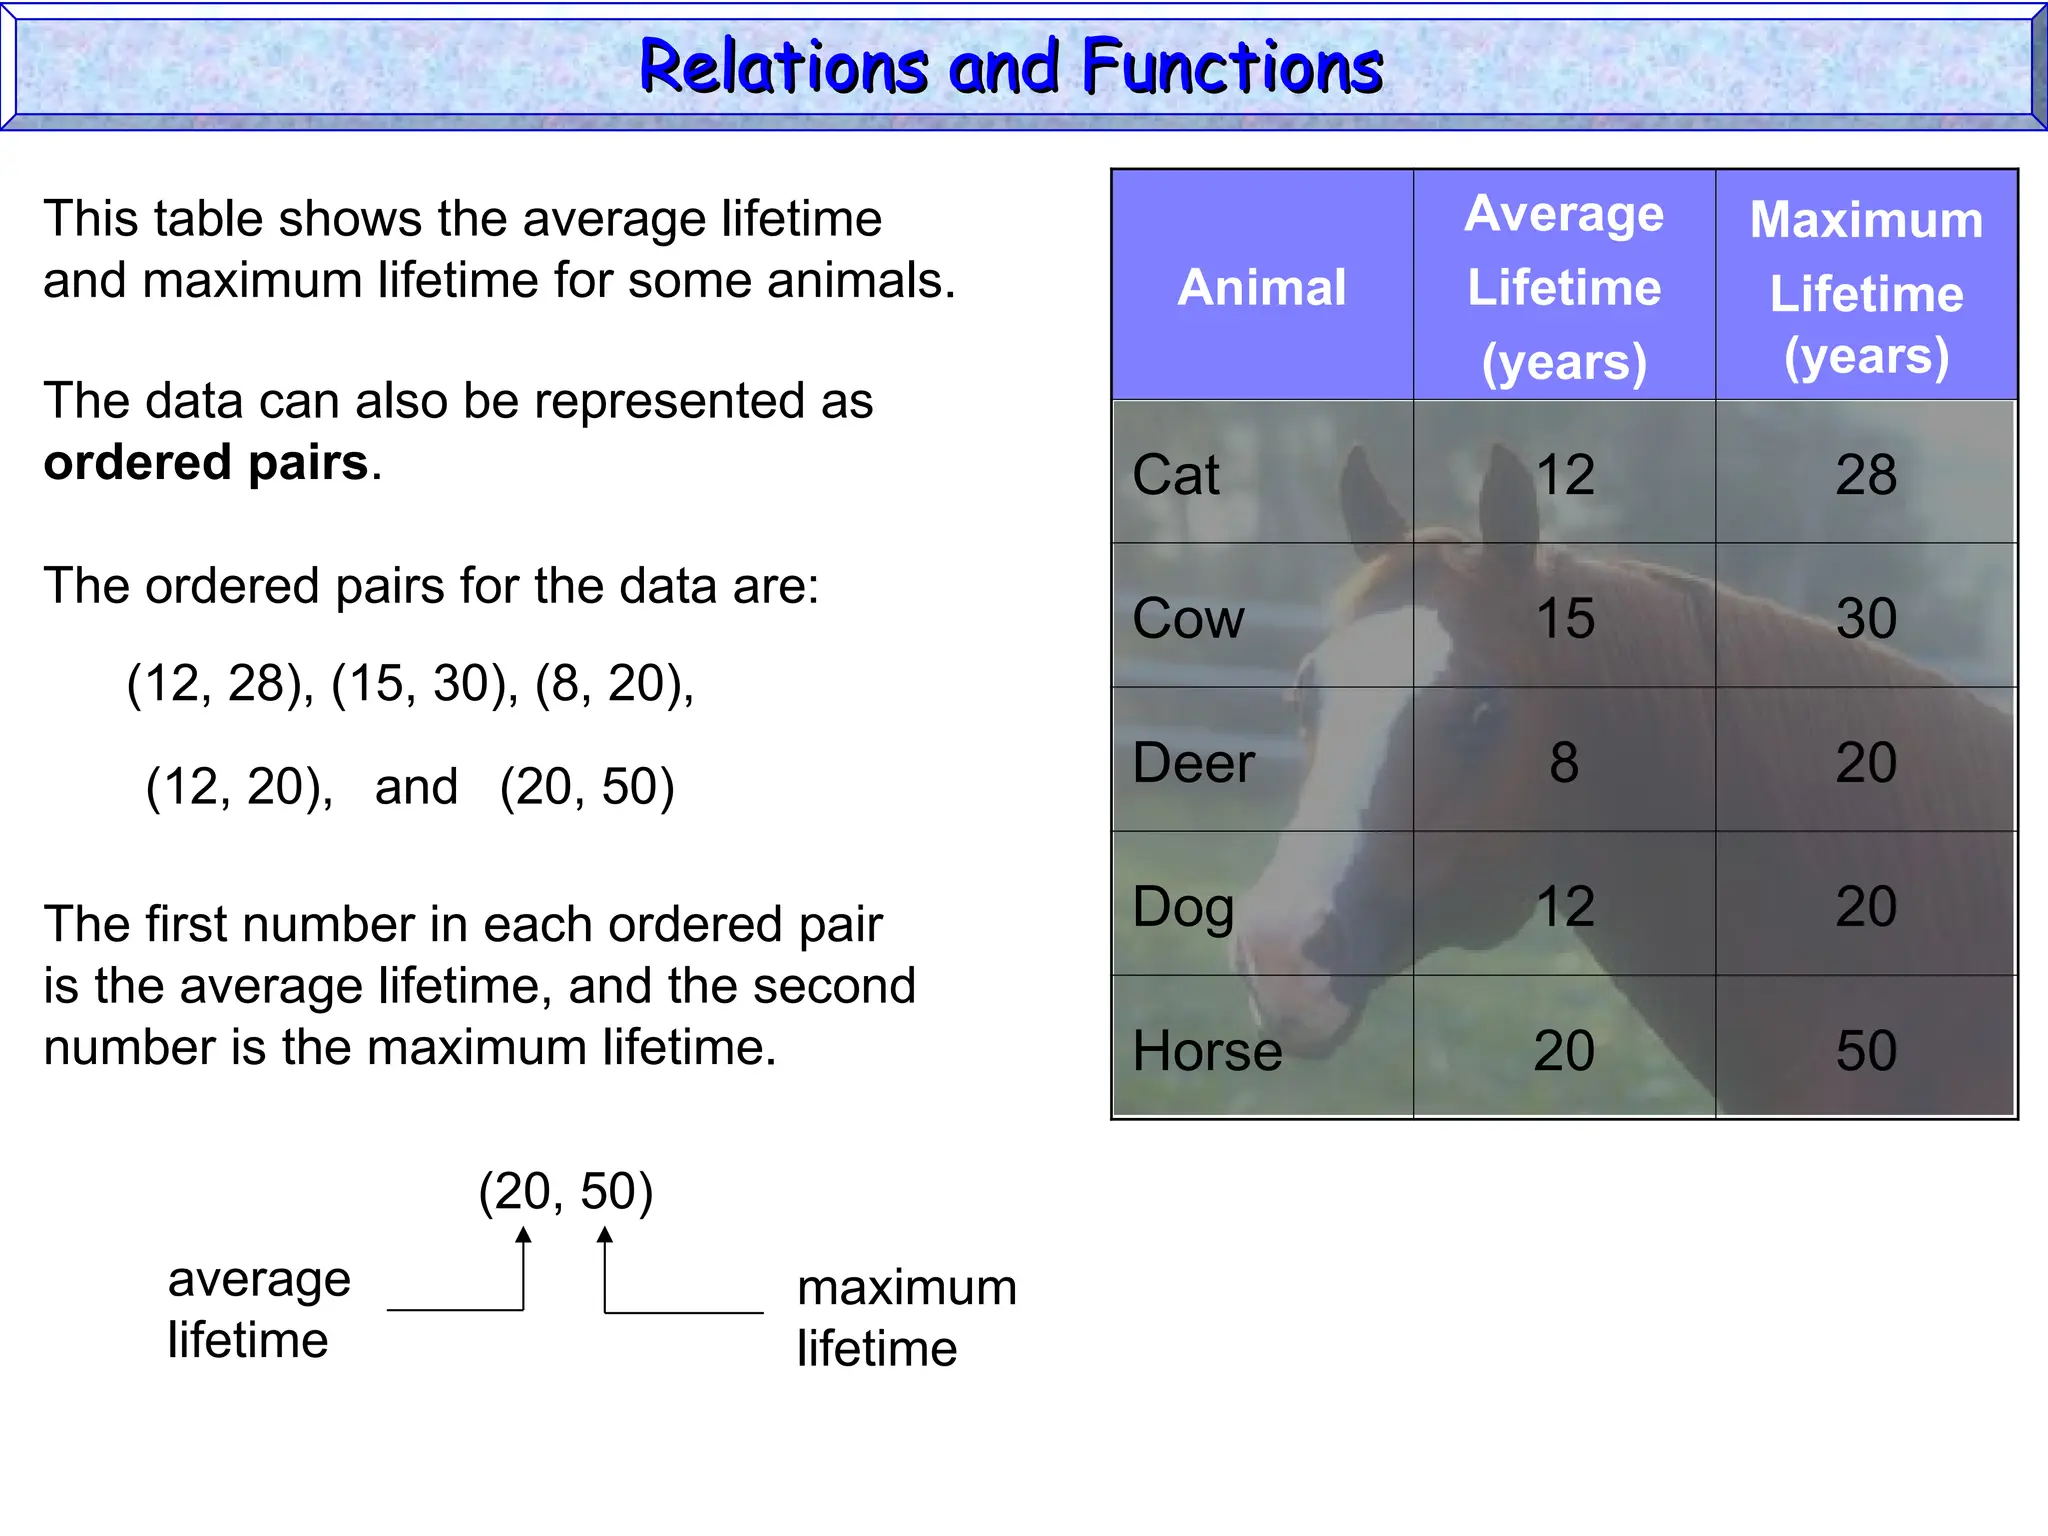
This table shows the average lifetime
and maximum lifetime for some animals.
The data can also be represented as
ordered pairs.
The ordered pairs for the data are:
(12, 28), (15, 30), (8, 20),
(12, 20), (20, 50)
and
The first number in each ordered pair
is the average lifetime, and the second
number is the maximum lifetime.
(20, 50)
average
lifetime
maximum
lifetime
Relations and Functions
Relations and Functions
4.
Animal Lifetimes
y
x
30
10 2030
60
20
40
60
5 25
10
50
15
30
0
0
Average Lifetime
Maximum
Lifetime
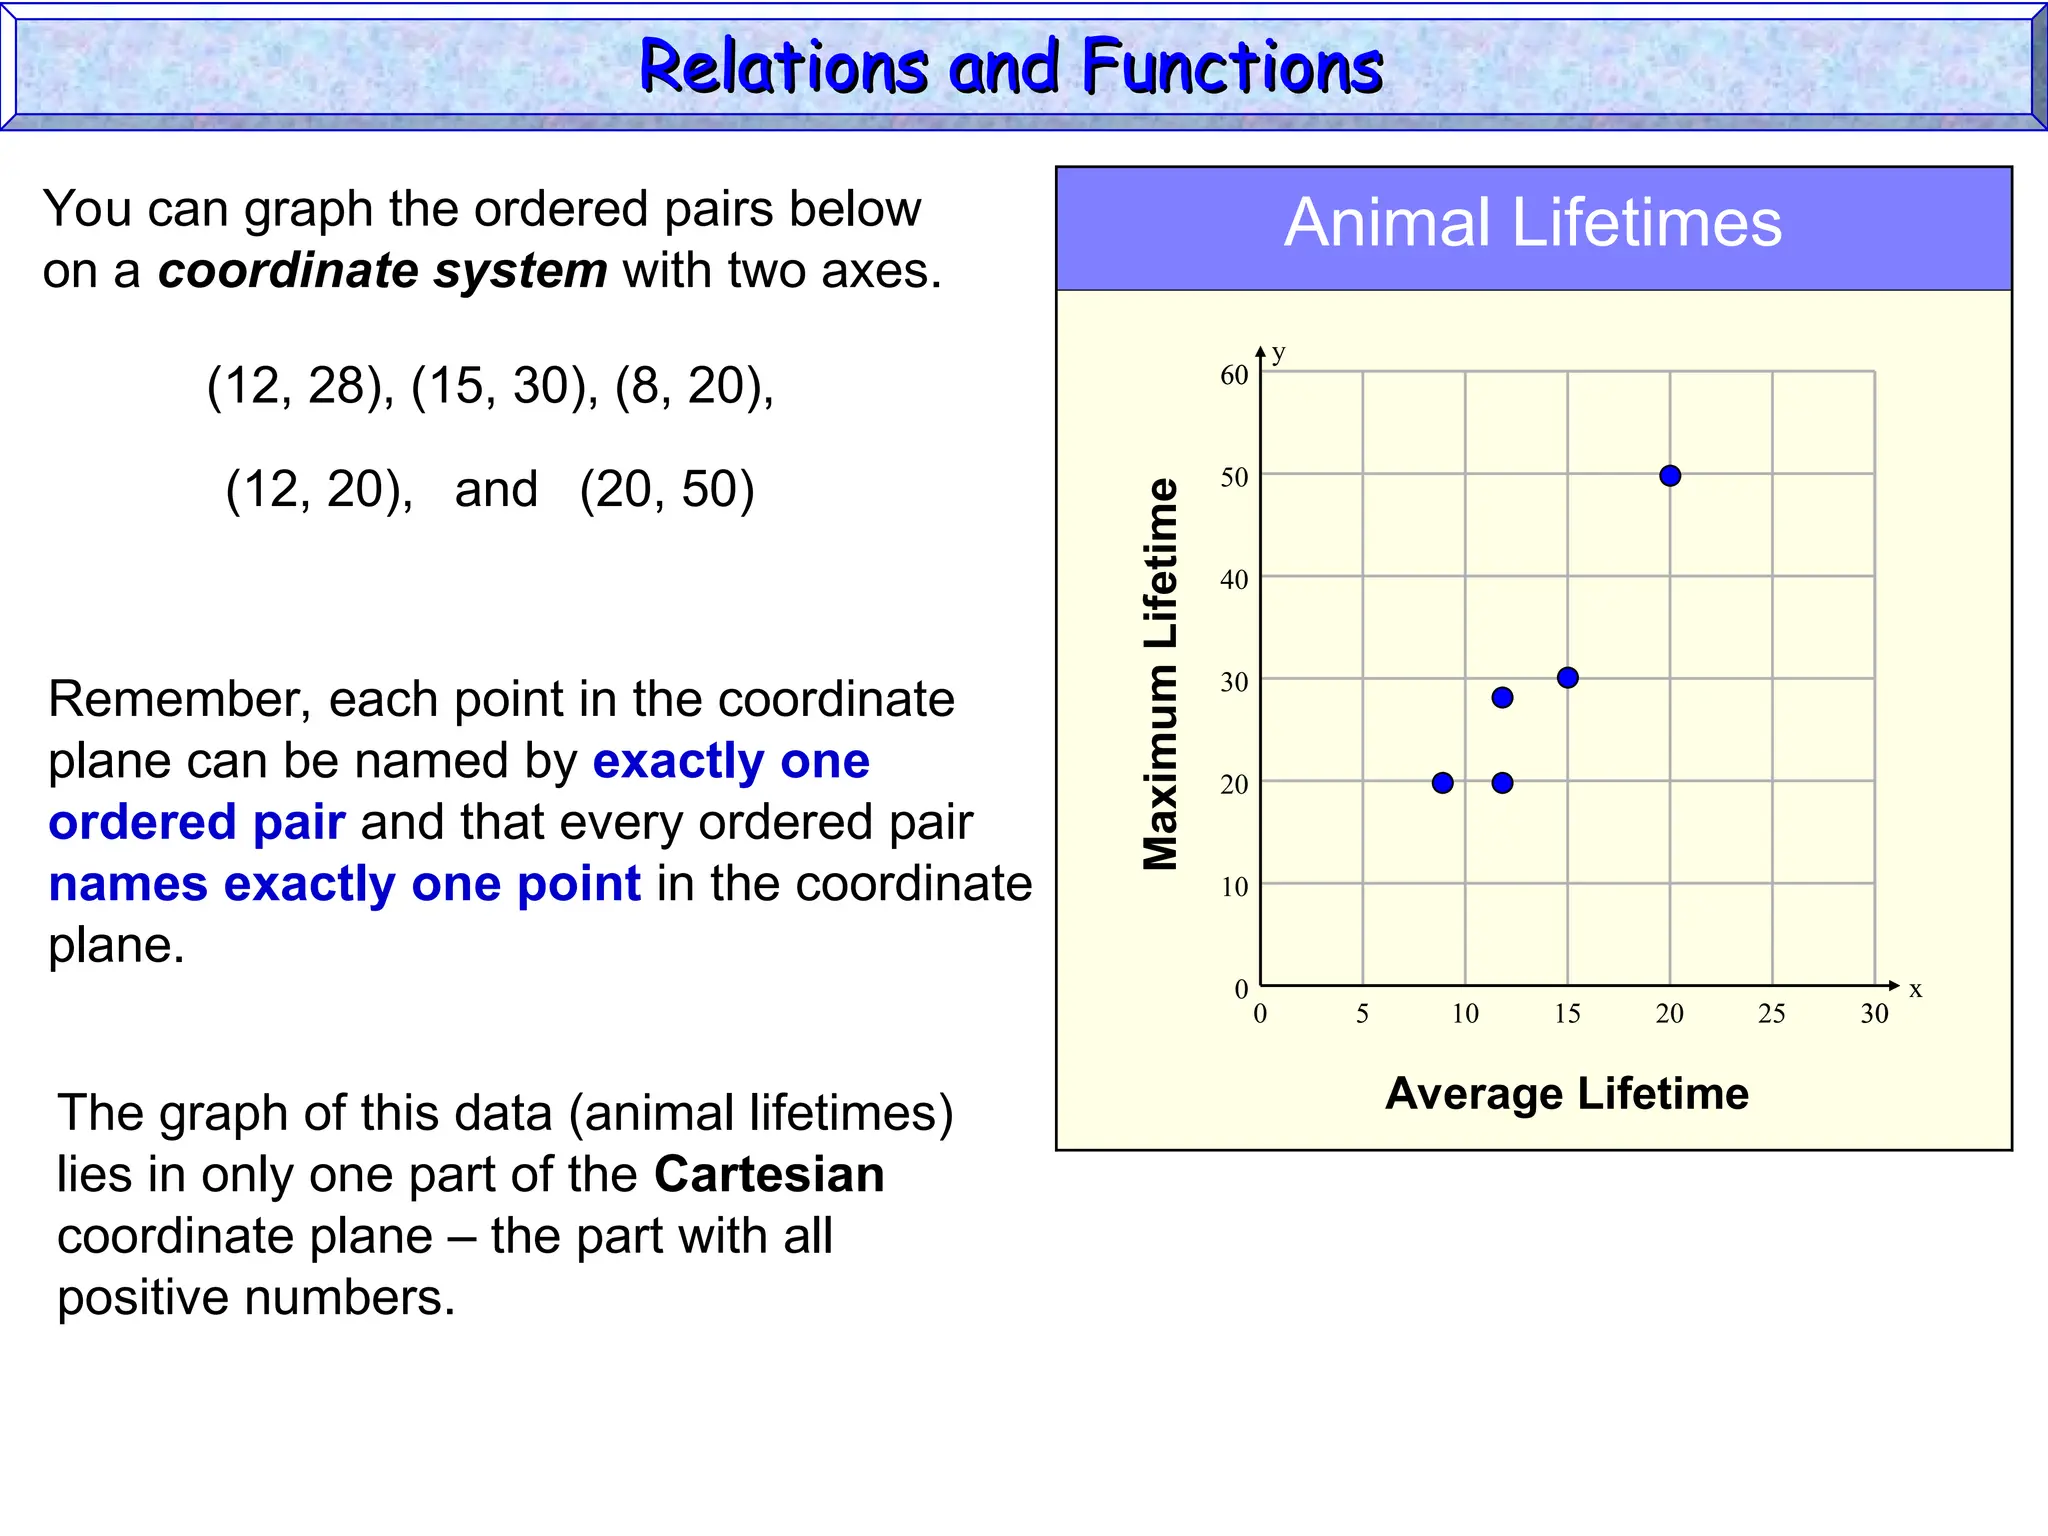
(12, 28), (15, 30), (8, 20),
(12, 20), (20, 50)
and
You can graph the ordered pairs below
on a coordinate system with two axes.
Remember, each point in the coordinate
plane can be named by exactly one
ordered pair and that every ordered pair
names exactly one point in the coordinate
plane.
The graph of this data (animal lifetimes)
lies in only one part of the Cartesian
coordinate plane – the part with all
positive numbers.
Relations and Functions
Relations and Functions
5.
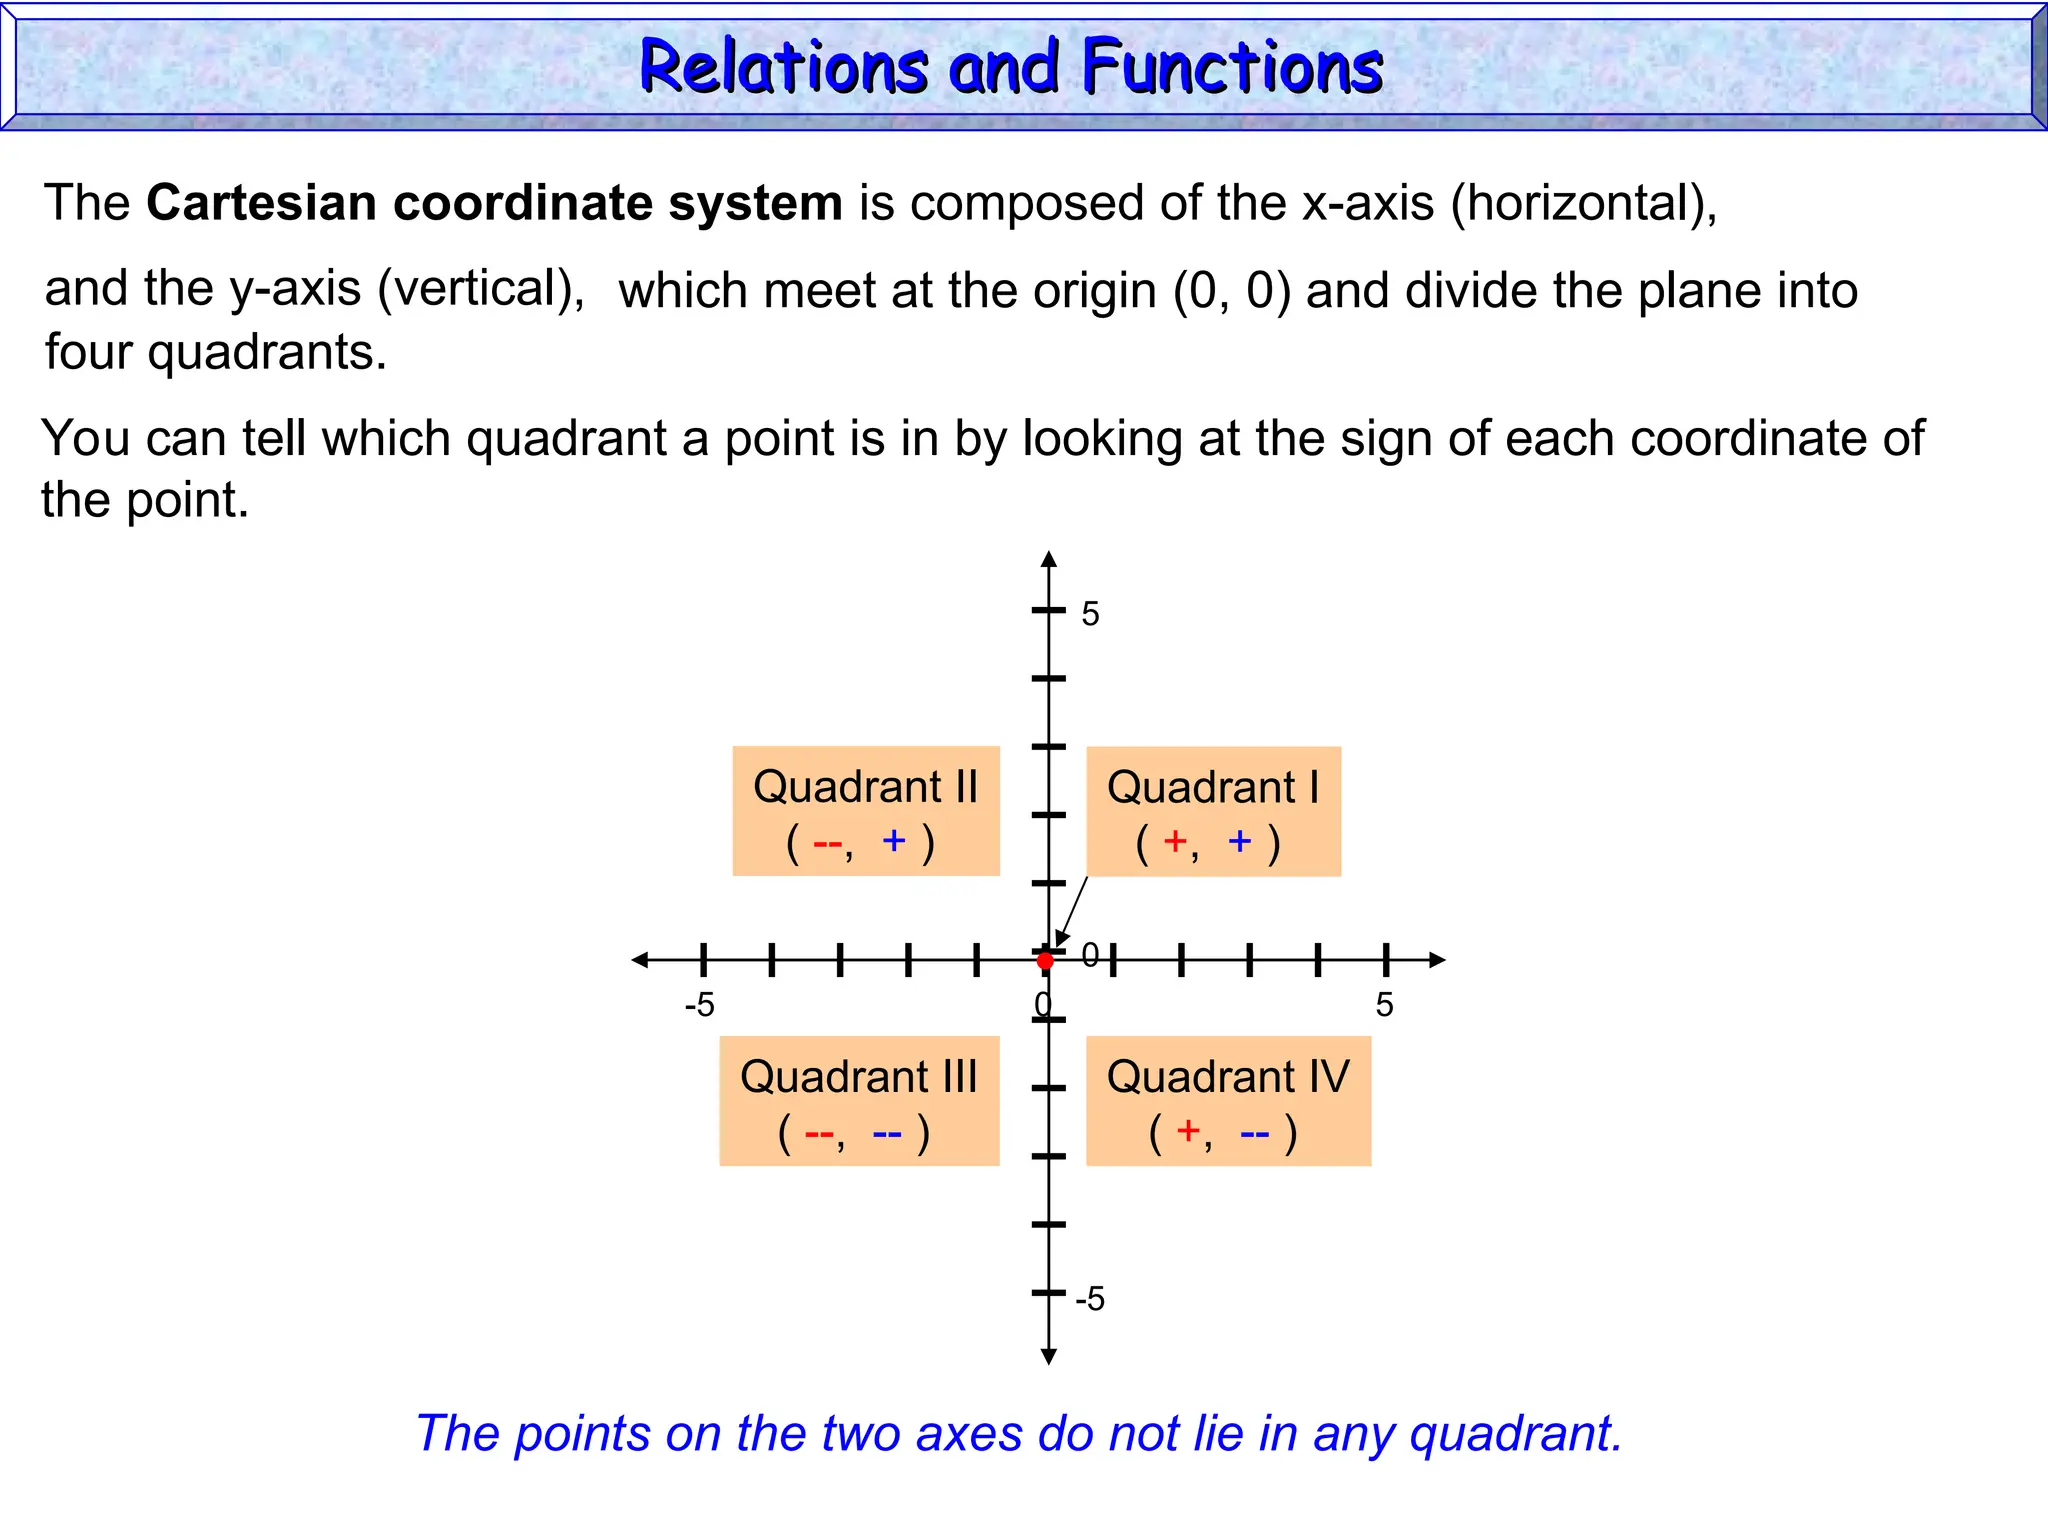
The Cartesian coordinatesystem is composed of the x-axis (horizontal),
0 5
-5
0
5
-5
Origin
(0, 0)
and the y-axis (vertical), which meet at the origin (0, 0) and divide the plane into
four quadrants.
You can tell which quadrant a point is in by looking at the sign of each coordinate of
the point.
Quadrant I
( +, + )
Quadrant II
( --, + )
Quadrant III
( --, -- )
Quadrant IV
( +, -- )
The points on the two axes do not lie in any quadrant.
Relations and Functions
Relations and Functions
6.
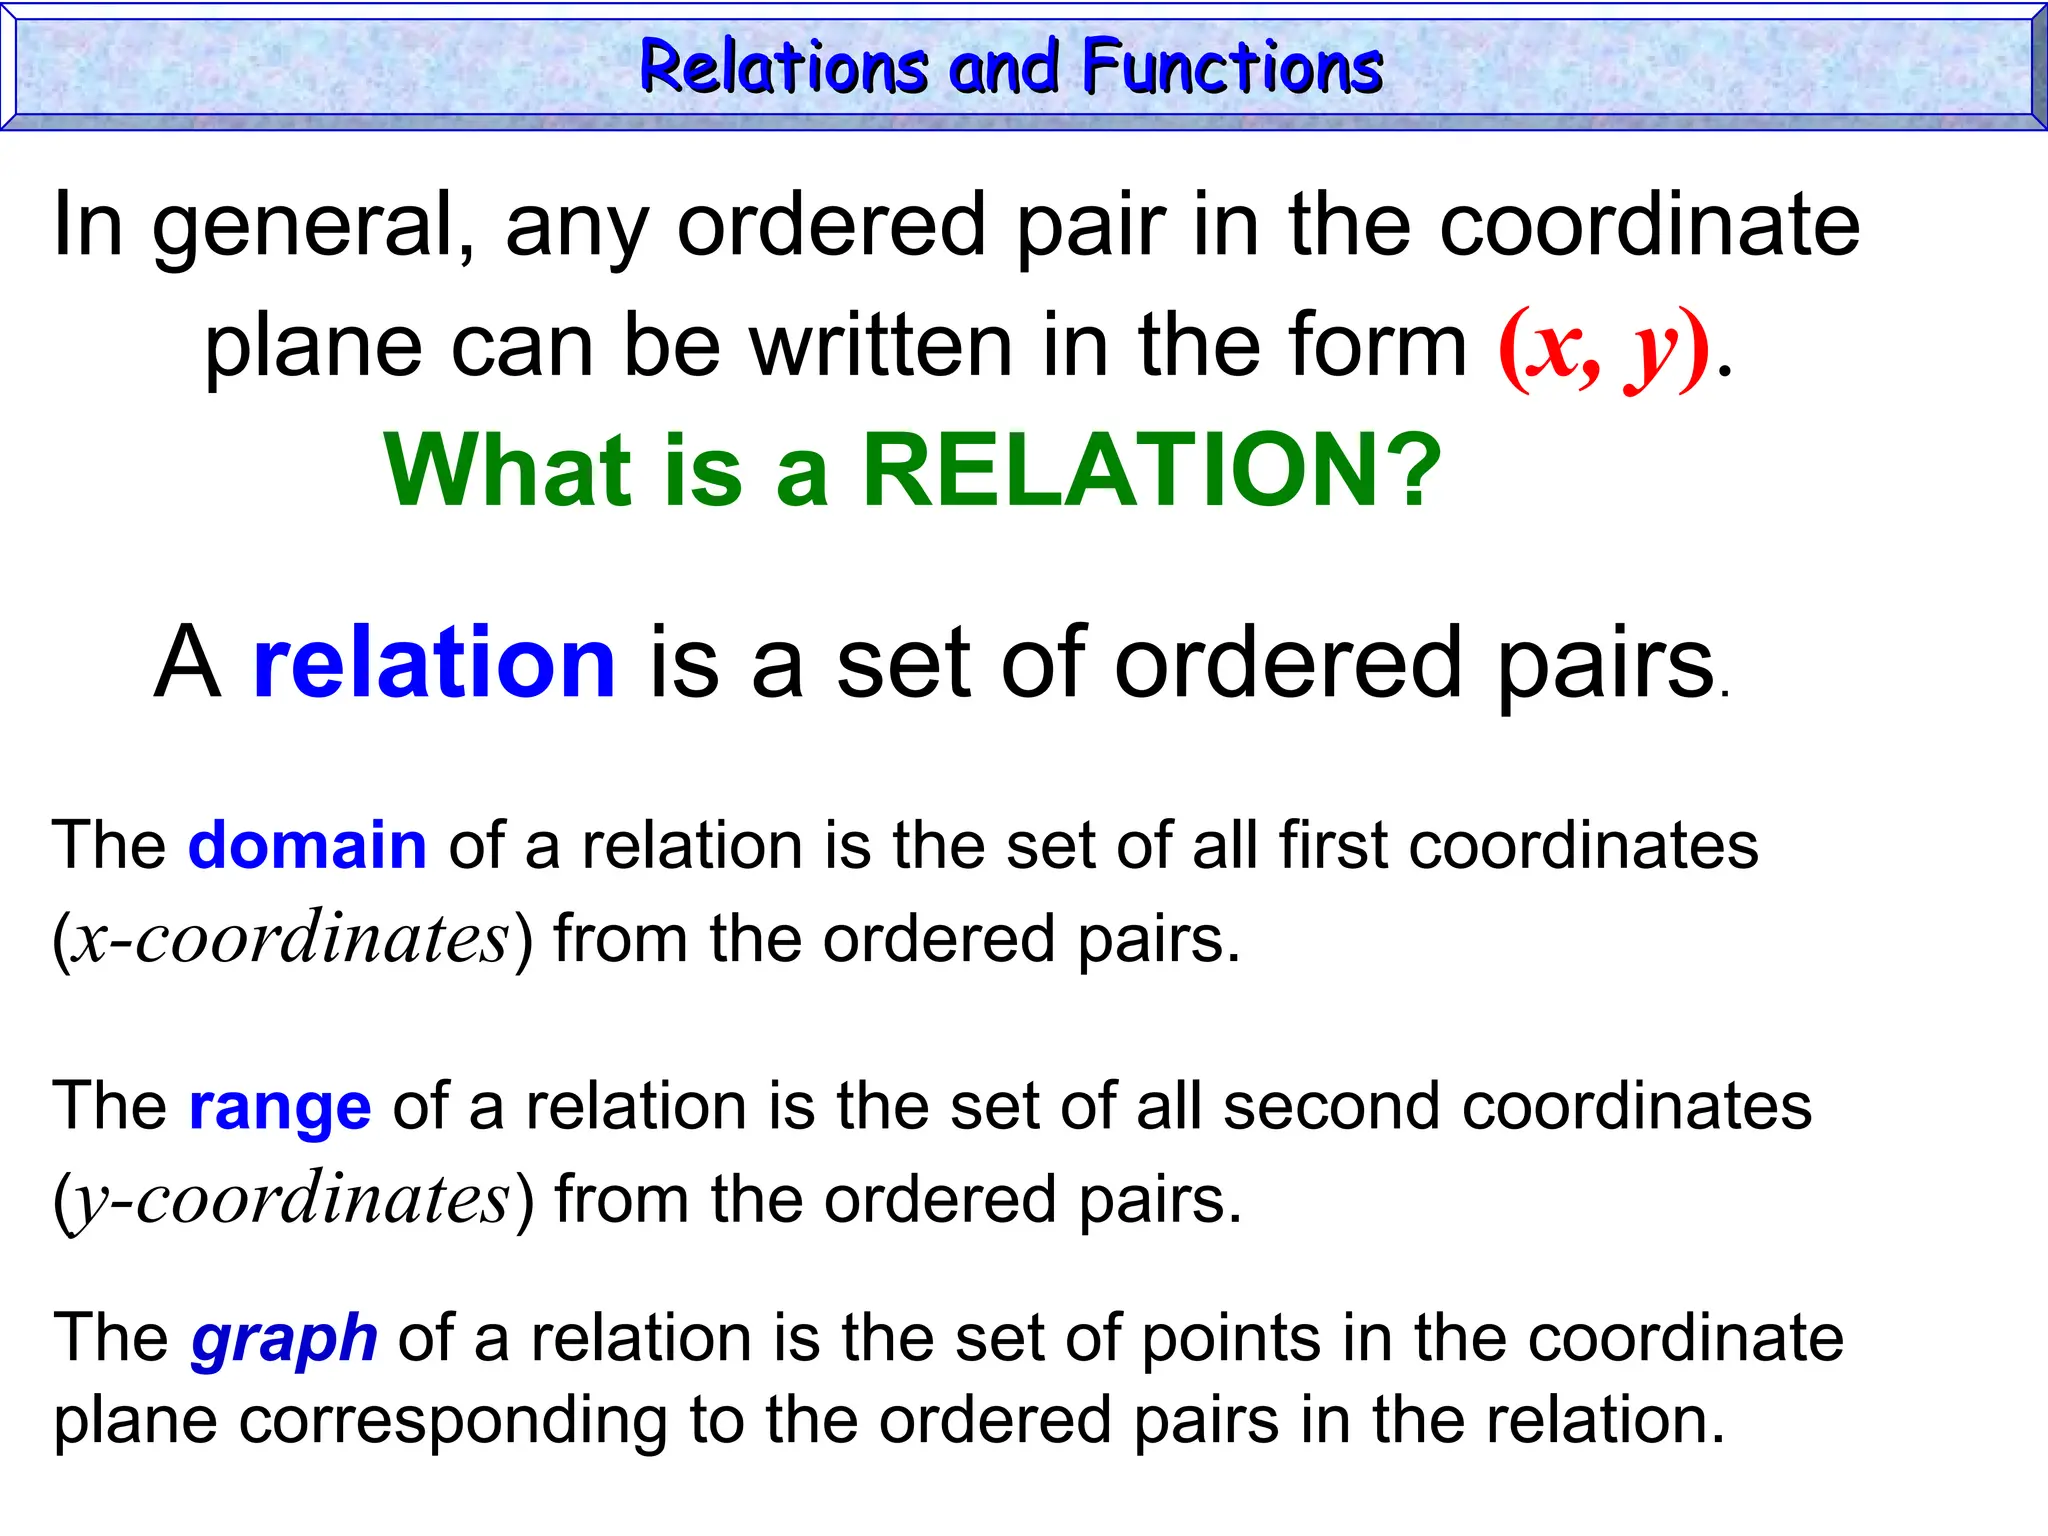
In general, anyordered pair in the coordinate
plane can be written in the form (x, y).
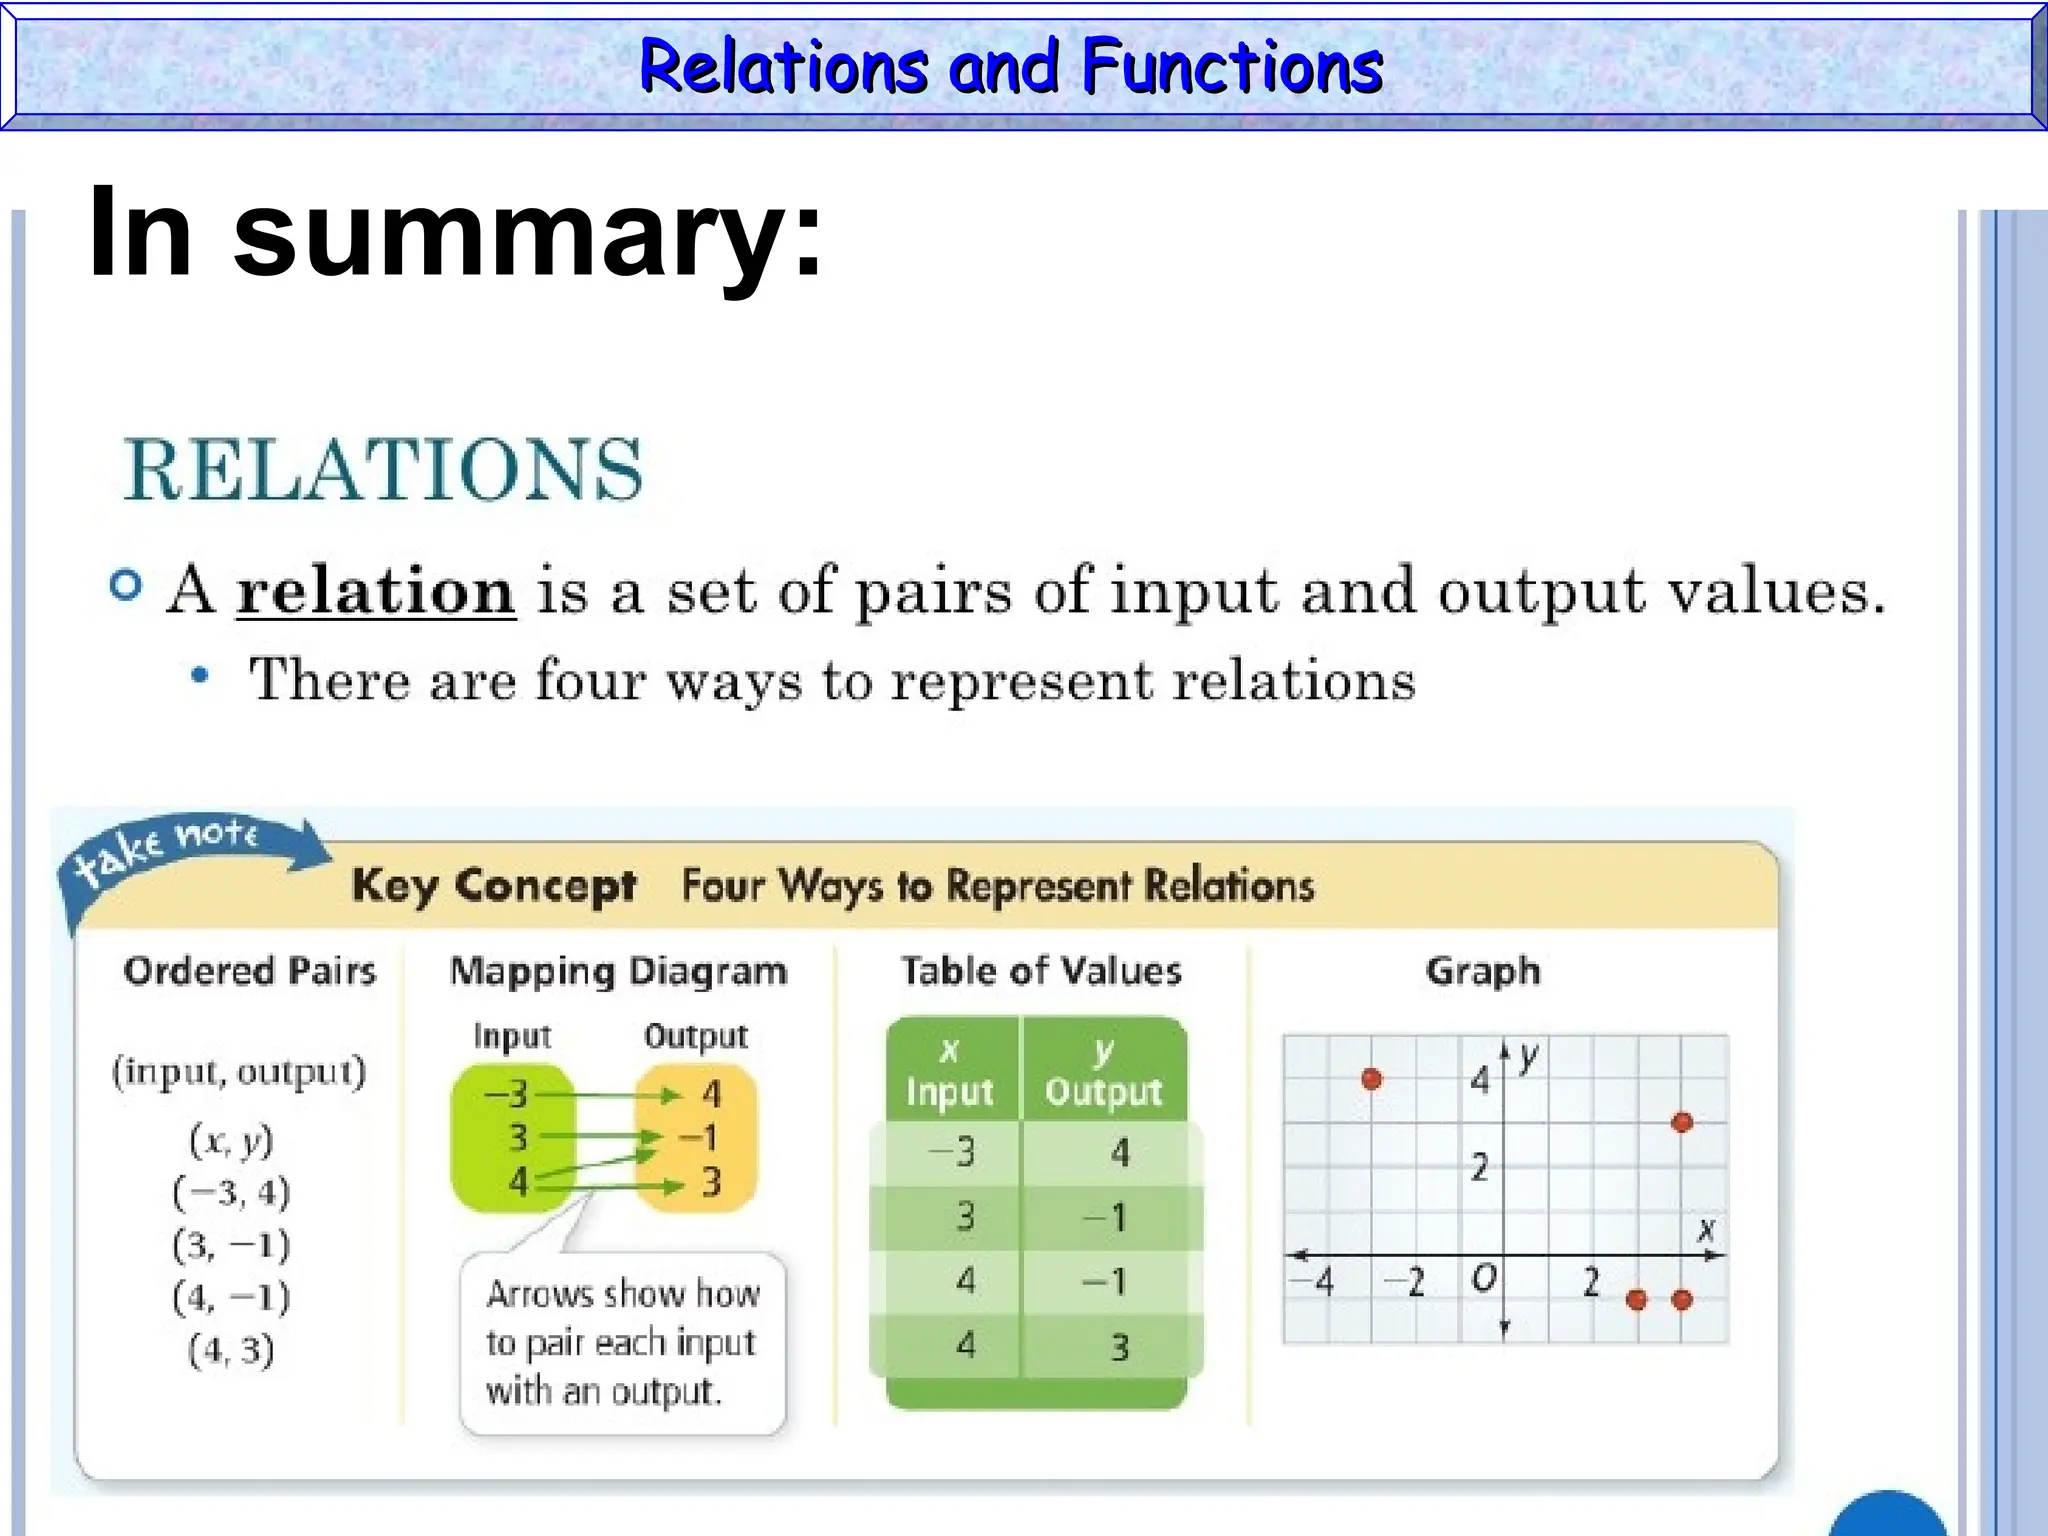
A relation is a set of ordered pairs.
The domain of a relation is the set of all first coordinates
(x-coordinates) from the ordered pairs.
The range of a relation is the set of all second coordinates
(y-coordinates) from the ordered pairs.
The graph of a relation is the set of points in the coordinate
plane corresponding to the ordered pairs in the relation.
Relations and Functions
Relations and Functions
What is a RELATION?
7.
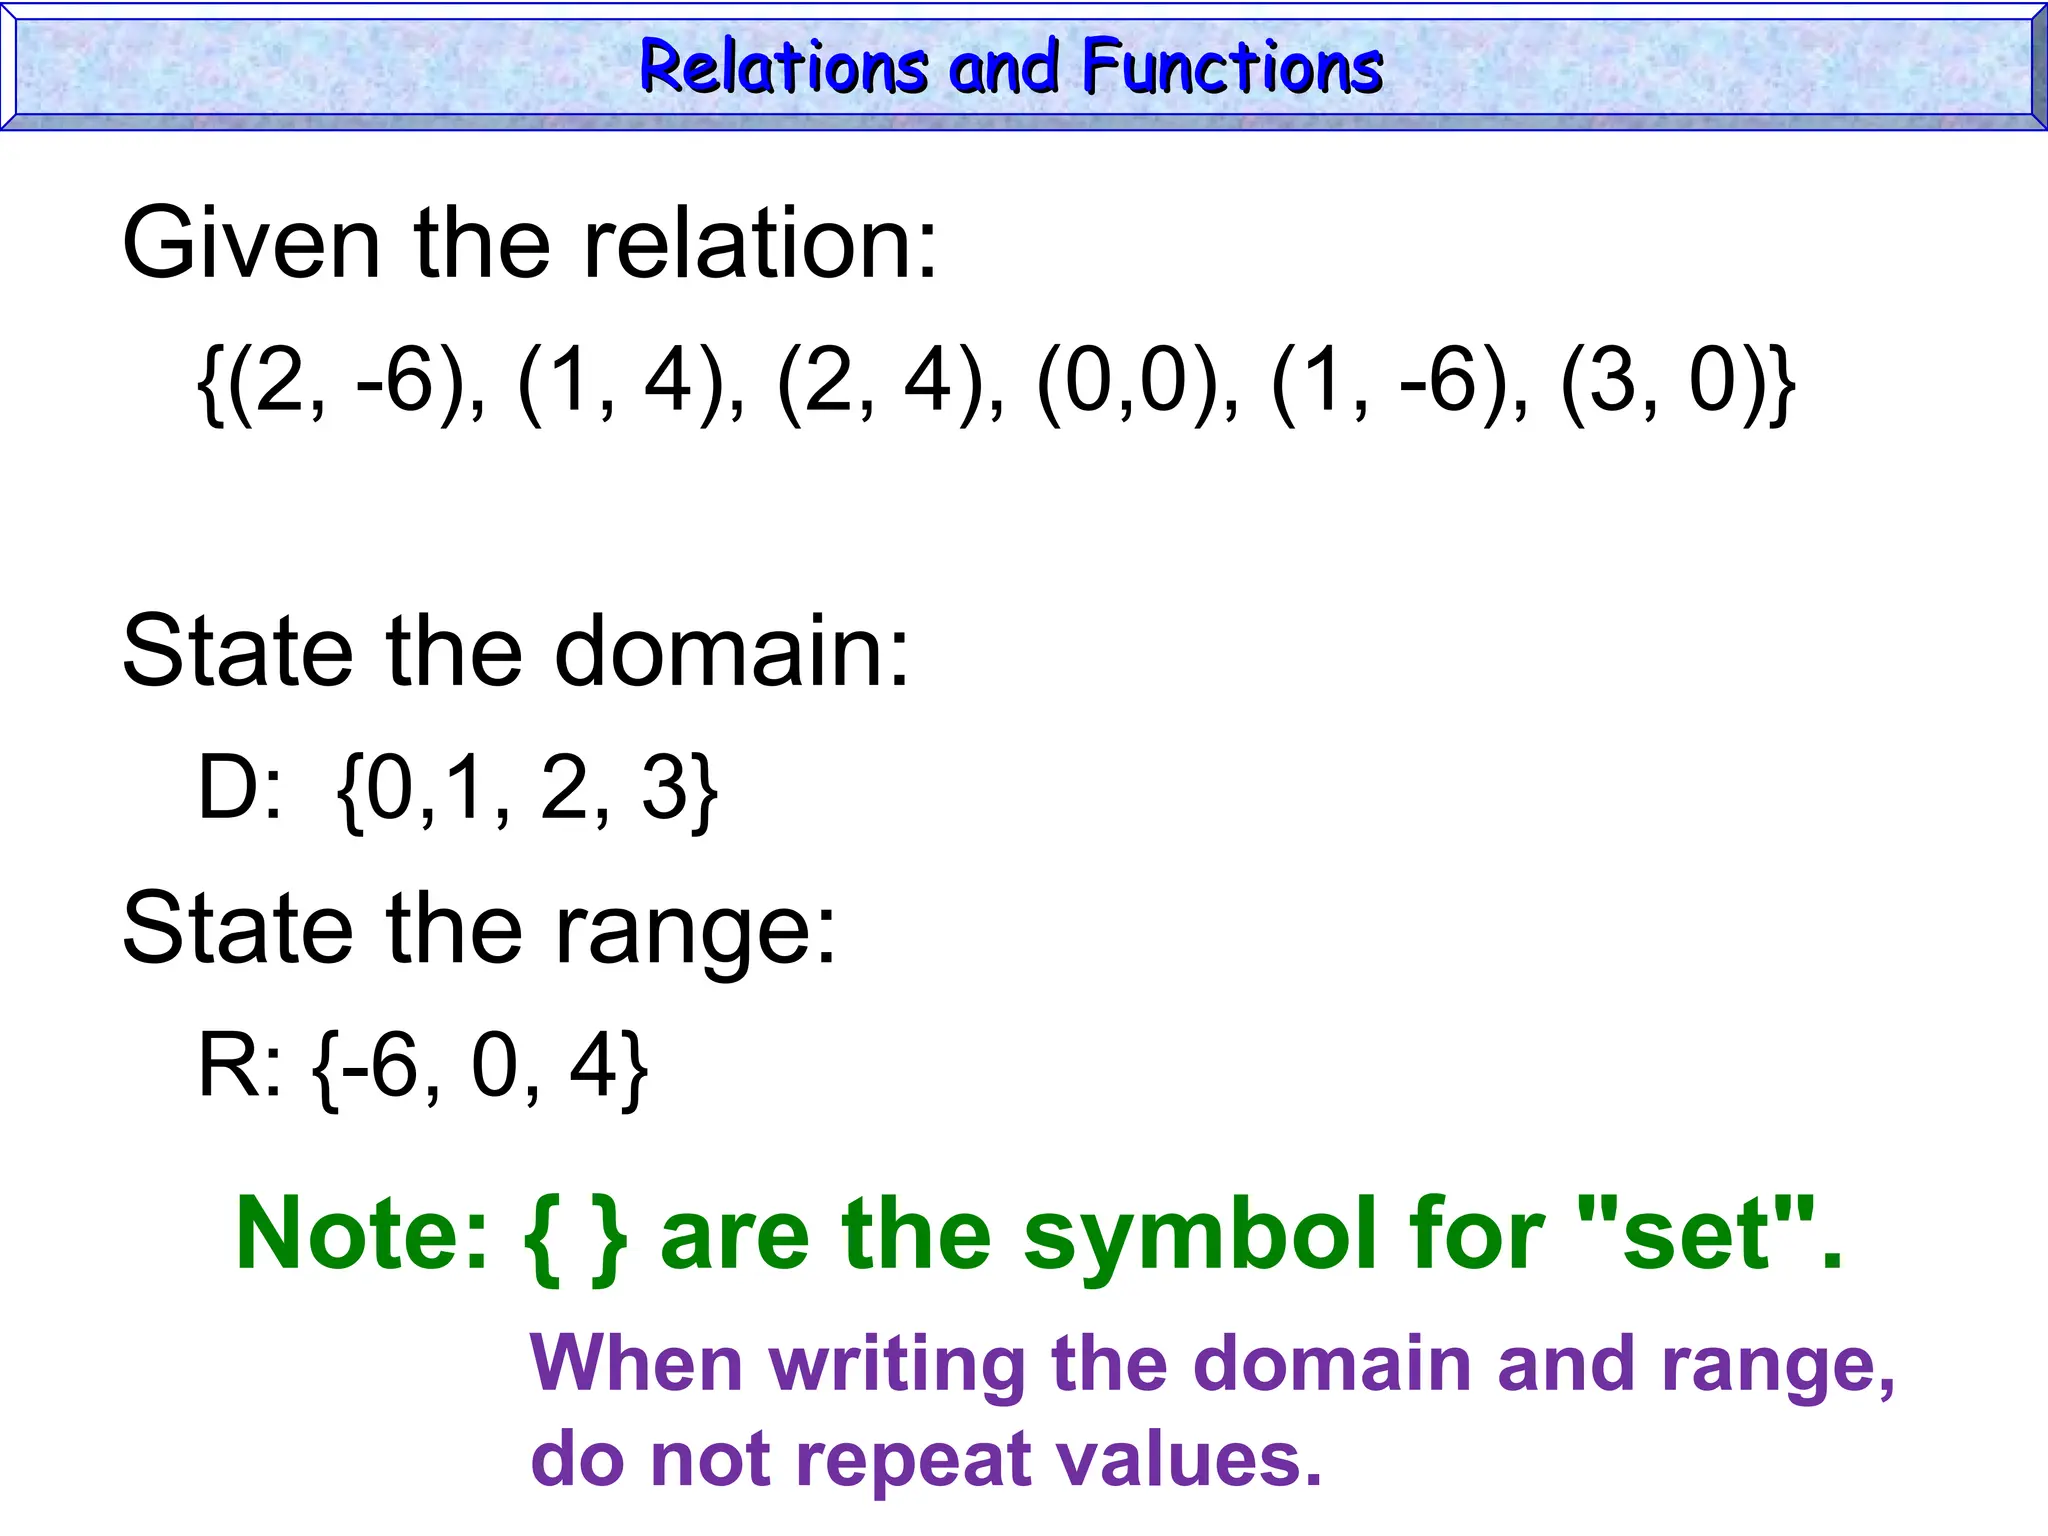
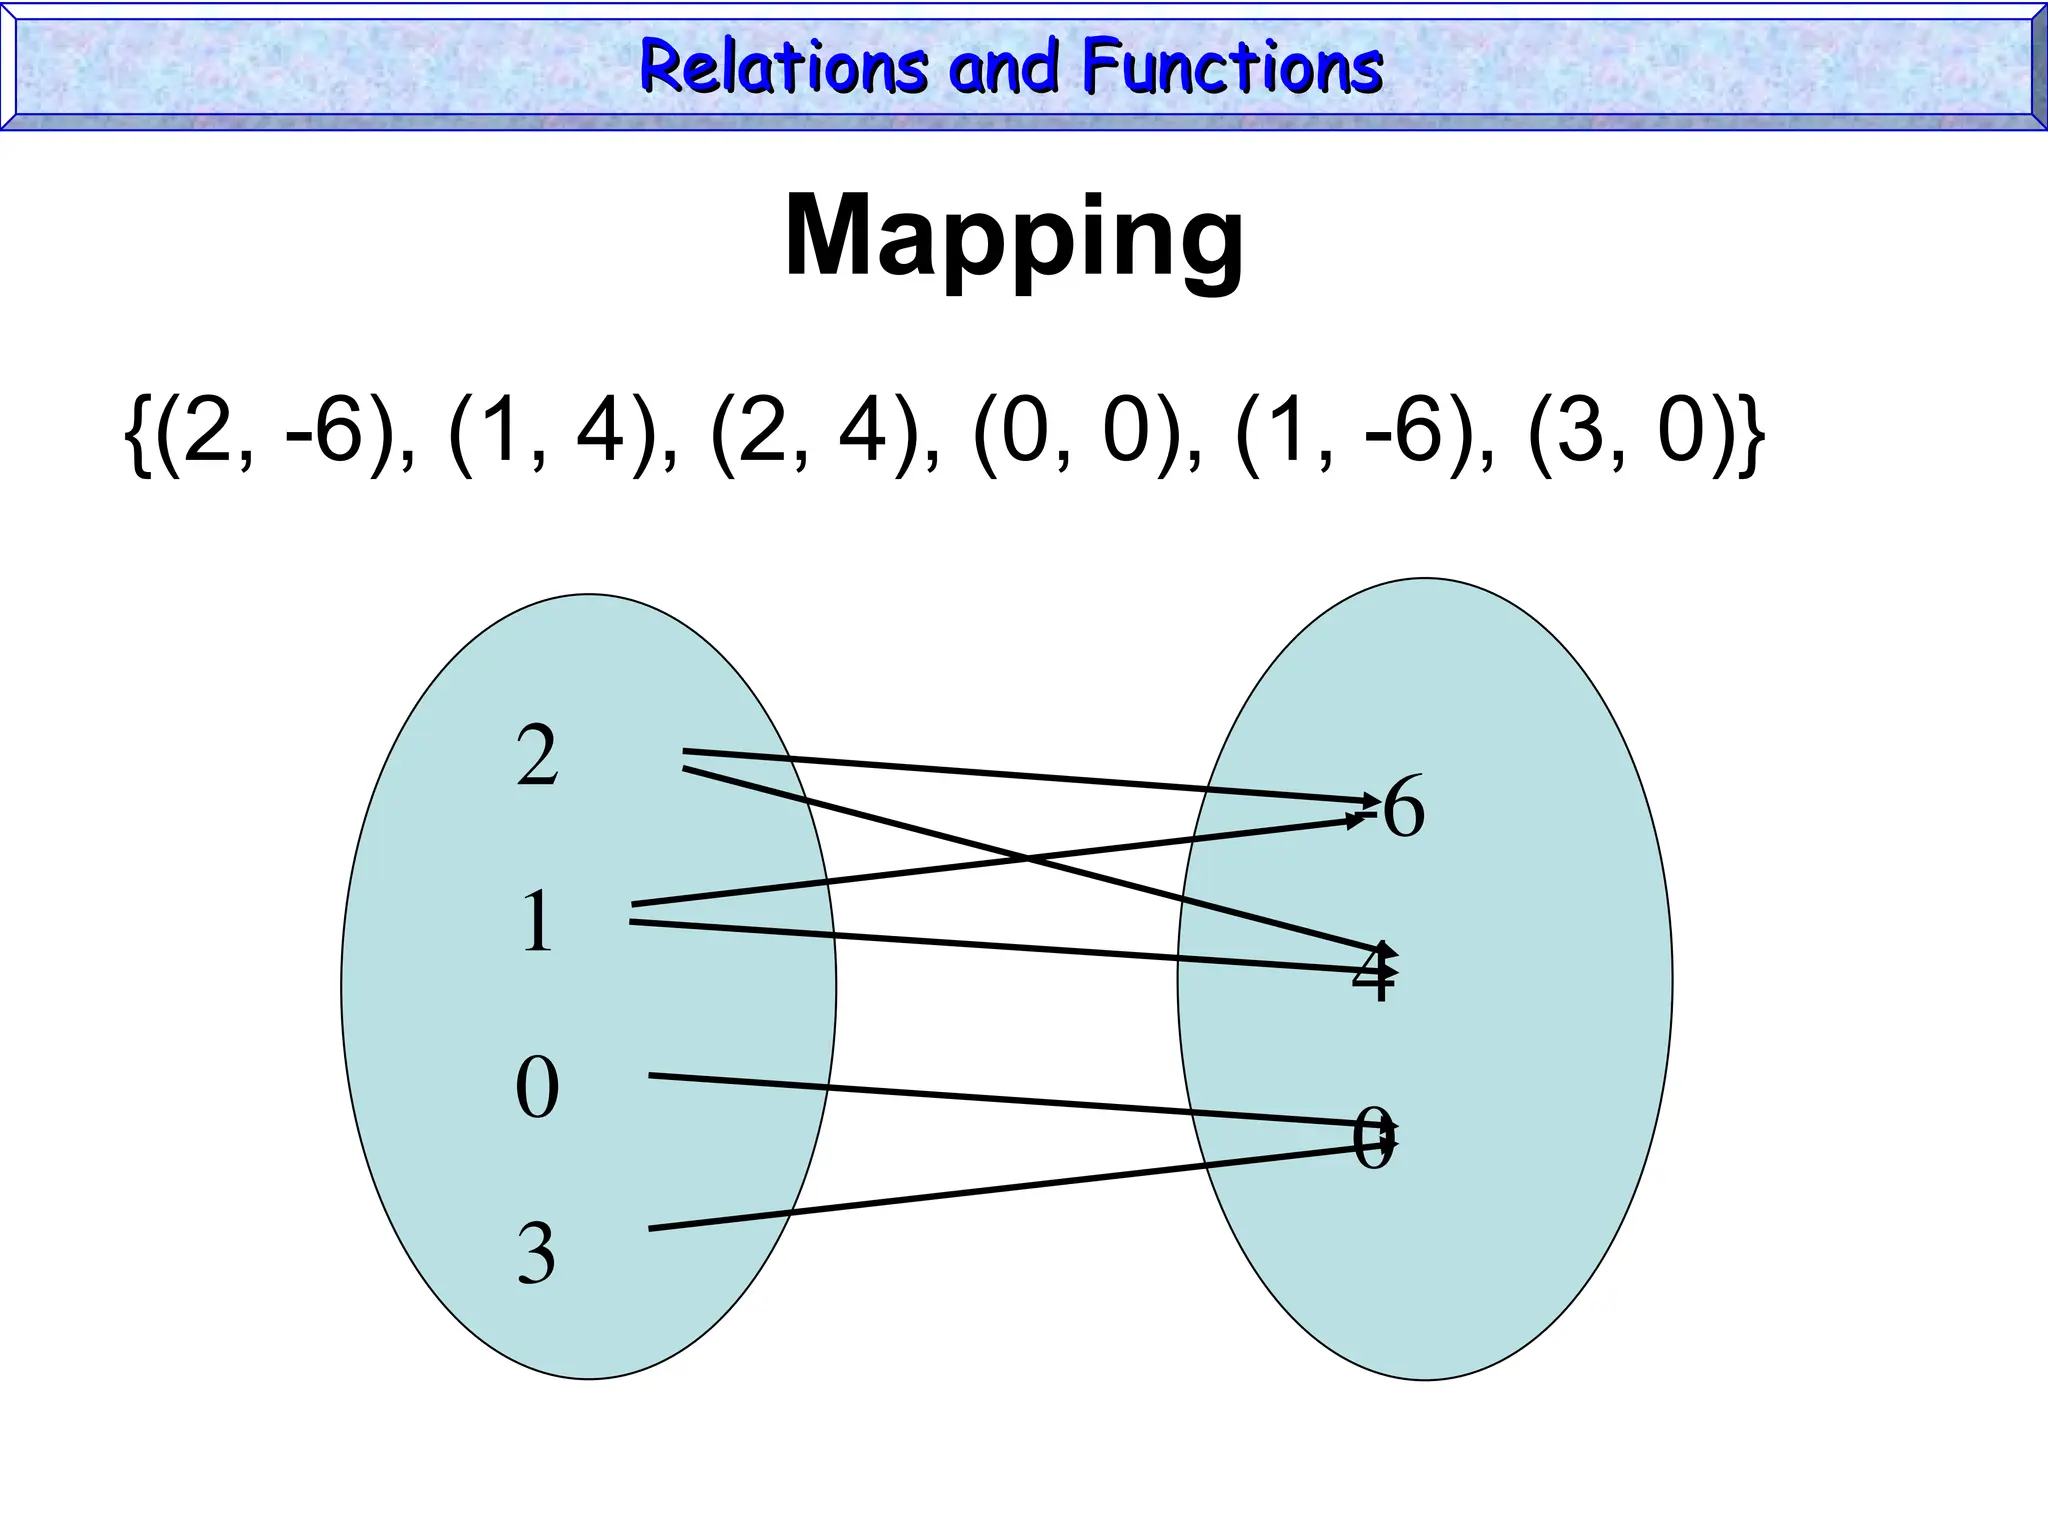
Given the relation:
{(2,-6), (1, 4), (2, 4), (0,0), (1, -6), (3, 0)}
State the domain:
D: {0,1, 2, 3}
State the range:
R: {-6, 0, 4}
Relations and Functions
Relations and Functions
Note: { } are the symbol for "set".
When writing the domain and range,
do not repeat values.
8.
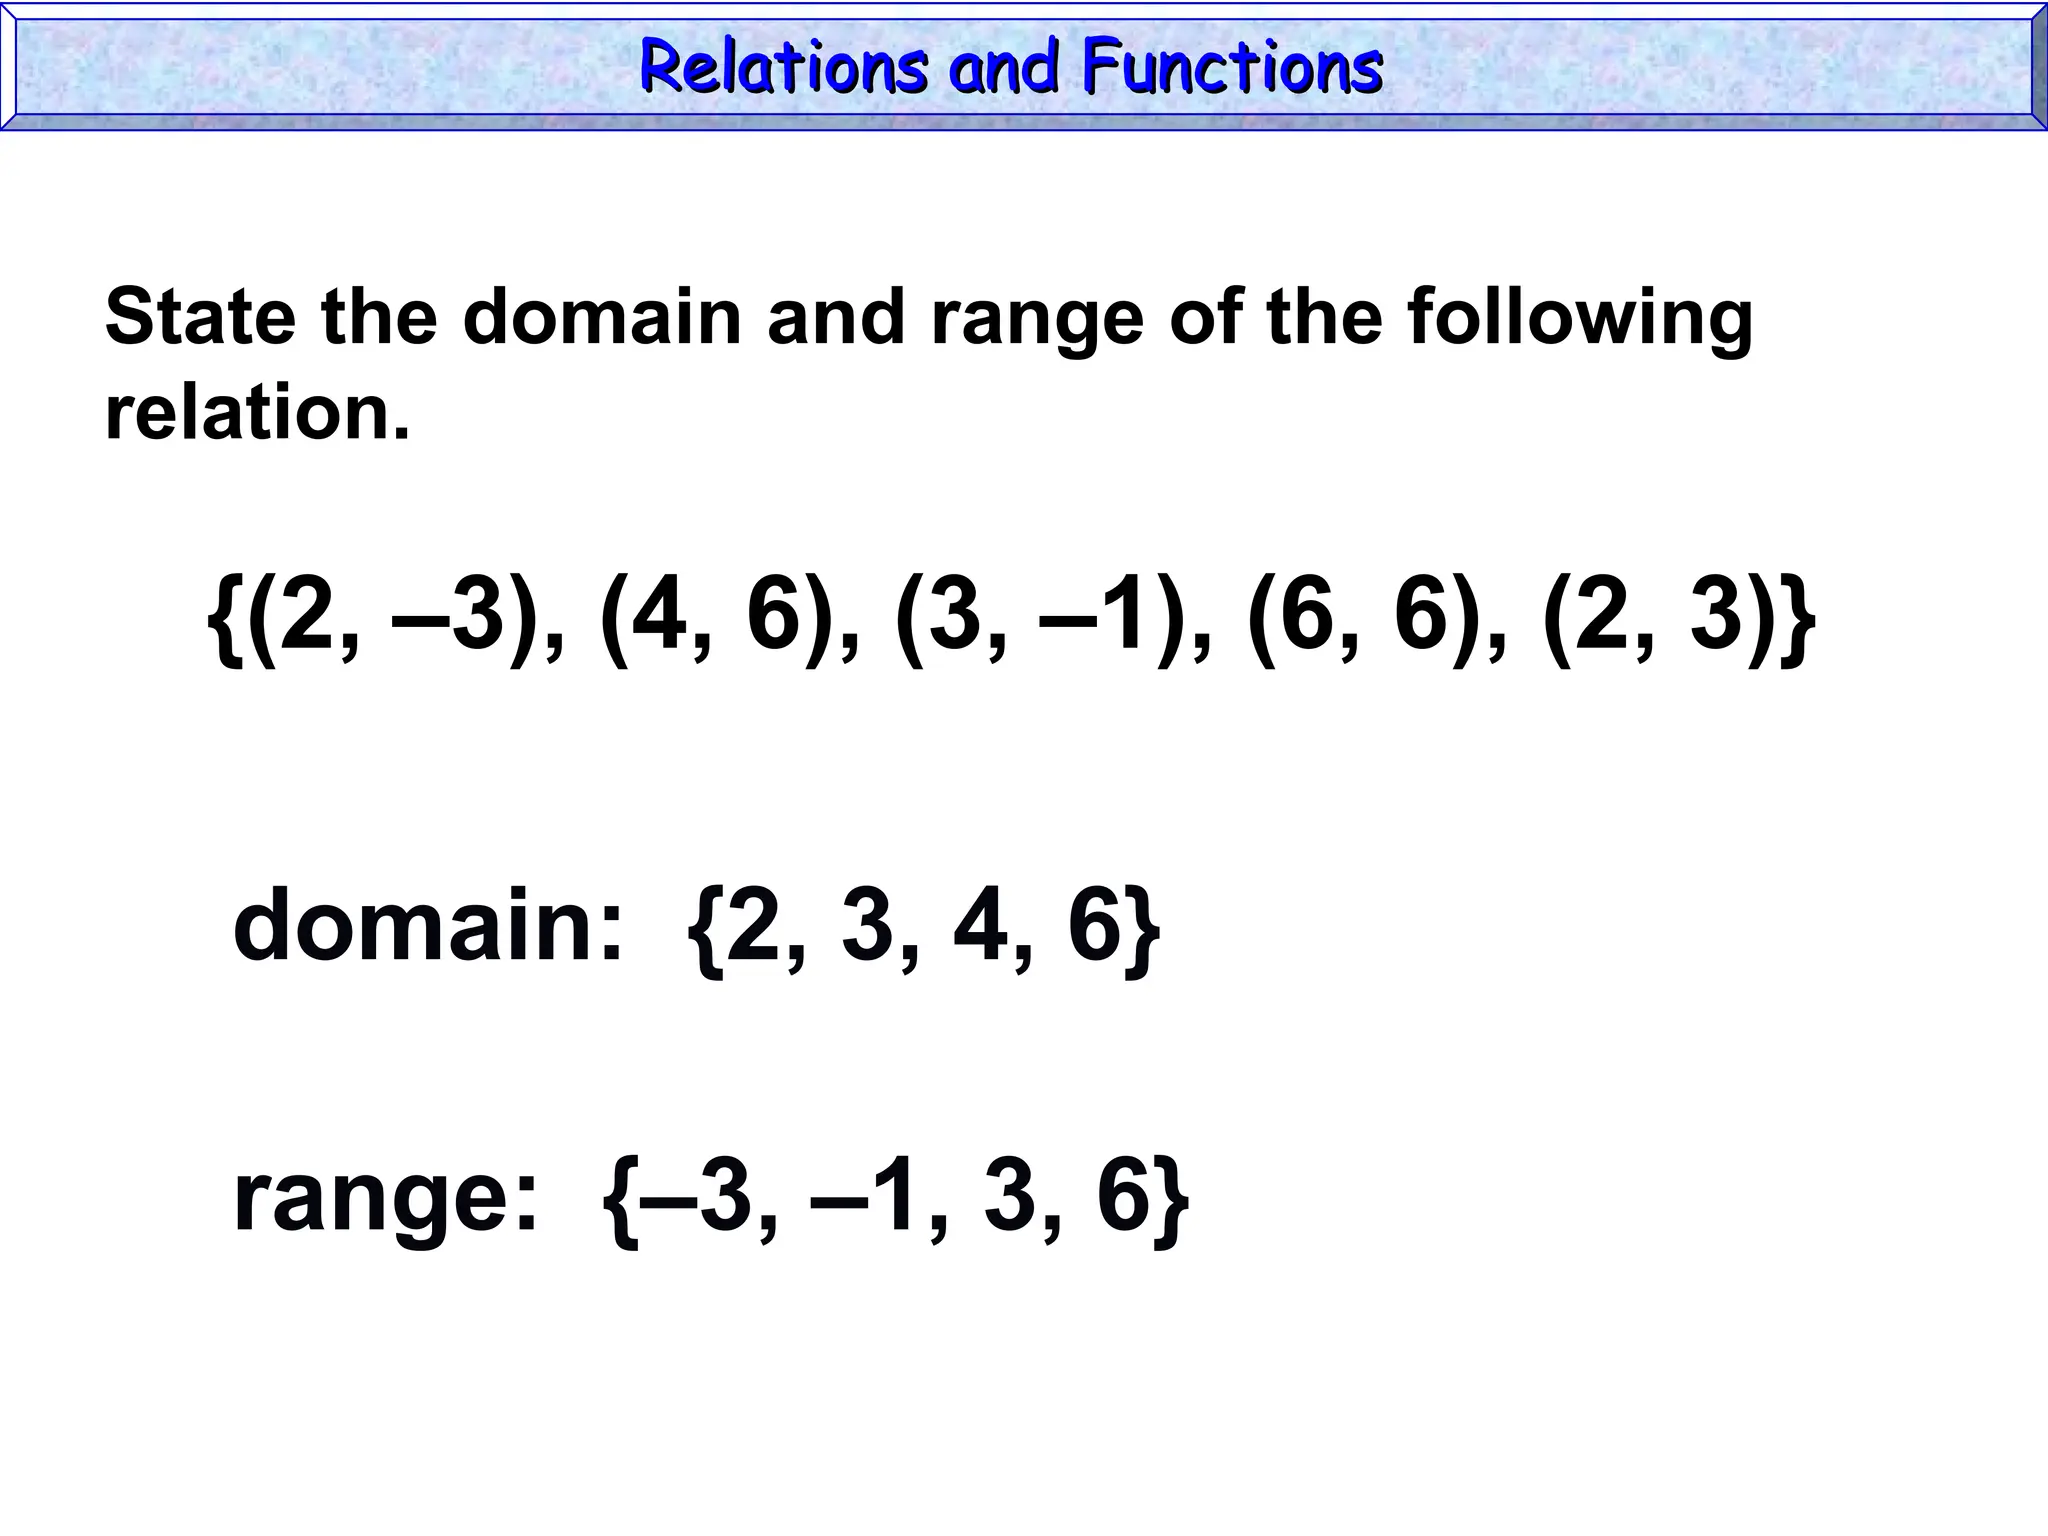
{(2, –3), (4,6), (3, –1), (6, 6), (2, 3)}
domain: {2, 3, 4, 6}
range: {–3, –1, 3, 6}
State the domain and range of the following
relation.
Relations and Functions
Relations and Functions
9.
y
x
(-4,3) (2,3)
(-1,-2)
(0,-4)
(3,-3)
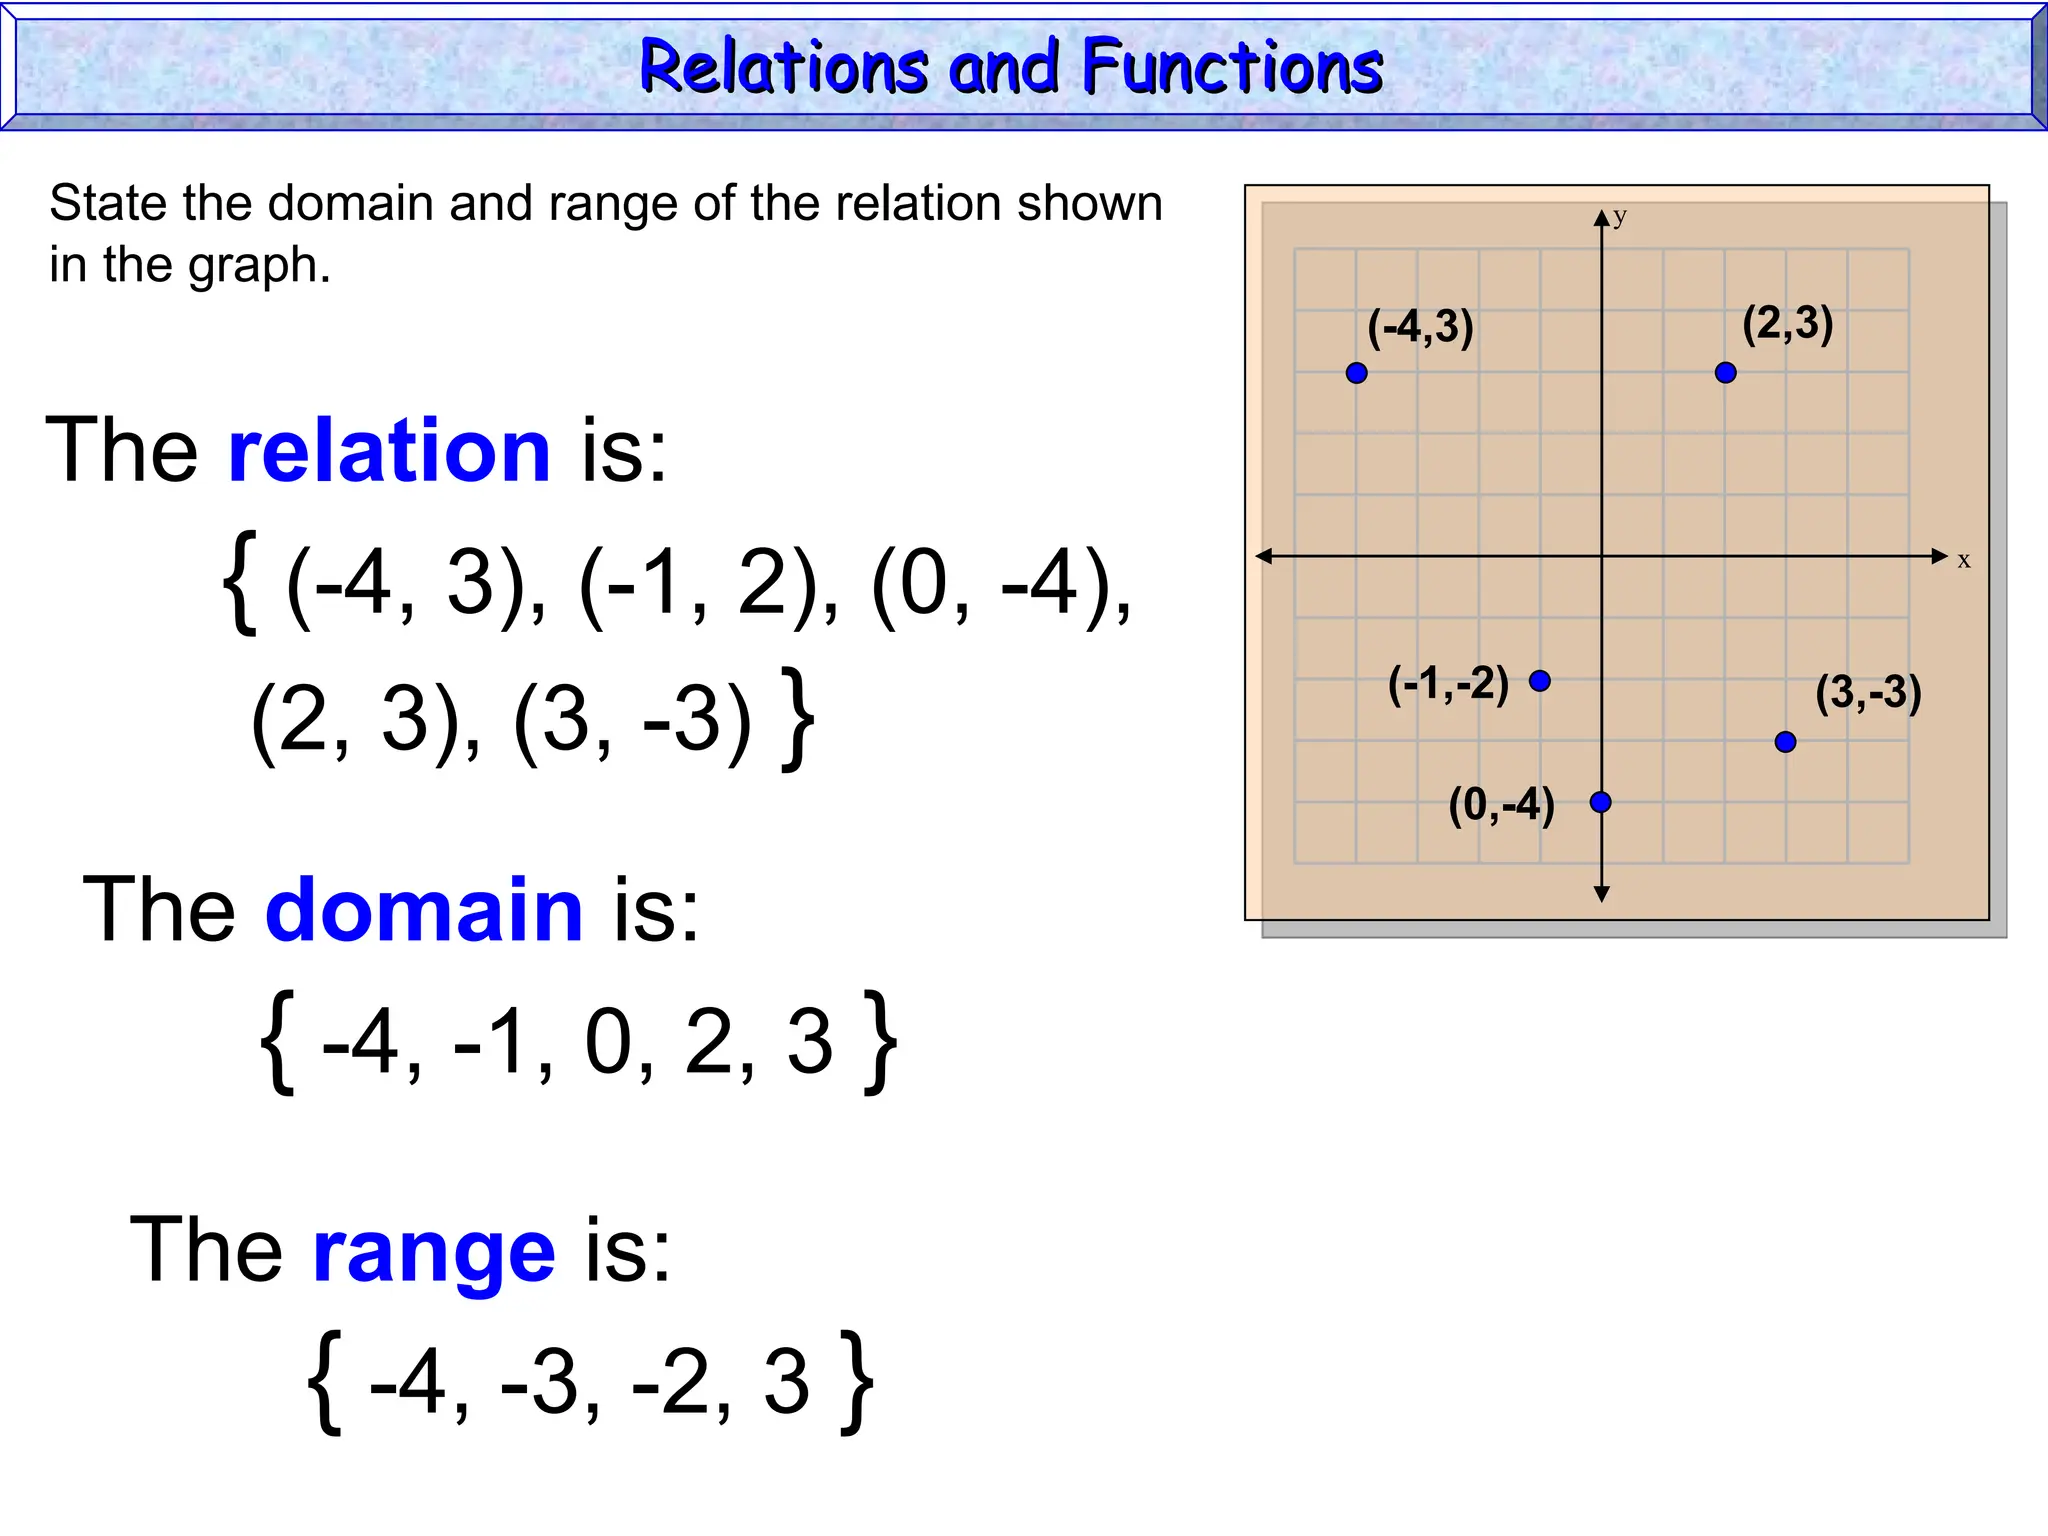
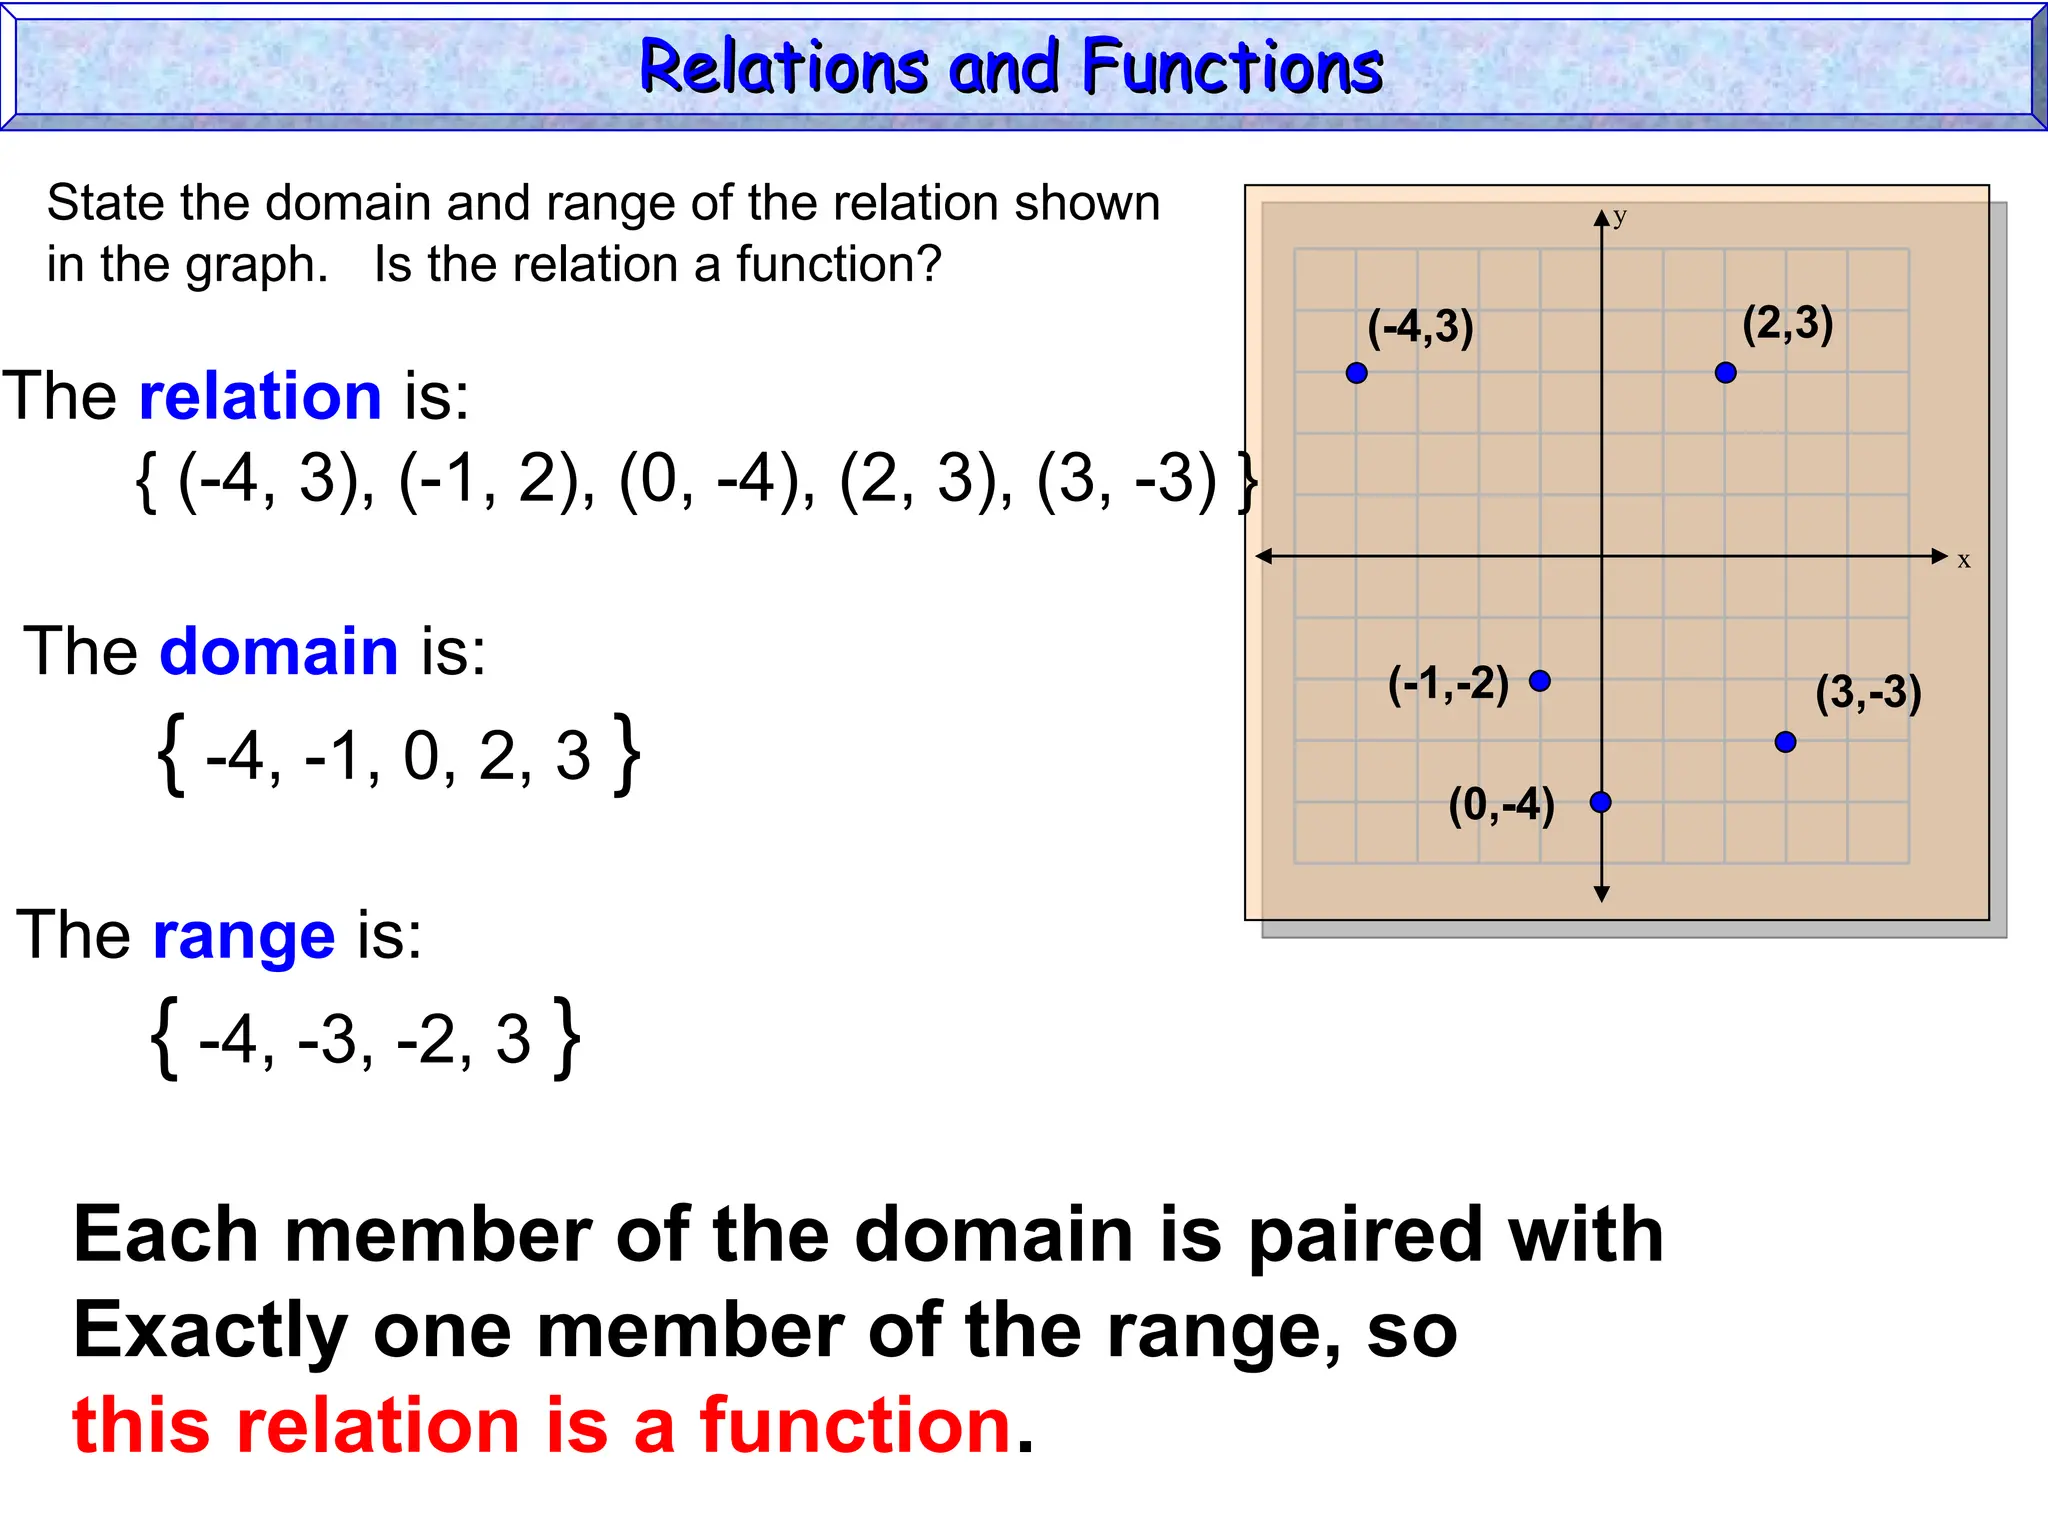
State thedomain and range of the relation shown
in the graph.
The relation is:
{ (-4, 3), (-1, 2), (0, -4),
(2, 3), (3, -3) }
The domain is:
{ -4, -1, 0, 2, 3 }
The range is:
{ -4, -3, -2, 3 }
Relations and Functions
Relations and Functions
10.
ACTIVITY TIME! (20 points)
Form five (5 groups).
Assign group leaders per group.
Let them answer pages 142 – 143. Assign problem to
each group to answer.
Outputs will be written in a Manila Paper.
Assign members who will present the output.
Presentation of outputs will be done AFTER 15 minutes.
The last group to post their output will be the first to
present.
Relations and Functions
Relations and Functions
11.
• Relations canbe written in several
ways: ordered pairs, table, graph, or
mapping.
• We have already seen relations
represented as ordered pairs.
Relations and Functions
Relations and Functions
12.
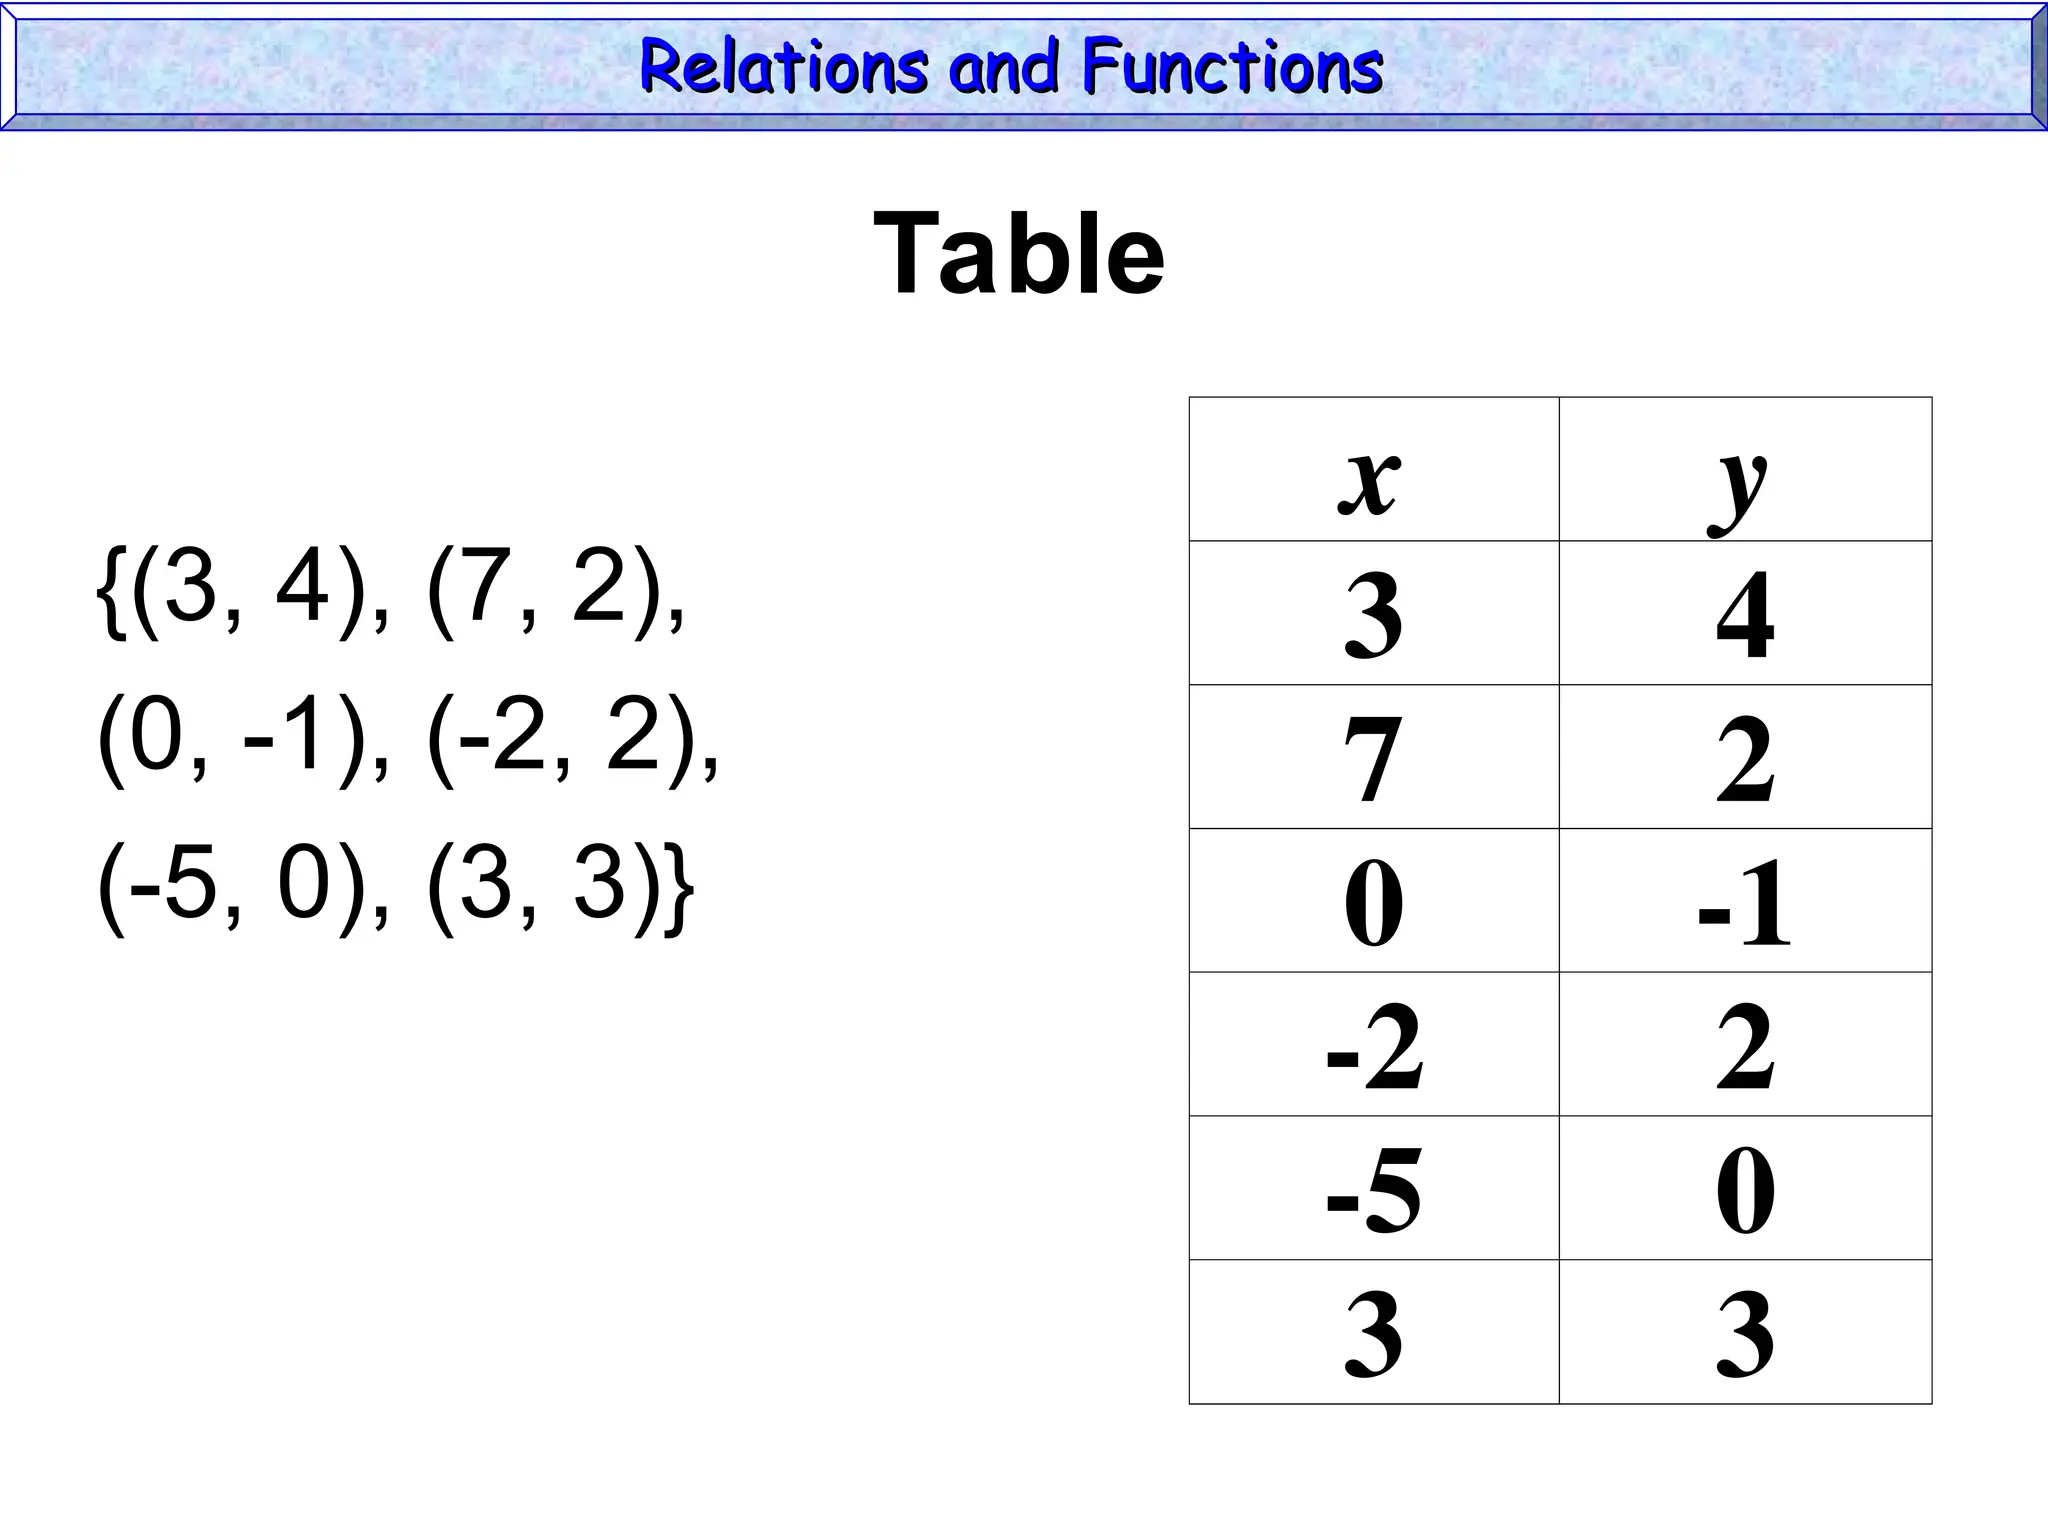
Table
{(3, 4), (7,2),
(0, -1), (-2, 2),
(-5, 0), (3, 3)}
x y
3 4
7 2
0 -1
-2 2
-5 0
3 3
Relations and Functions
Relations and Functions
13.
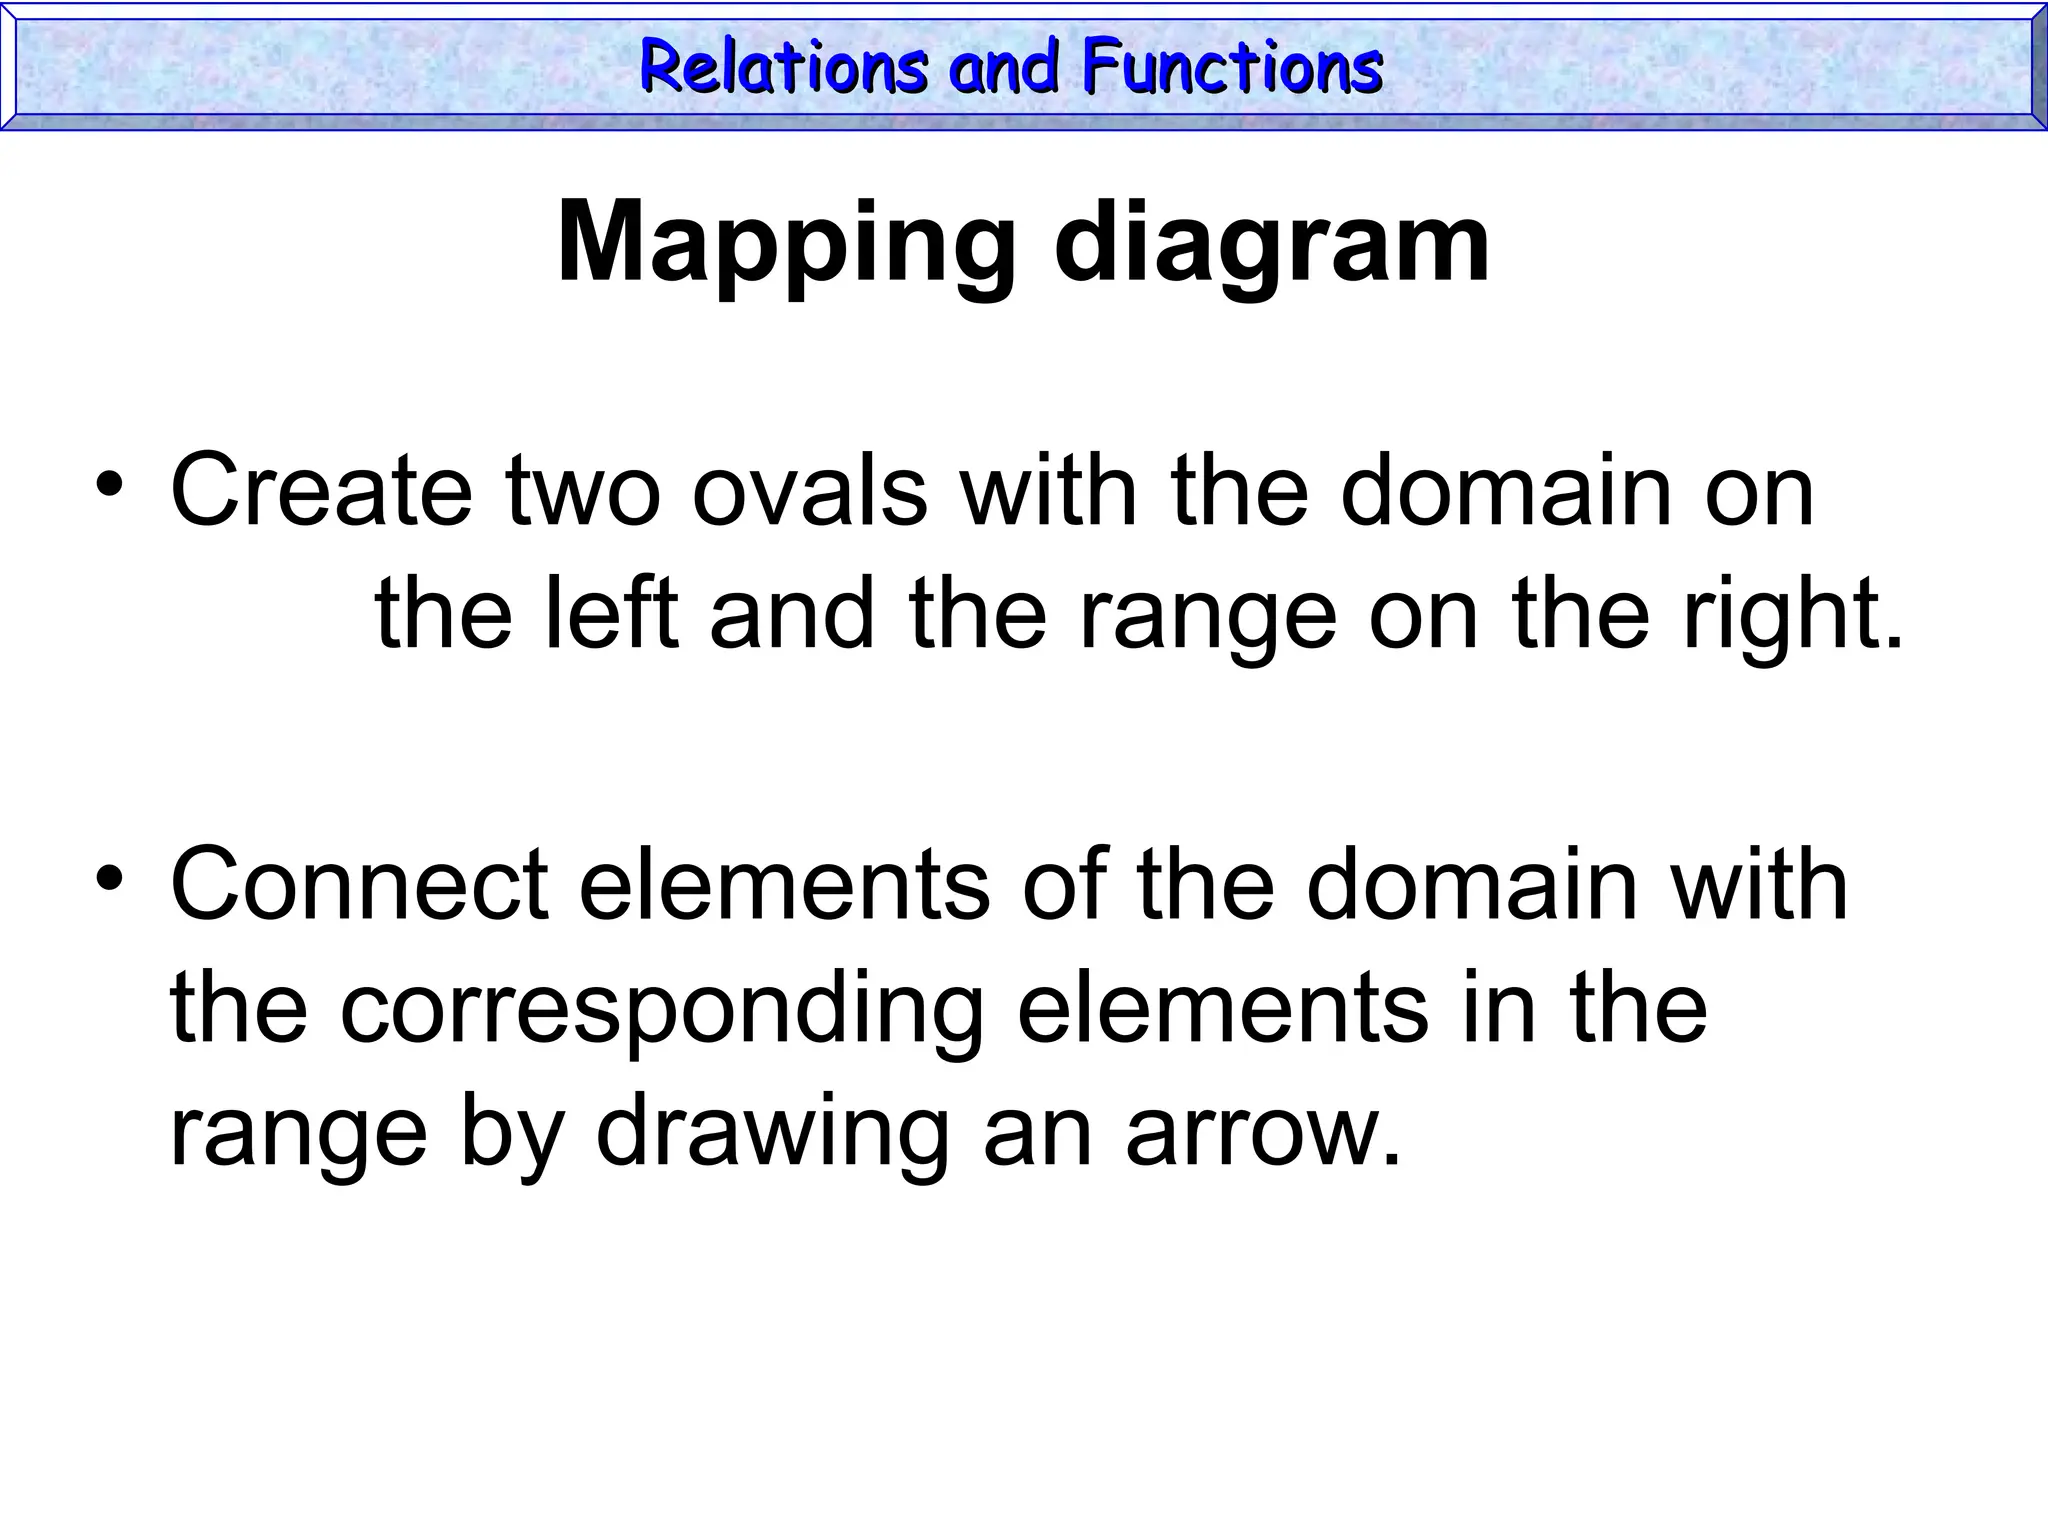
Mapping diagram
• Createtwo ovals with the domain on
the left and the range on the right.
• Connect elements of the domain with
the corresponding elements in the
range by drawing an arrow.
Relations and Functions
Relations and Functions
What is aFUNCTION?
Relations and Functions
Relations and Functions
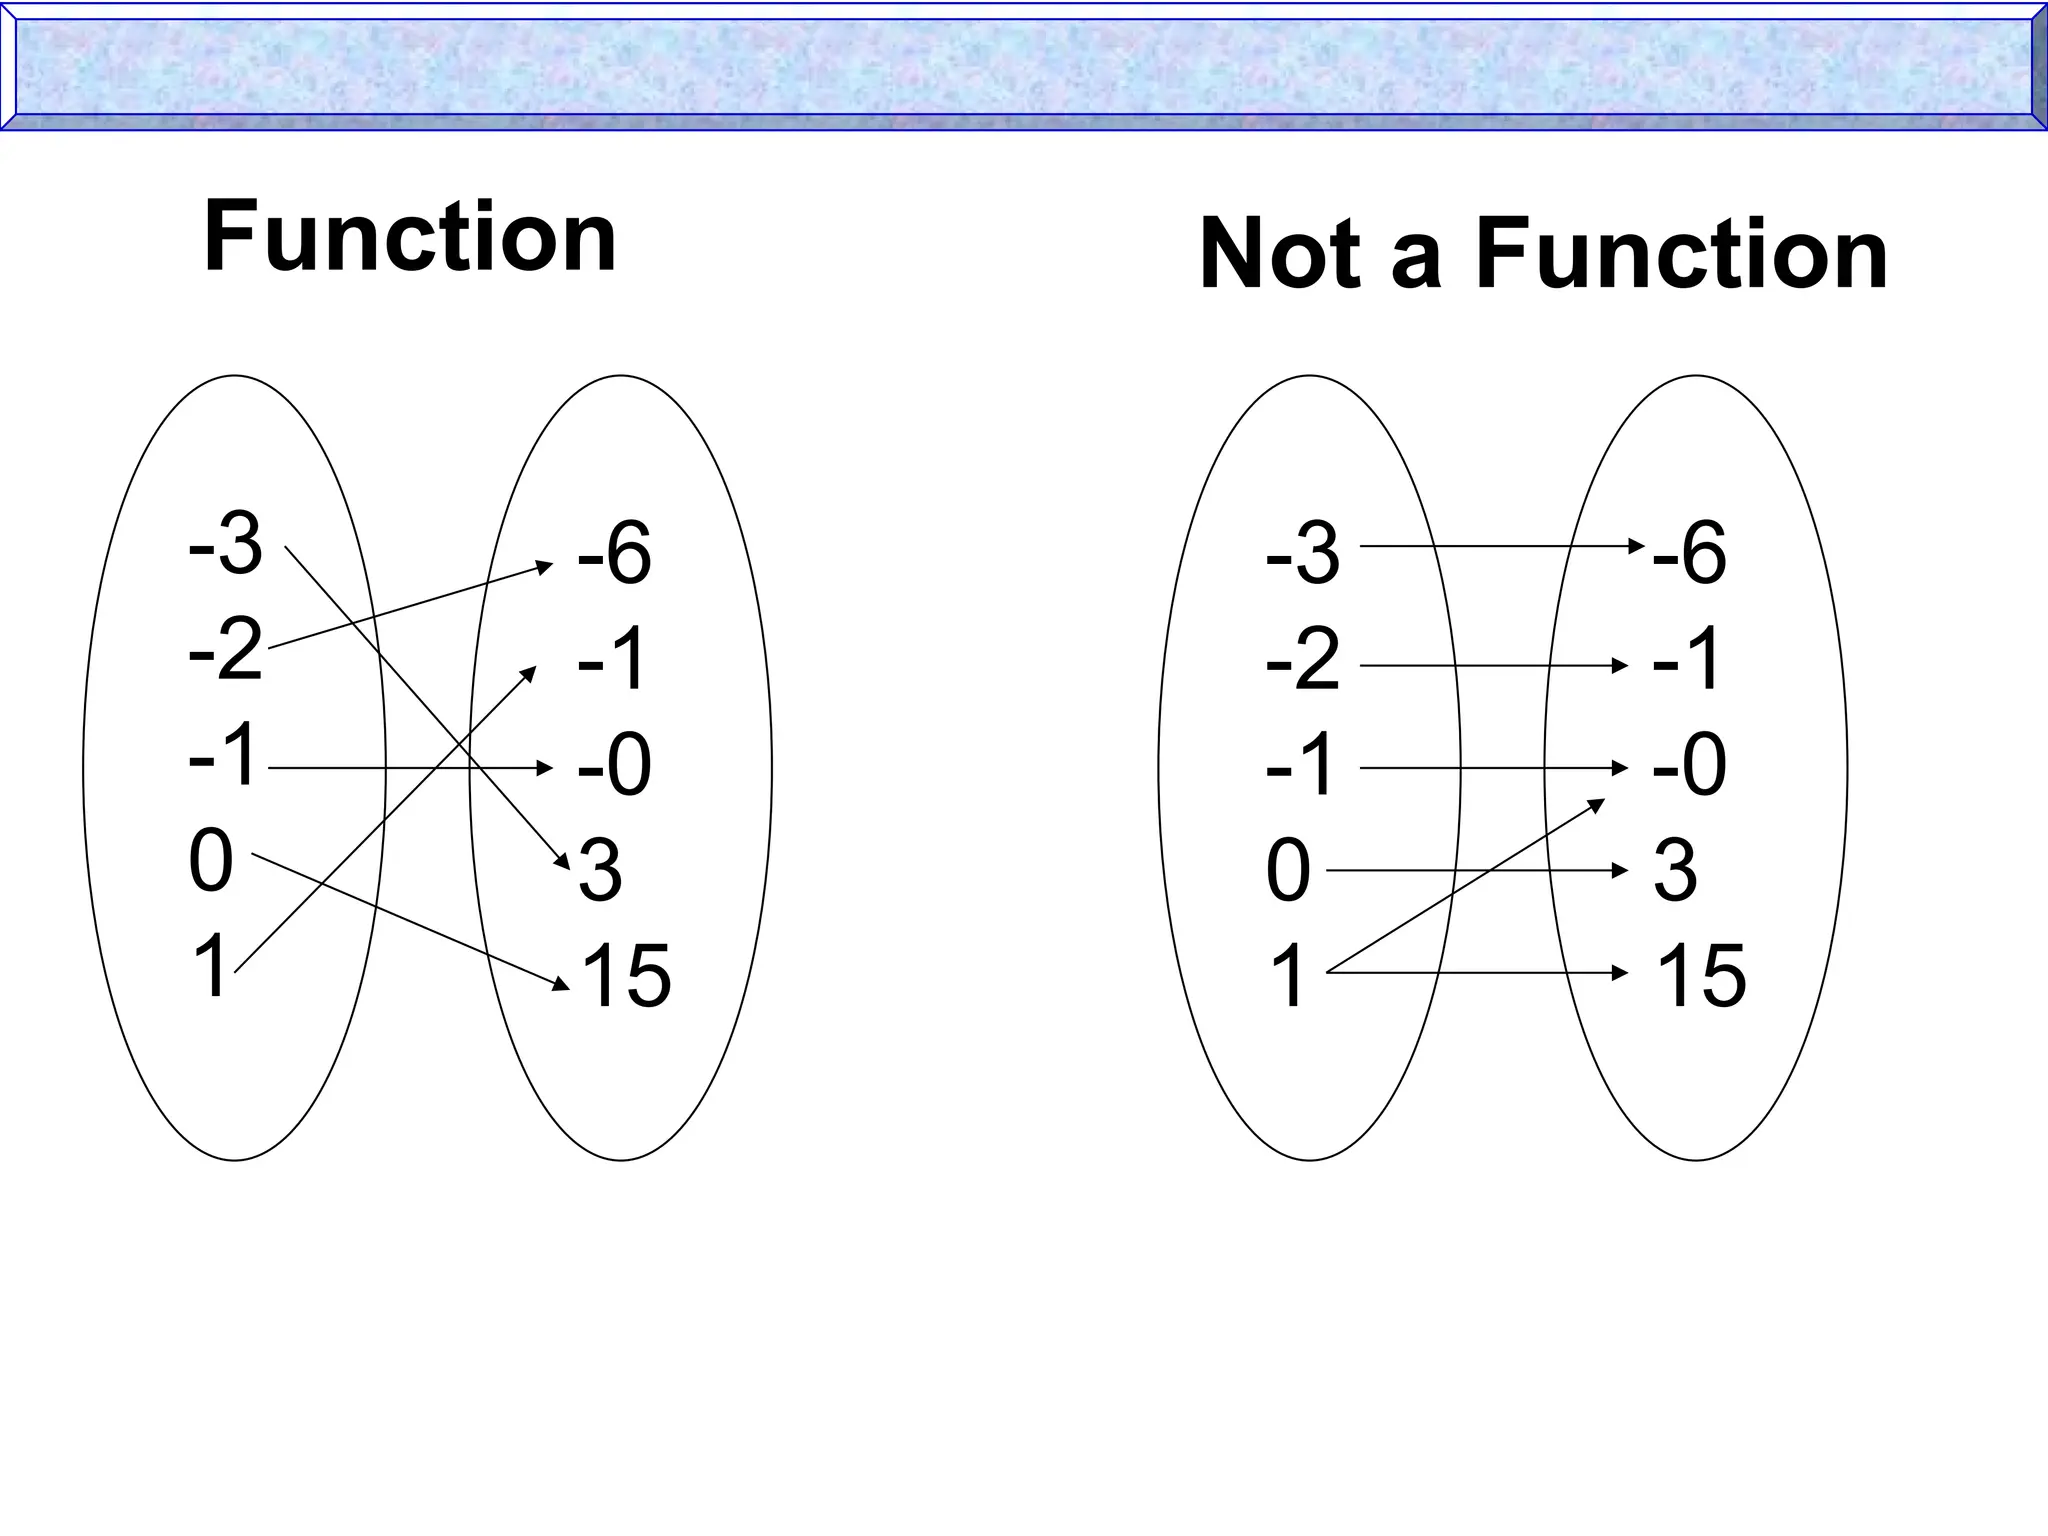
18.
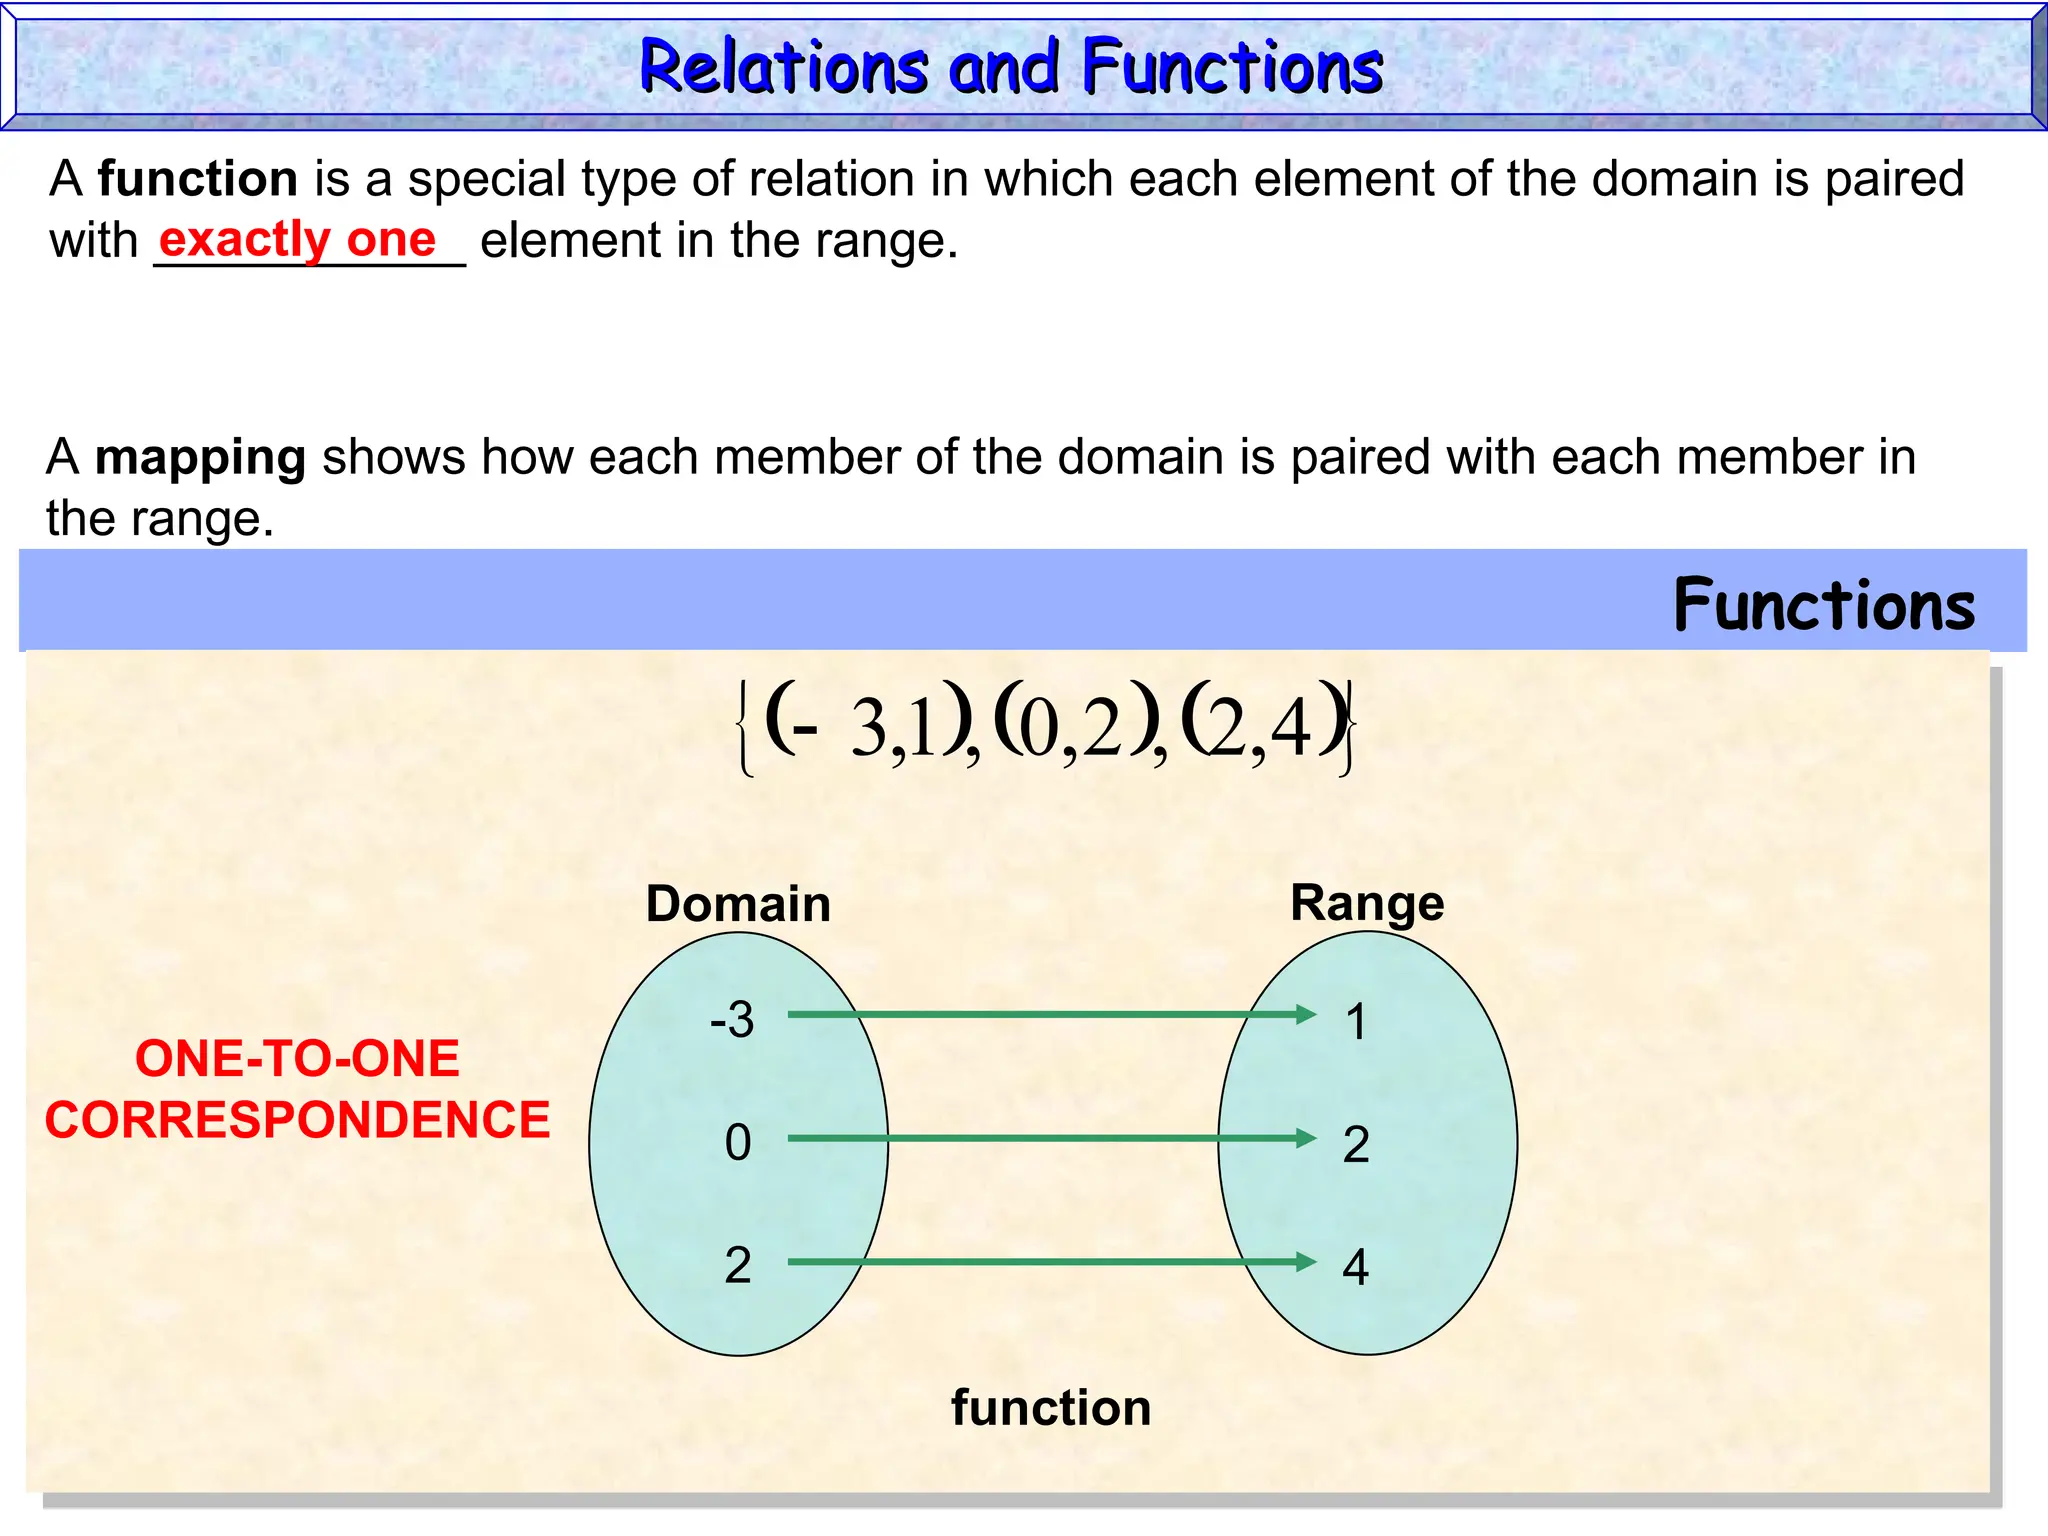
A function isa special type of relation in which each element of the domain is paired
with ___________ element in the range.
exactly one
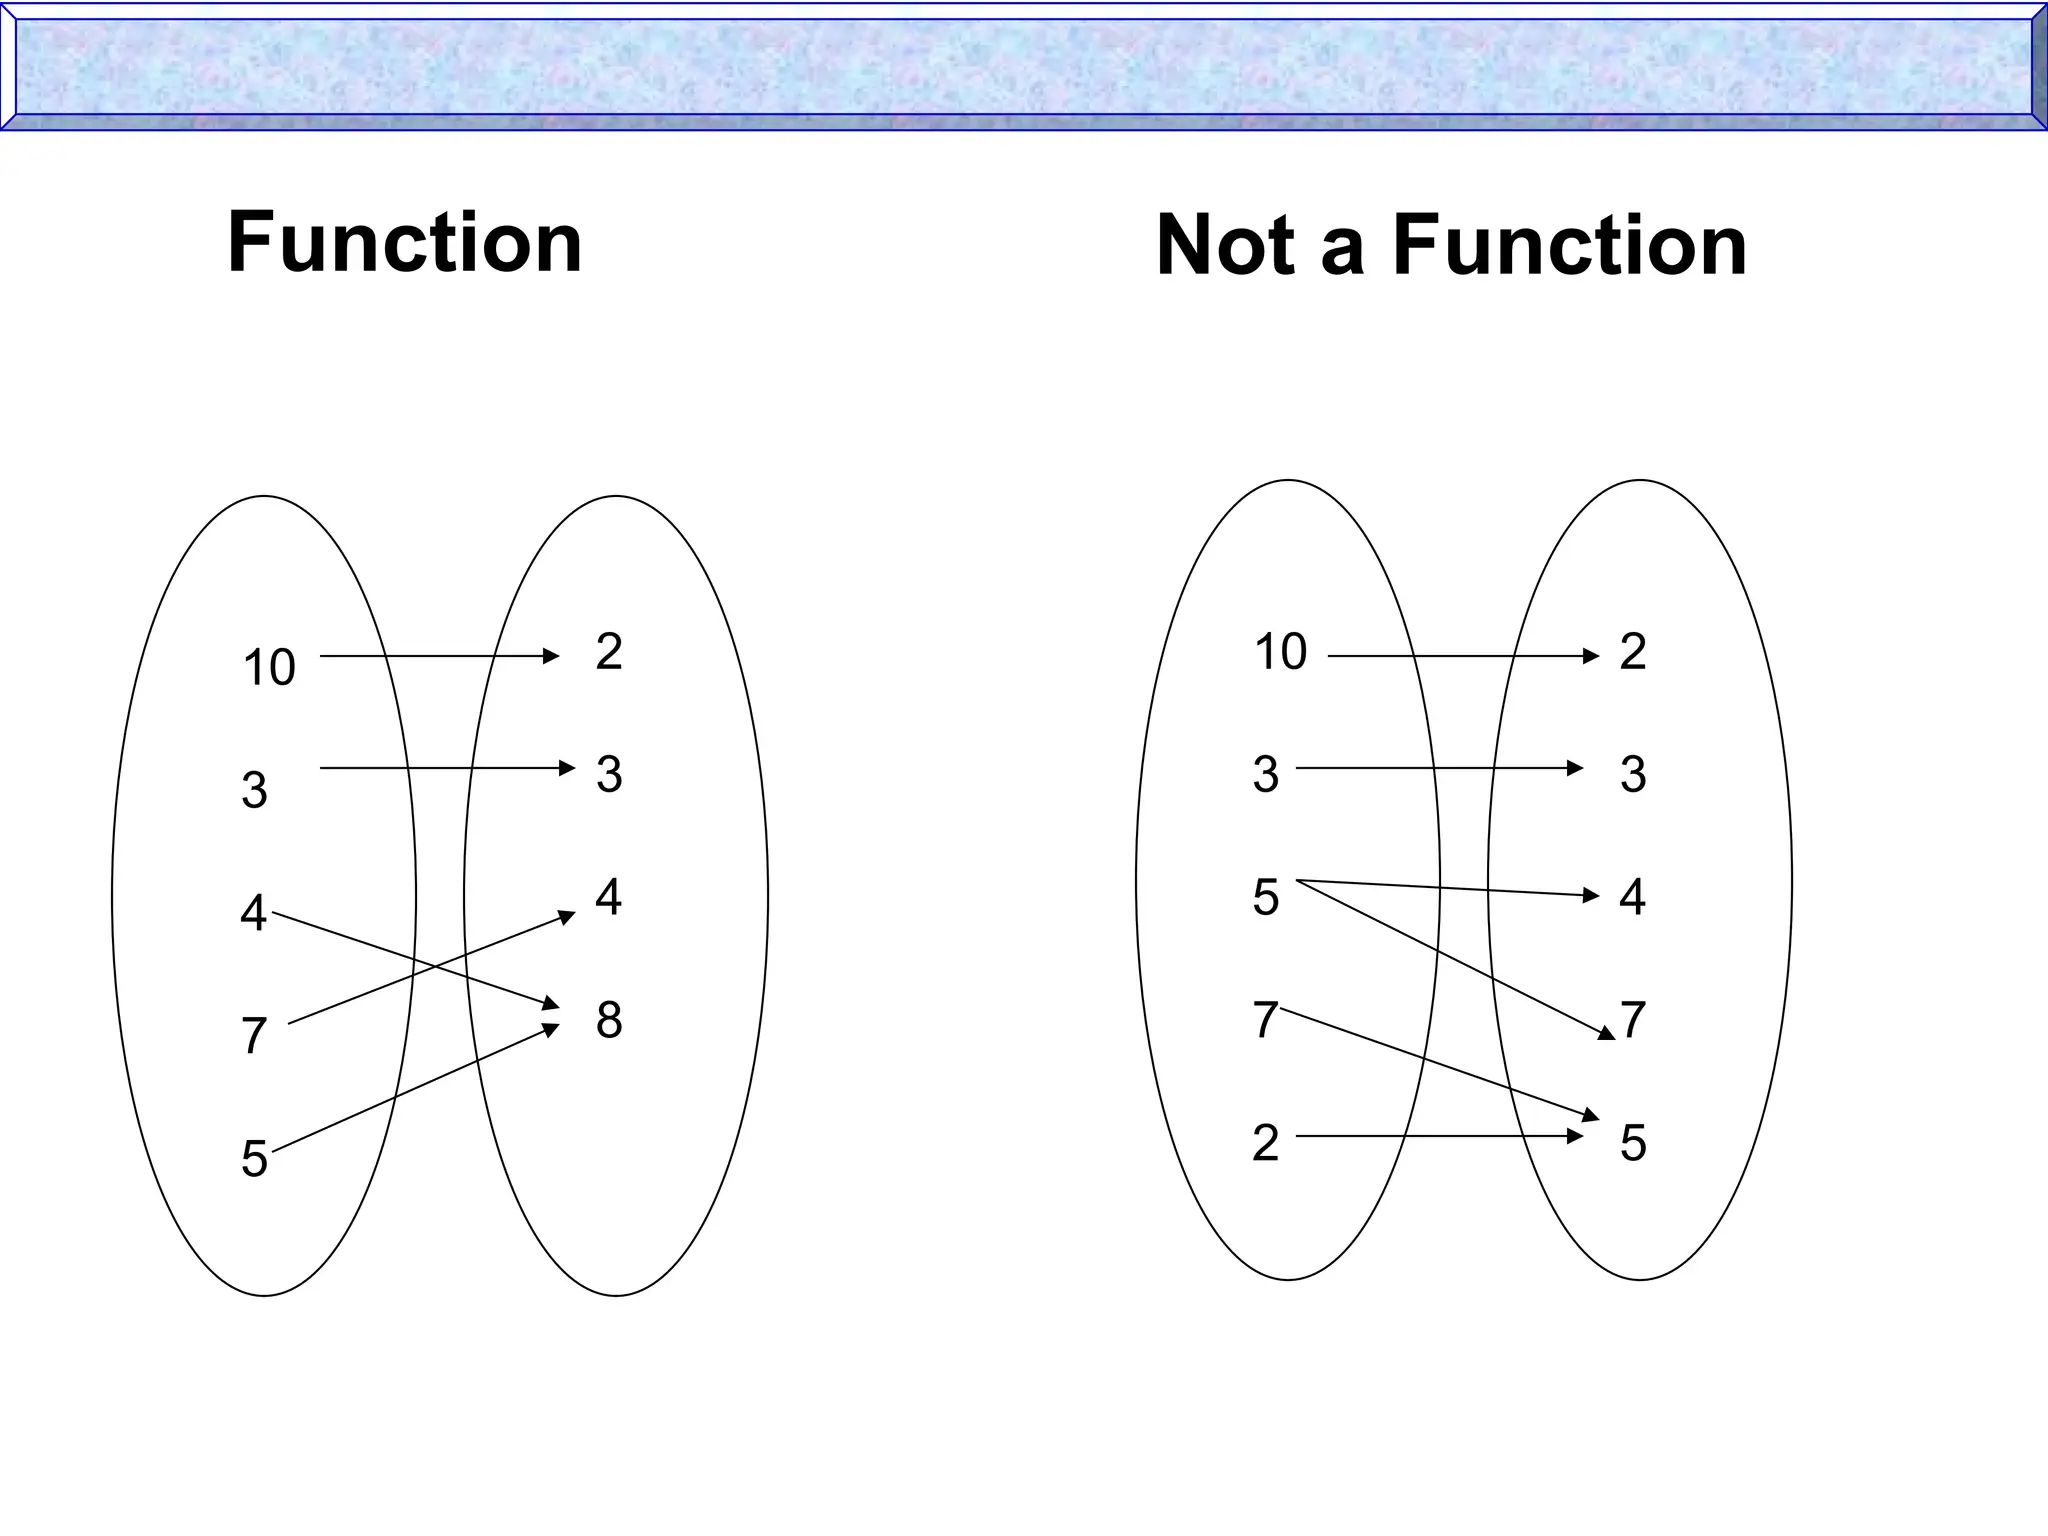
A mapping shows how each member of the domain is paired with each member in
the range.
Functions
4
,
2
,
2
,
0
,
1
,
3
Domain Range
-3
0
2
1
2
4
function
Relations and Functions
Relations and Functions
ONE-TO-ONE
CORRESPONDENCE
19.
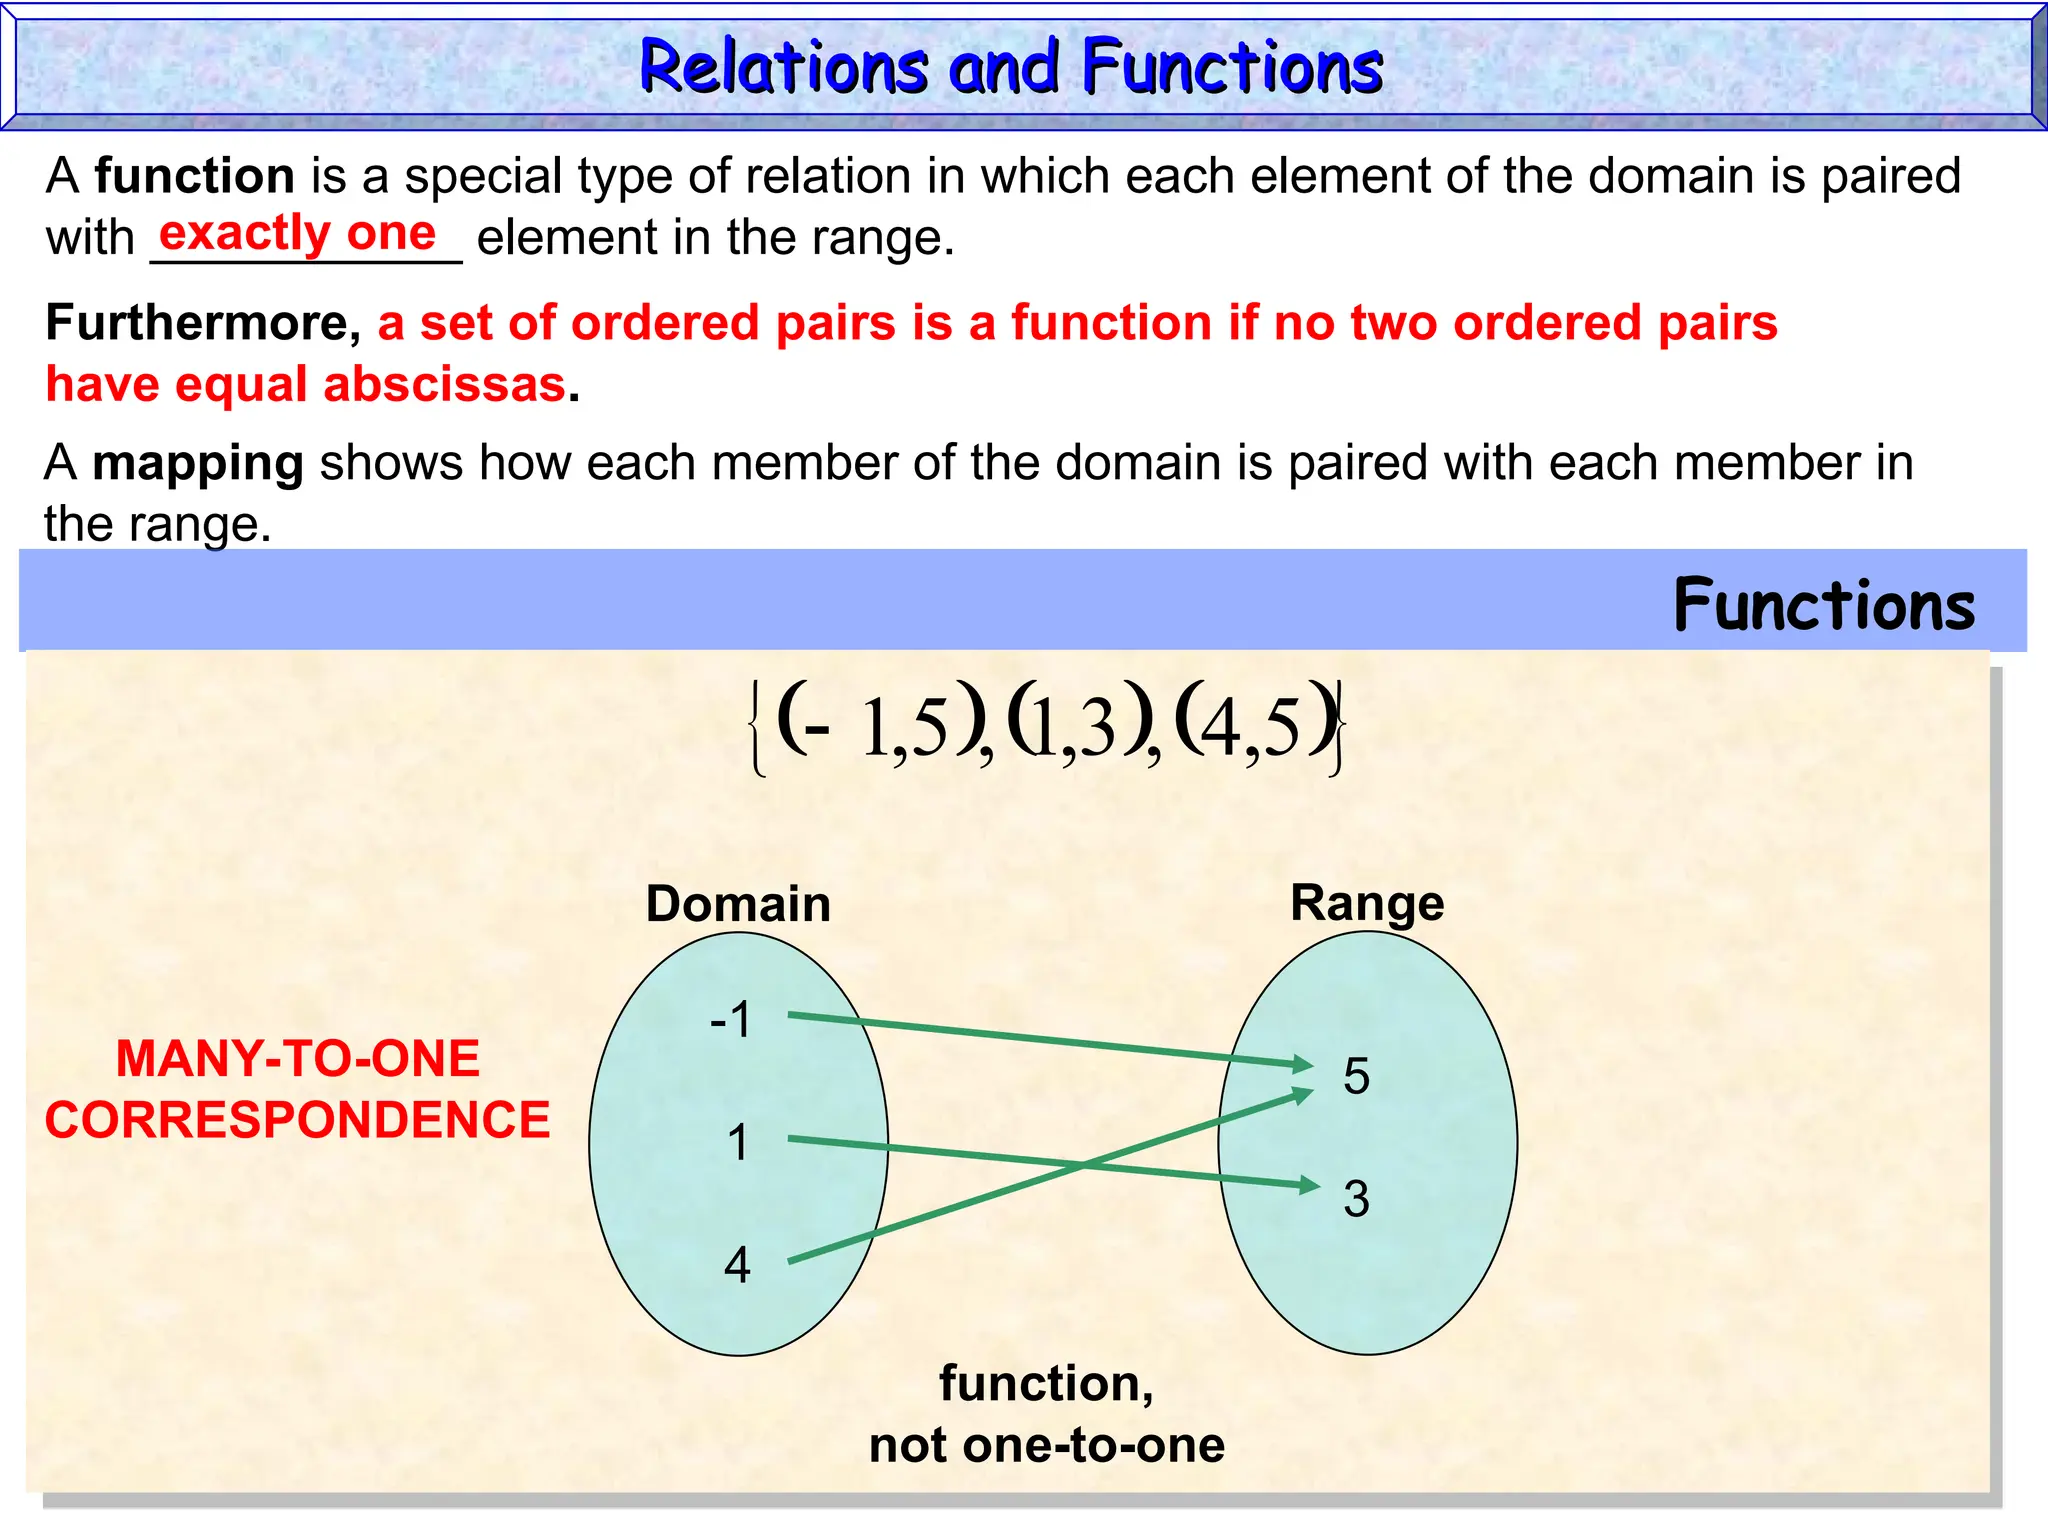
A function isa special type of relation in which each element of the domain is paired
with ___________ element in the range.
exactly one
A mapping shows how each member of the domain is paired with each member in
the range.
Functions
5
,
4
,
3
,
1
,
5
,
1
Domain Range
-1
1
4
5
3
function,
not one-to-one
Relations and Functions
Relations and Functions
MANY-TO-ONE
CORRESPONDENCE
Furthermore, a set of ordered pairs is a function if no two ordered pairs
have equal abscissas.
20.
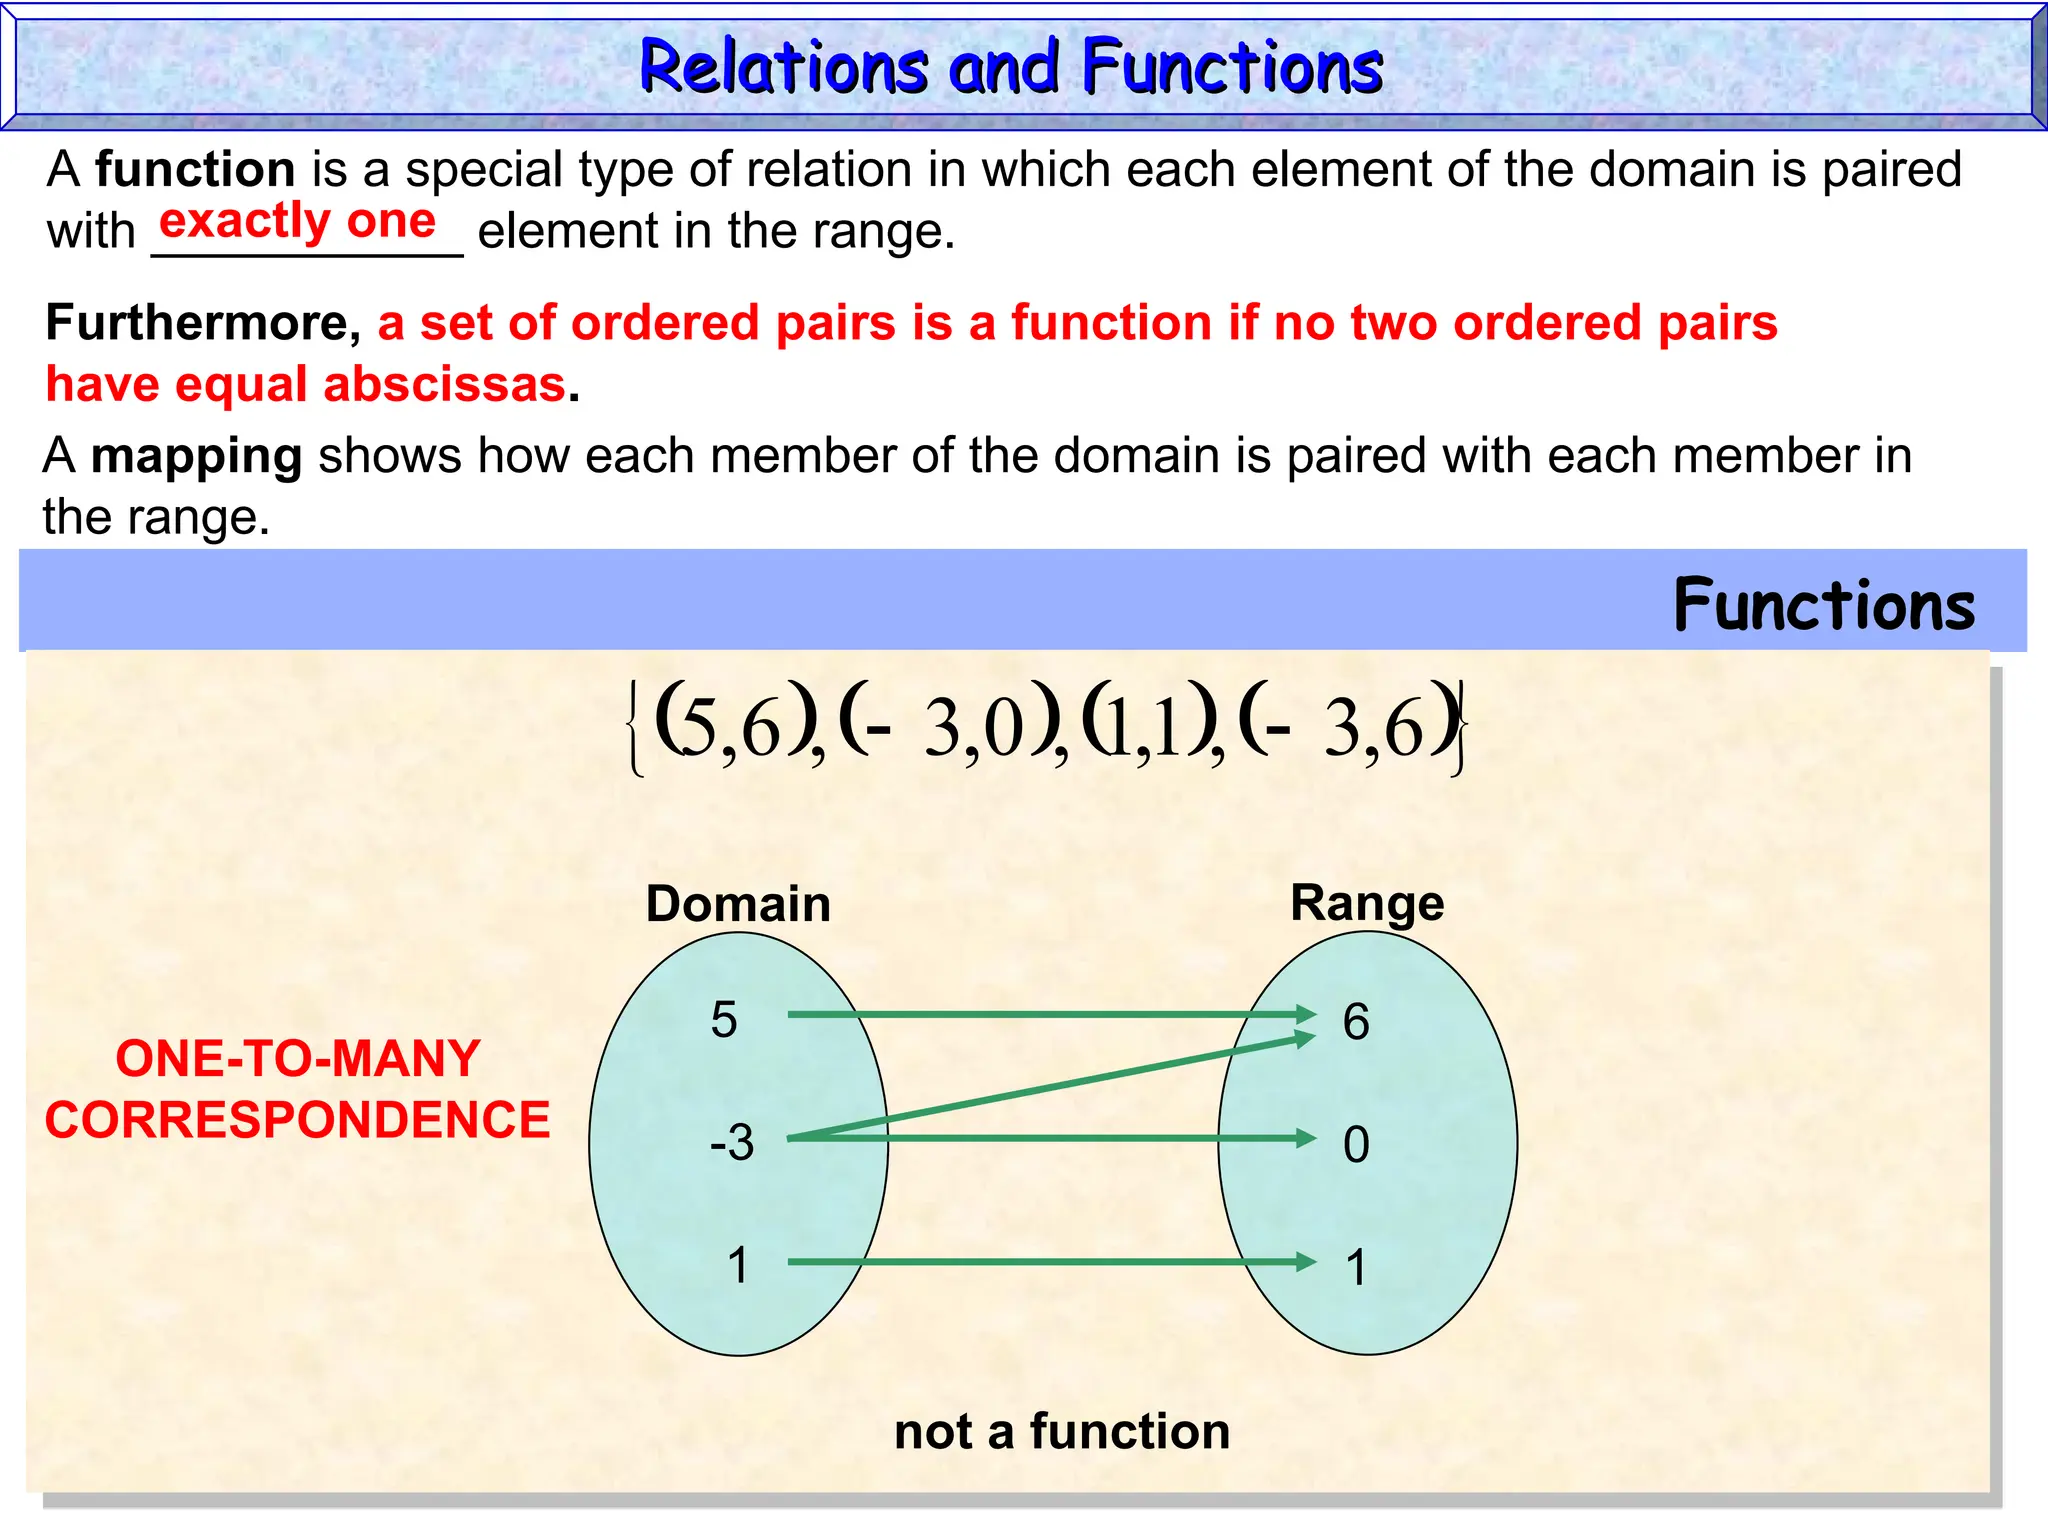
A function isa special type of relation in which each element of the domain is paired
with ___________ element in the range.
exactly one
A mapping shows how each member of the domain is paired with each member in
the range.
Functions
6
,
3
,
1
,
1
,
0
,
3
,
6
,
5
Domain Range
5
-3
1
6
0
1
not a function
Relations and Functions
Relations and Functions
ONE-TO-MANY
CORRESPONDENCE
Furthermore, a set of ordered pairs is a function if no two ordered pairs
have equal abscissas.
21.
y
x
(-4,3) (2,3)
(-1,-2)
(0,-4)
(3,-3)
State thedomain and range of the relation shown
in the graph. Is the relation a function?
The relation is:
{ (-4, 3), (-1, 2), (0, -4), (2, 3), (3, -3) }
The domain is:
{ -4, -1, 0, 2, 3 }
The range is:
{ -4, -3, -2, 3 }
Each member of the domain is paired with
Exactly one member of the range, so
this relation is a function.
Relations and Functions
Relations and Functions
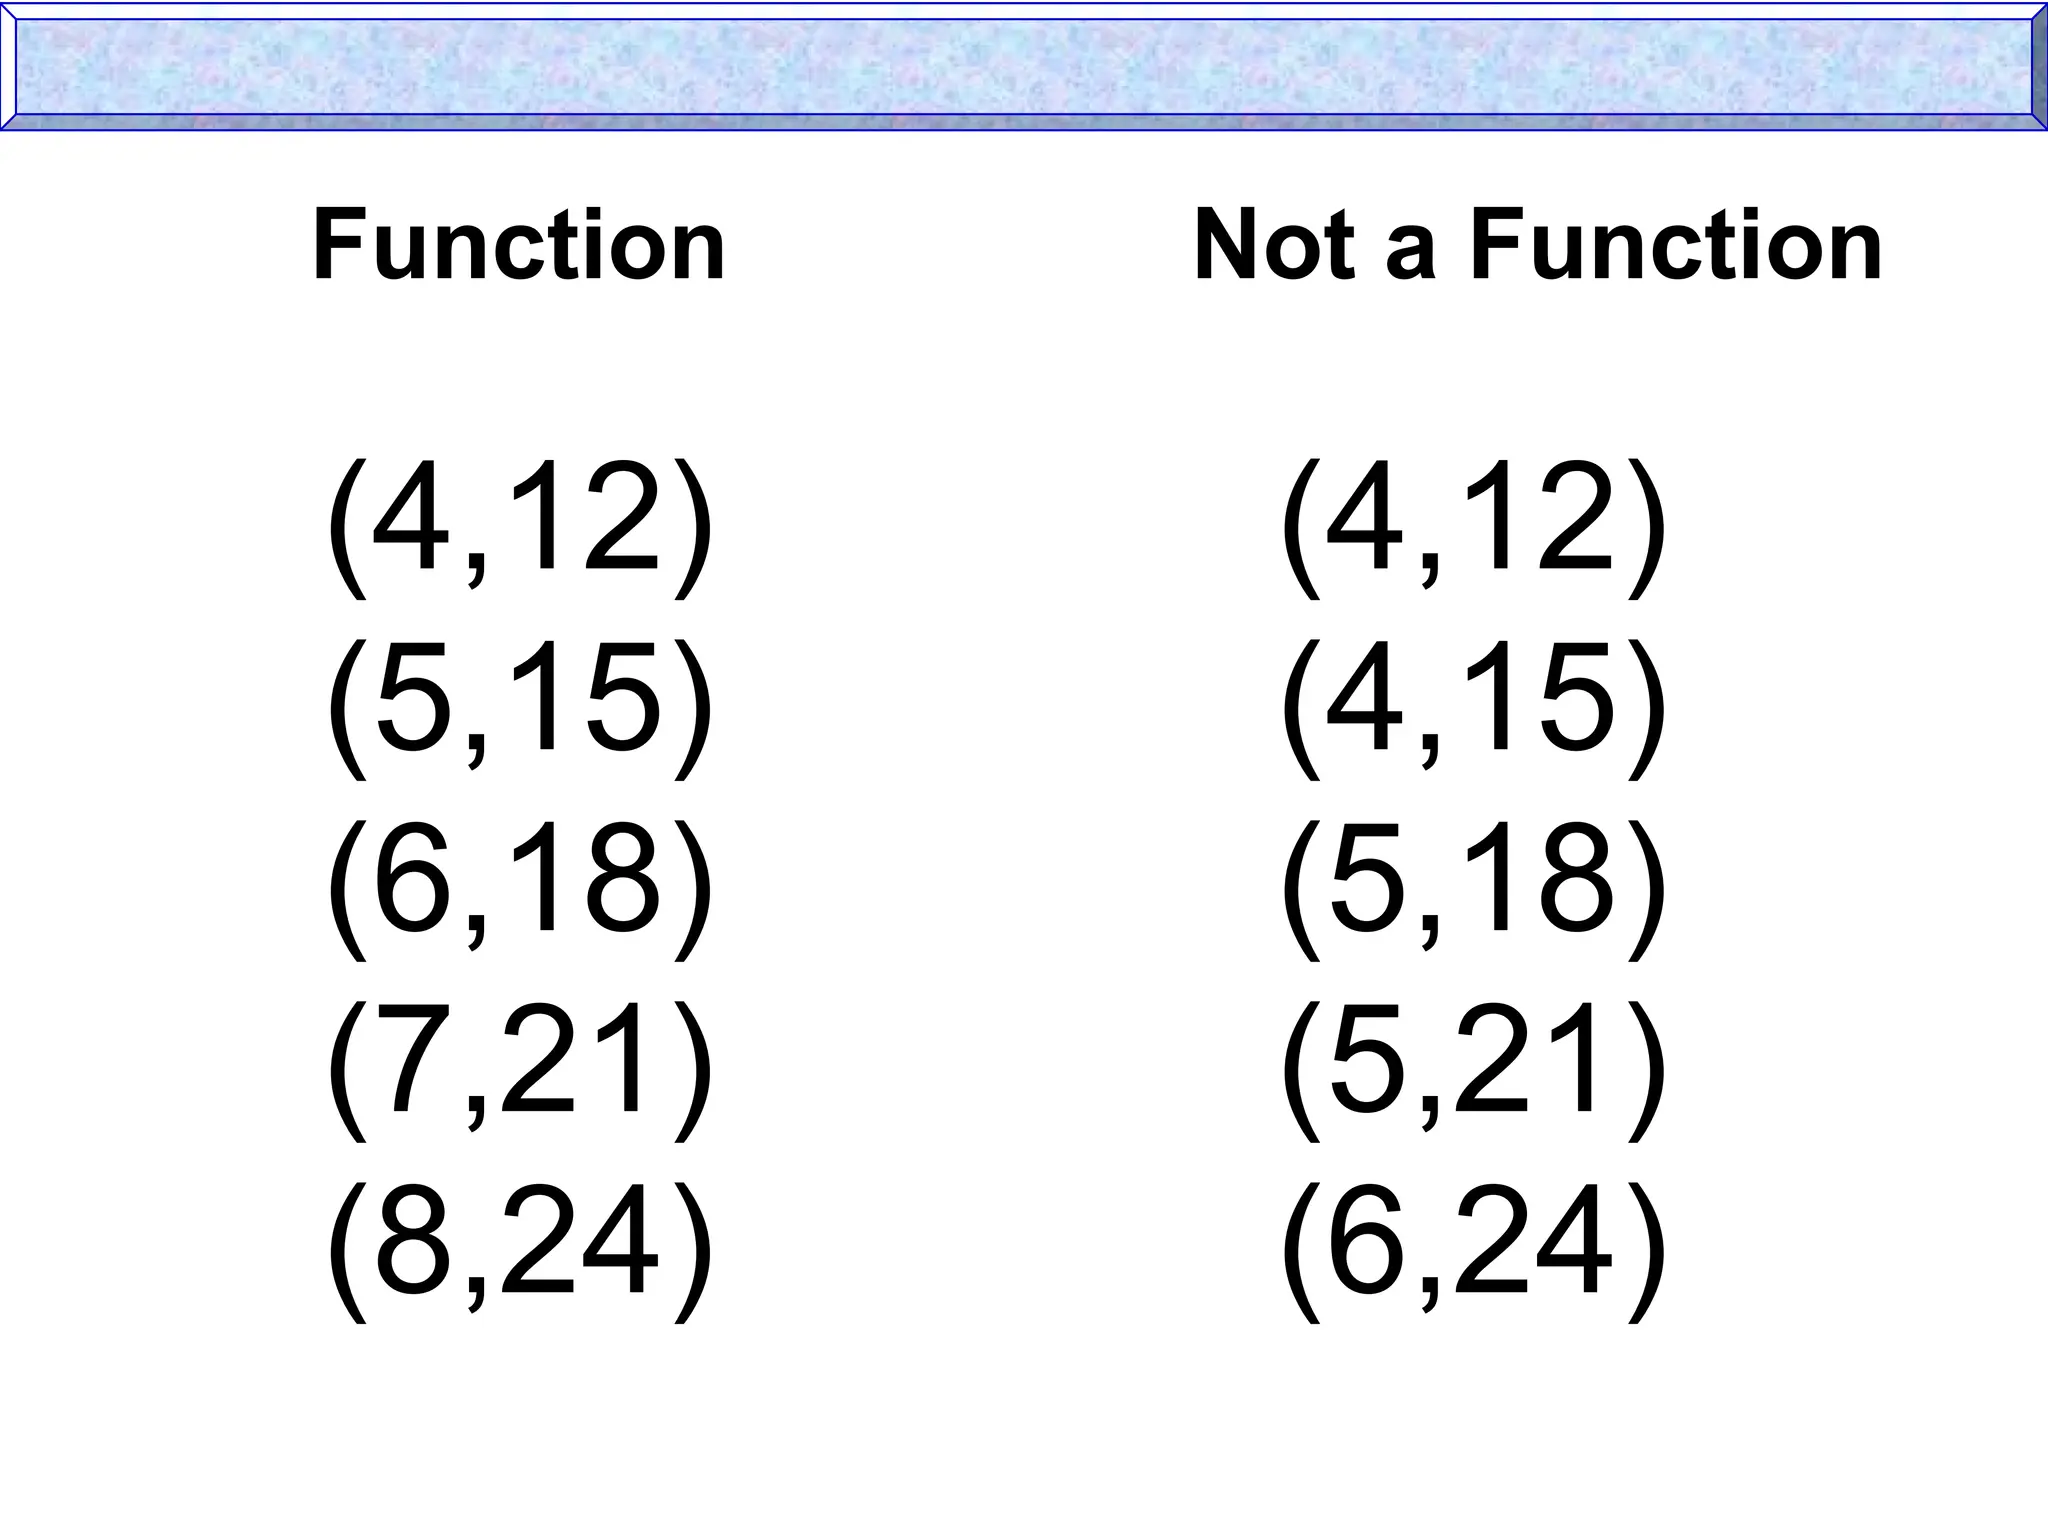
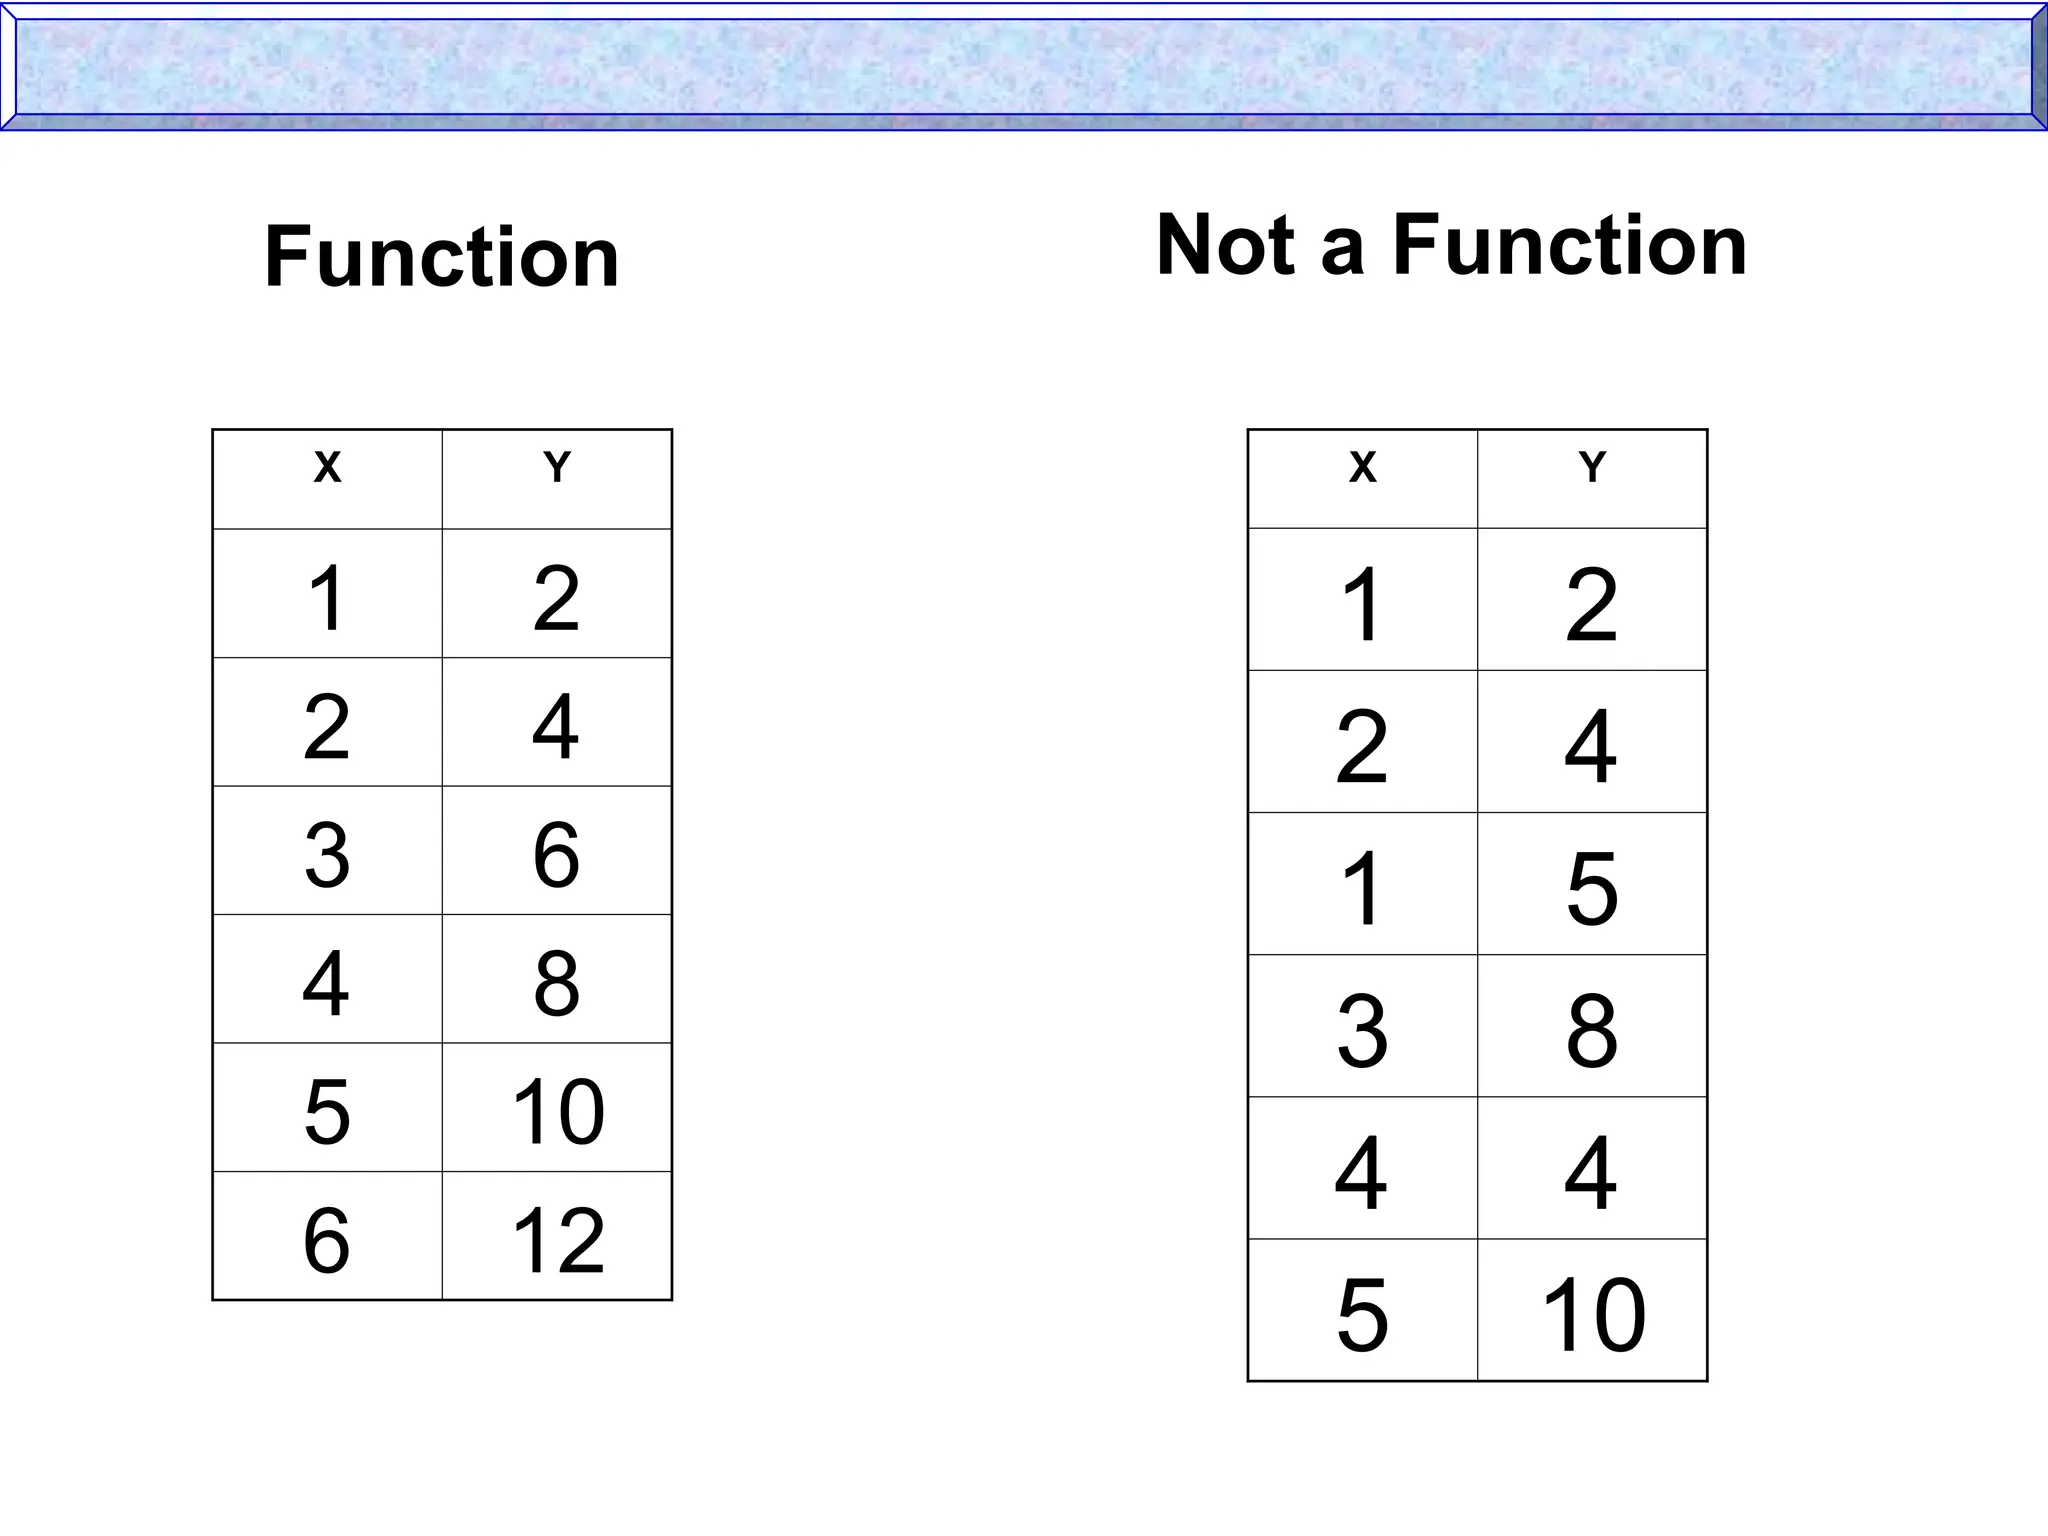
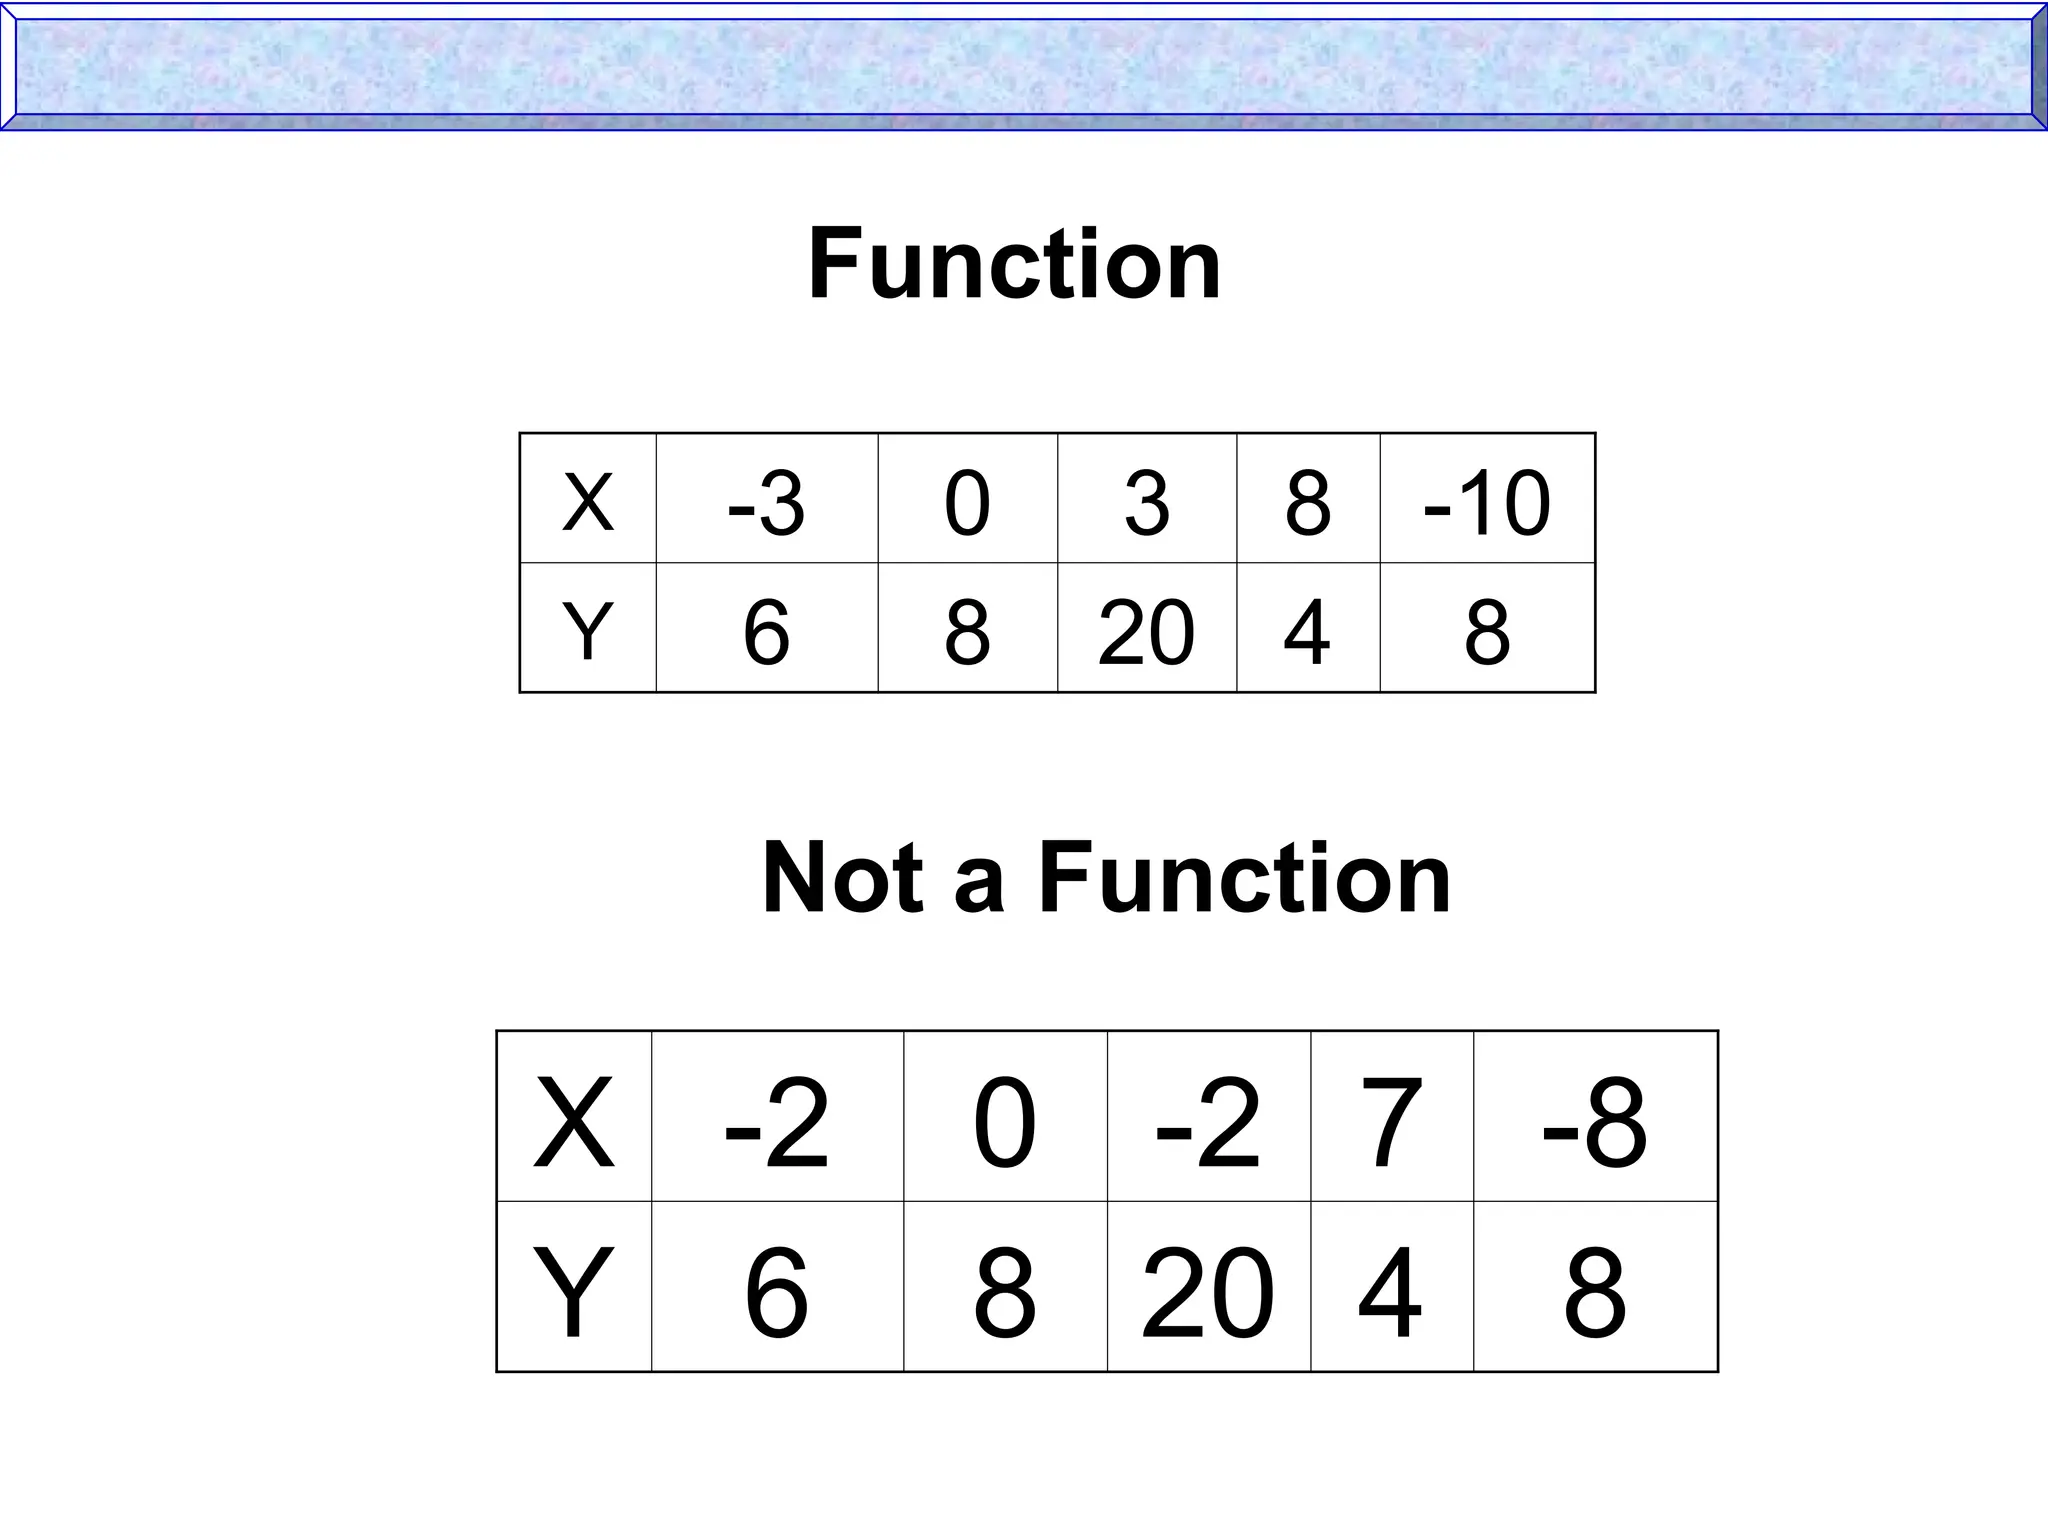
22.
Function Not aFunction
(4,12)
(5,15)
(6,18)
(7,21)
(8,24)
(4,12)
(4,15)
(5,18)
(5,21)
(6,24)
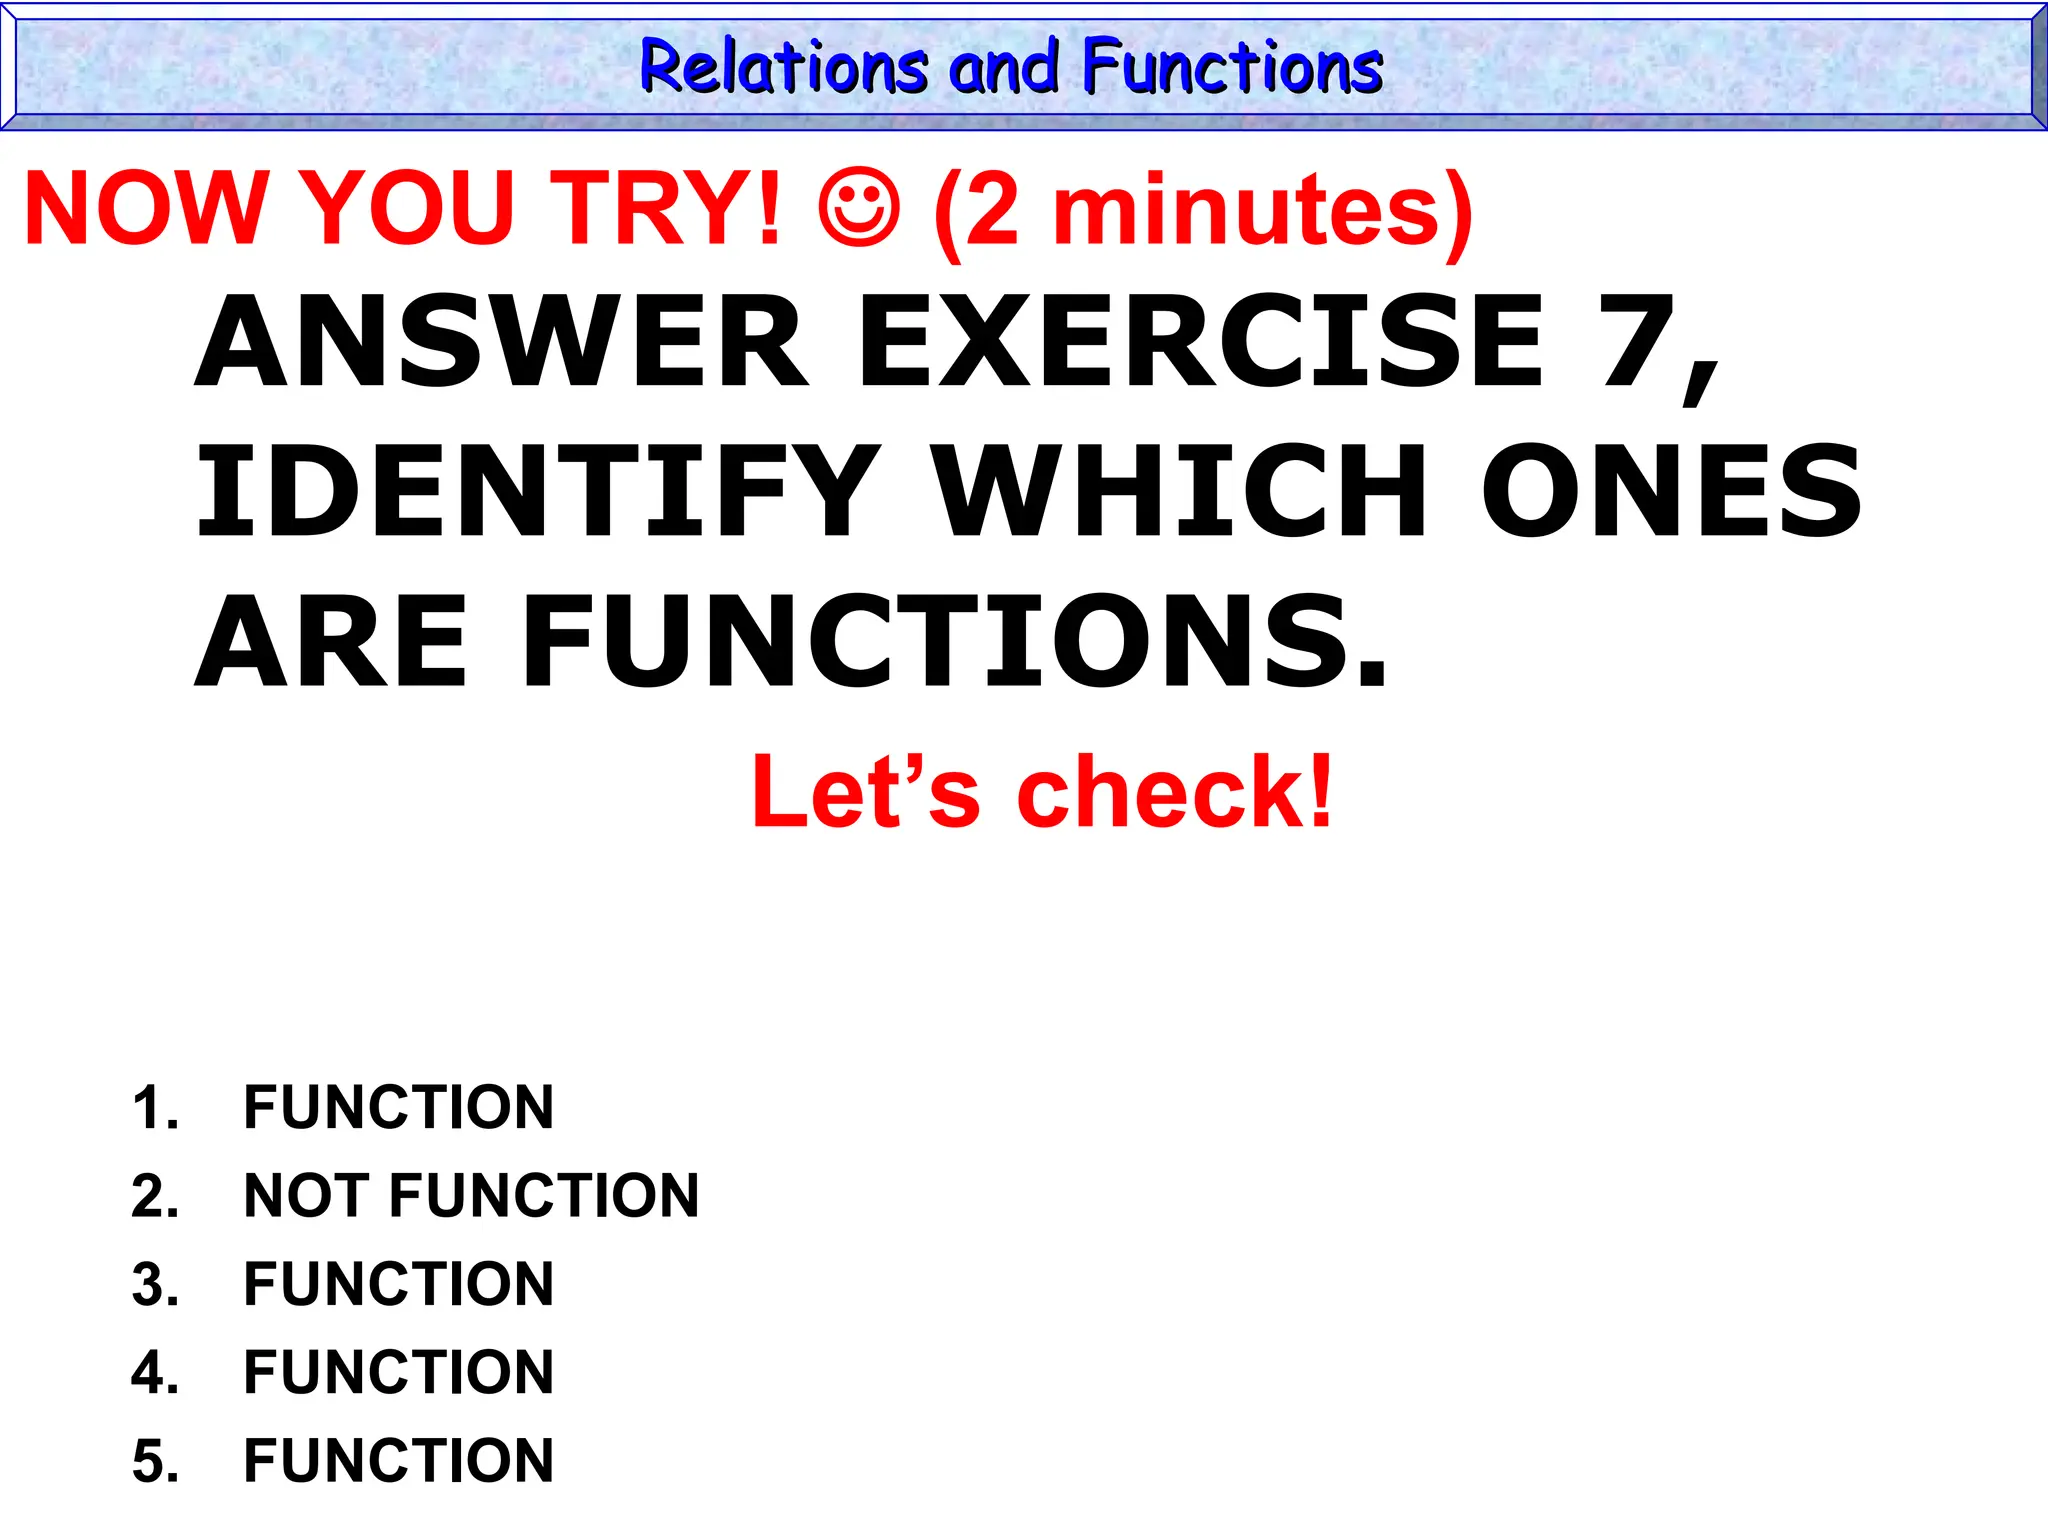
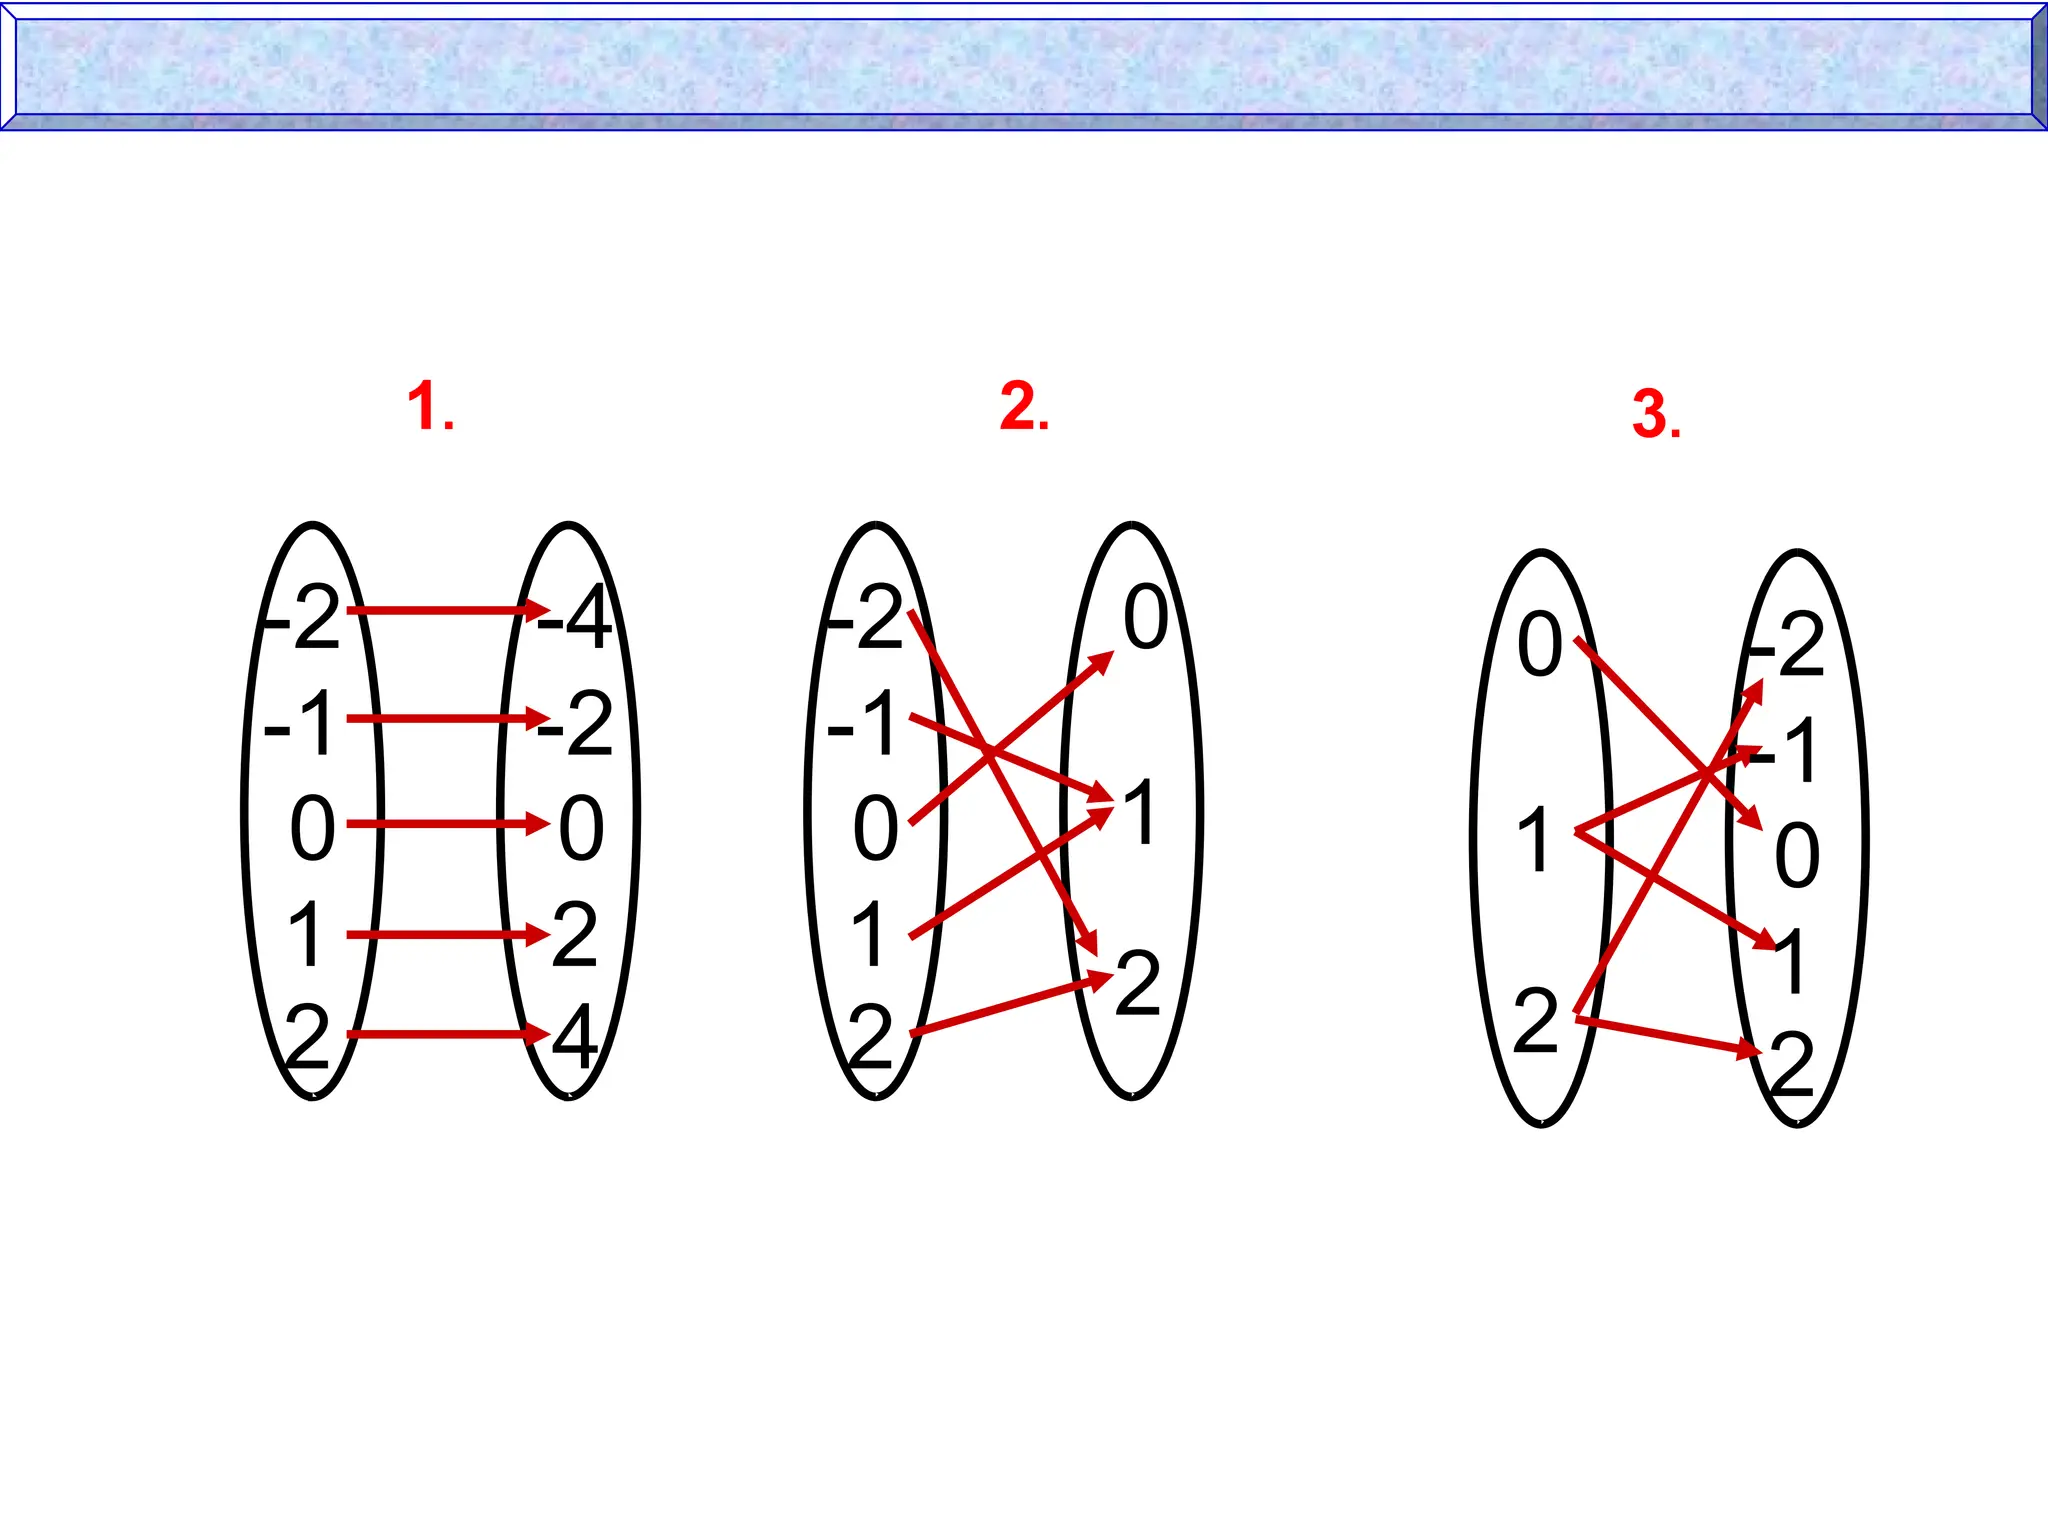
ANSWER EXERCISE 7,
IDENTIFYWHICH ONES
ARE FUNCTIONS.
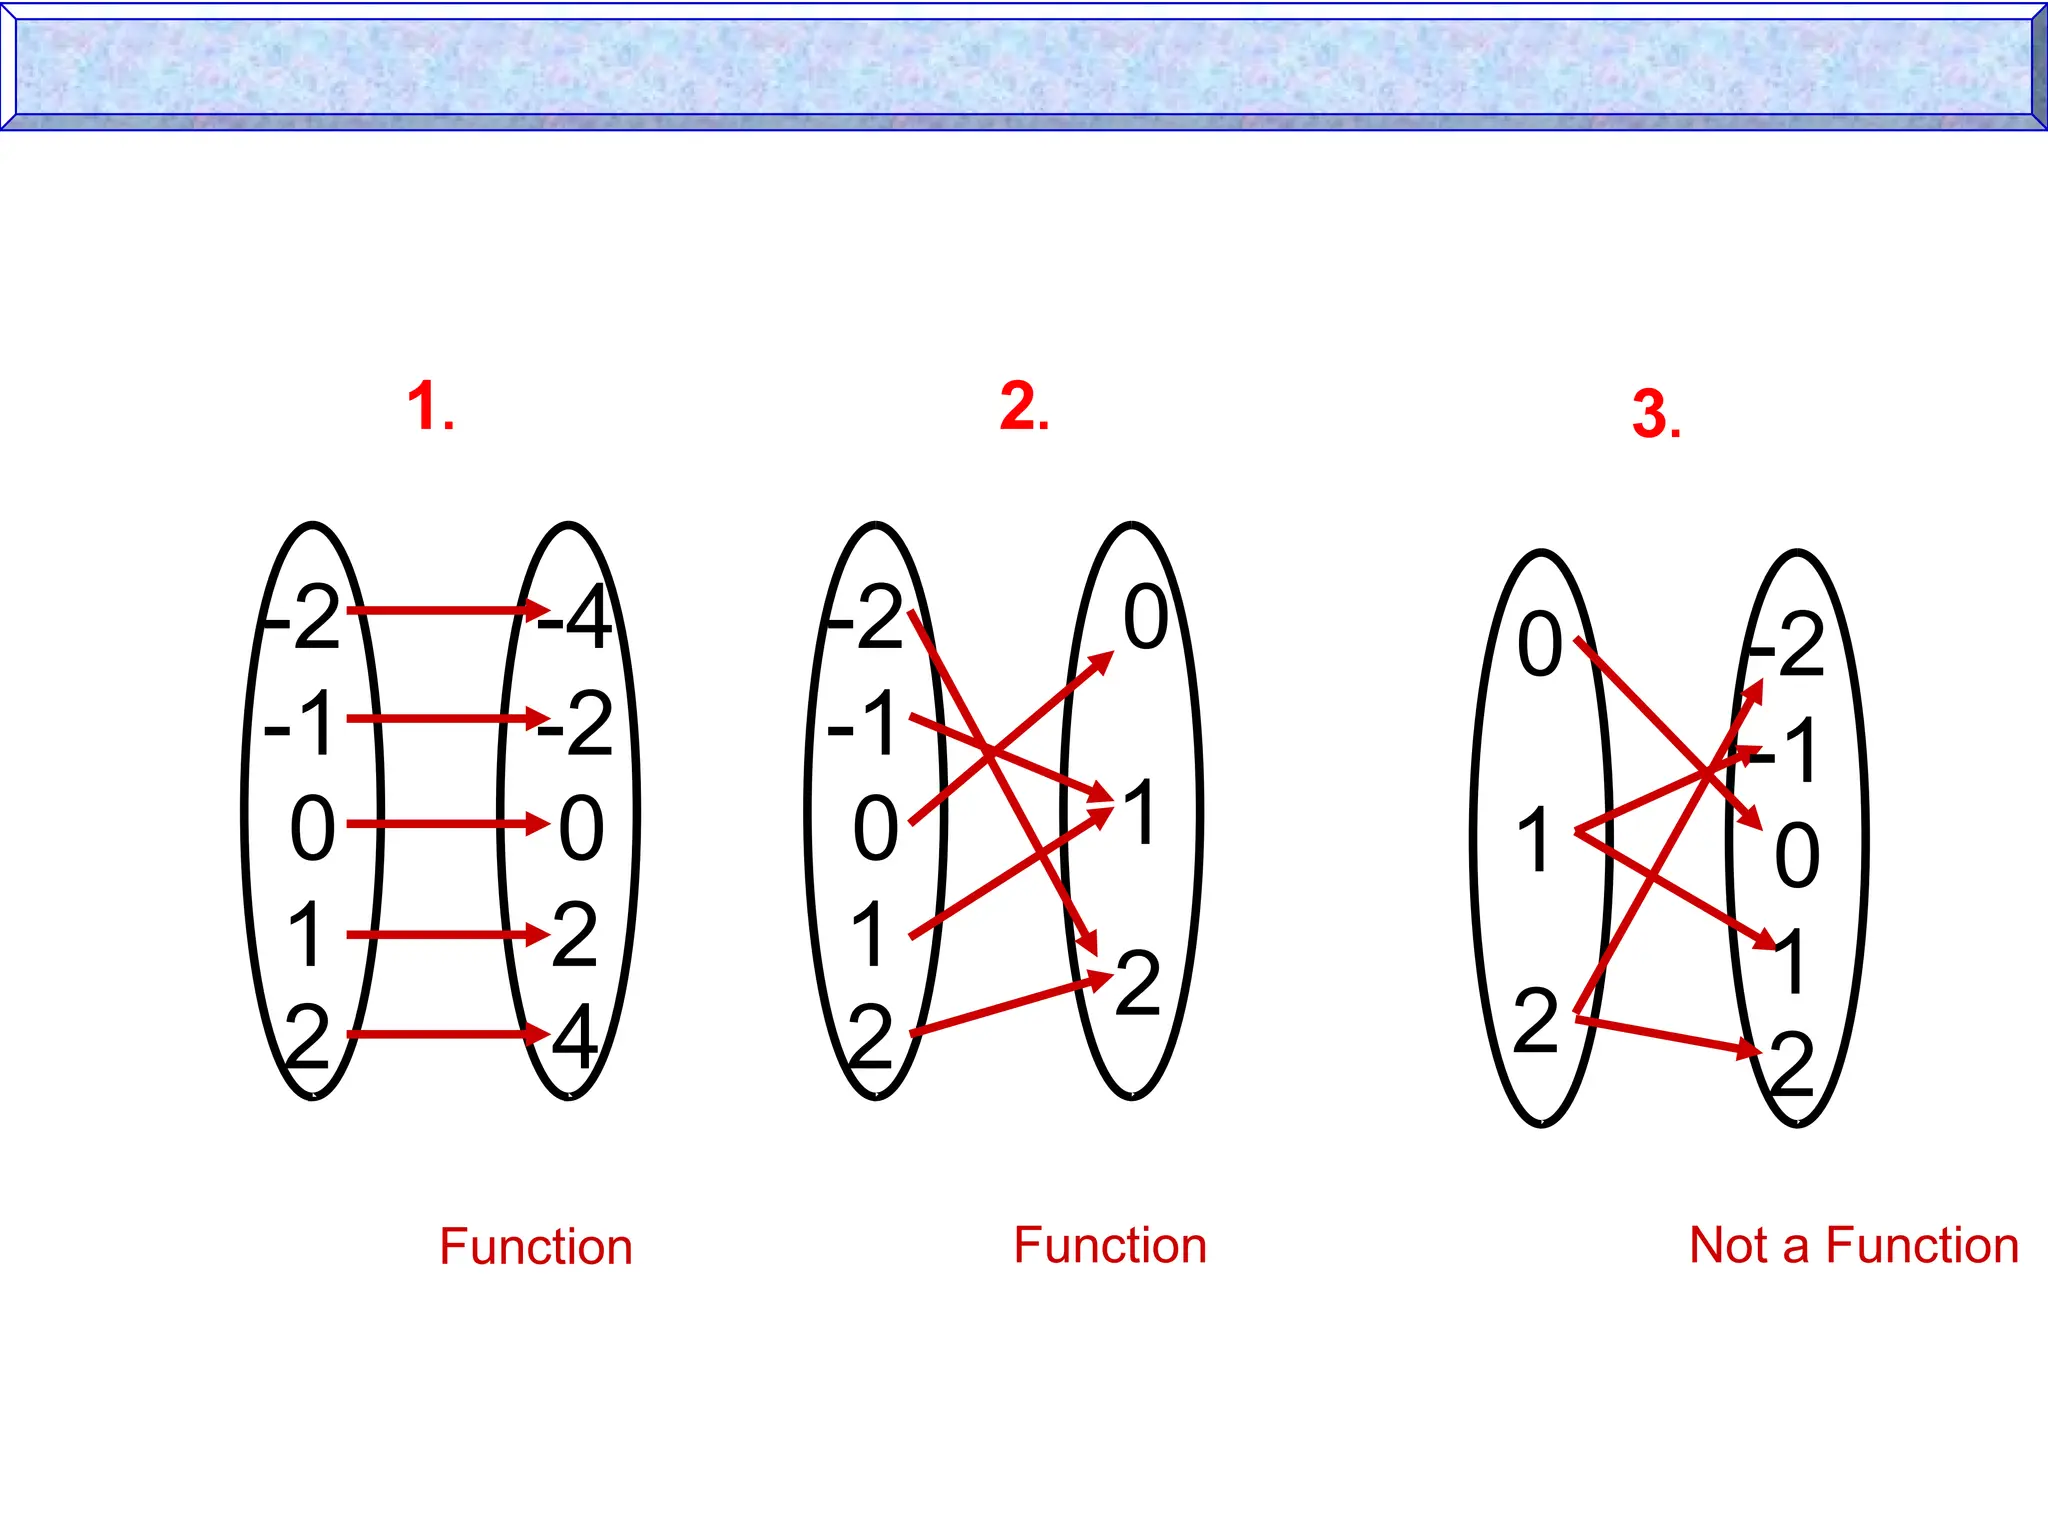
1. FUNCTION
2. NOT FUNCTION
3. FUNCTION
4. FUNCTION
5. FUNCTION
Relations and Functions
Relations and Functions
Let’s check!
NOW YOU TRY! (2 minutes)
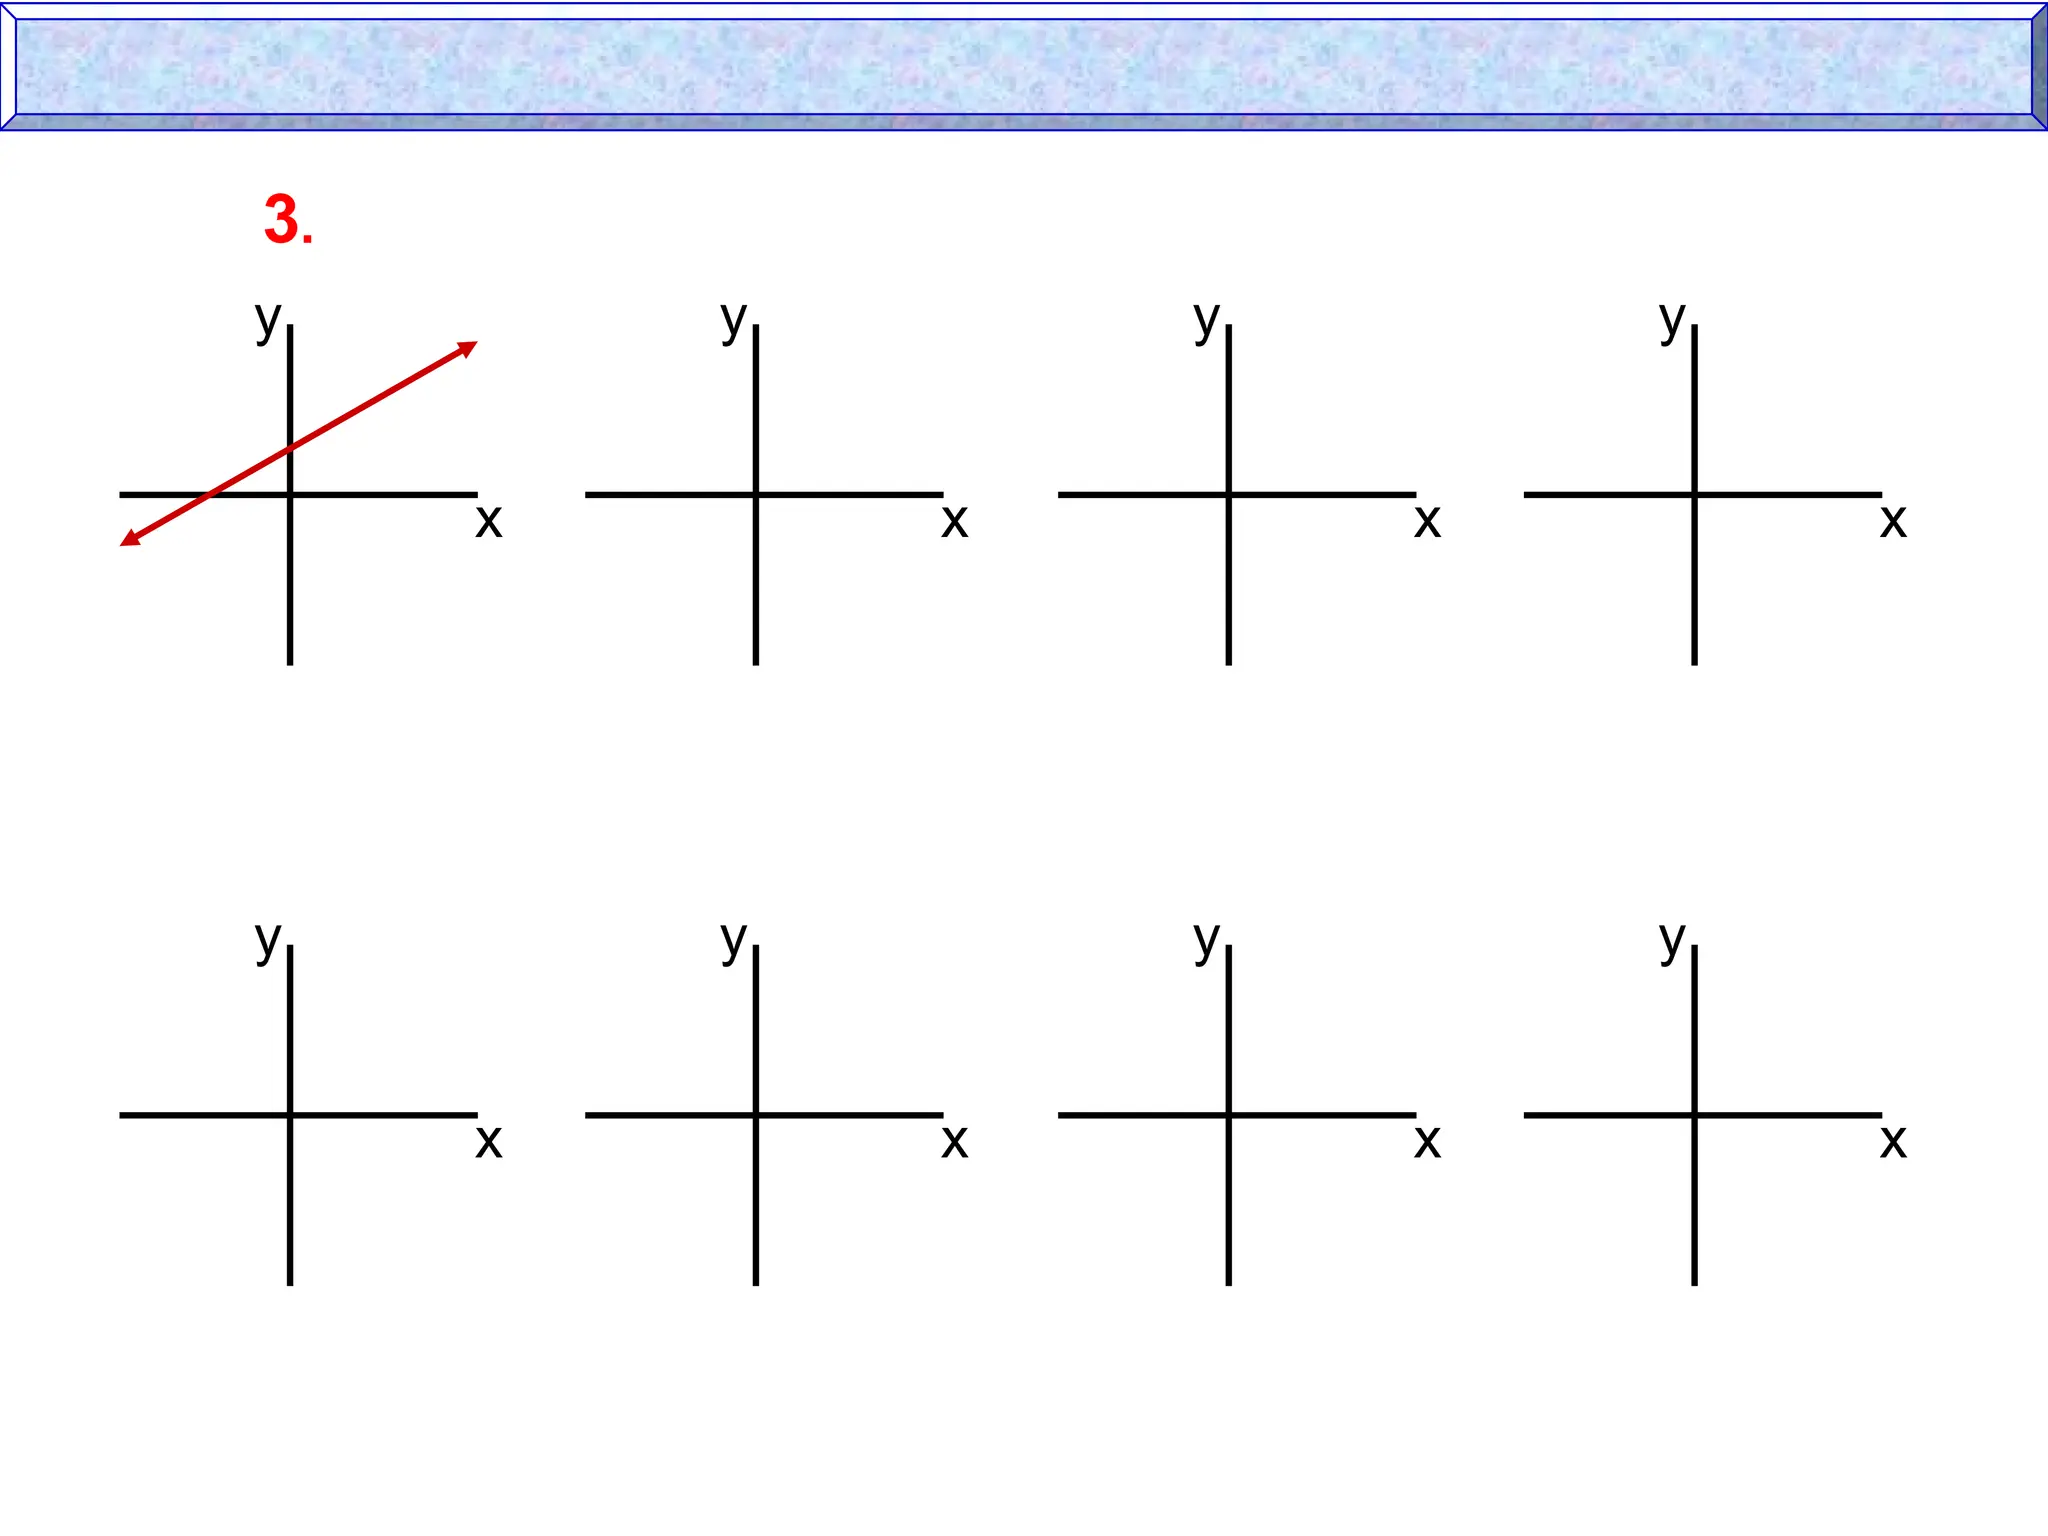
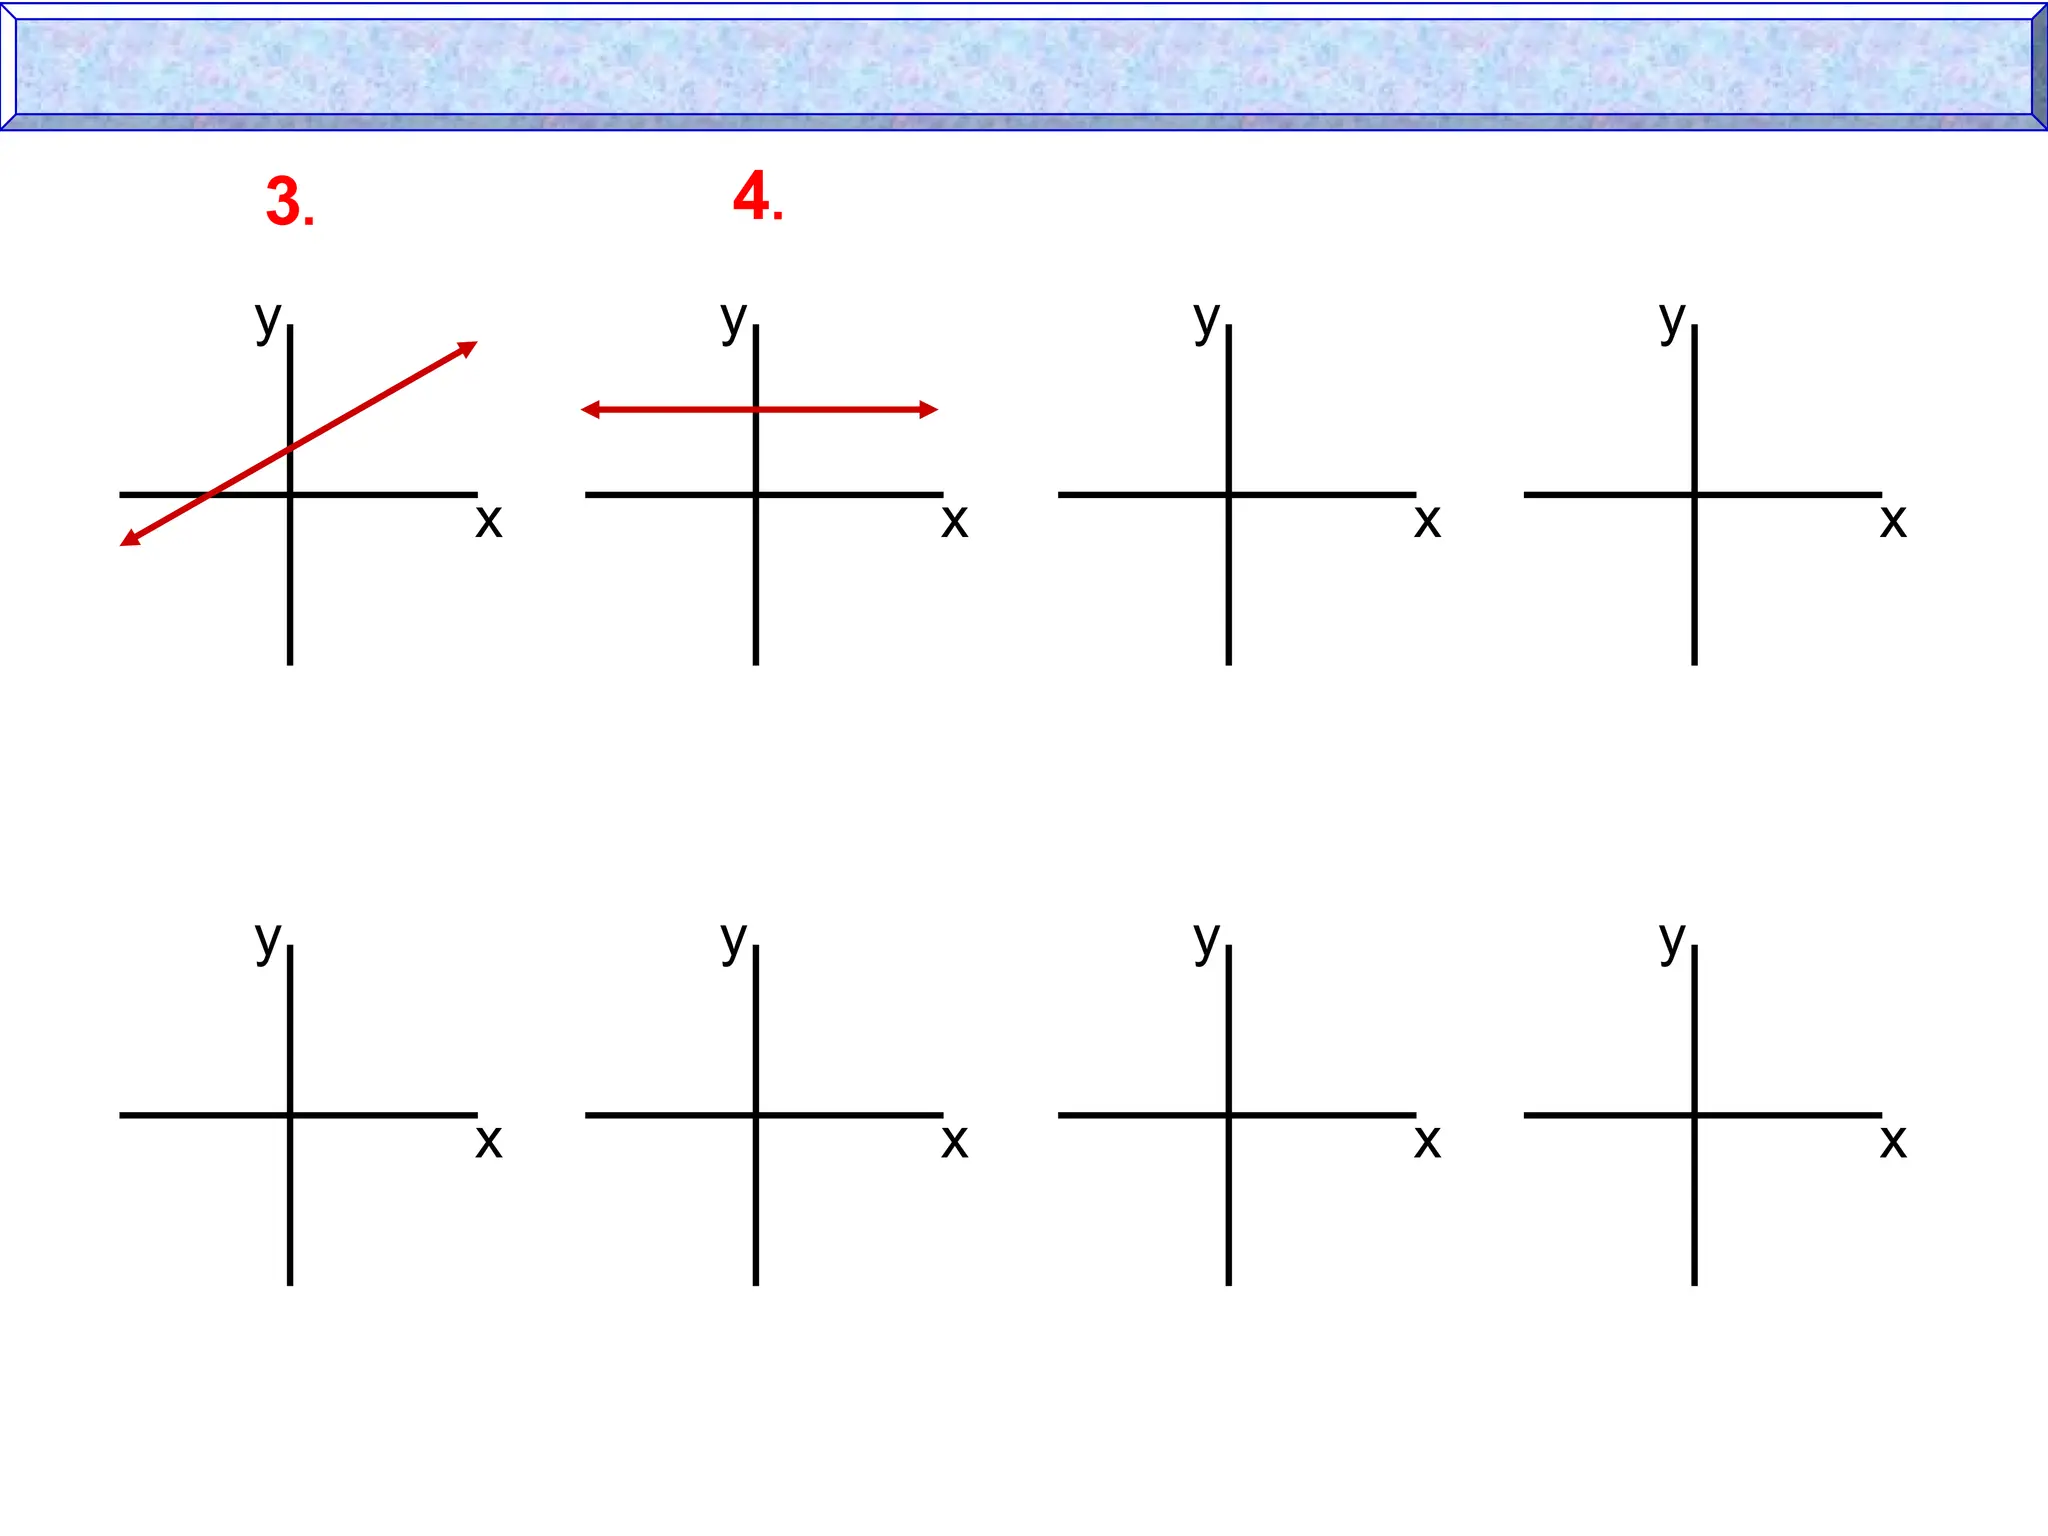
28.
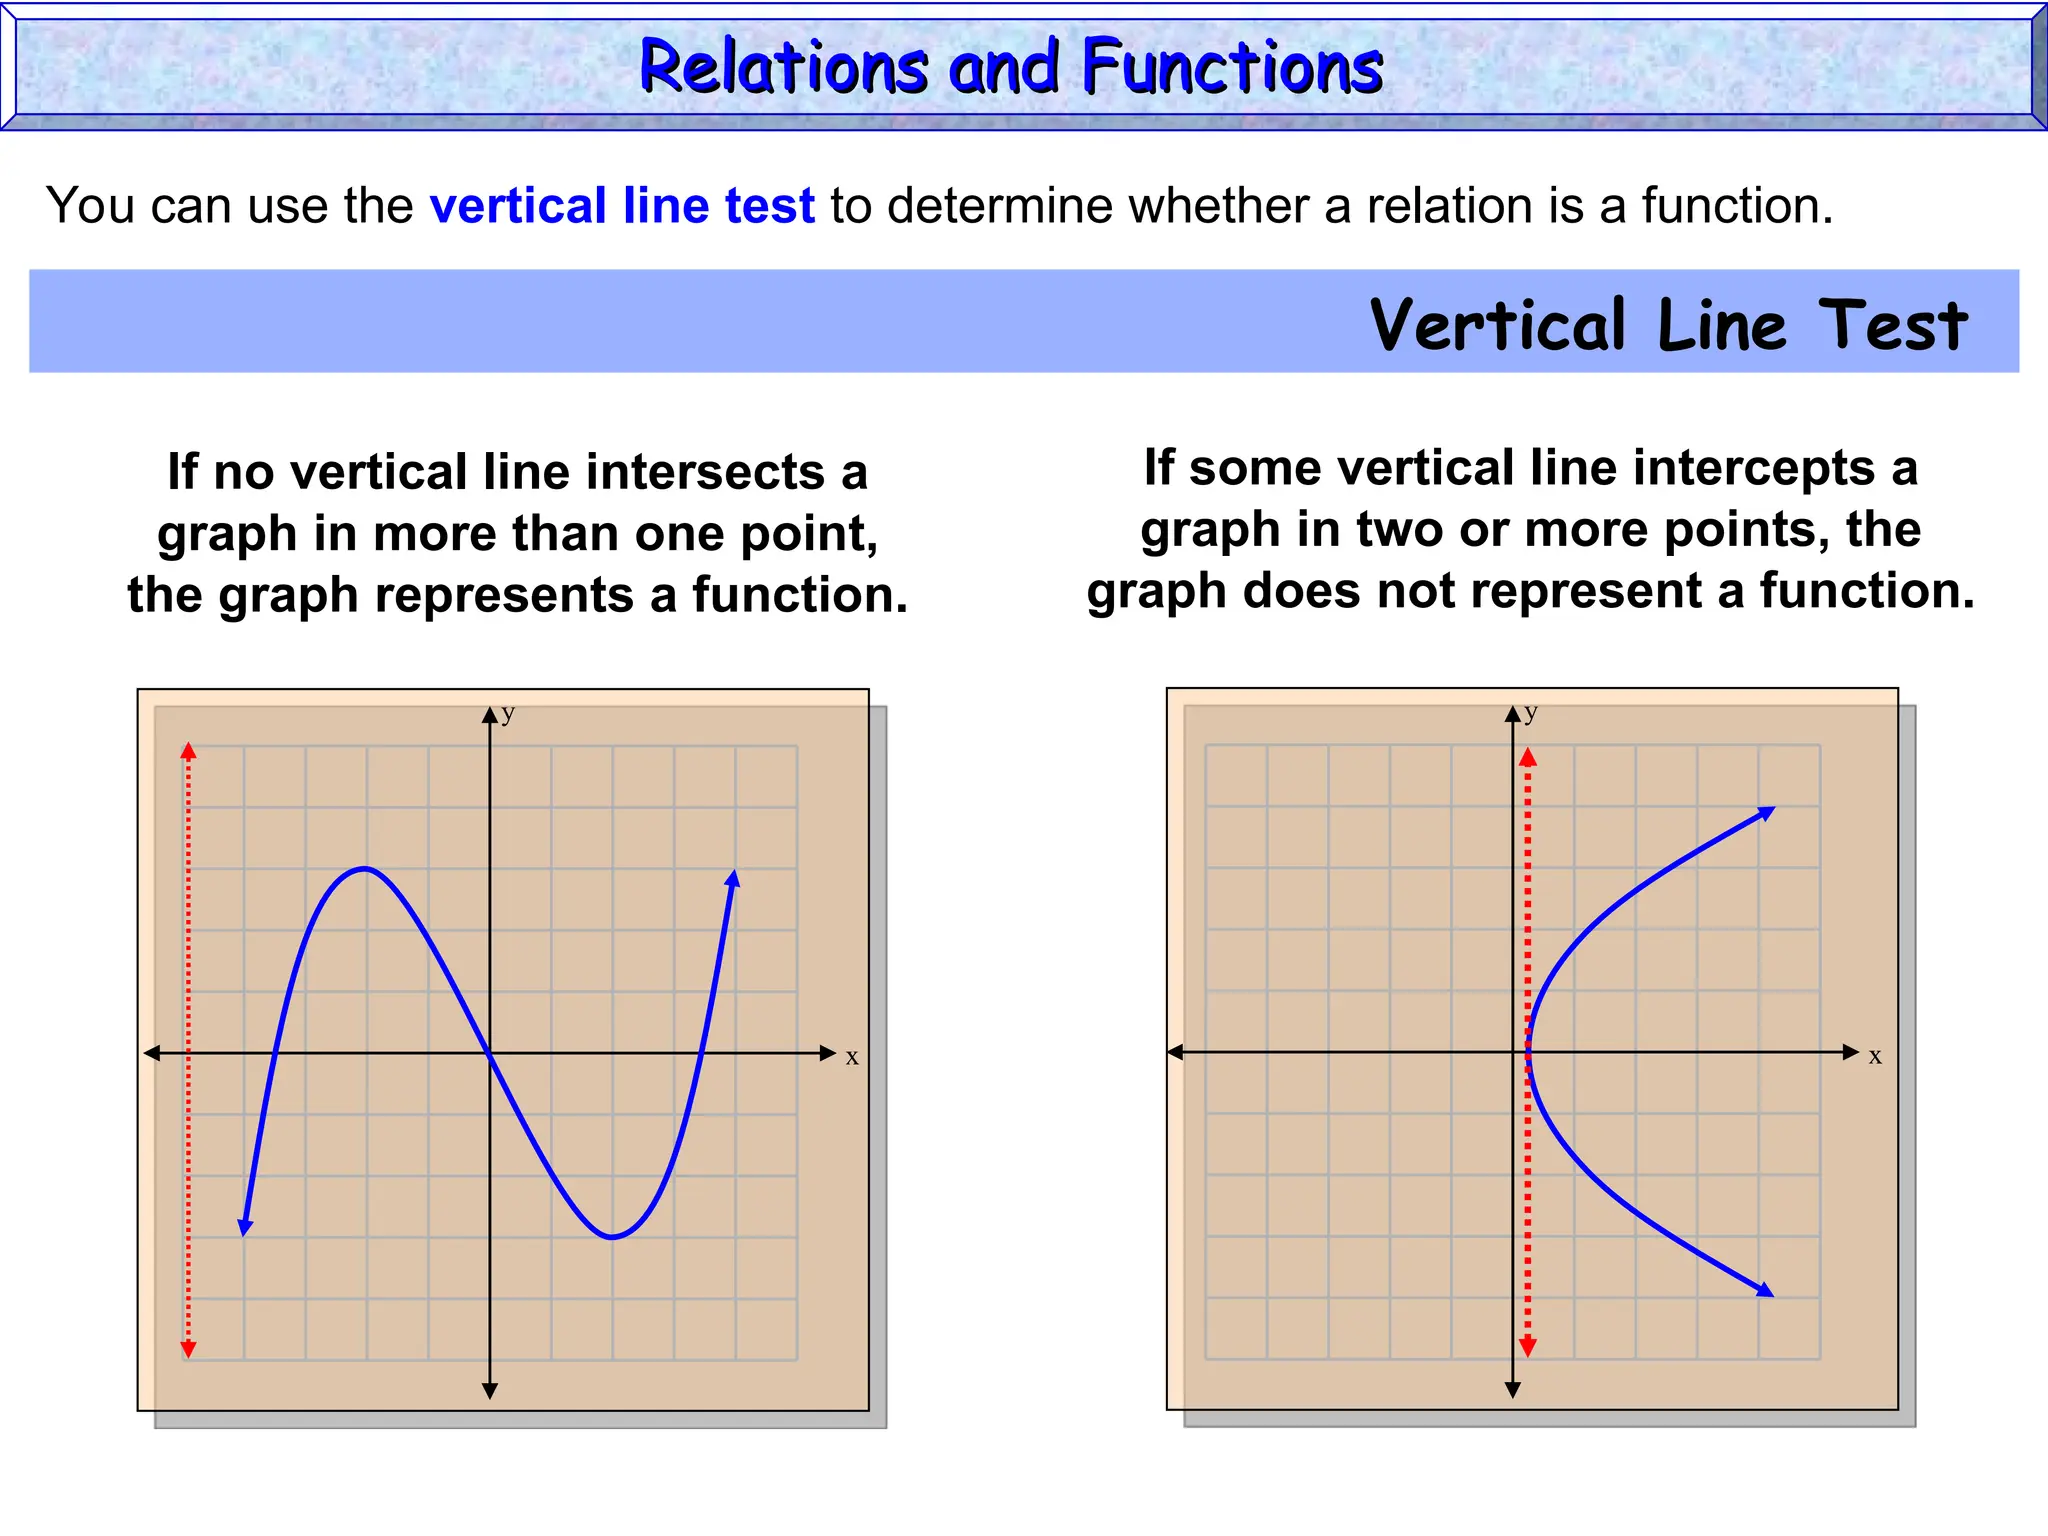
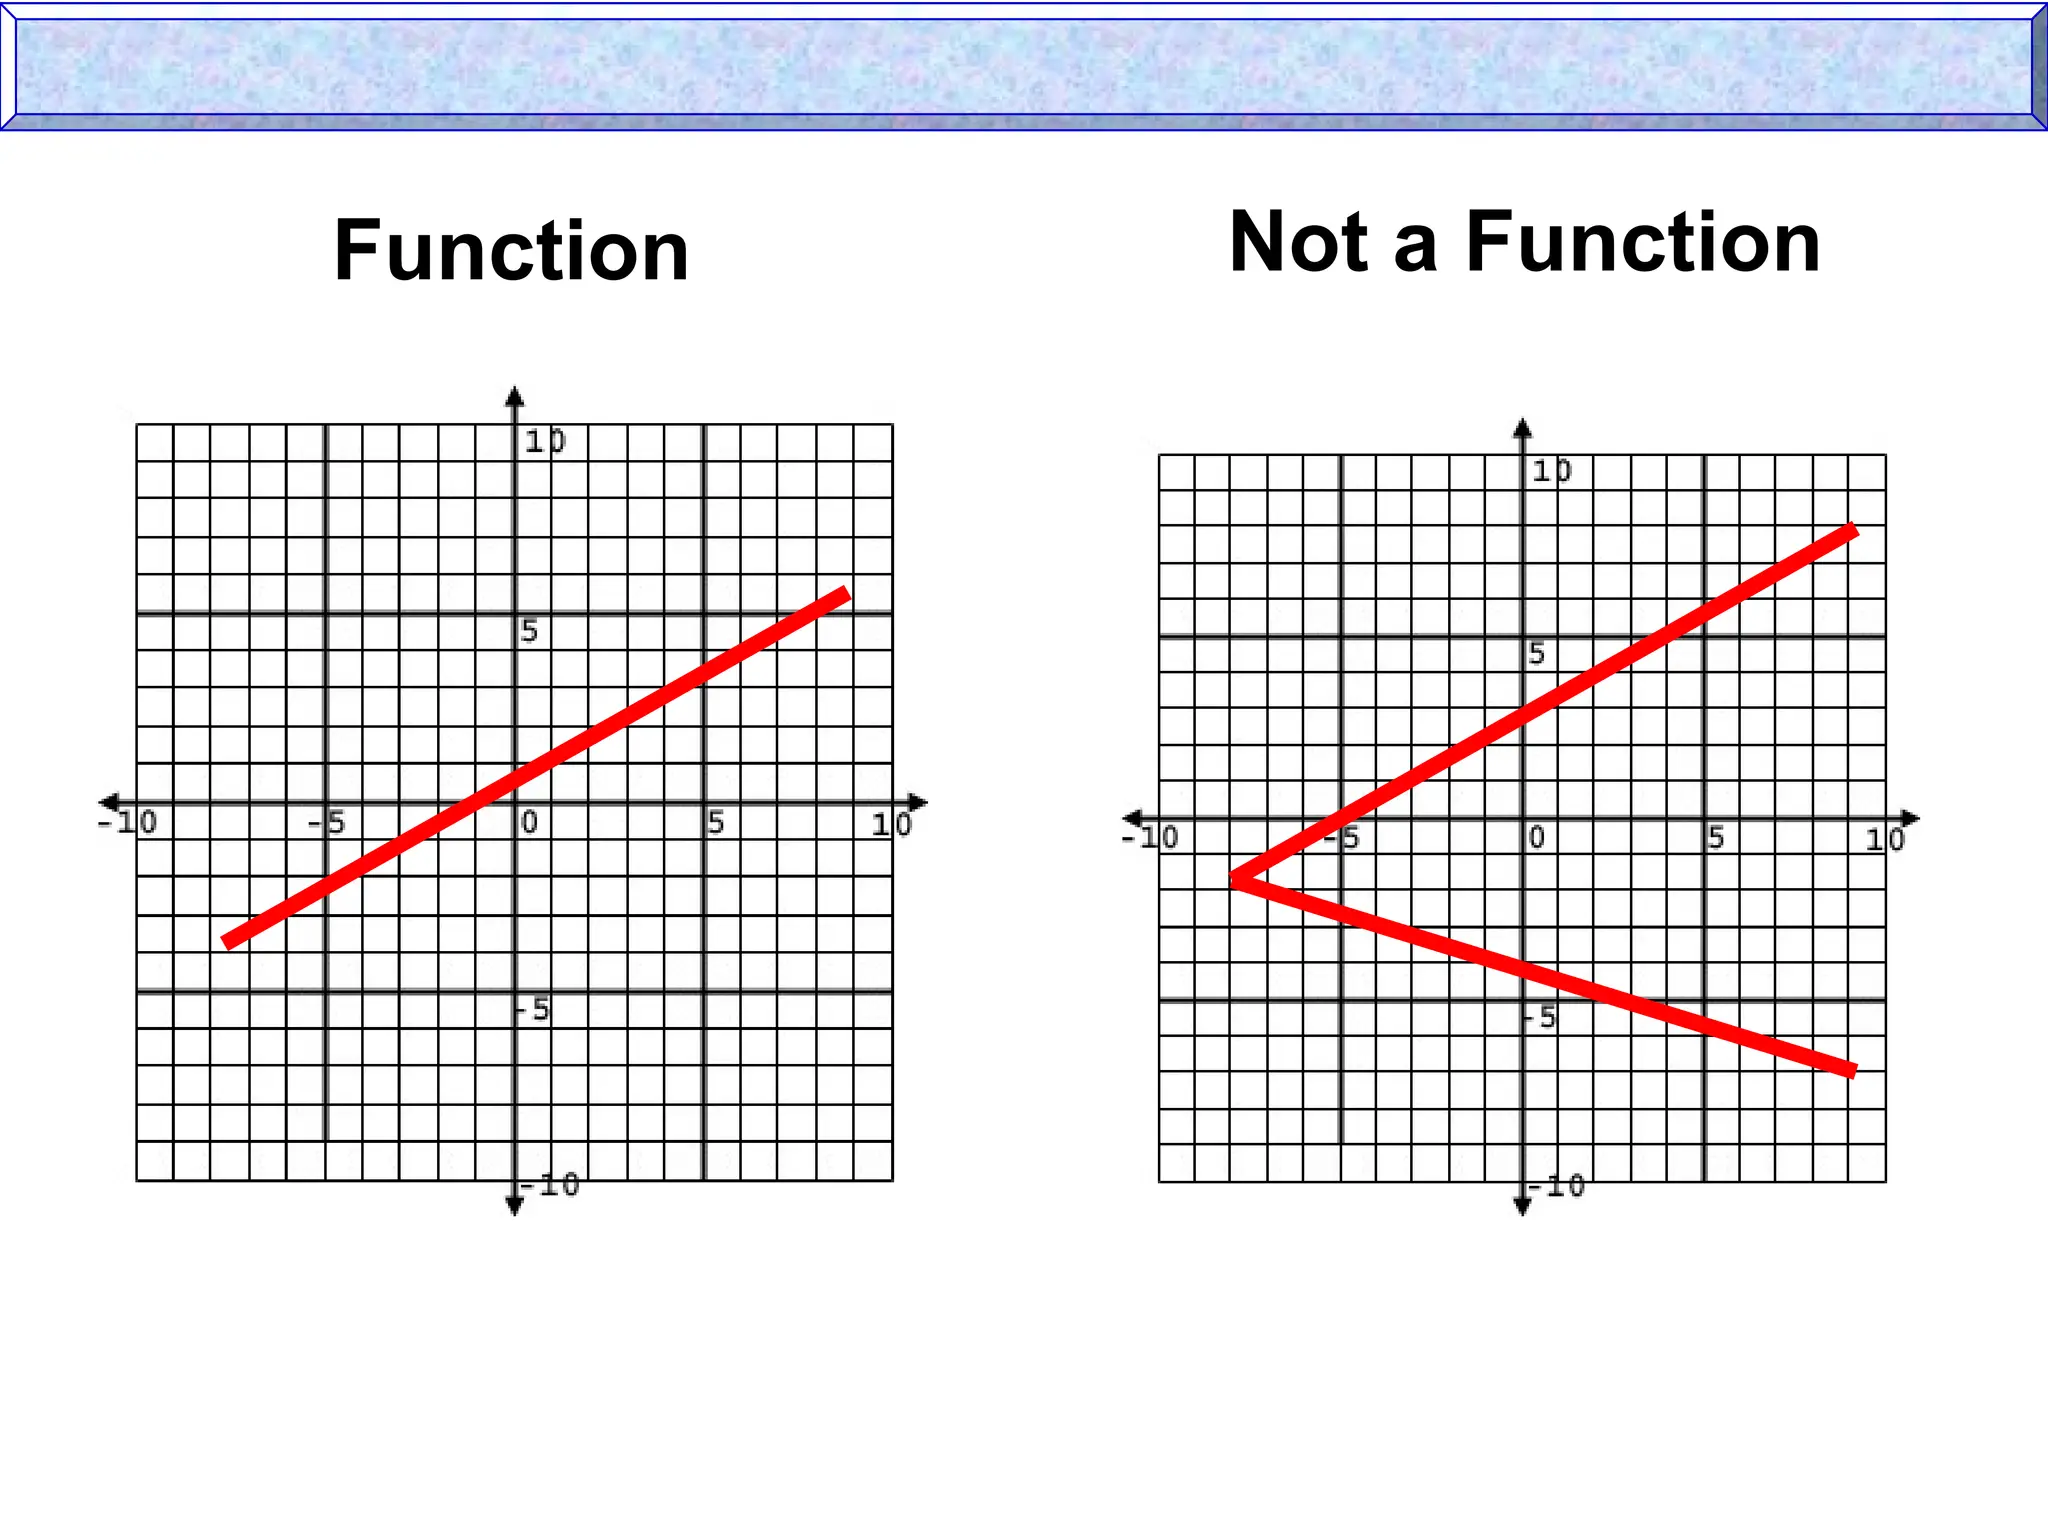
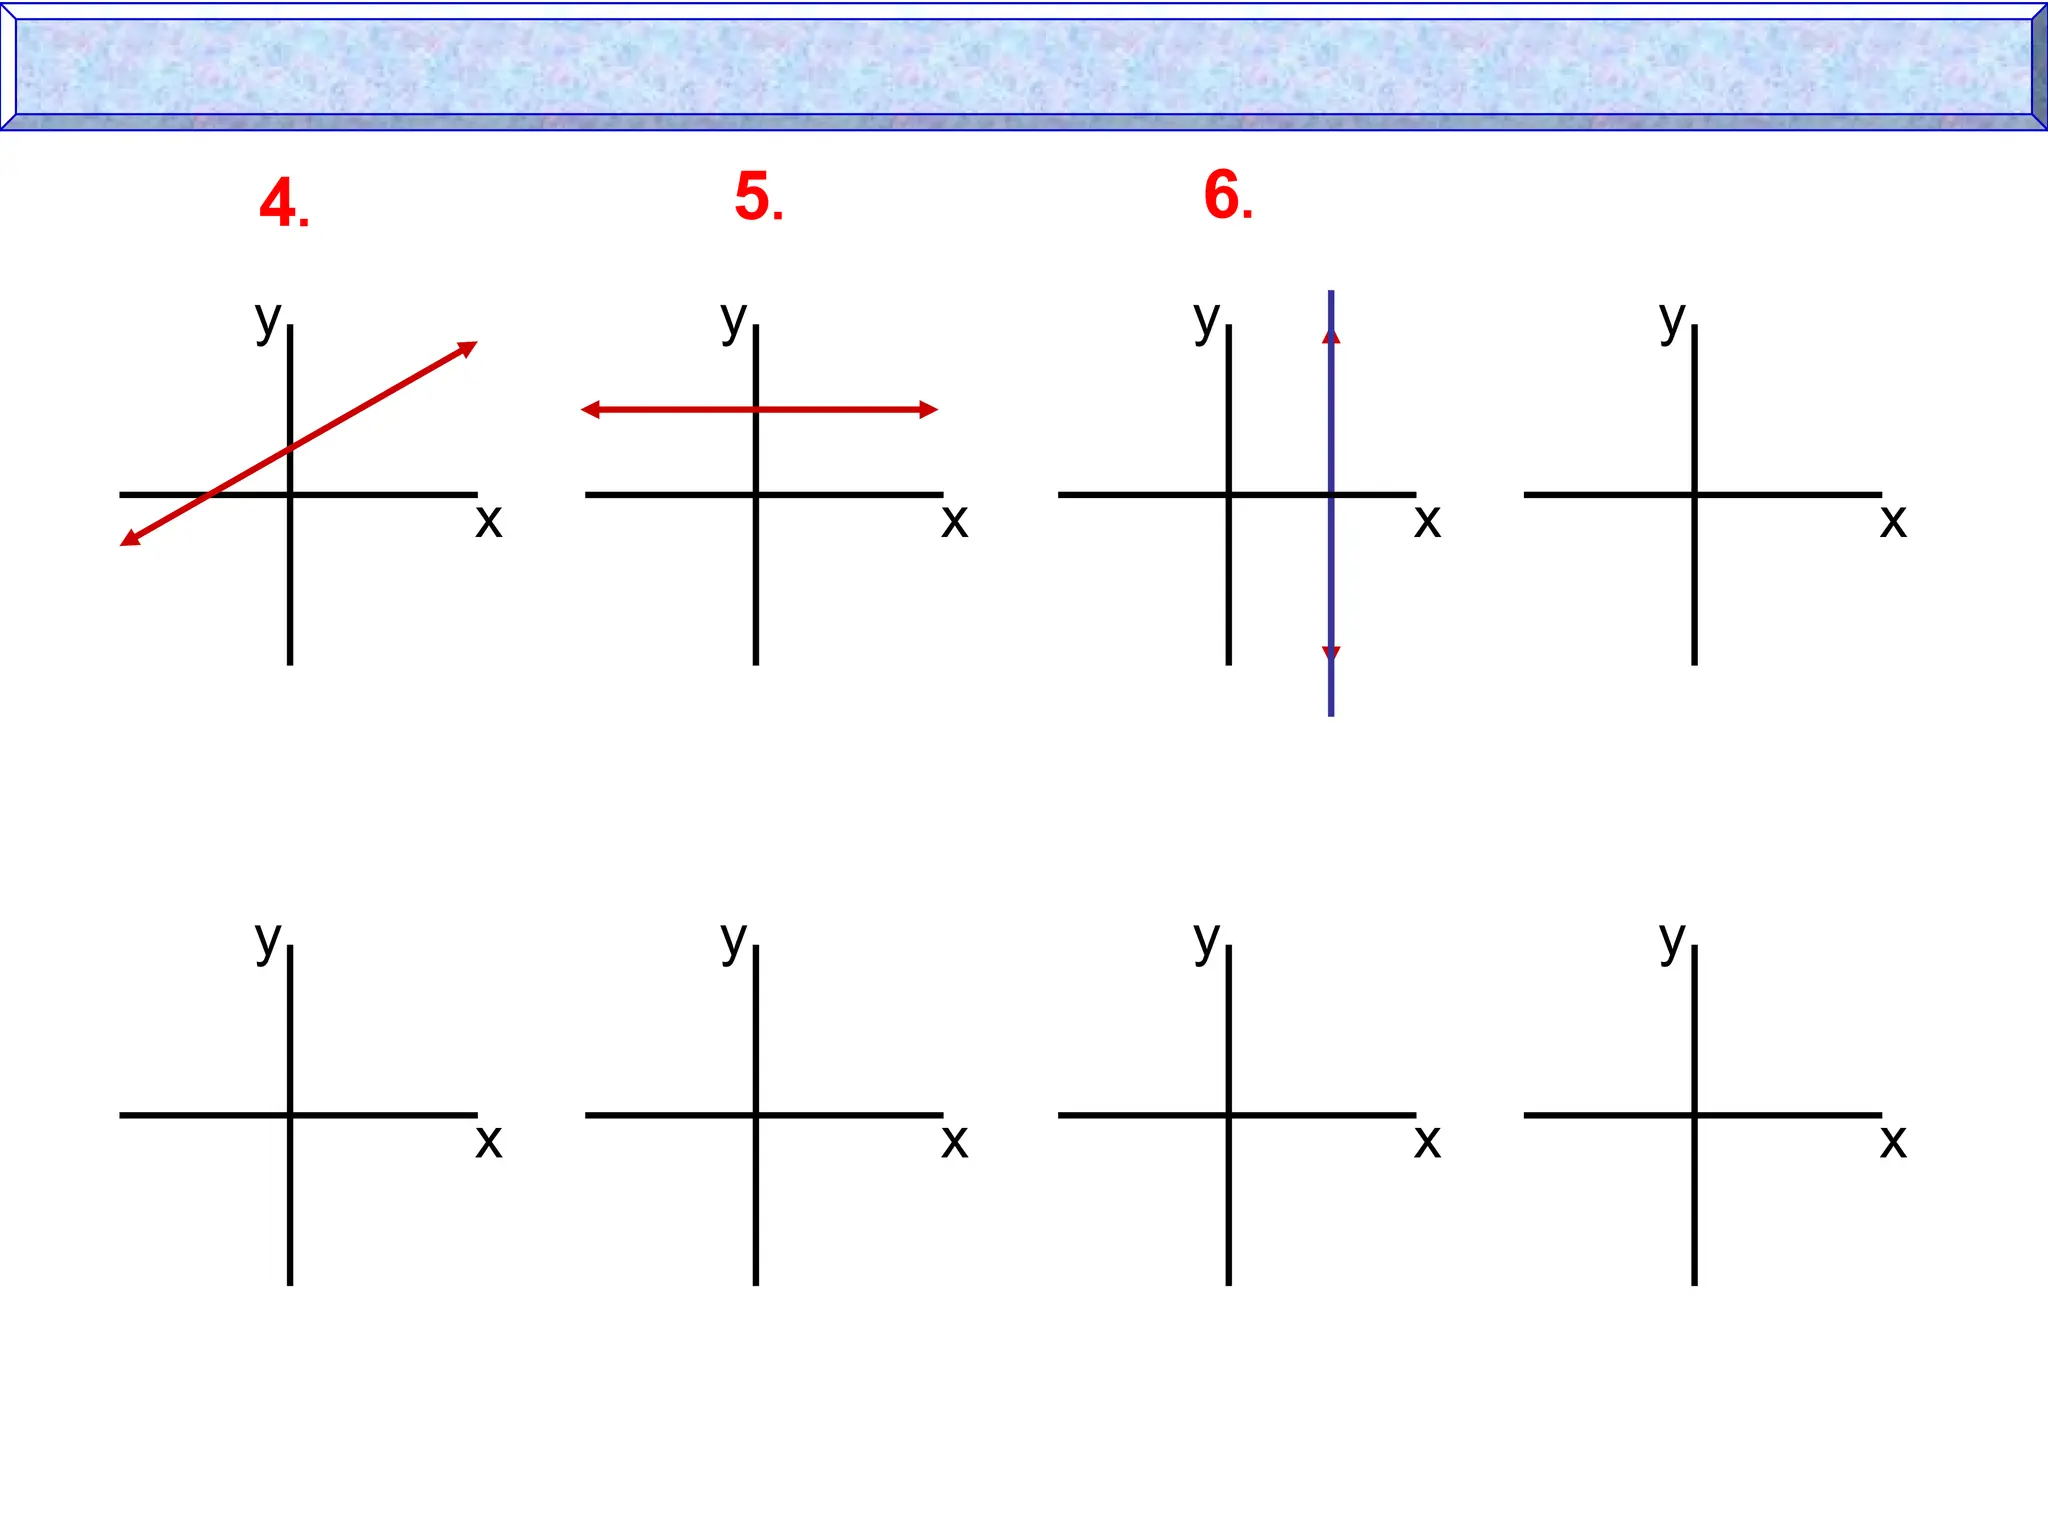
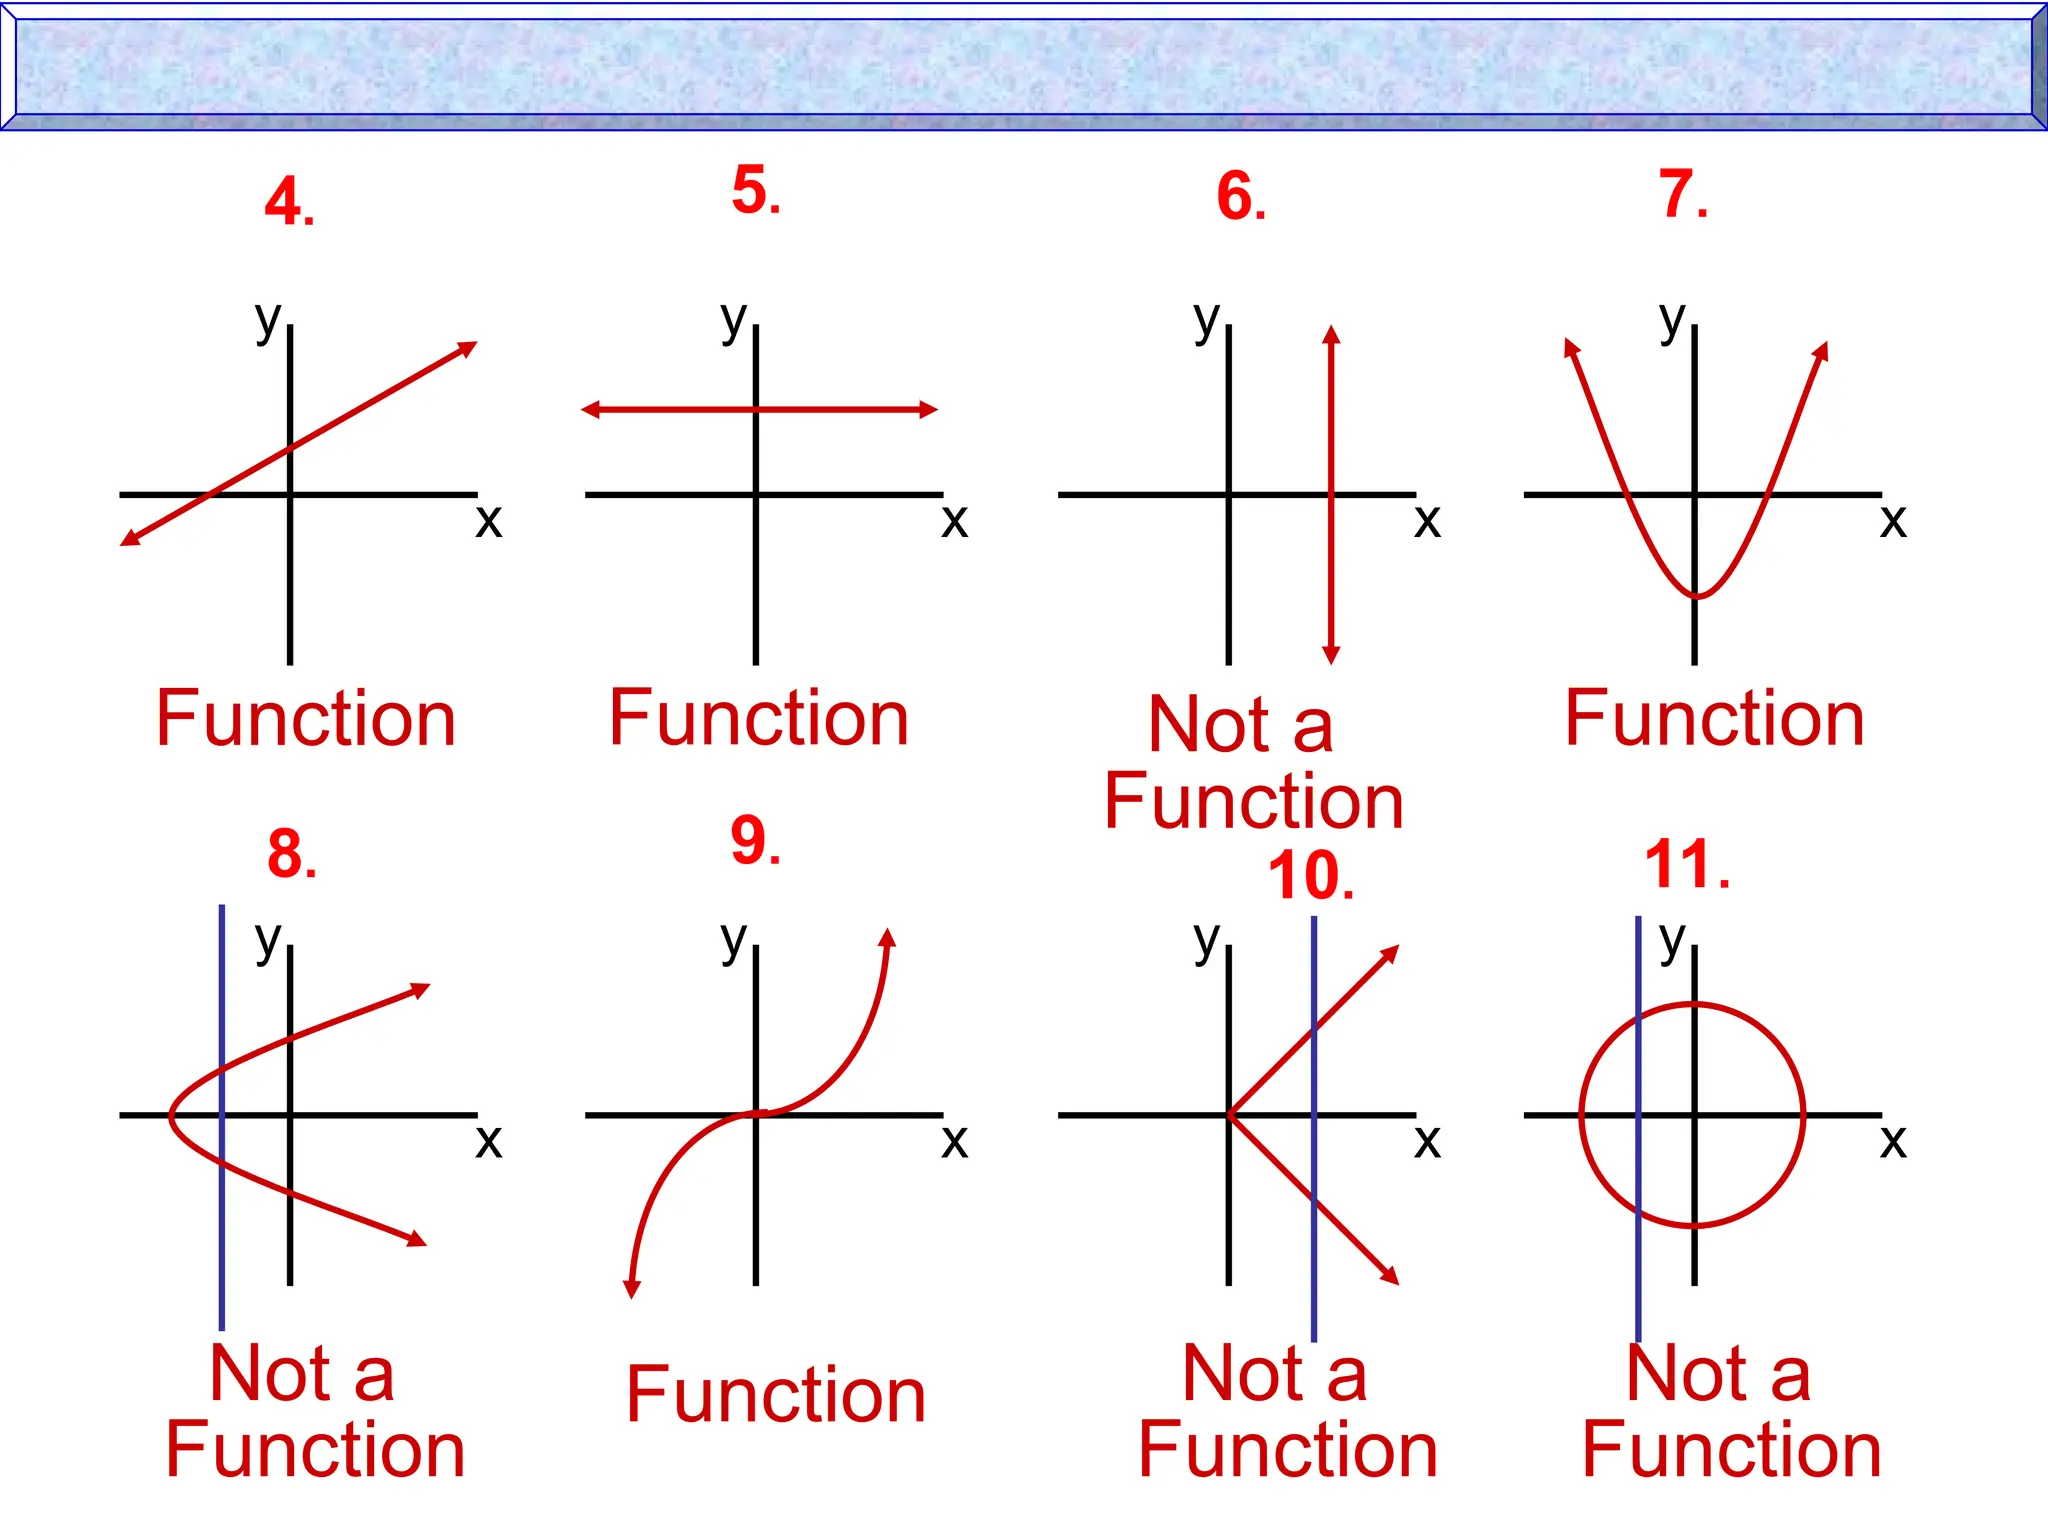
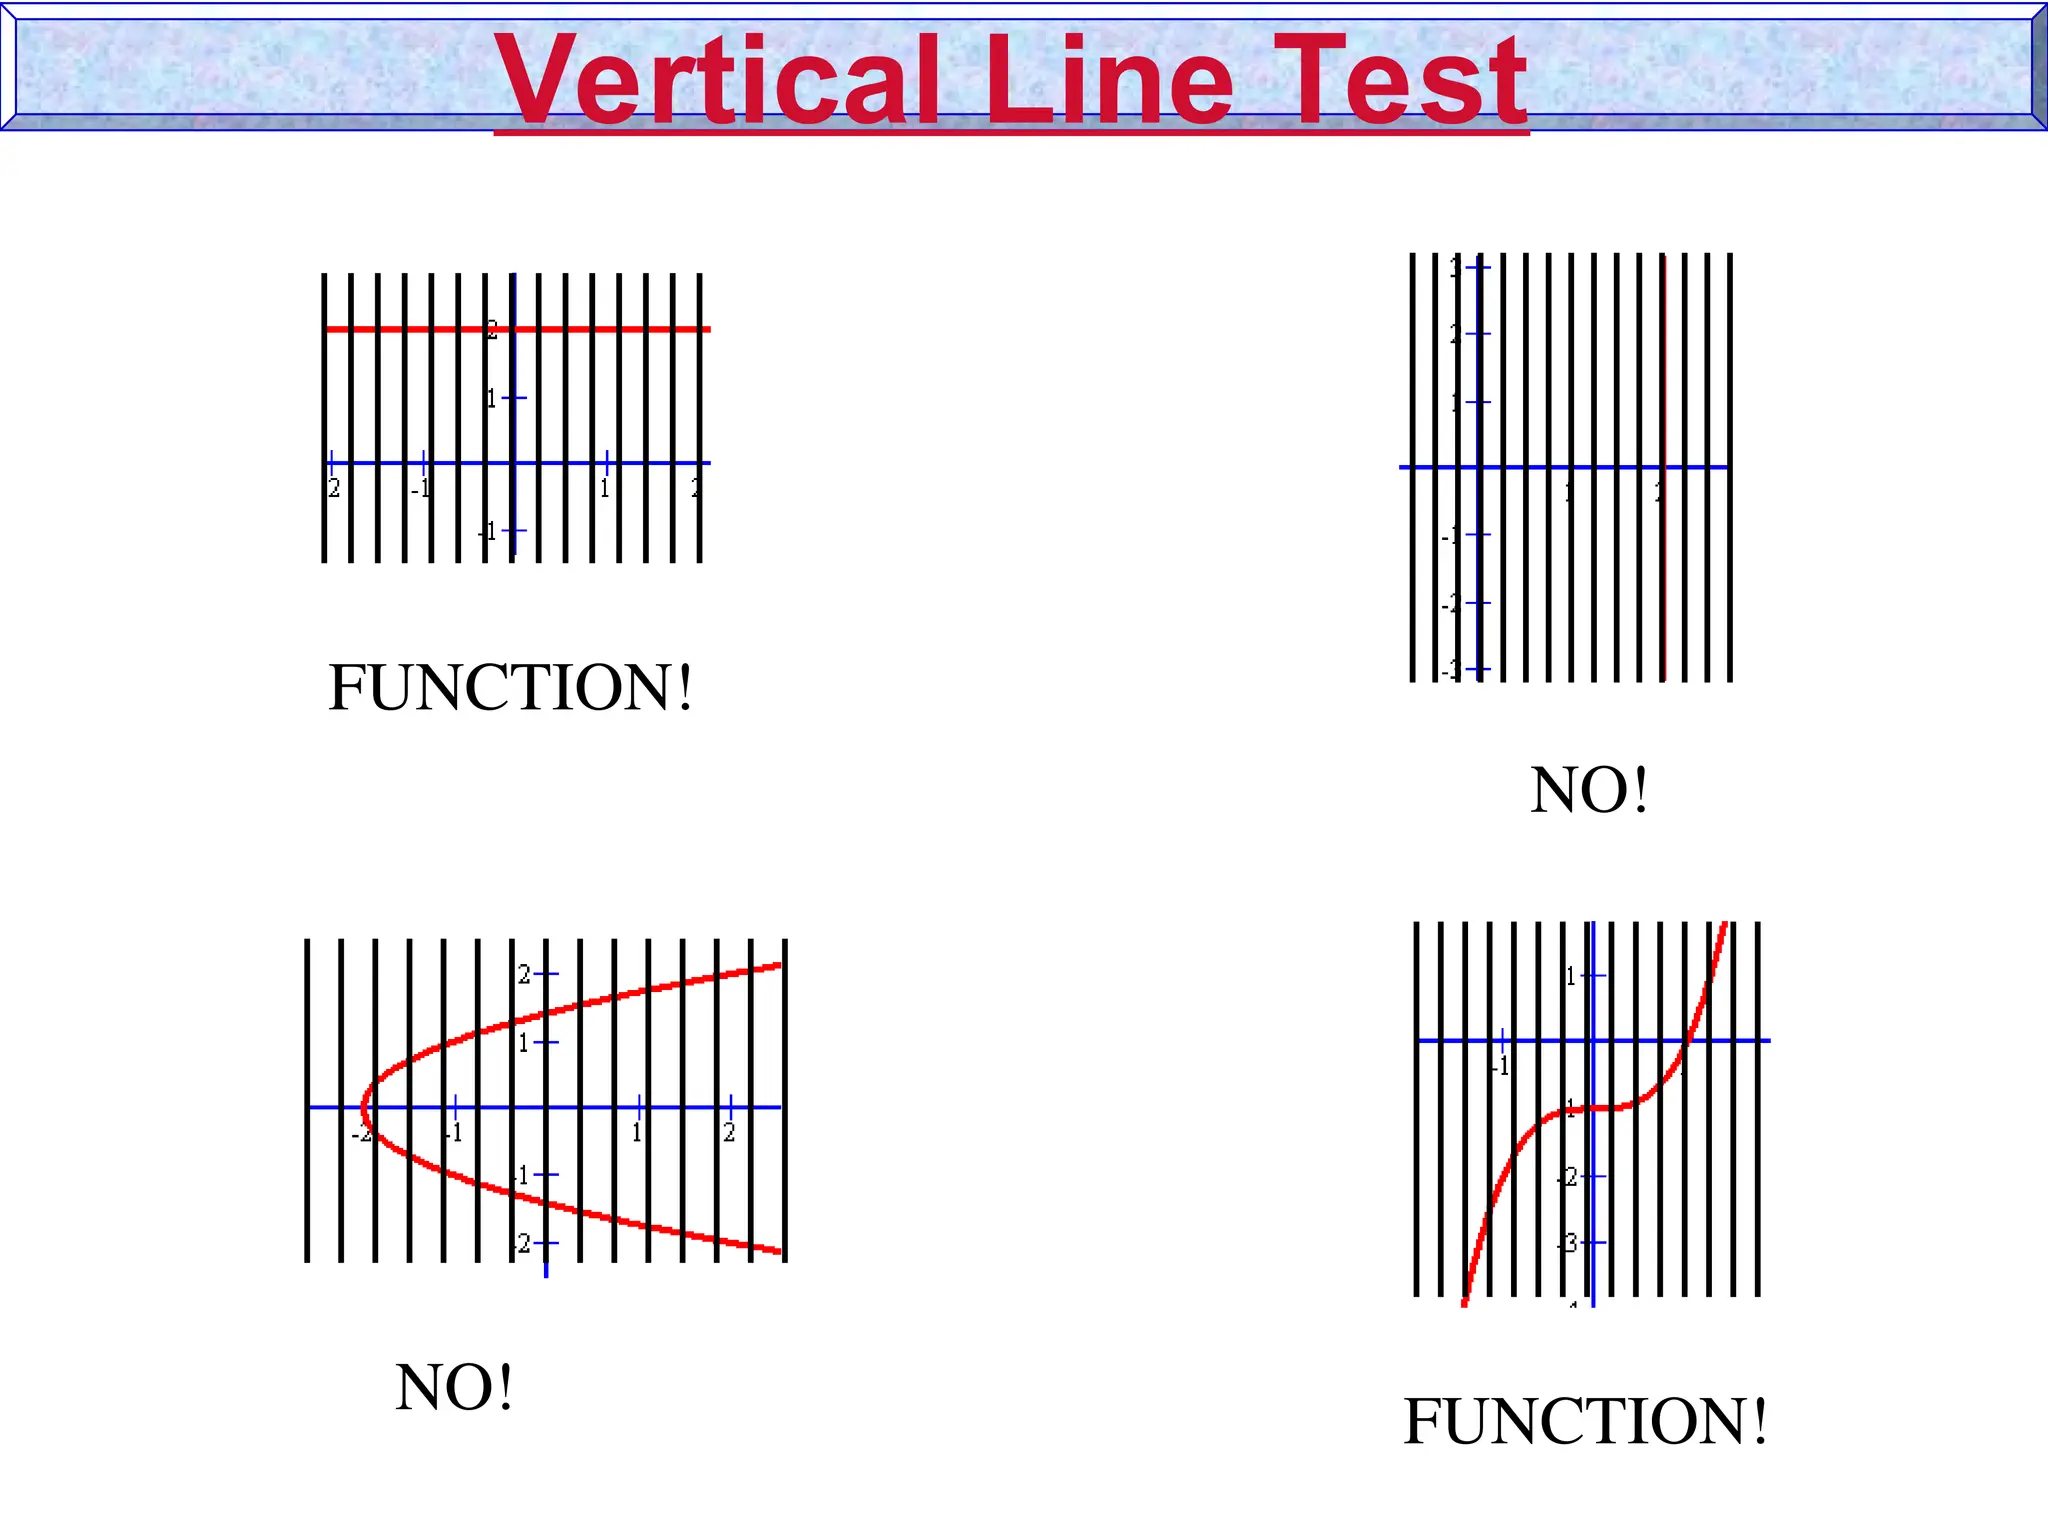
You can usethe vertical line test to determine whether a relation is a function.
Vertical Line Test
y
x
y
x
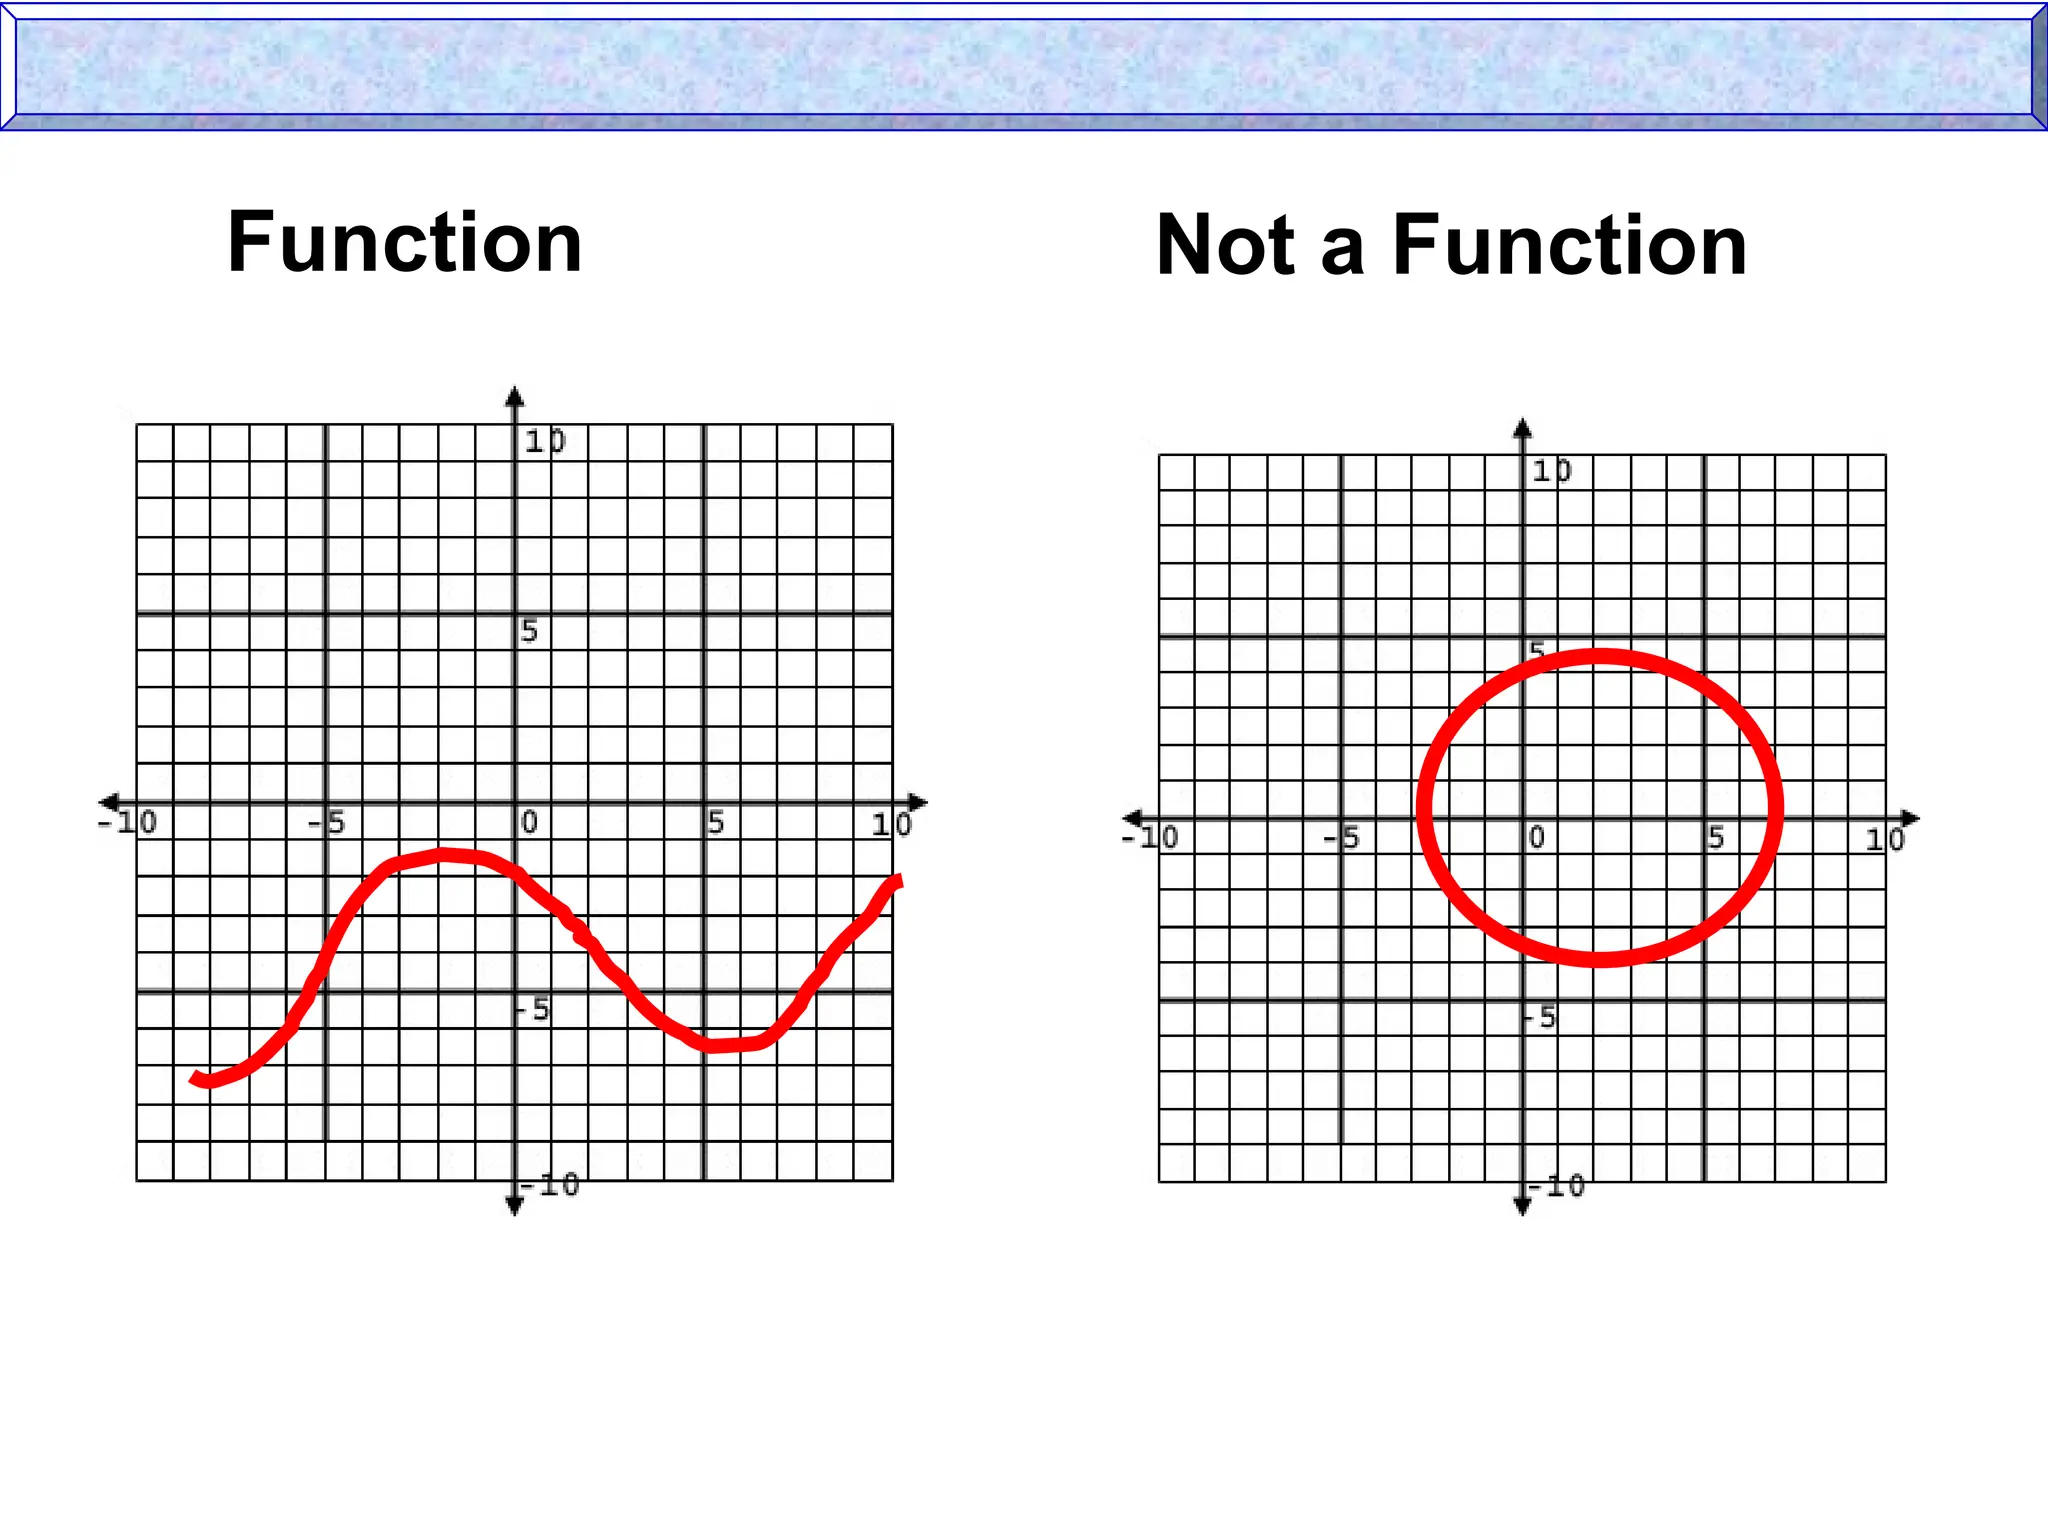
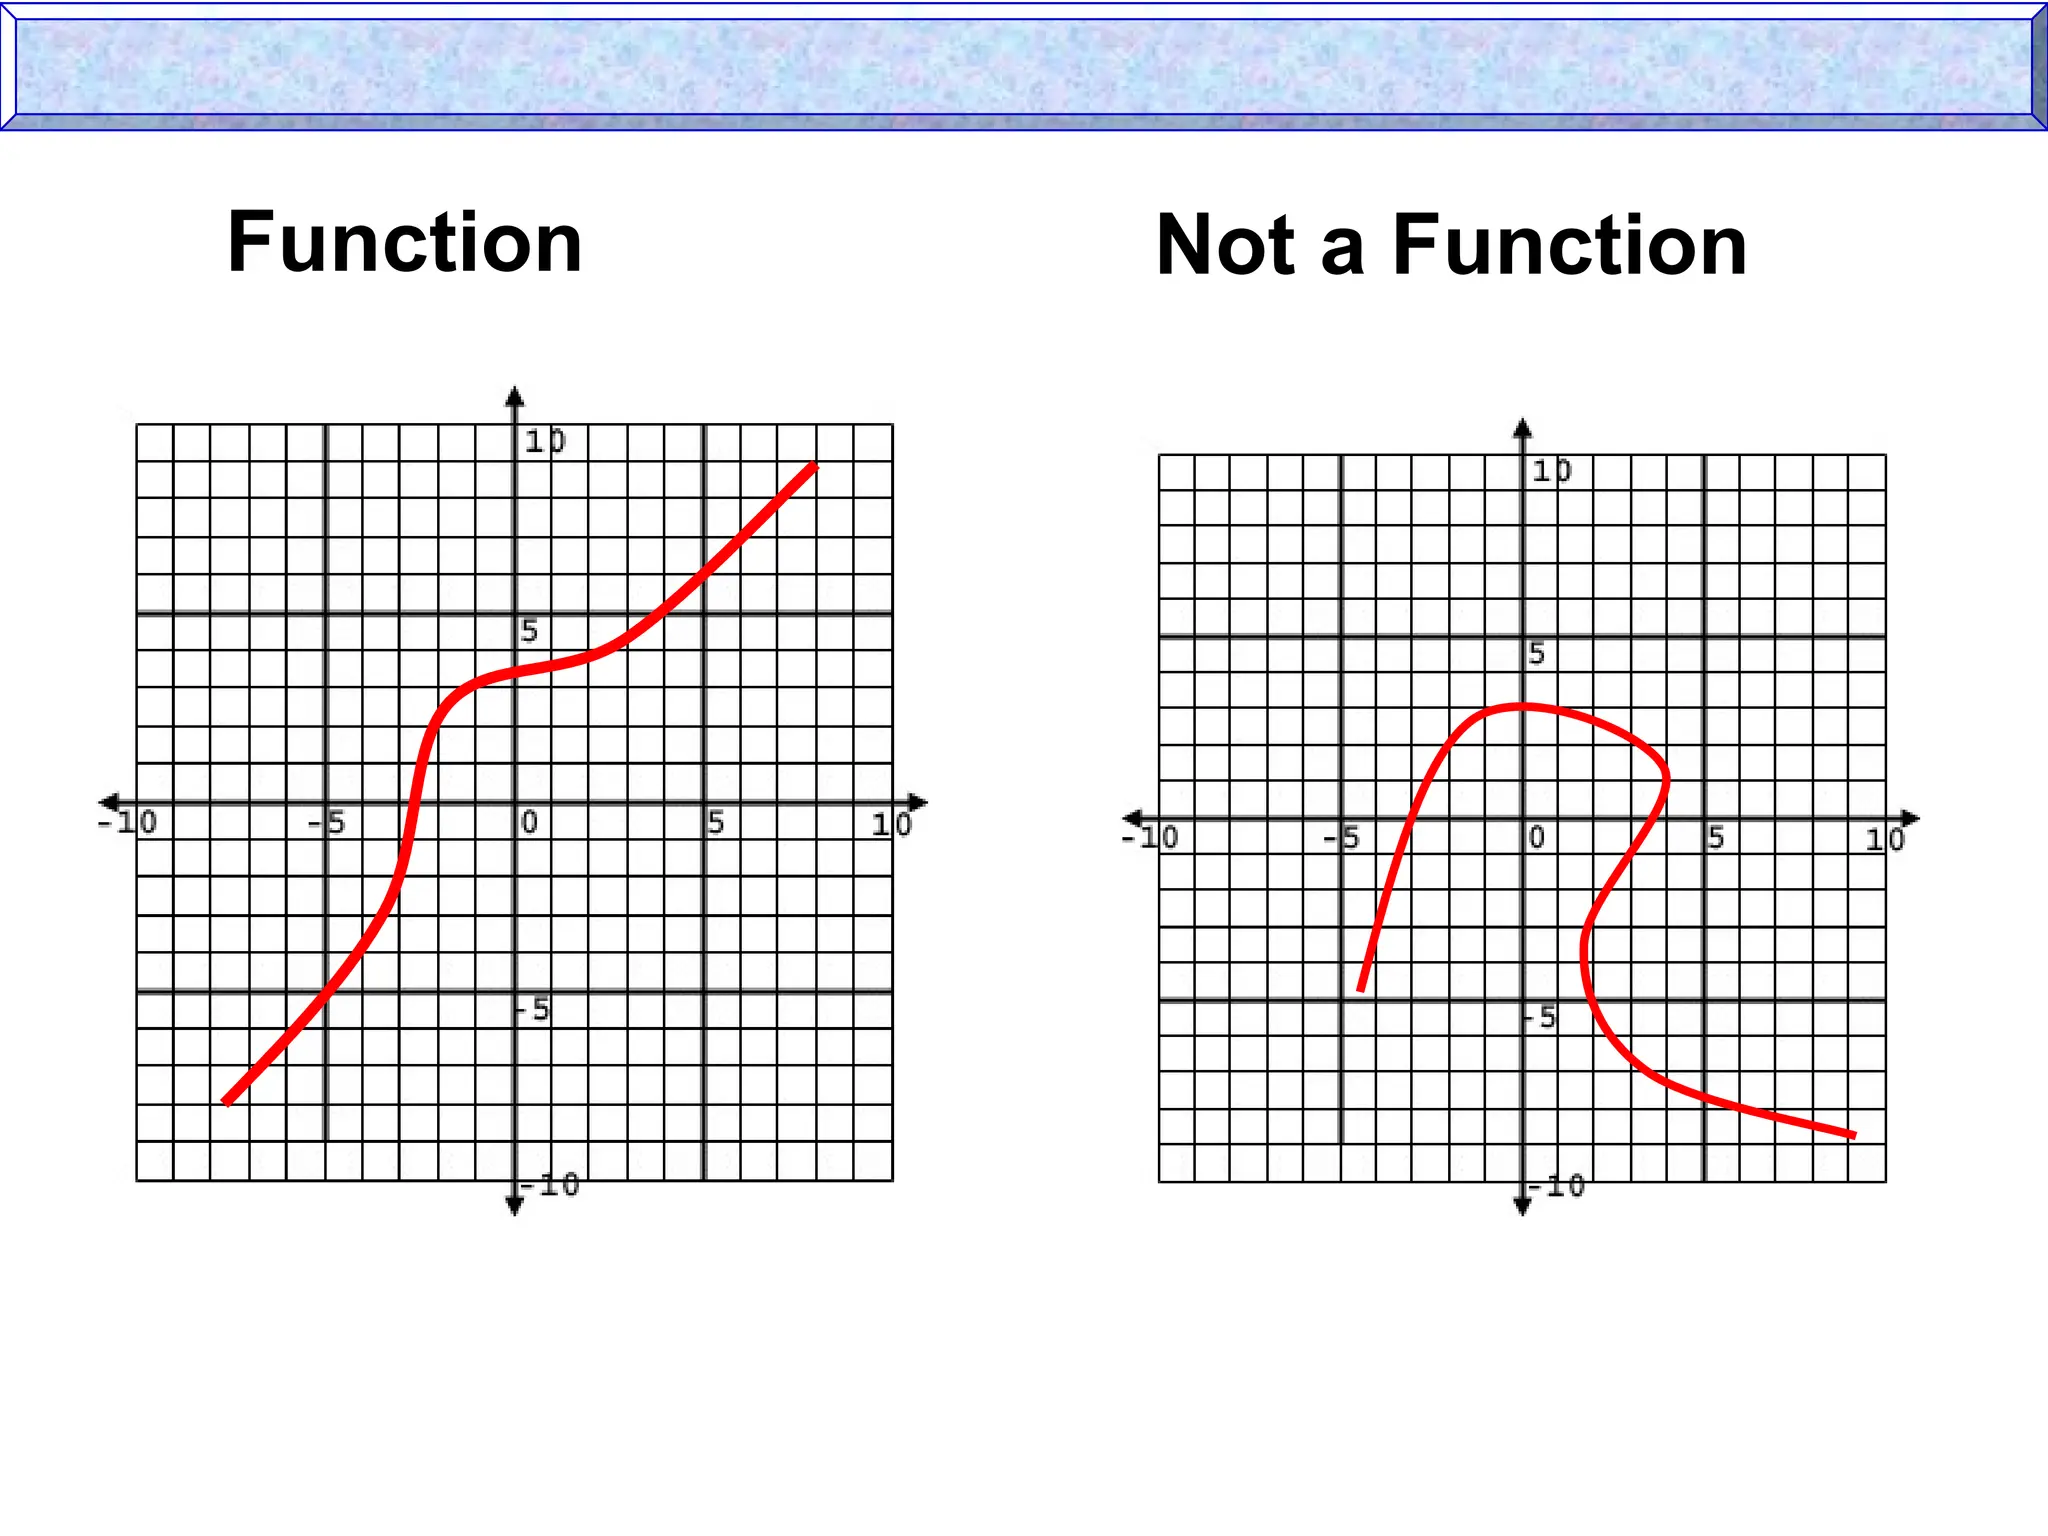
If no vertical line intersects a
graph in more than one point,
the graph represents a function.
If some vertical line intercepts a
graph in two or more points, the
graph does not represent a function.
Relations and Functions
Relations and Functions
29.
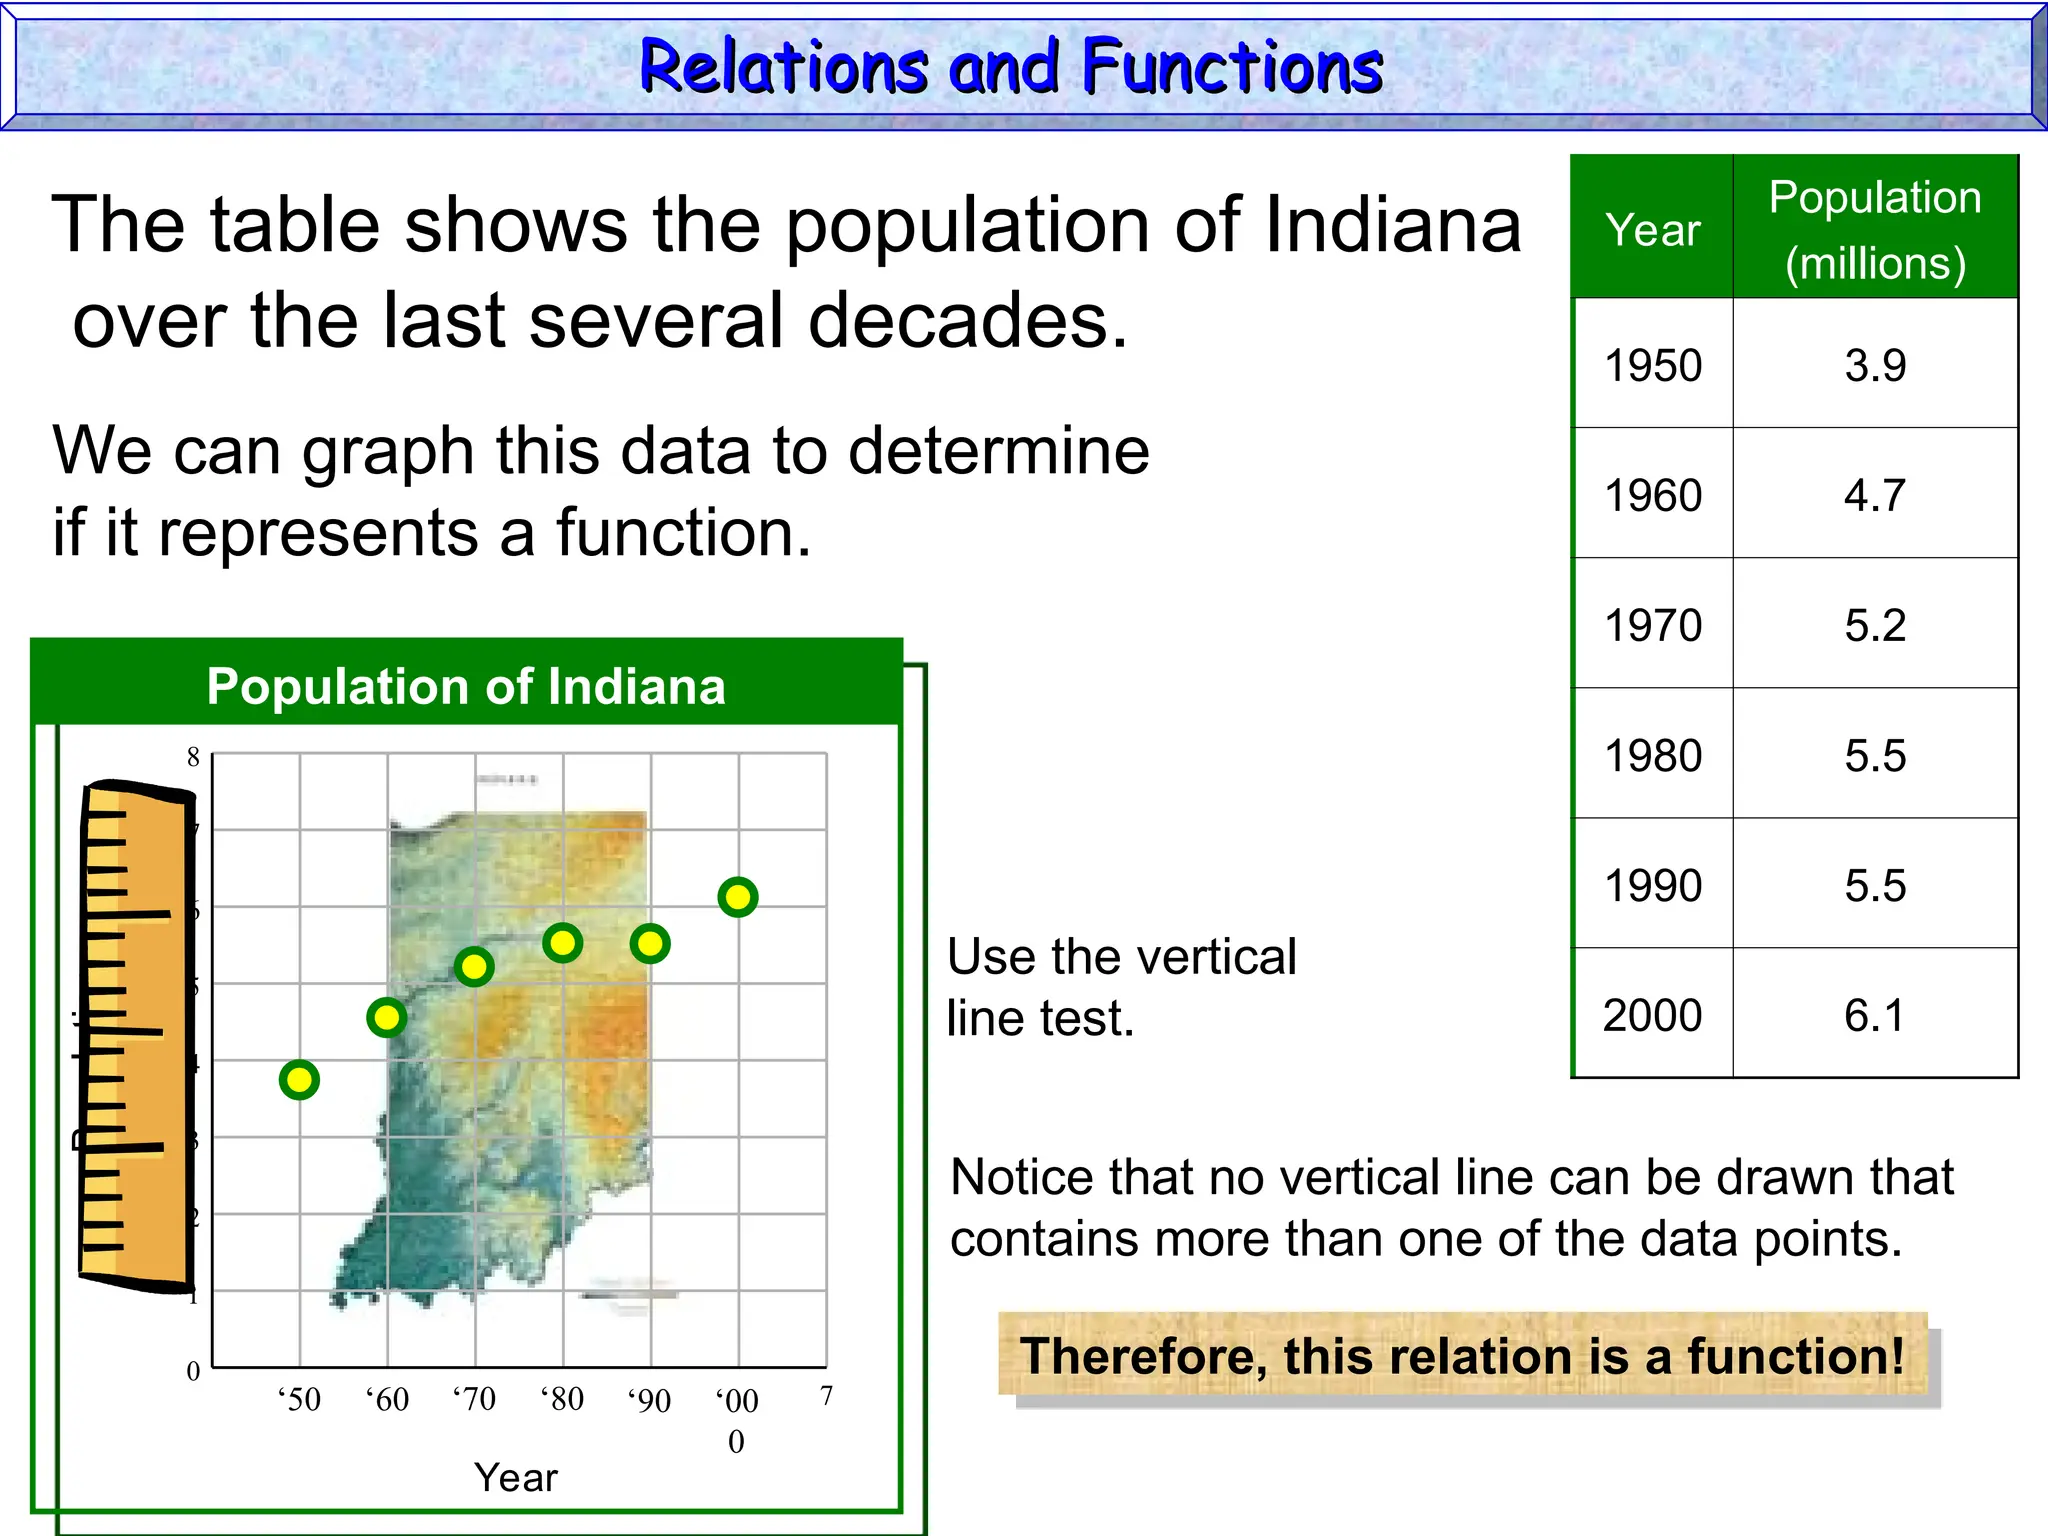
Year
Population
(millions)
1950 3.9
1960 4.7
19705.2
1980 5.5
1990 5.5
2000 6.1
The table shows the population of Indiana
over the last several decades.
We can graph this data to determine
if it represents a function.
7
‘60
0
1
3
5
7
2
6
‘50
8
4
‘80
‘70 ‘00
0
‘90
Population
(millions)
Year
Population of Indiana
Use the vertical
line test.
Notice that no vertical line can be drawn that
contains more than one of the data points.
Therefore, this relation is a function!
Relations and Functions
Relations and Functions
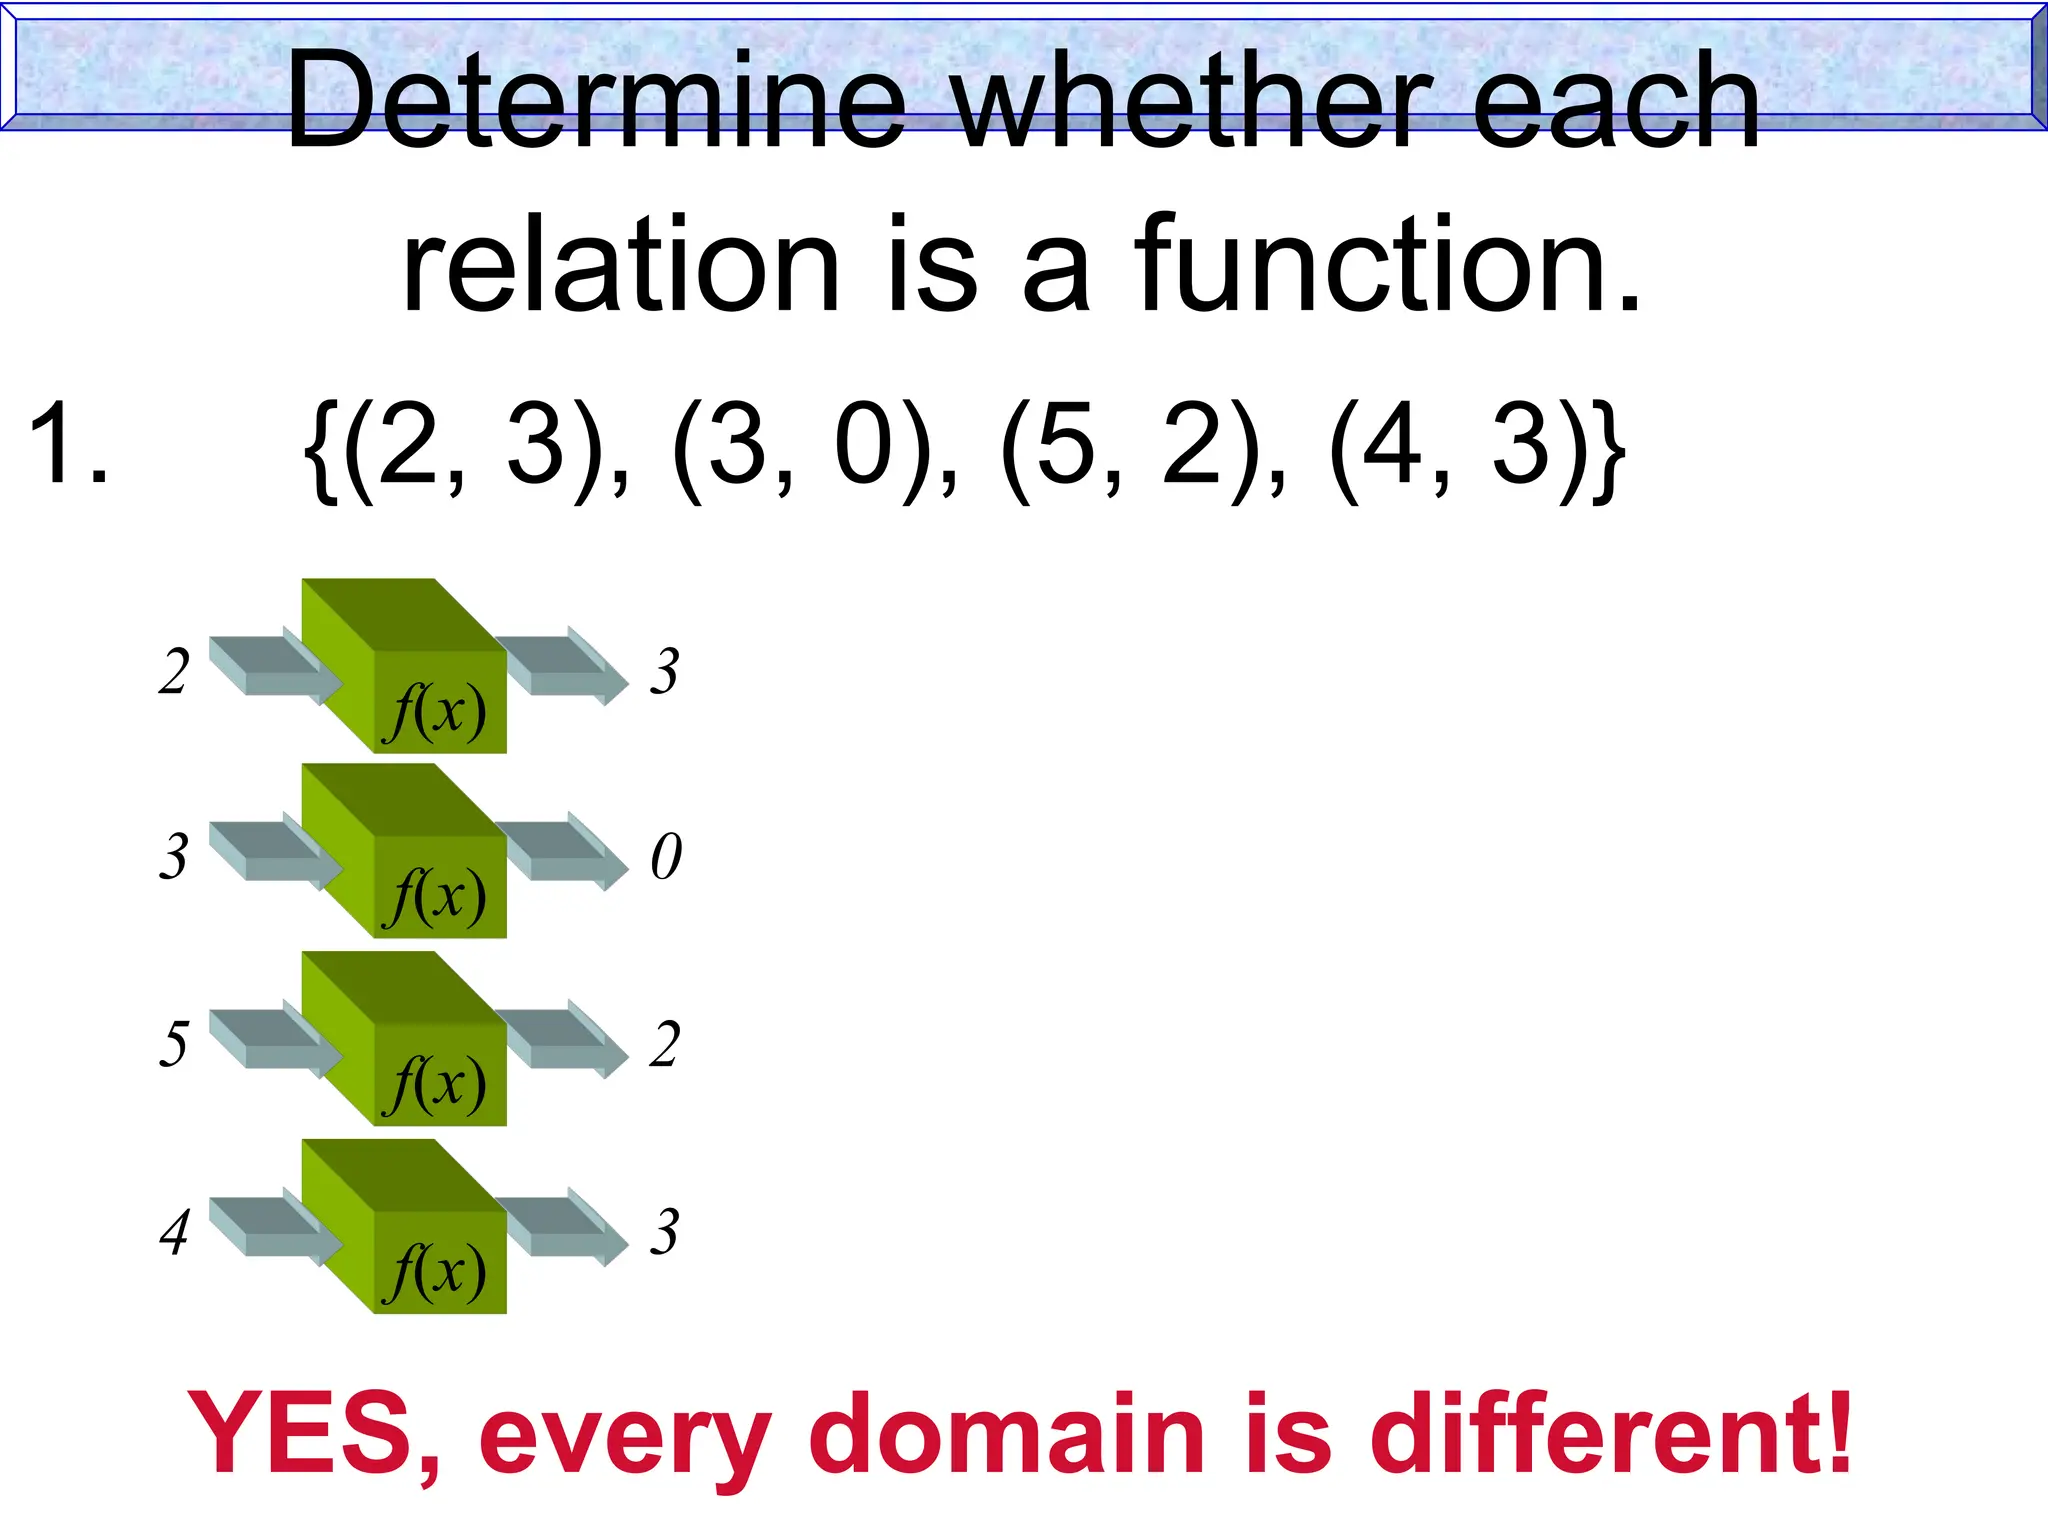
Determine whether each
relationis a function.
1. {(2, 3), (3, 0), (5, 2), (4, 3)}
YES, every domain is different!
f(x)
2 3
f(x)
3 0
f(x)
5 2
f(x)
4 3
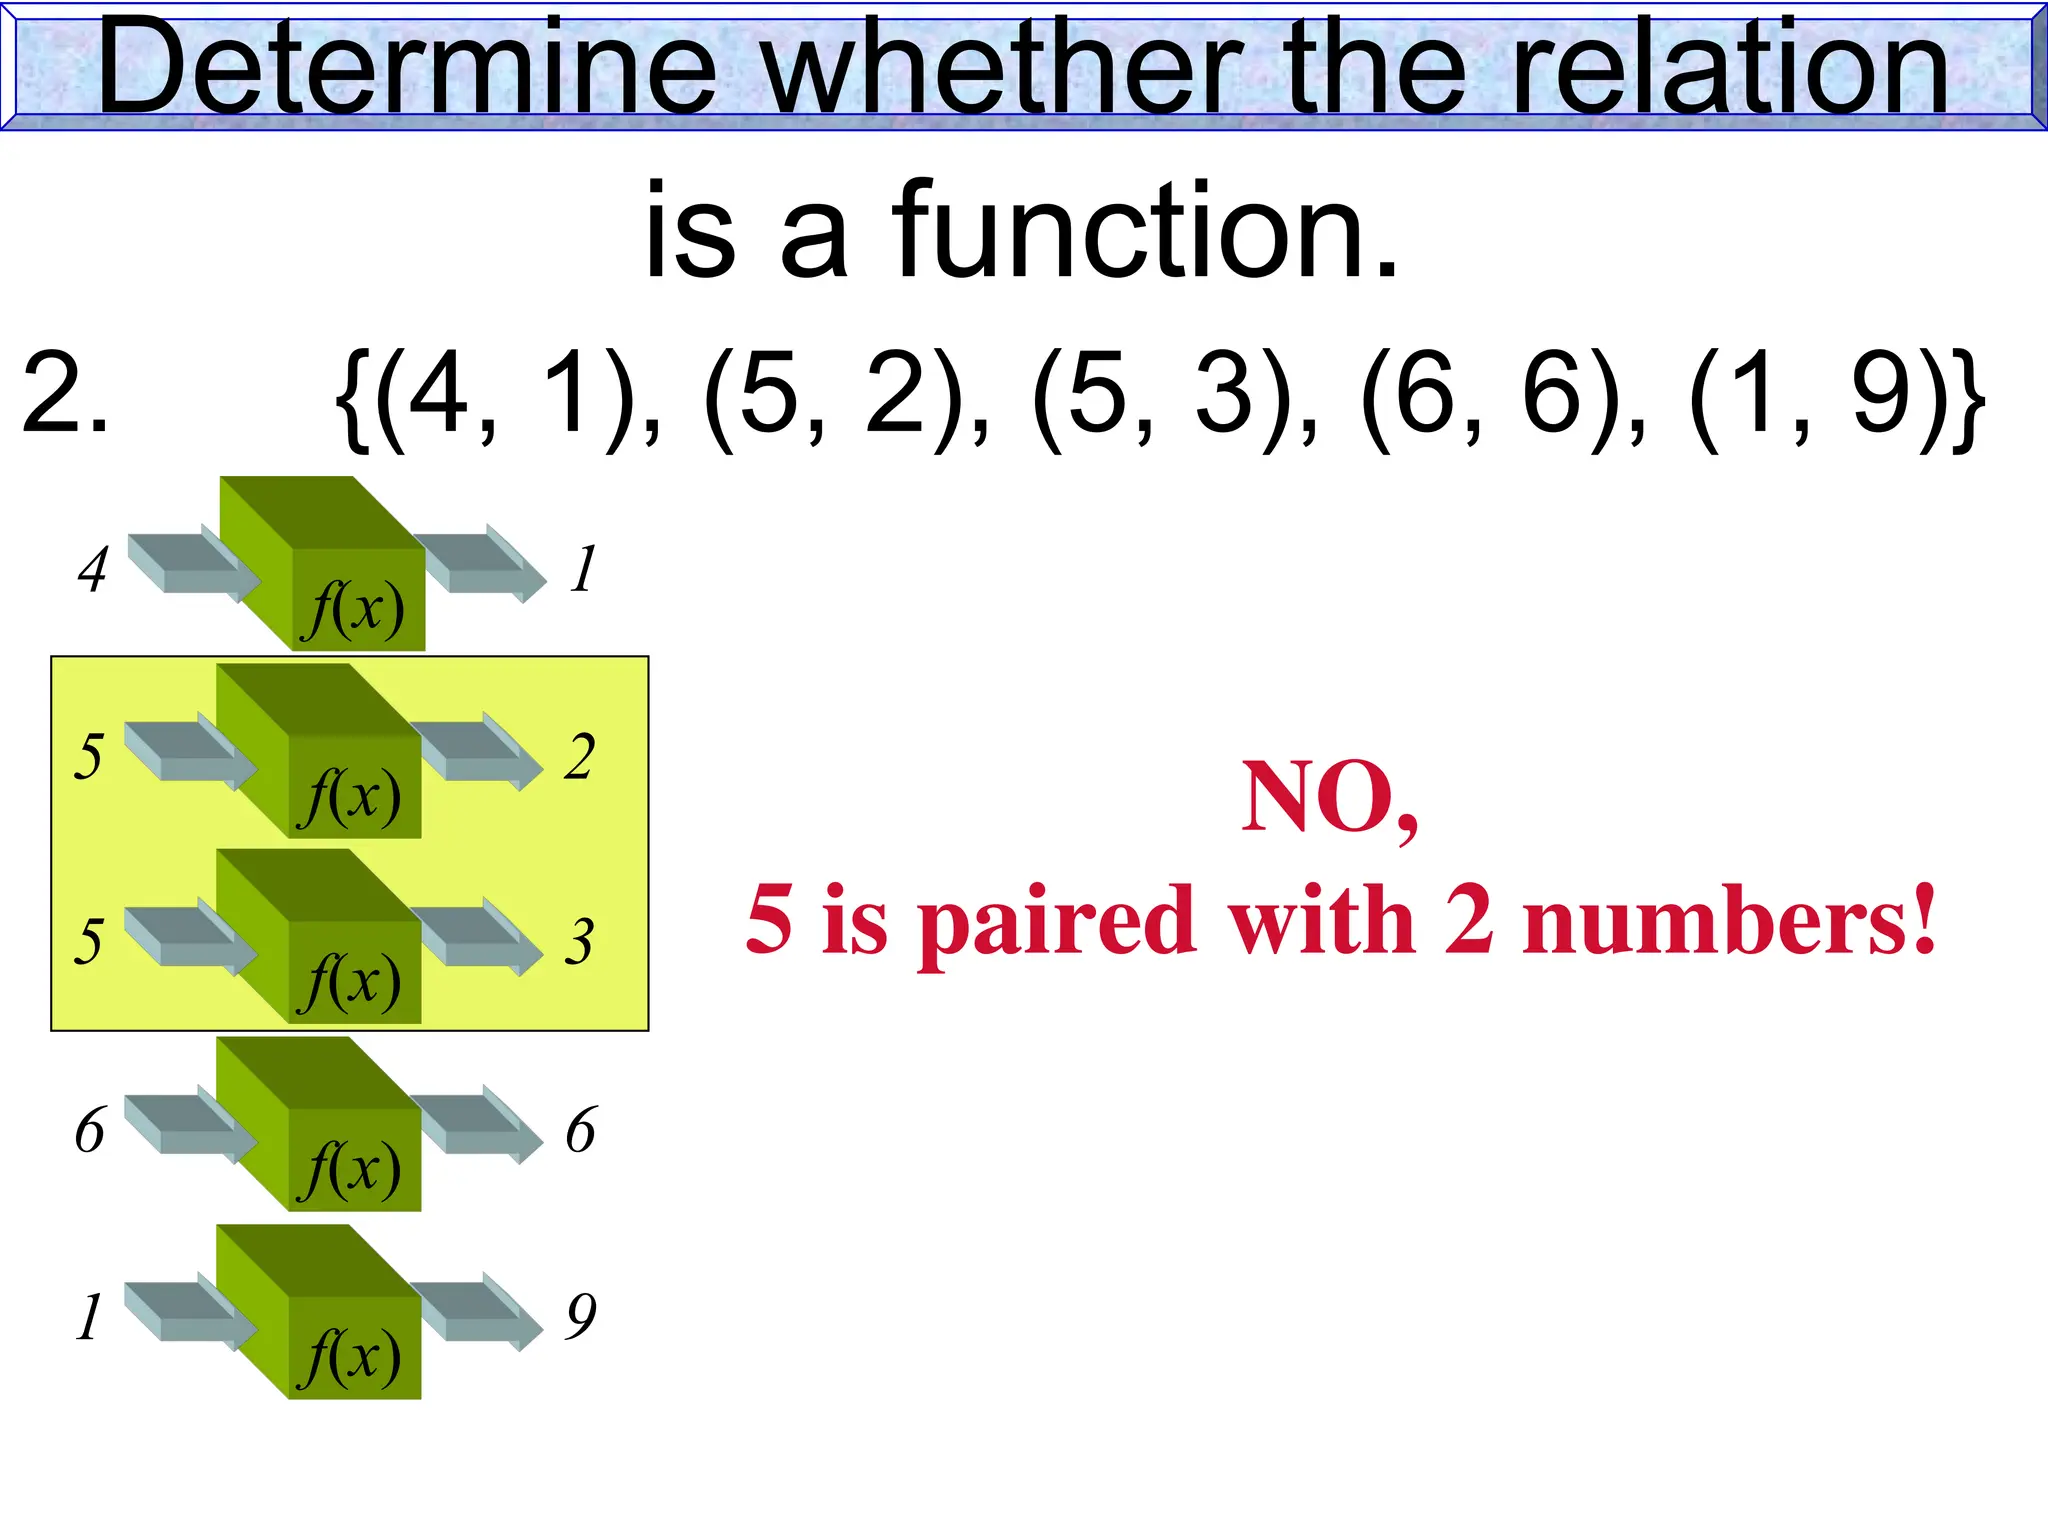
46.
Determine whether therelation
is a function.
2. {(4, 1), (5, 2), (5, 3), (6, 6), (1, 9)}
f(x)
4 1
f(x)
5 2
f(x)
5 3
f(x)
6 6
f(x)
1 9
NO,
5 is paired with 2 numbers!
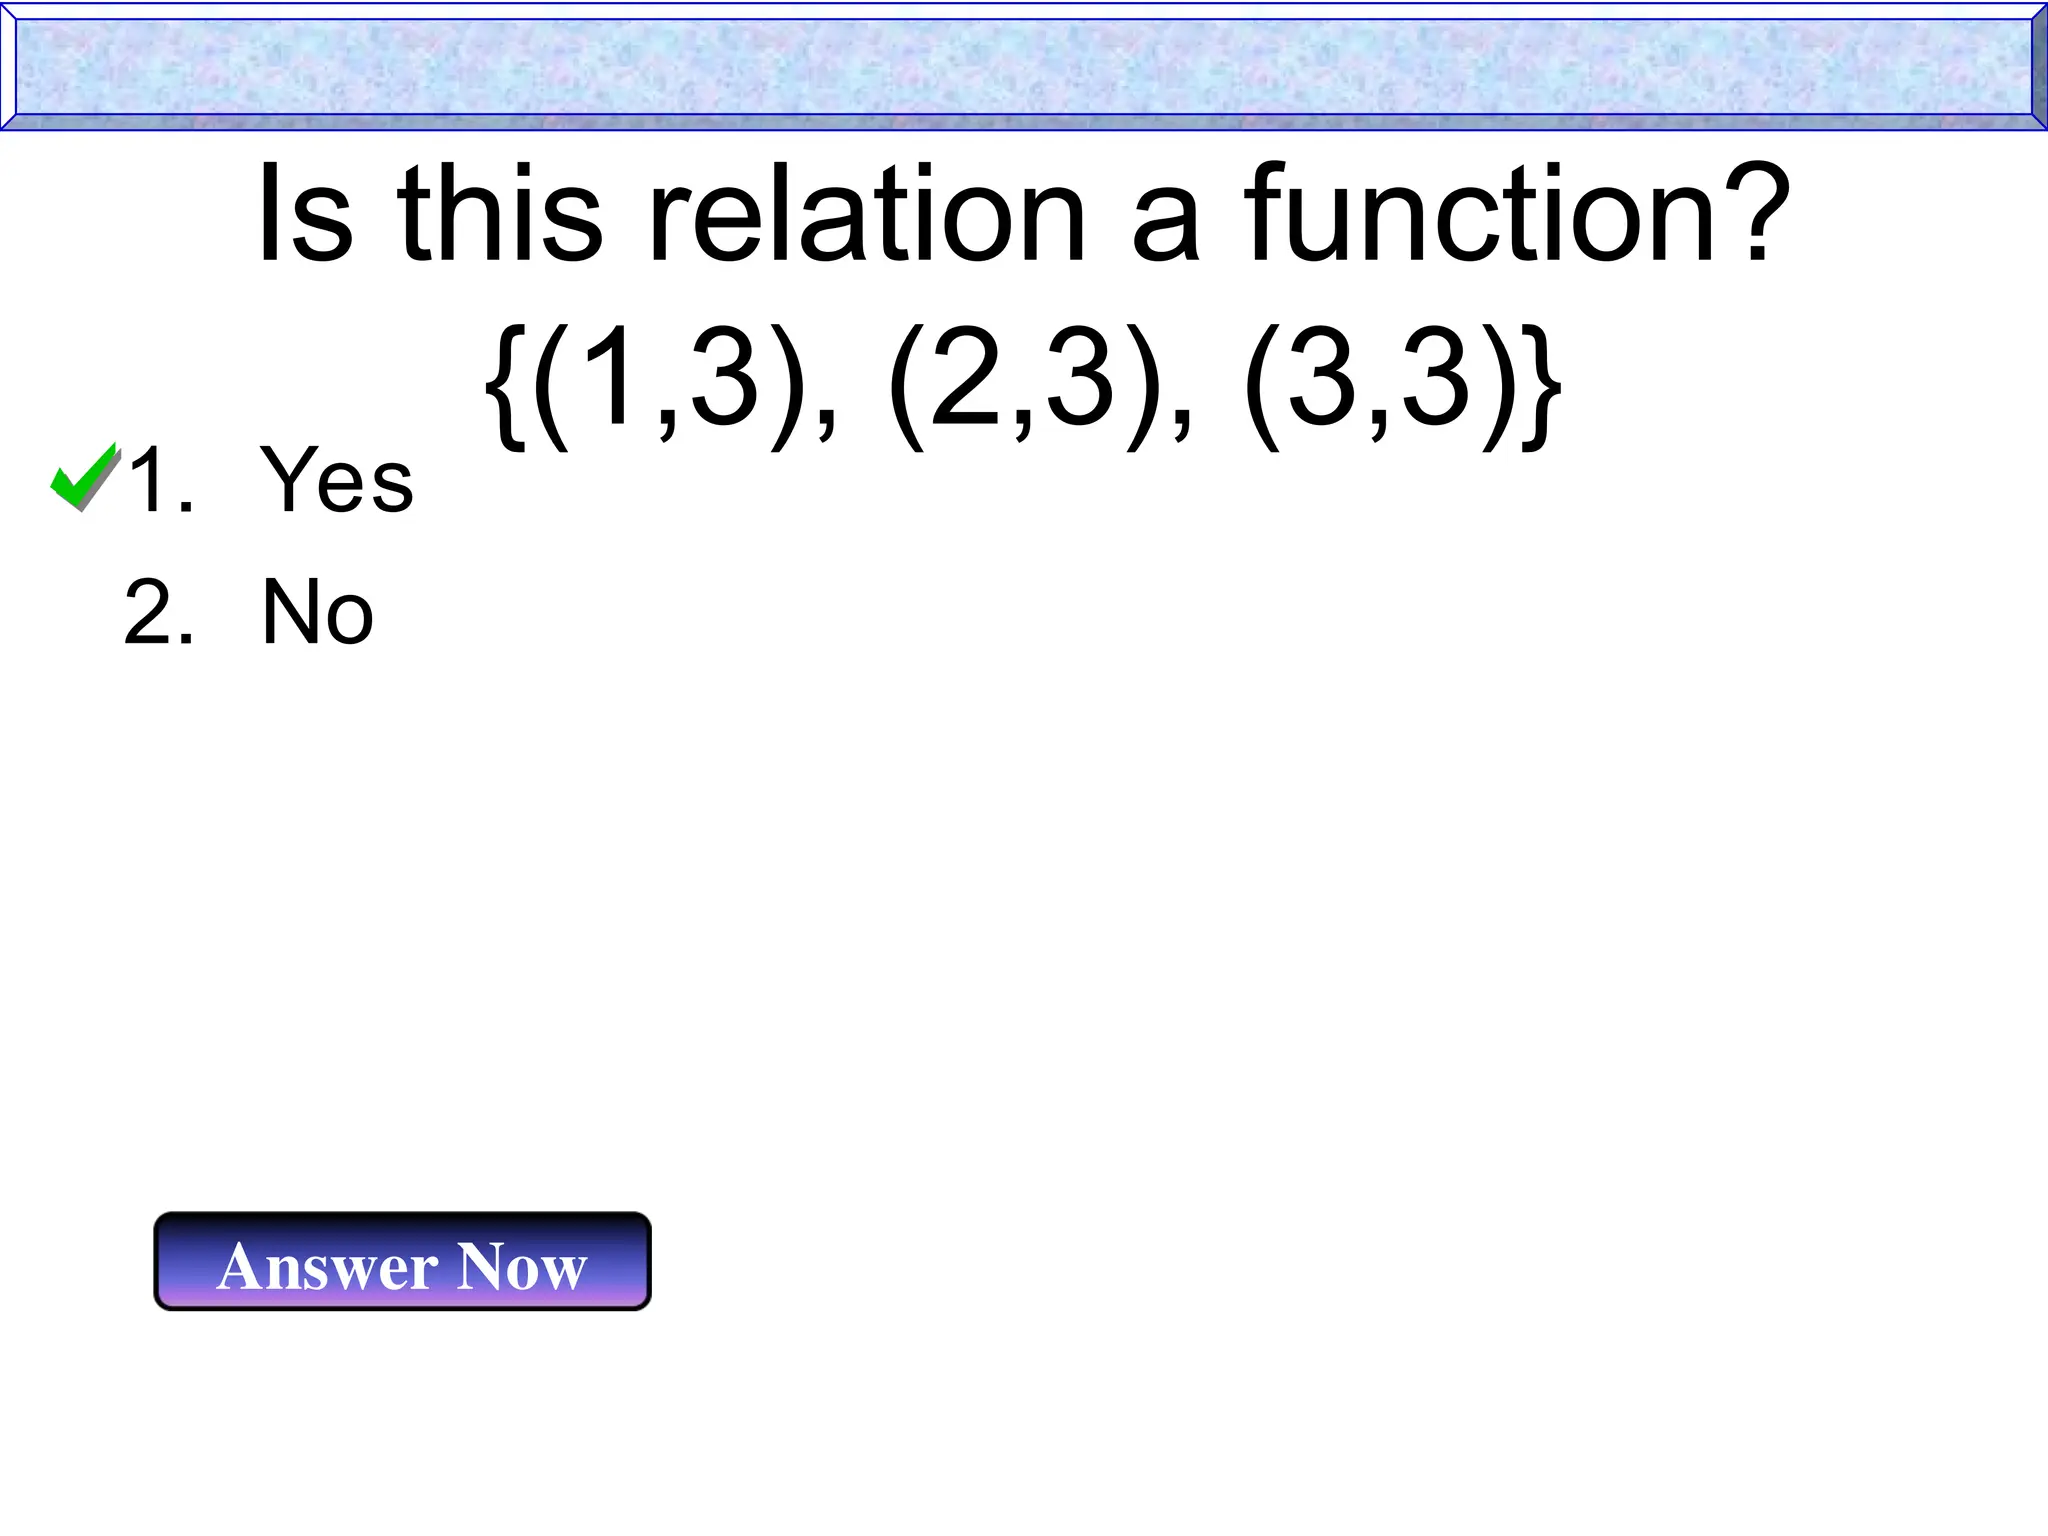
47.
Is this relationa function?
{(1,3), (2,3), (3,3)}
1. Yes
2. No
Answer Now
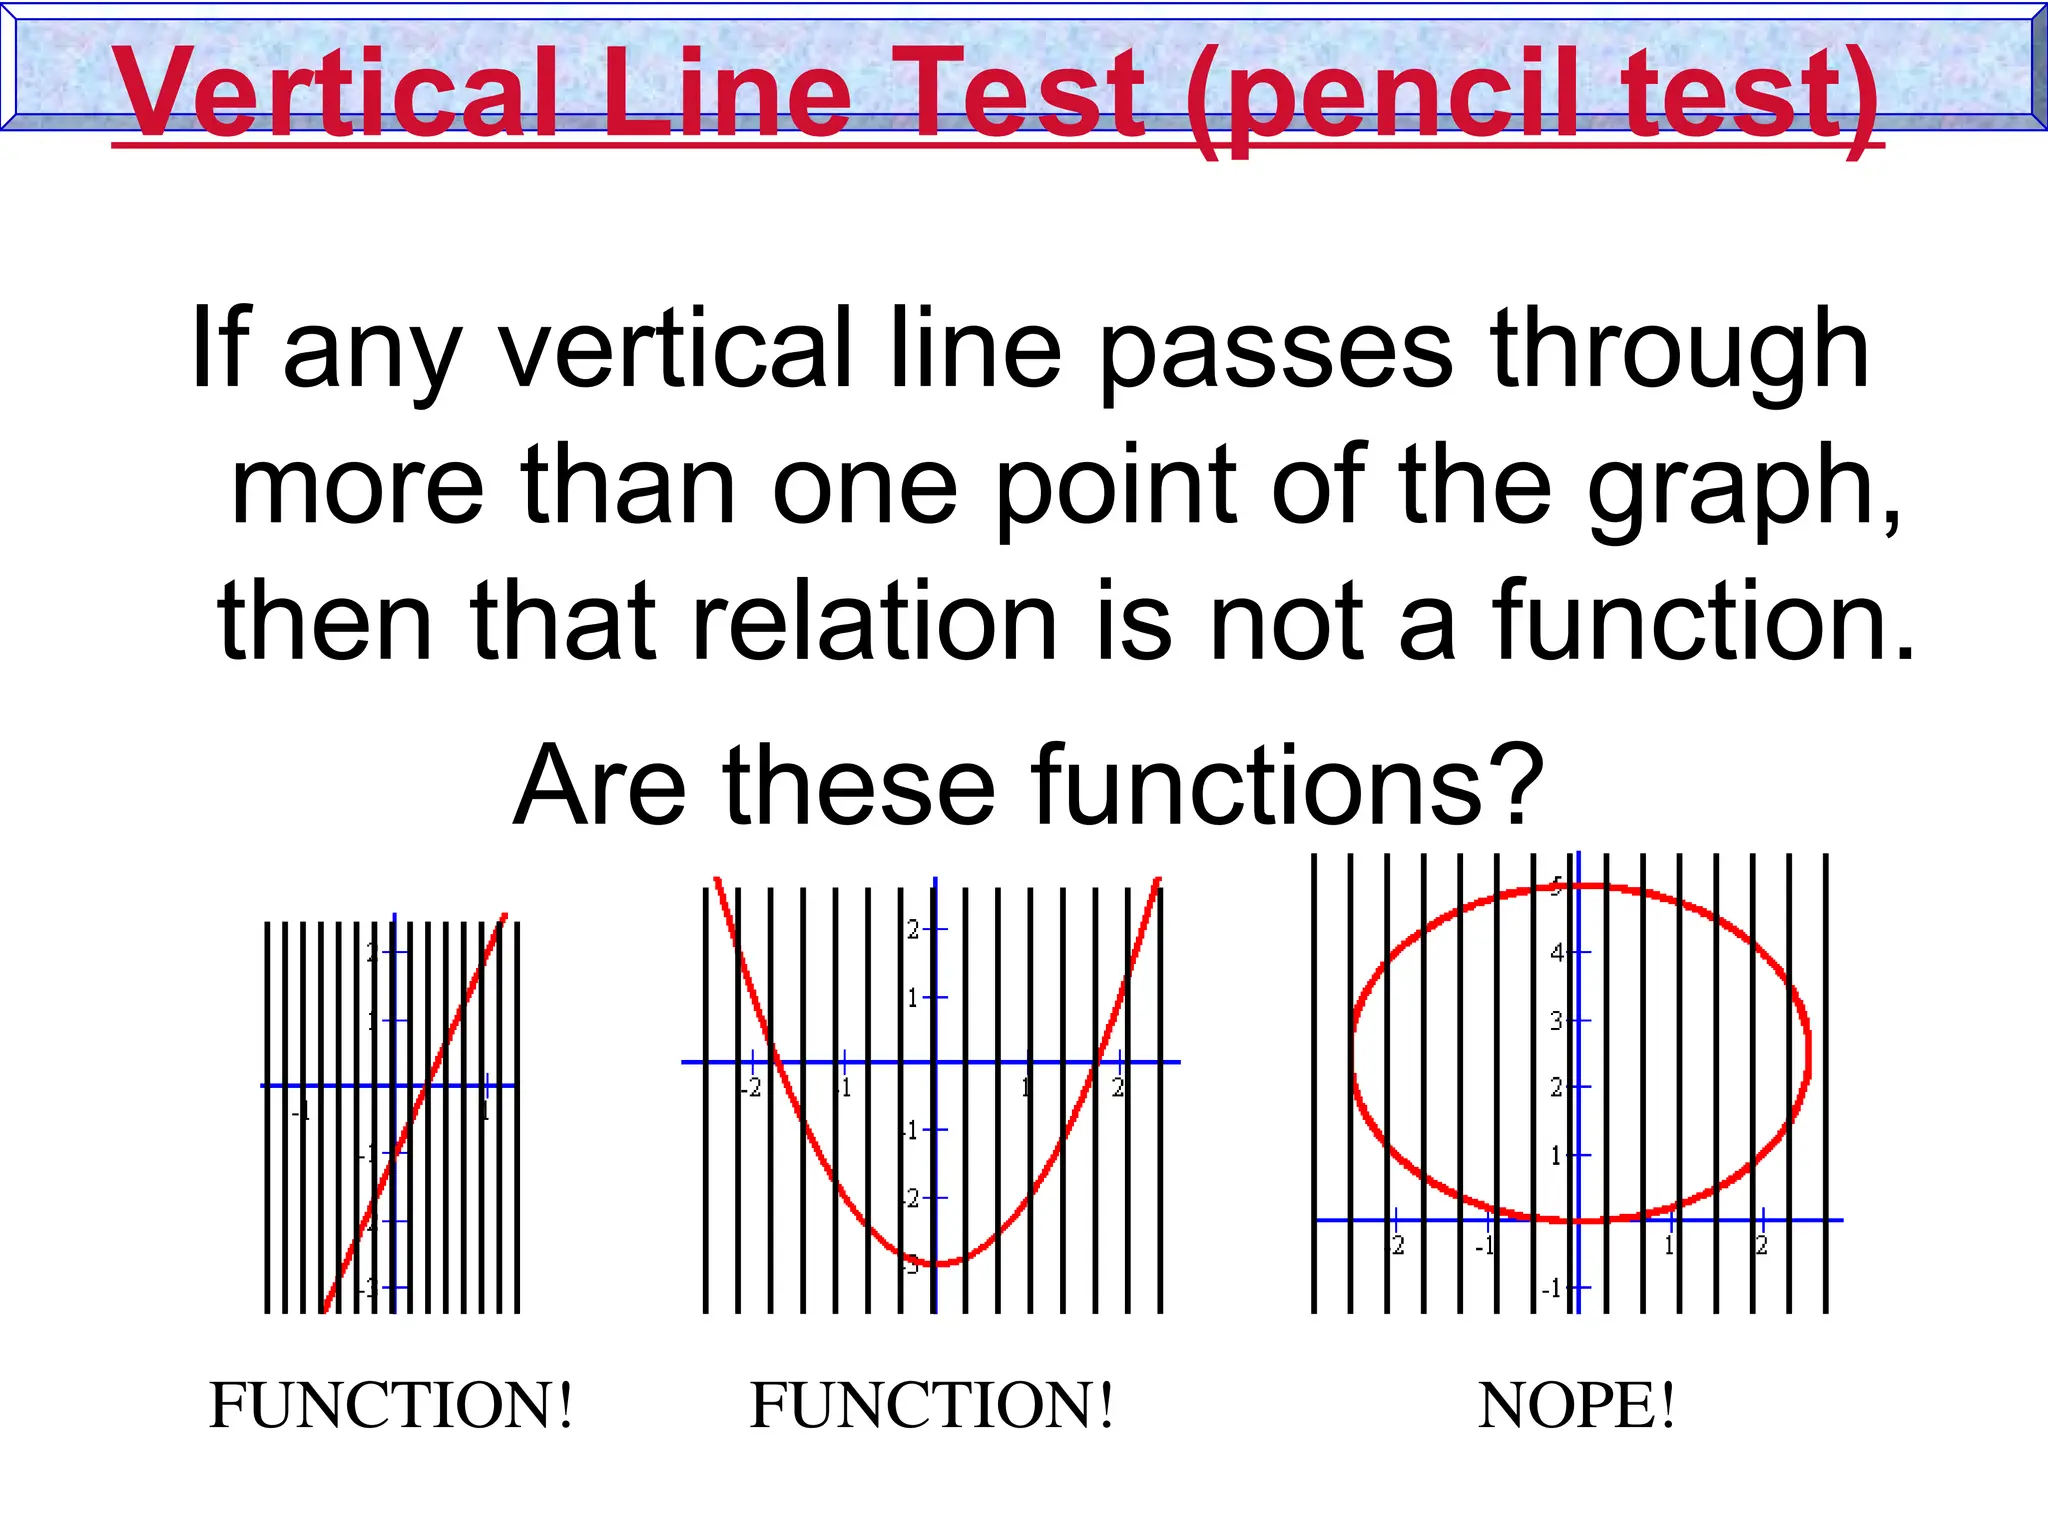
48.
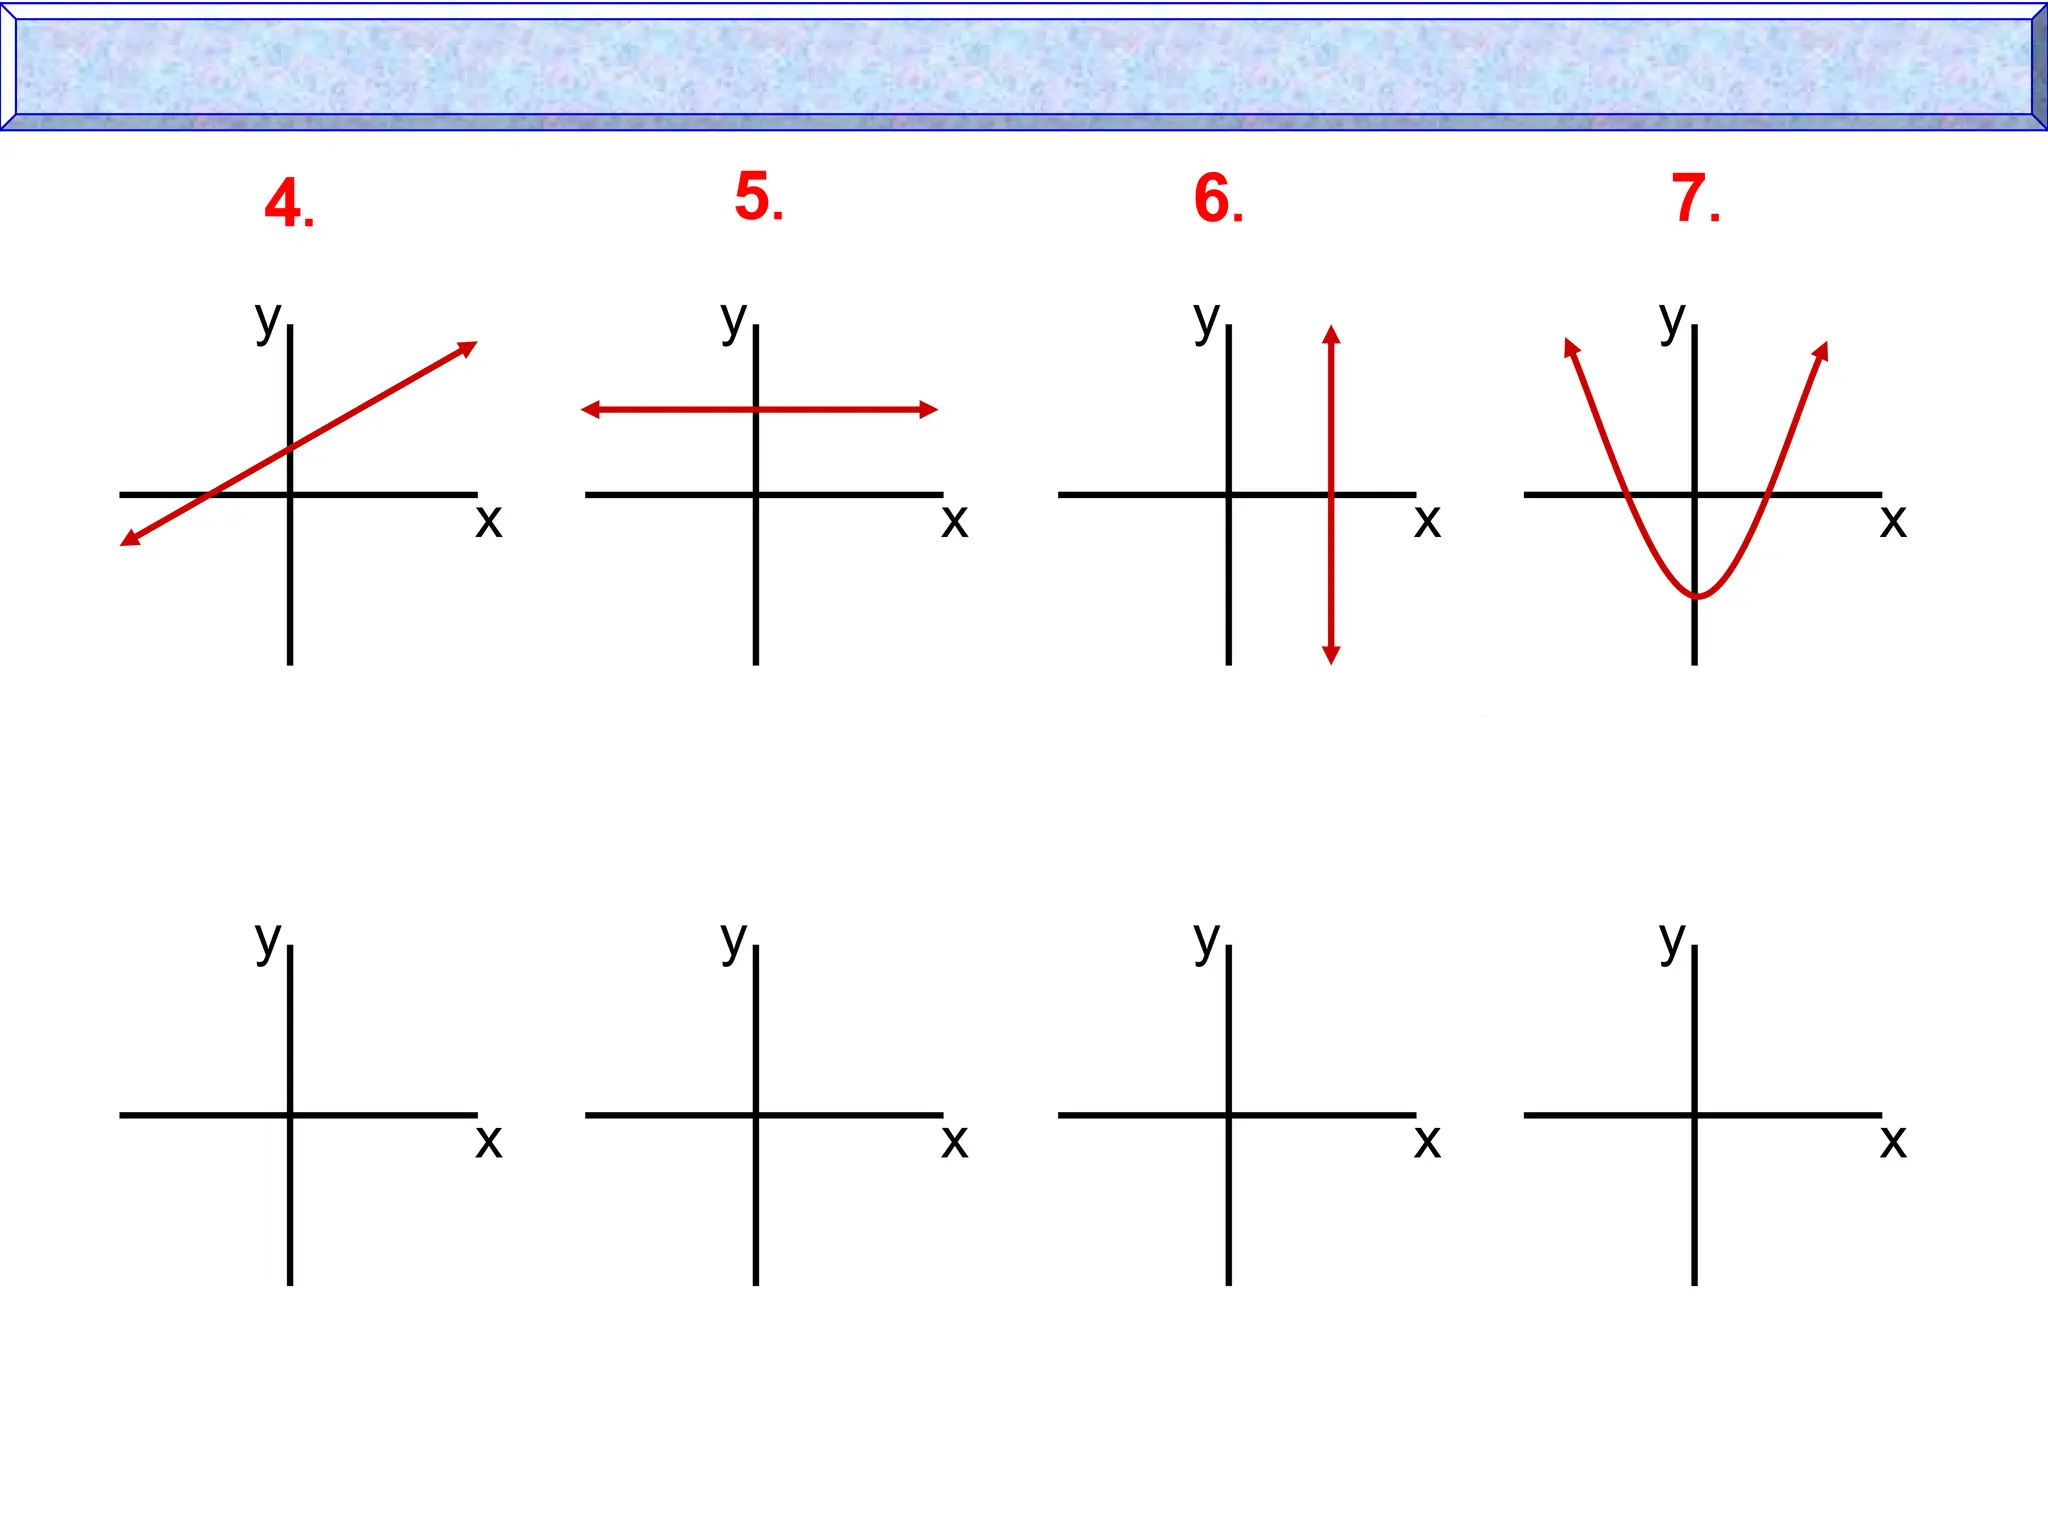
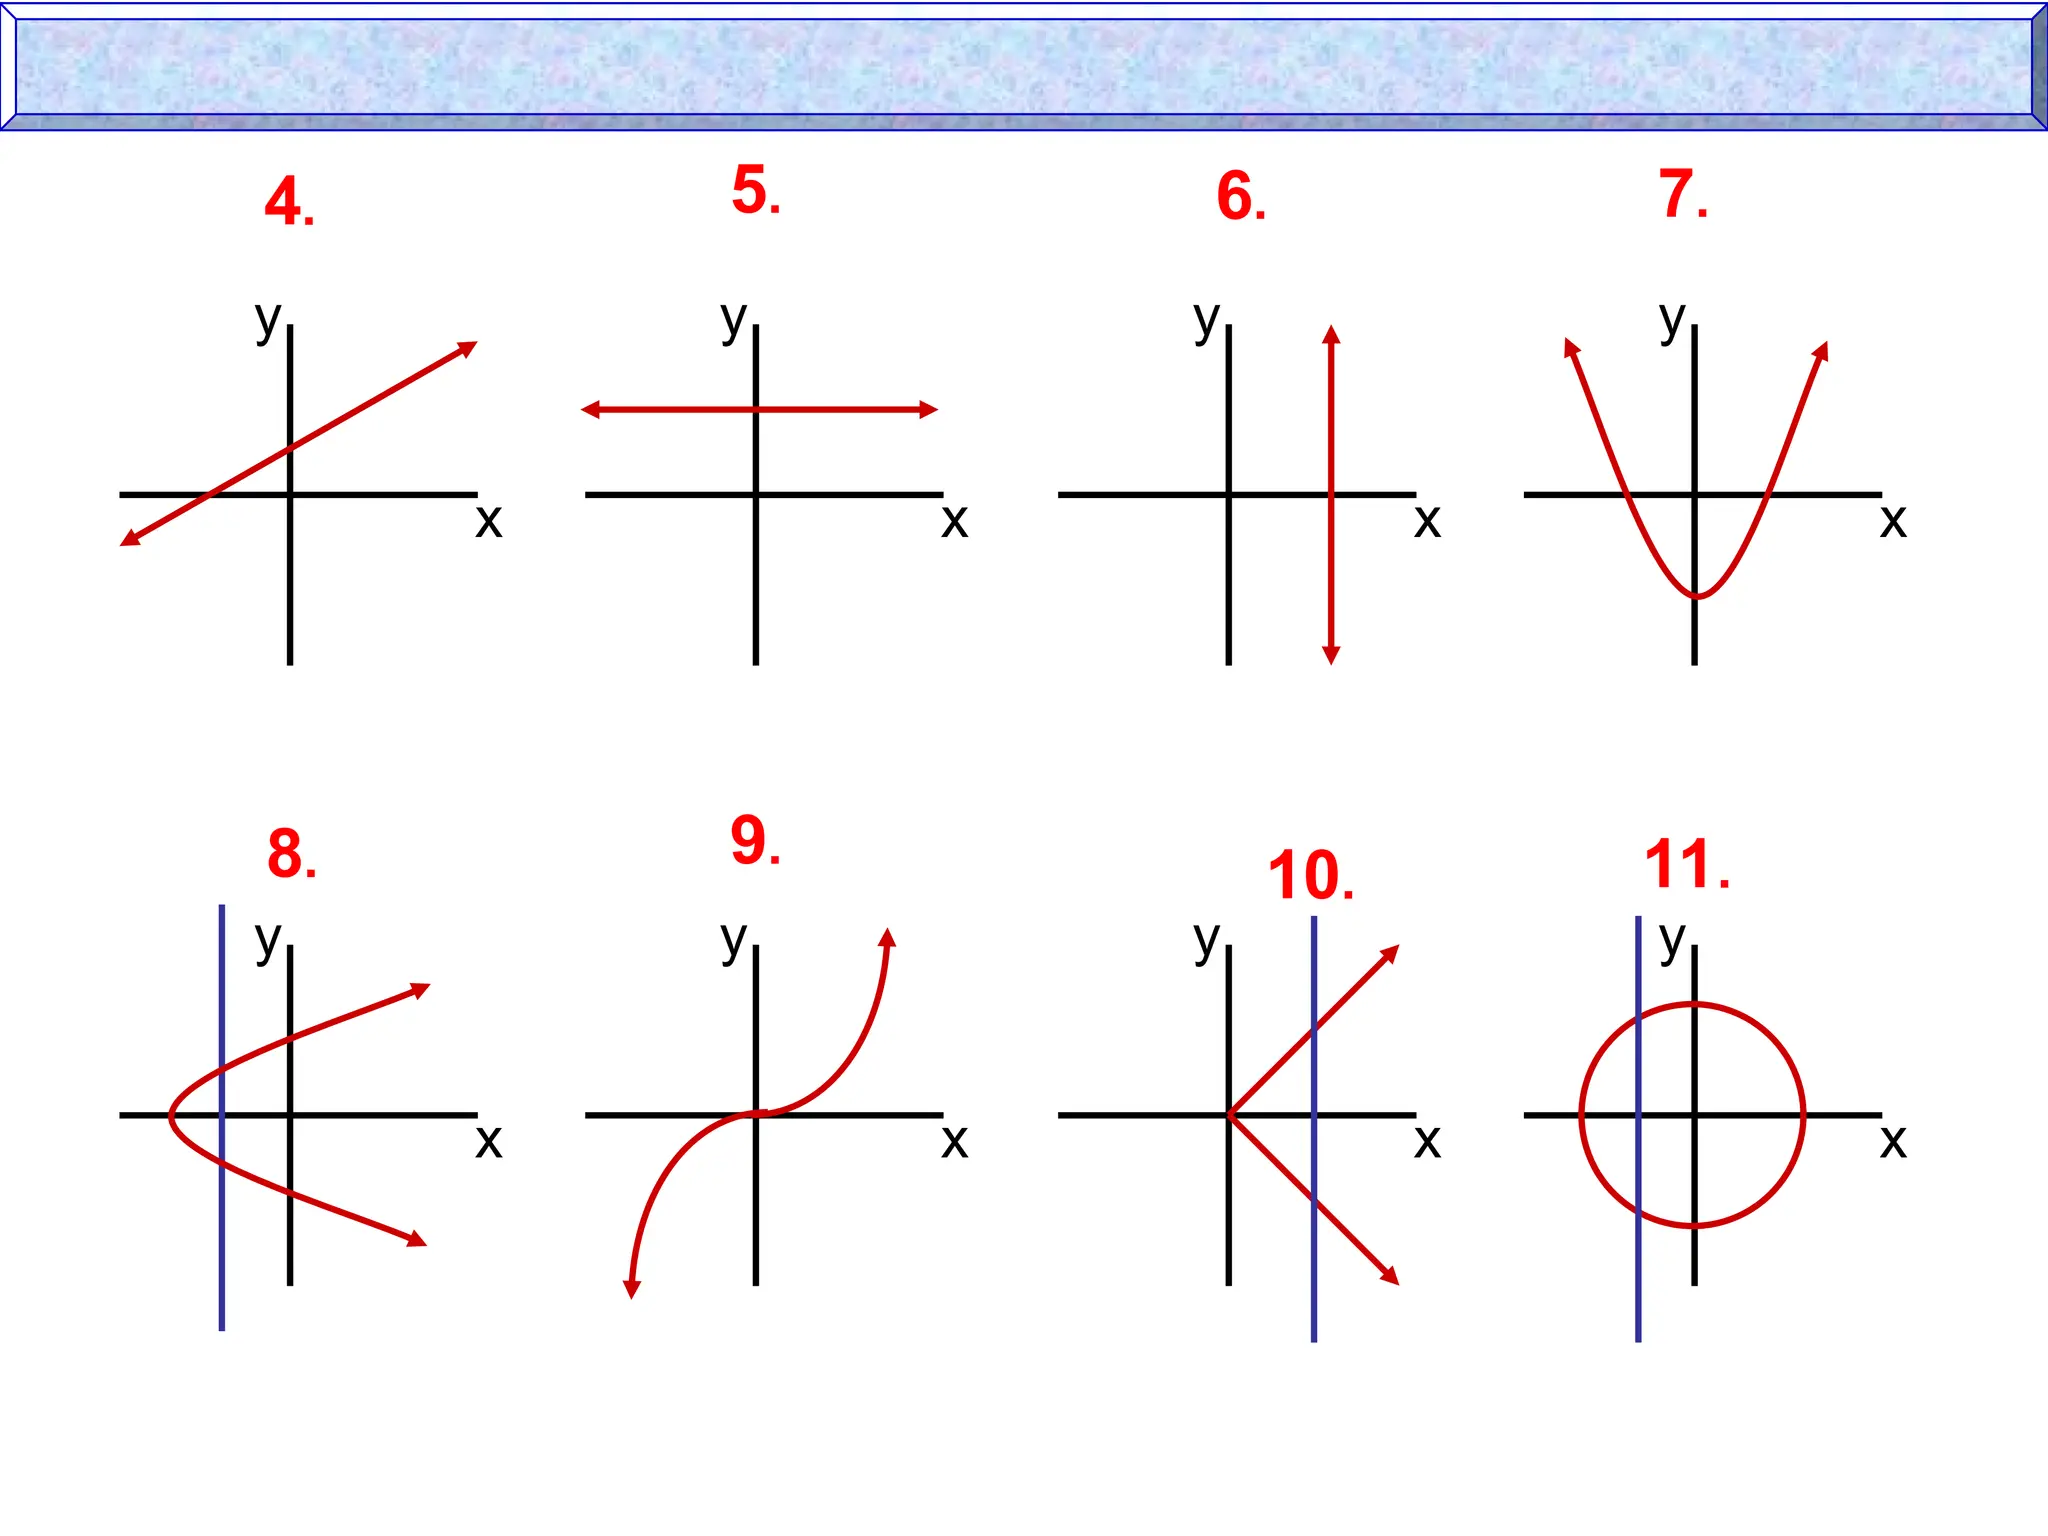
Vertical Line Test(pencil test)
If any vertical line passes through
more than one point of the graph,
then that relation is not a function.
Are these functions?
FUNCTION! FUNCTION! NOPE!
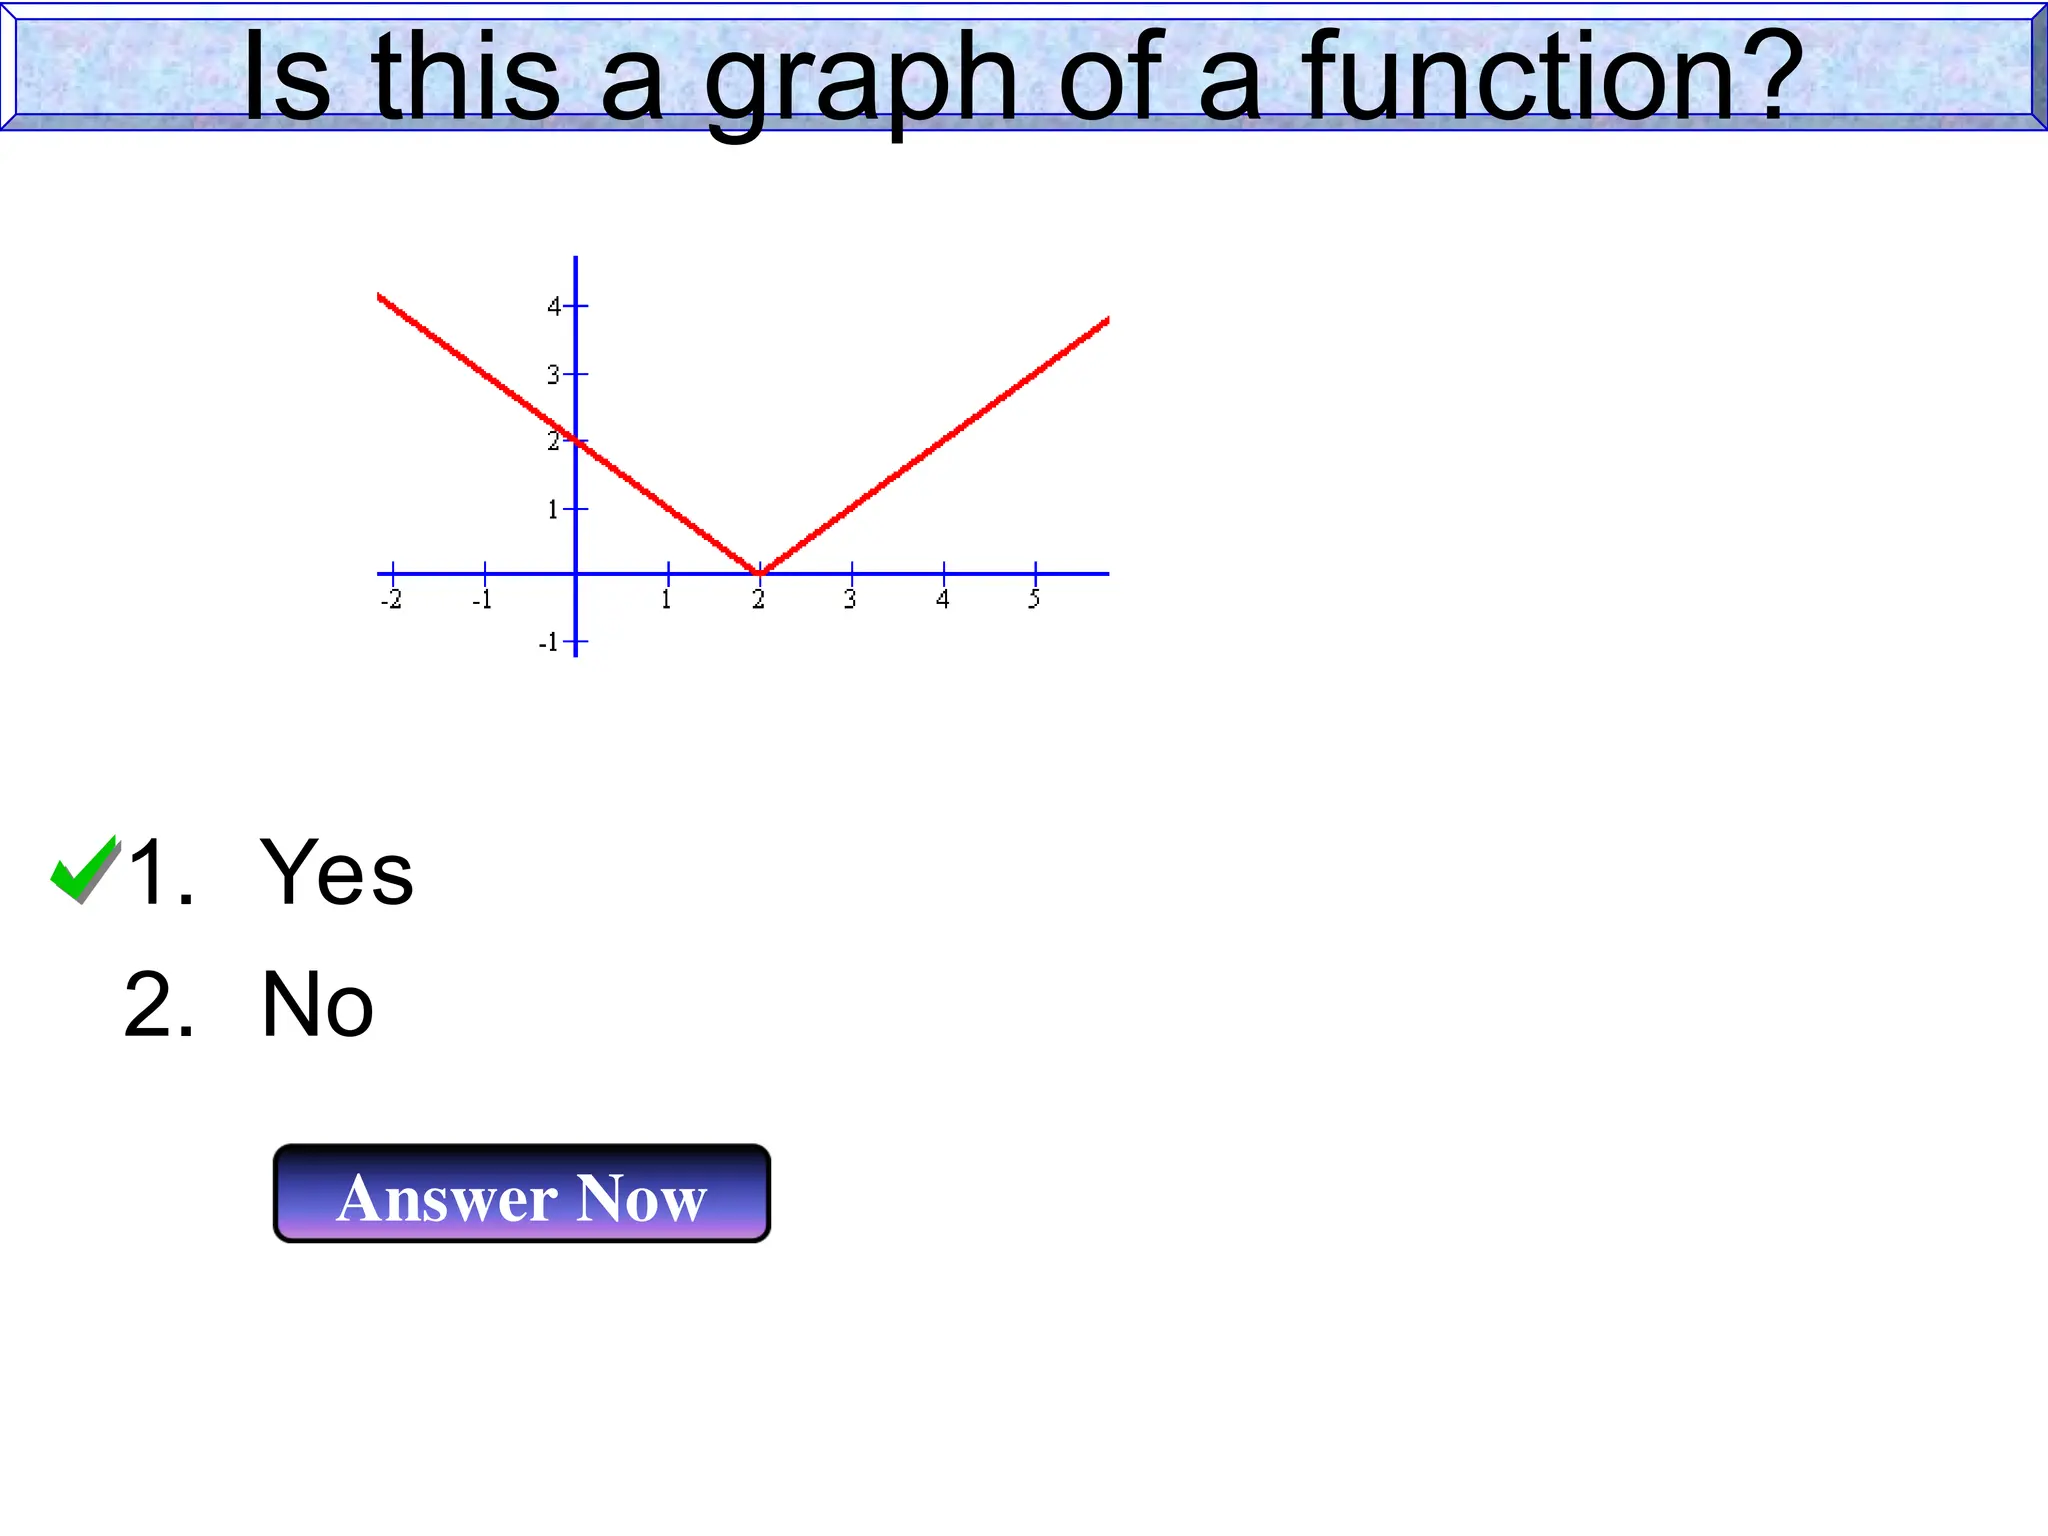
Is this agraph of a function?
1. Yes
2. No
Answer Now
51.
When an equationrepresents a function, the variable (usually x) whose values make
up the domain is called the independent variable.
Relations and Functions
Relations and Functions
52.
When an equationrepresents a function, the variable
(usually x) whose values make up the
domain is called the independent variable.
The other variable (usually y) whose values make
up the range is called the dependent variable
because its values depend on x.
Relations and Functions
Relations and Functions
53.
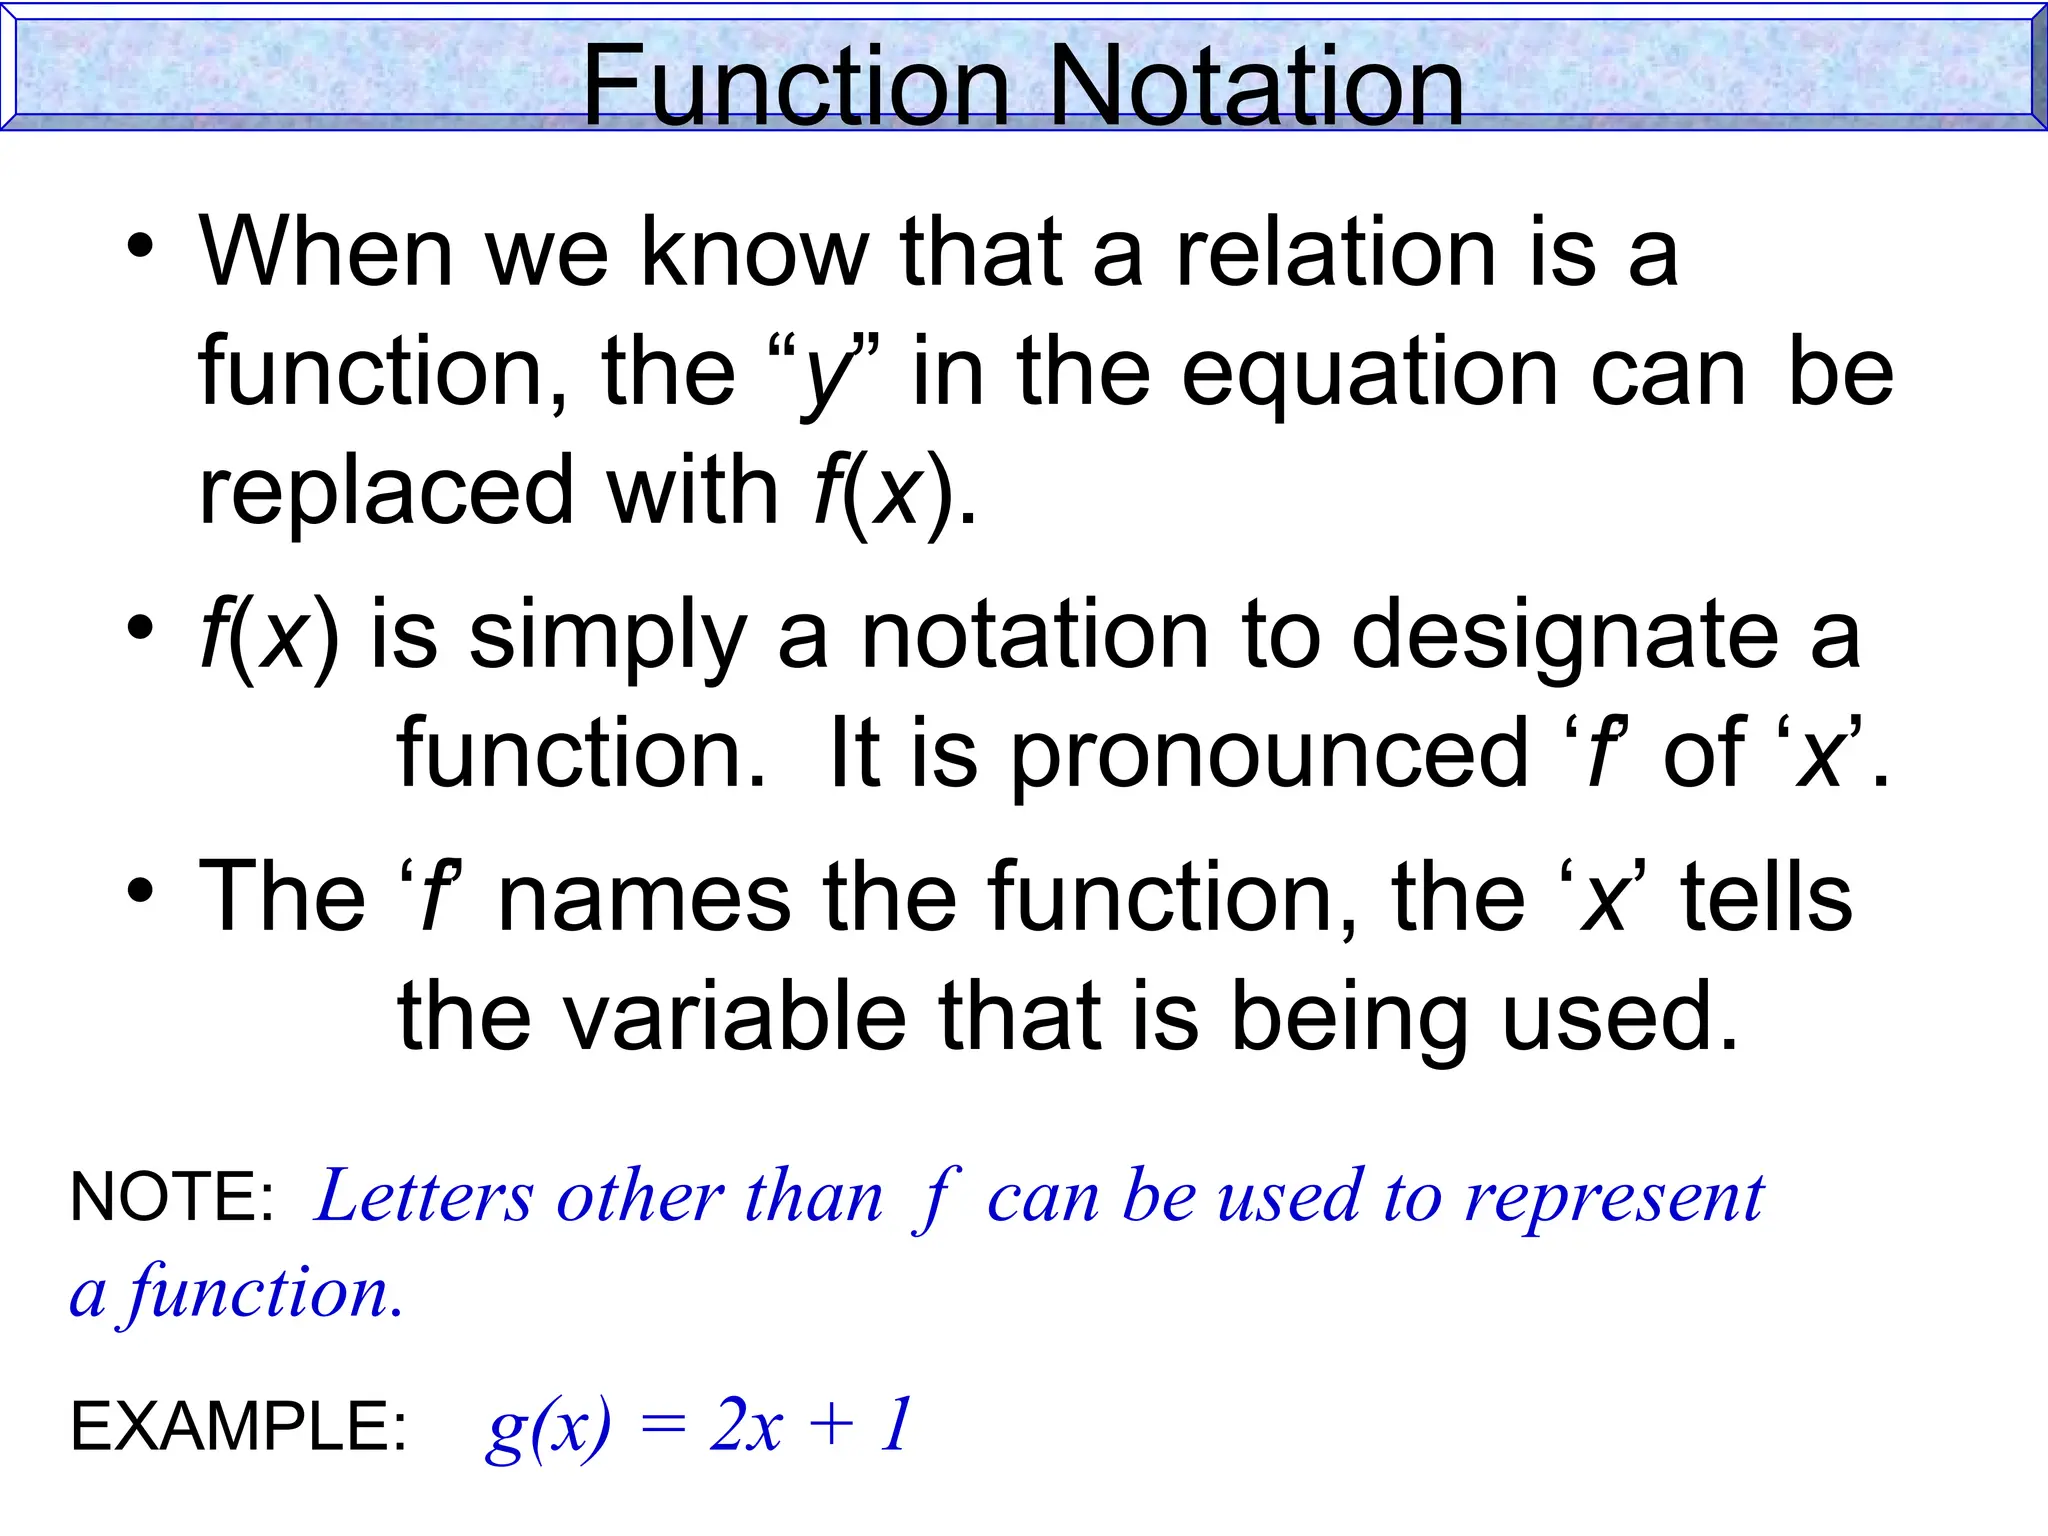
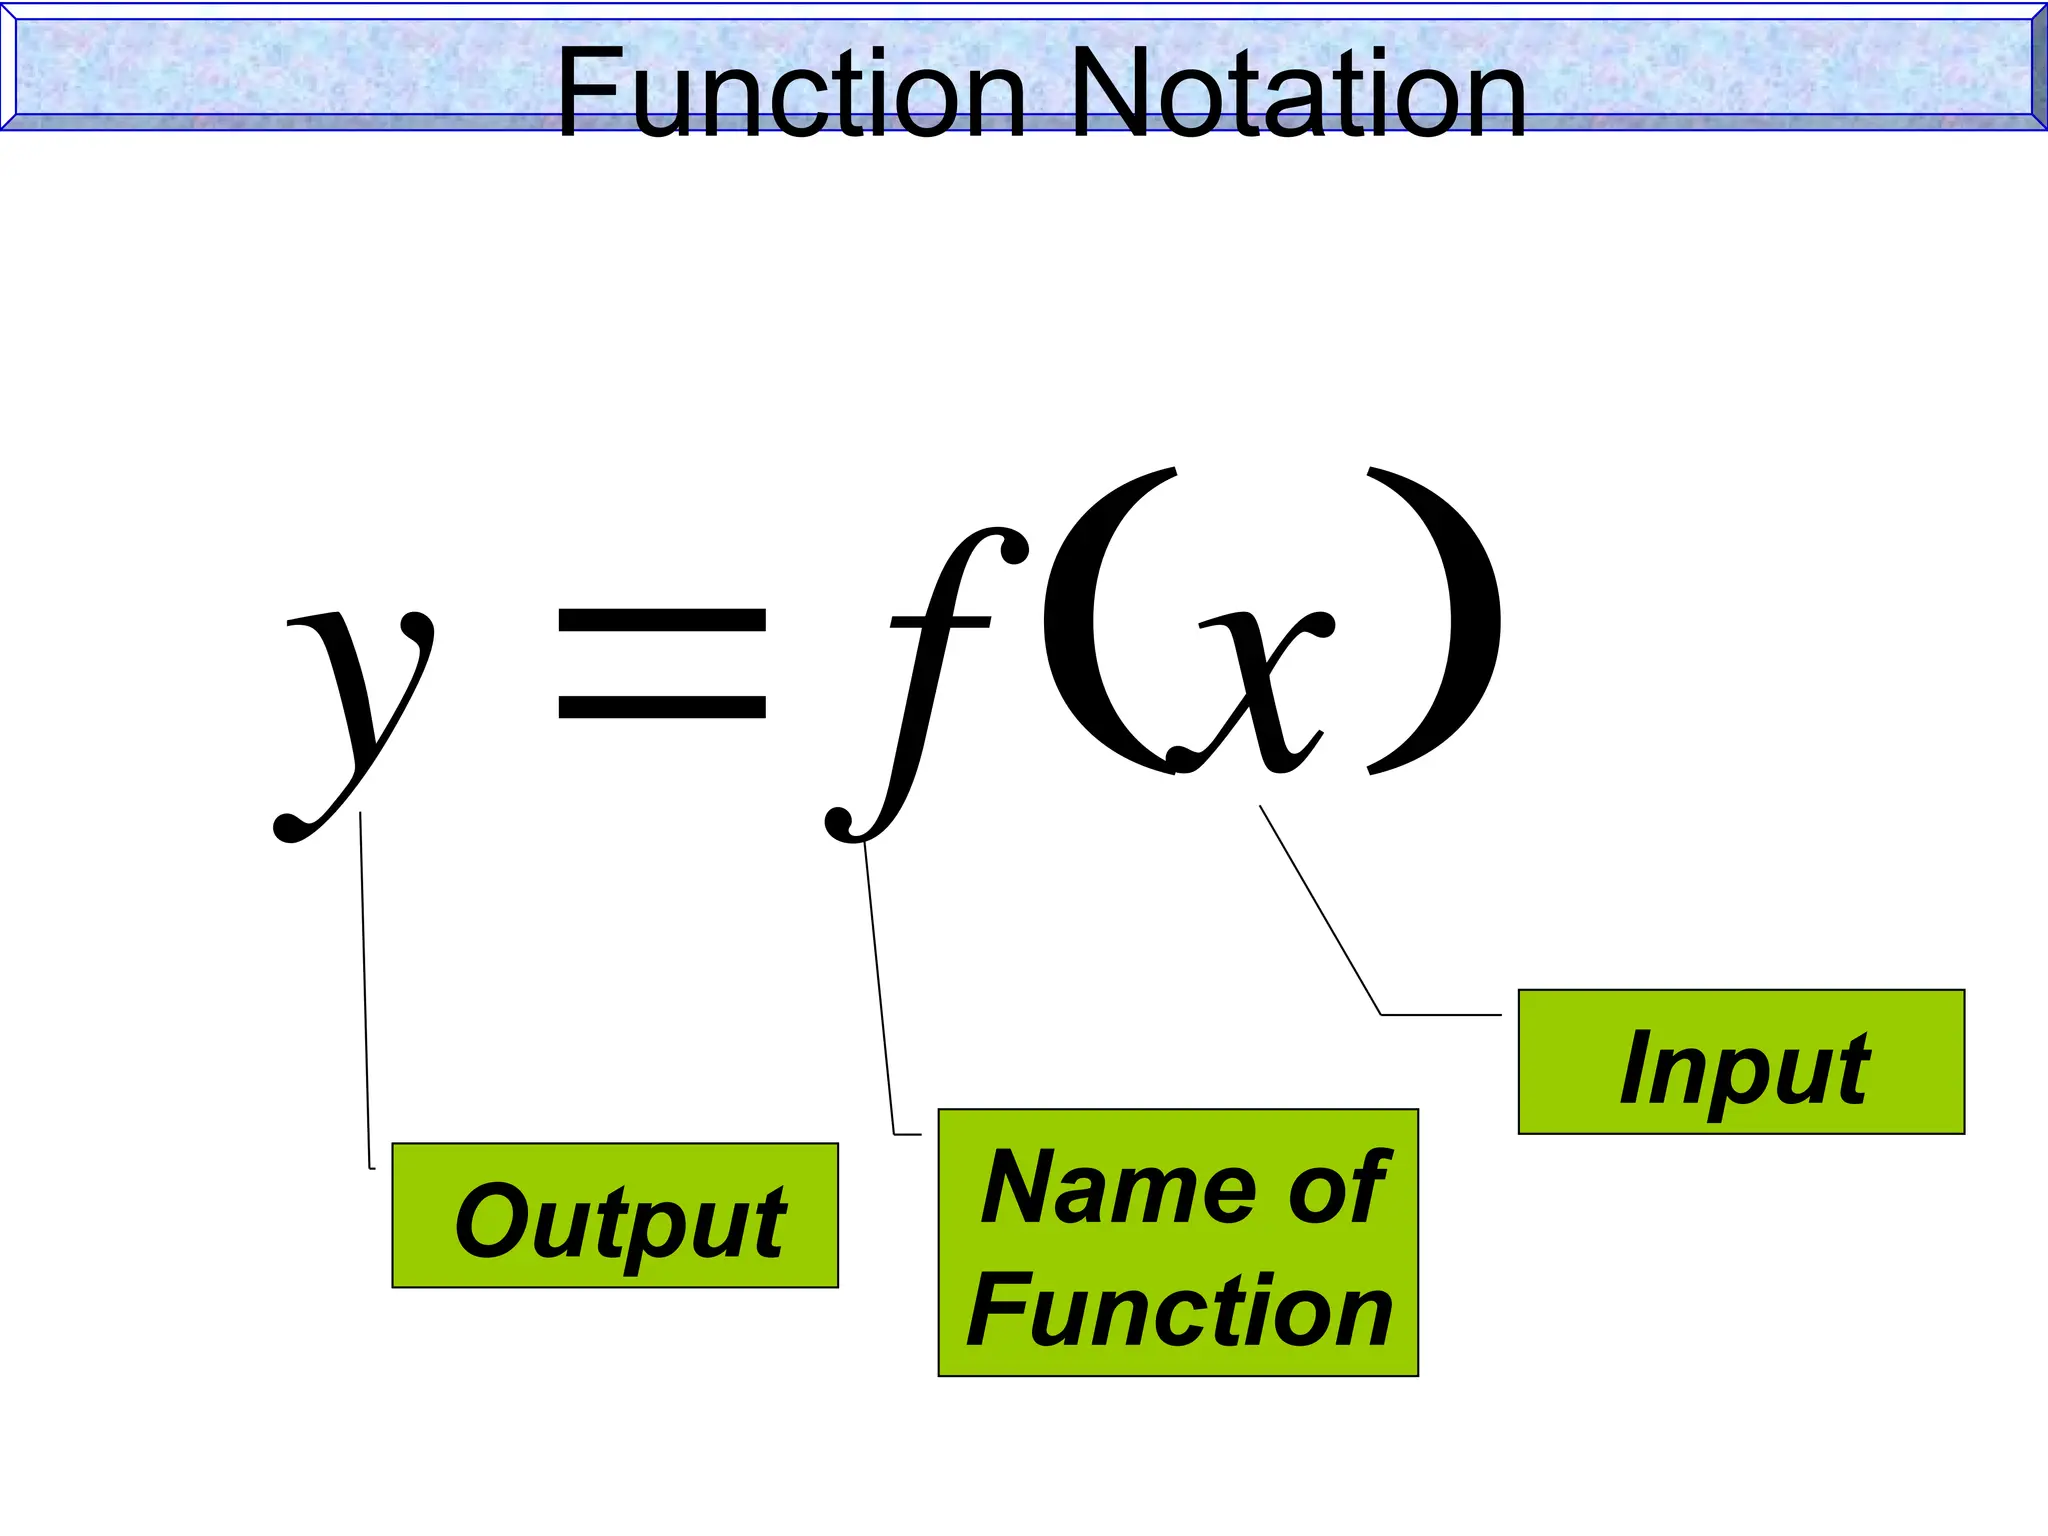
Function Notation
• Whenwe know that a relation is a
function, the “y” in the equation can be
replaced with f(x).
• f(x) is simply a notation to designate a
function. It is pronounced ‘f’ of ‘x’.
• The ‘f’ names the function, the ‘x’ tells
the variable that is being used.
NOTE: Letters other than f can be used to represent
a function.
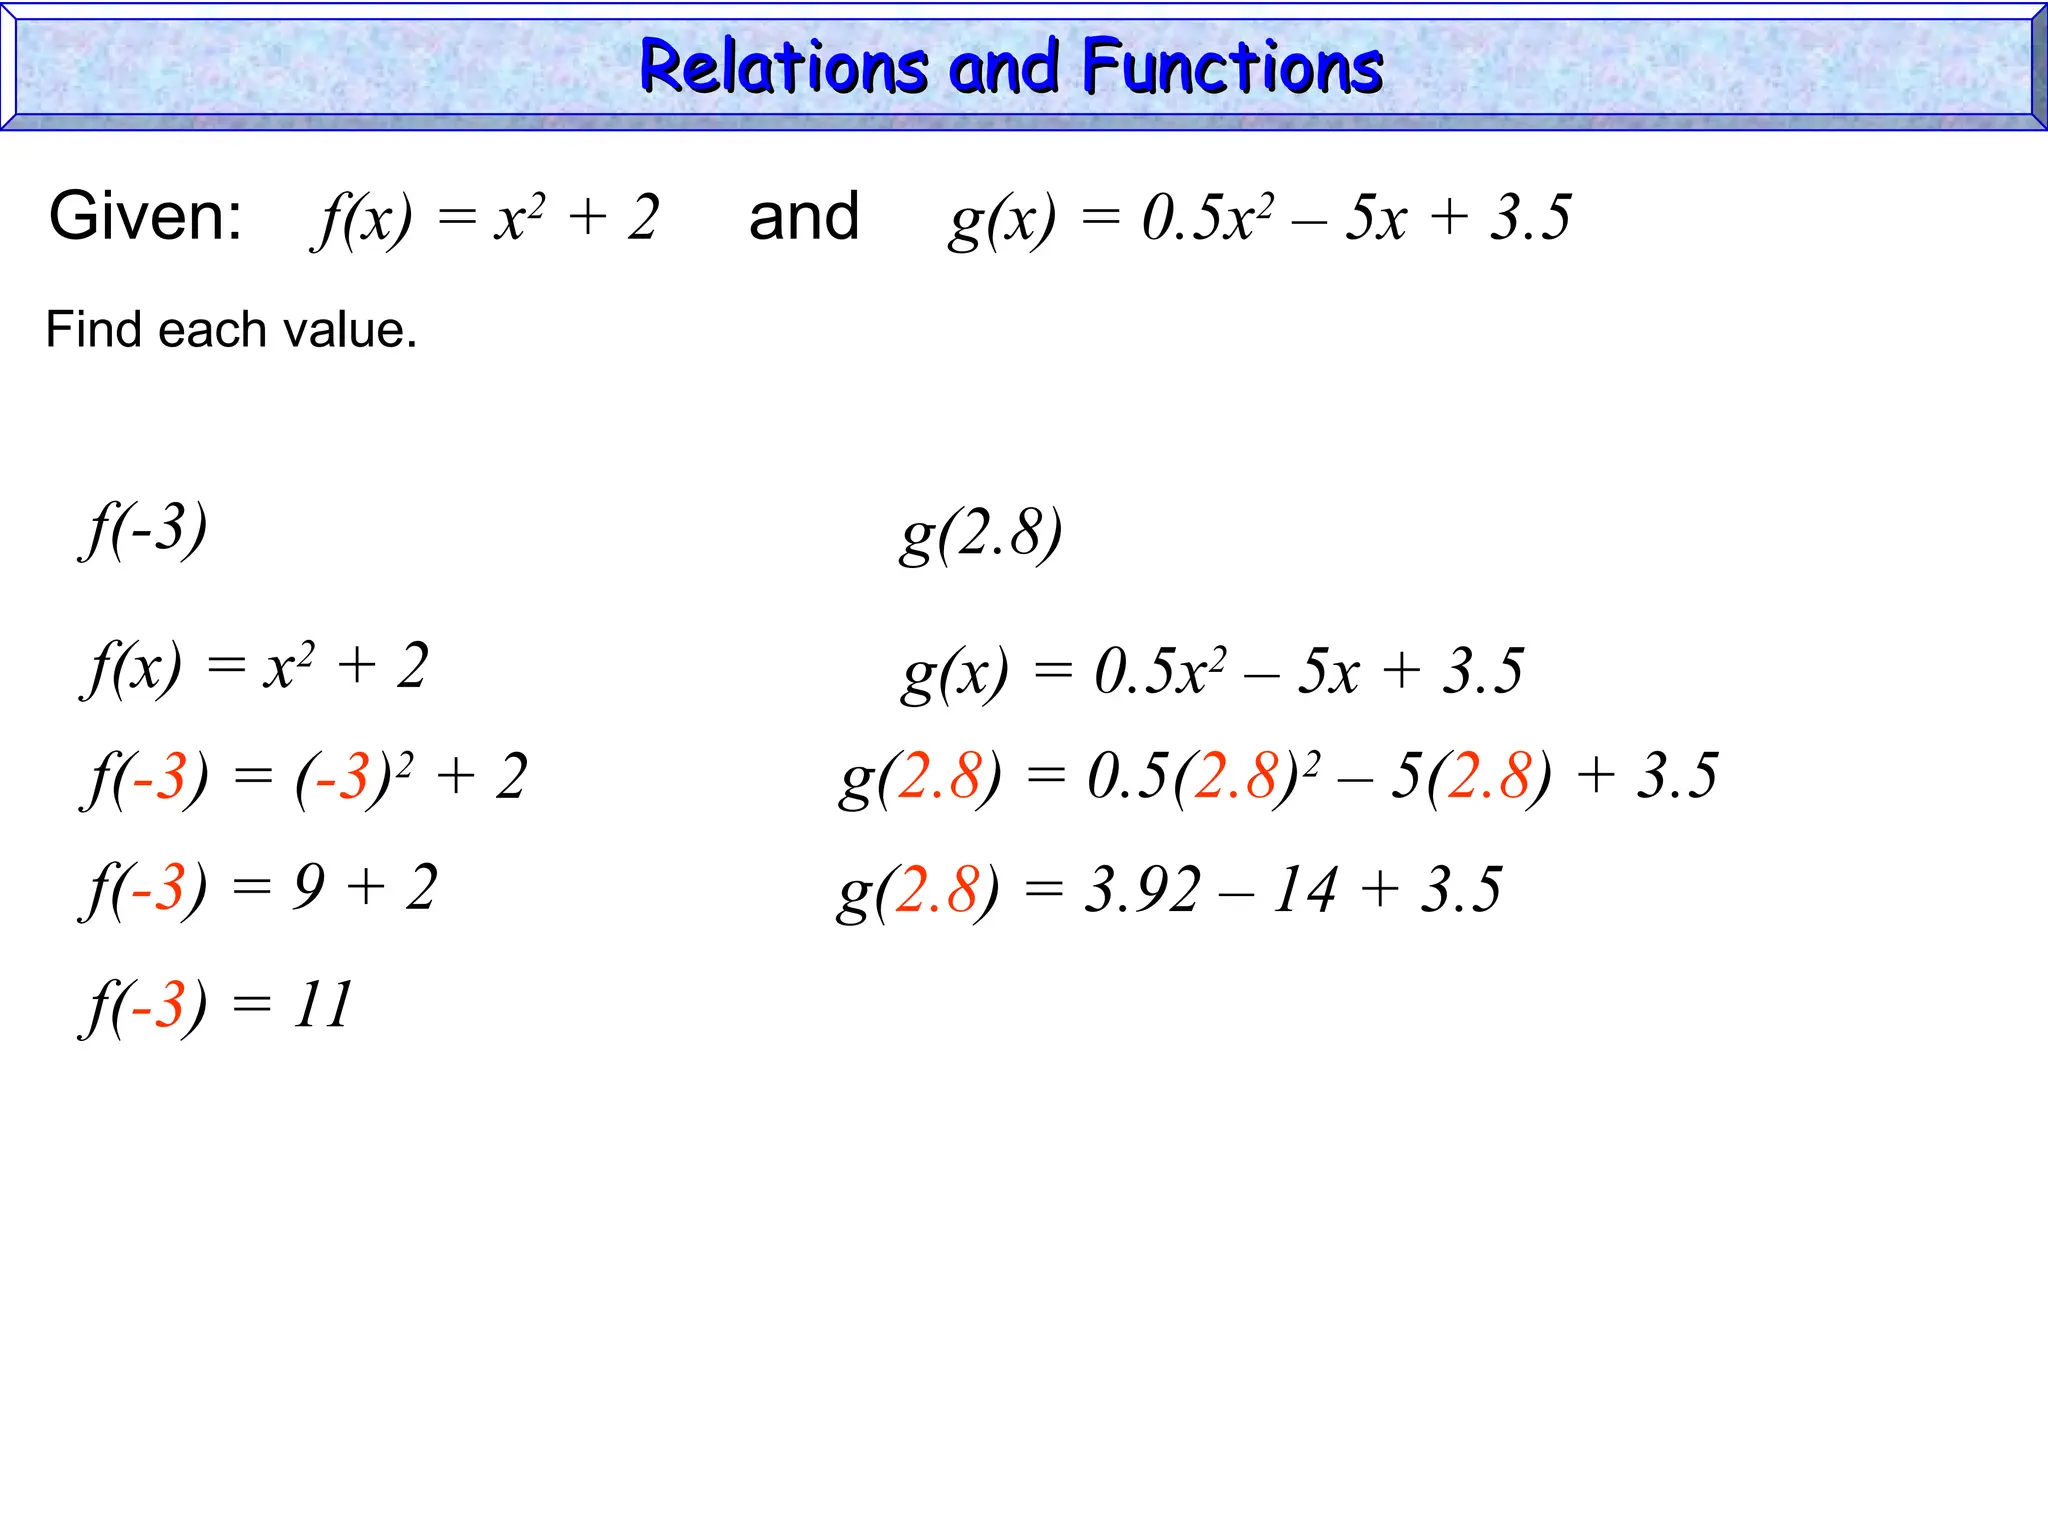
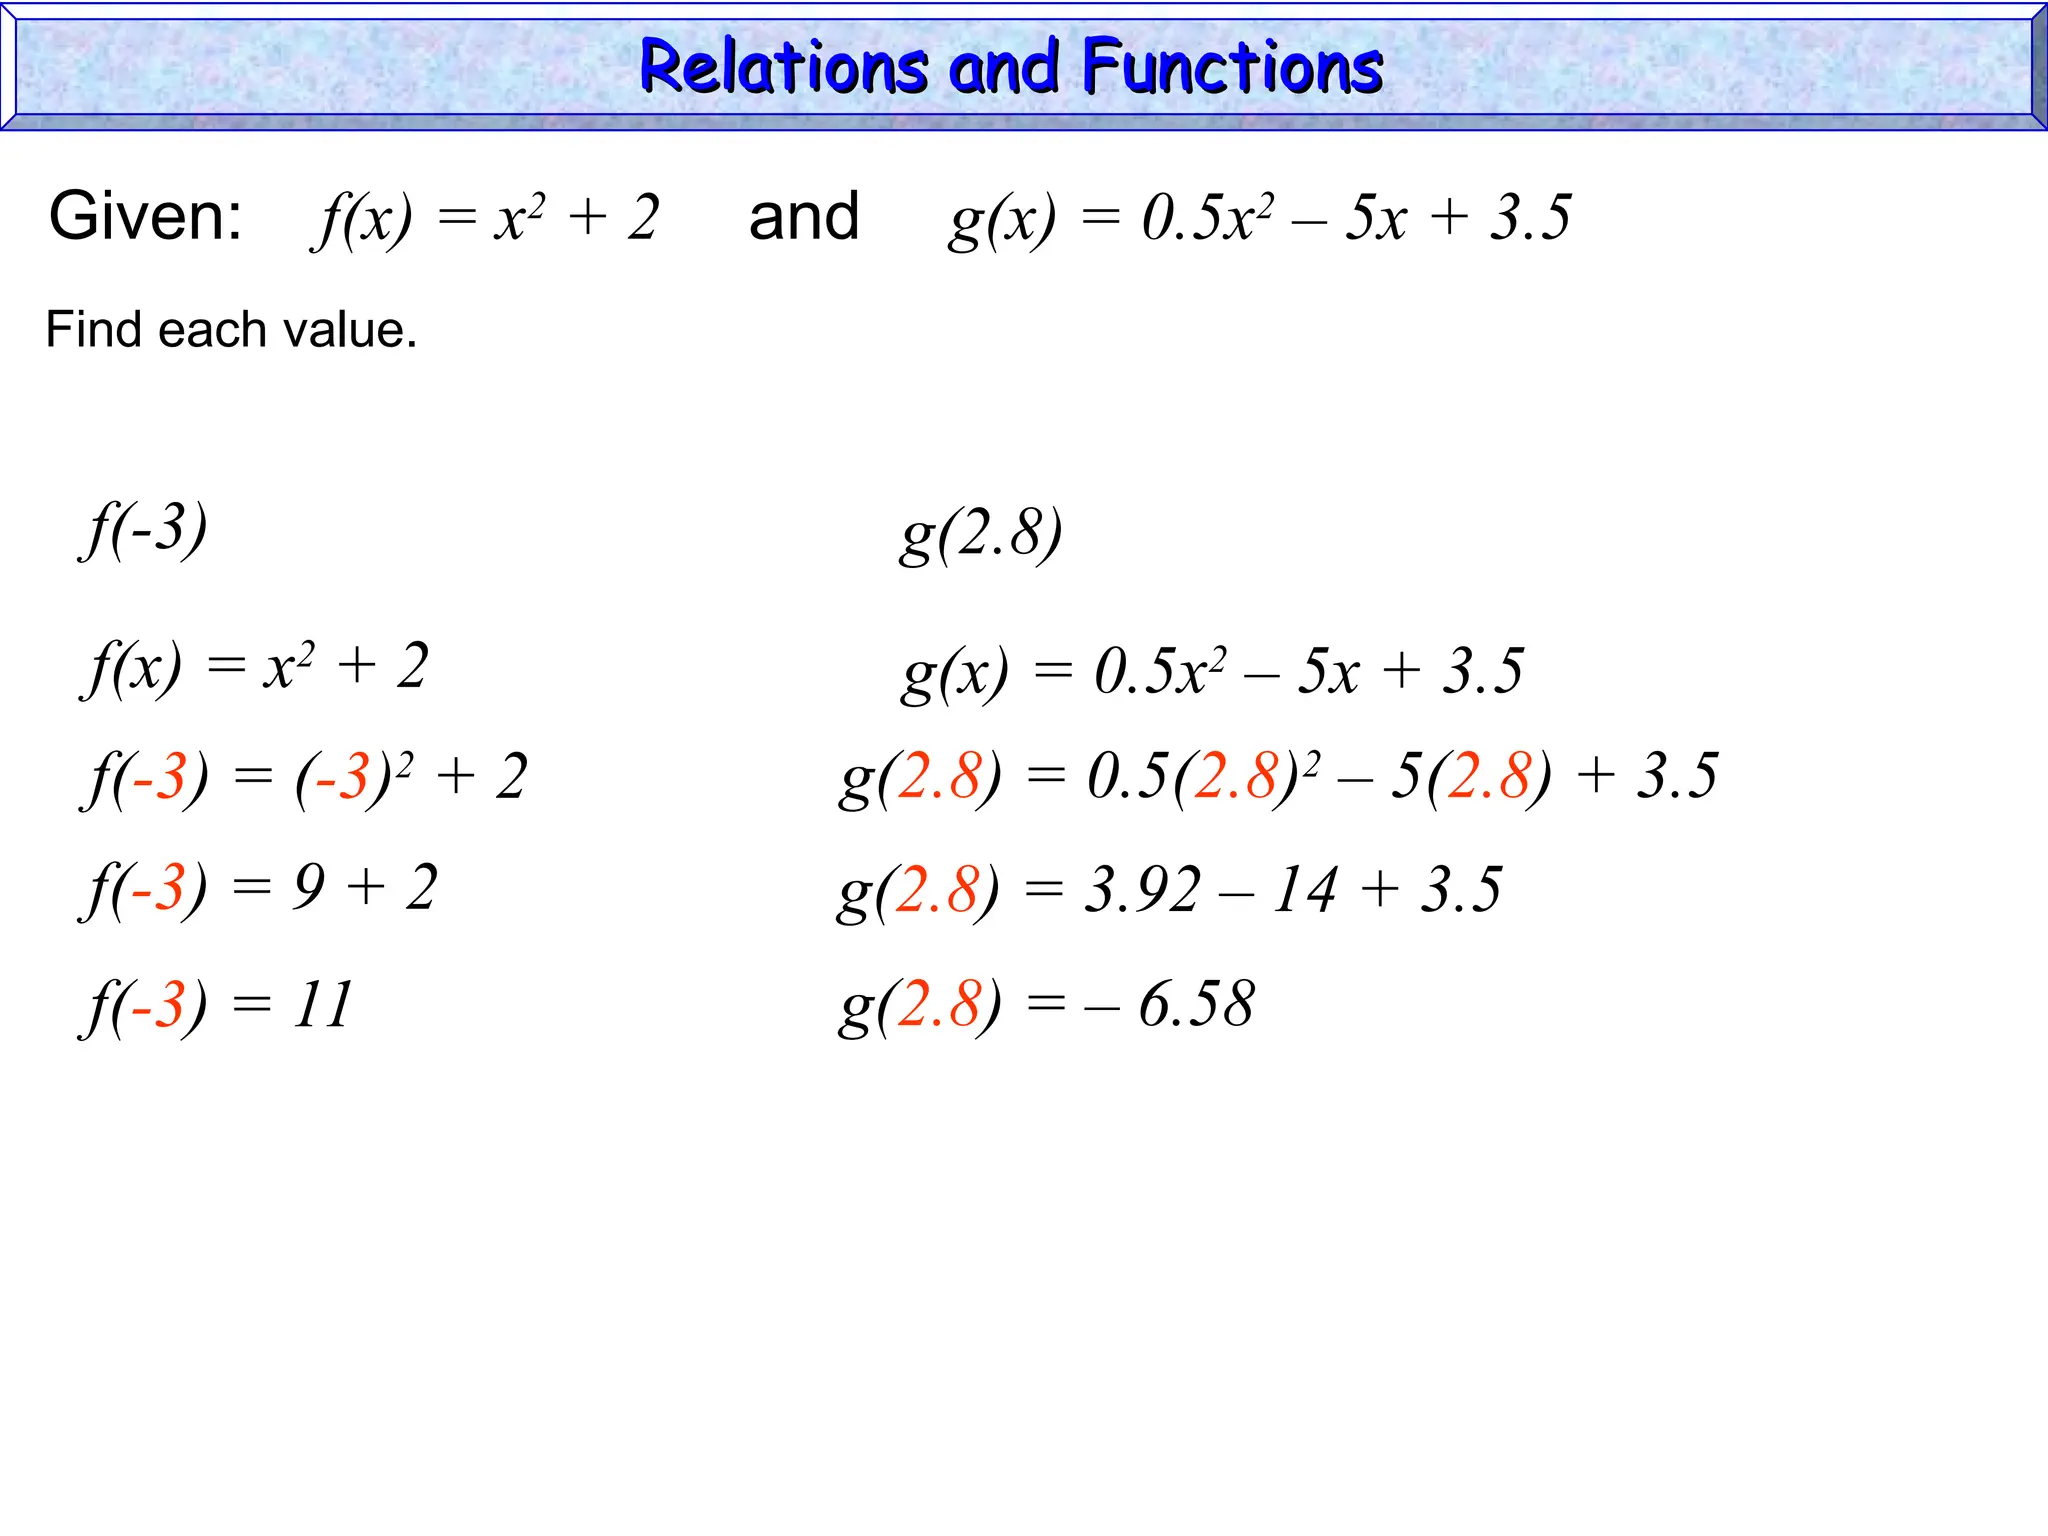
EXAMPLE: g(x) = 2x + 1
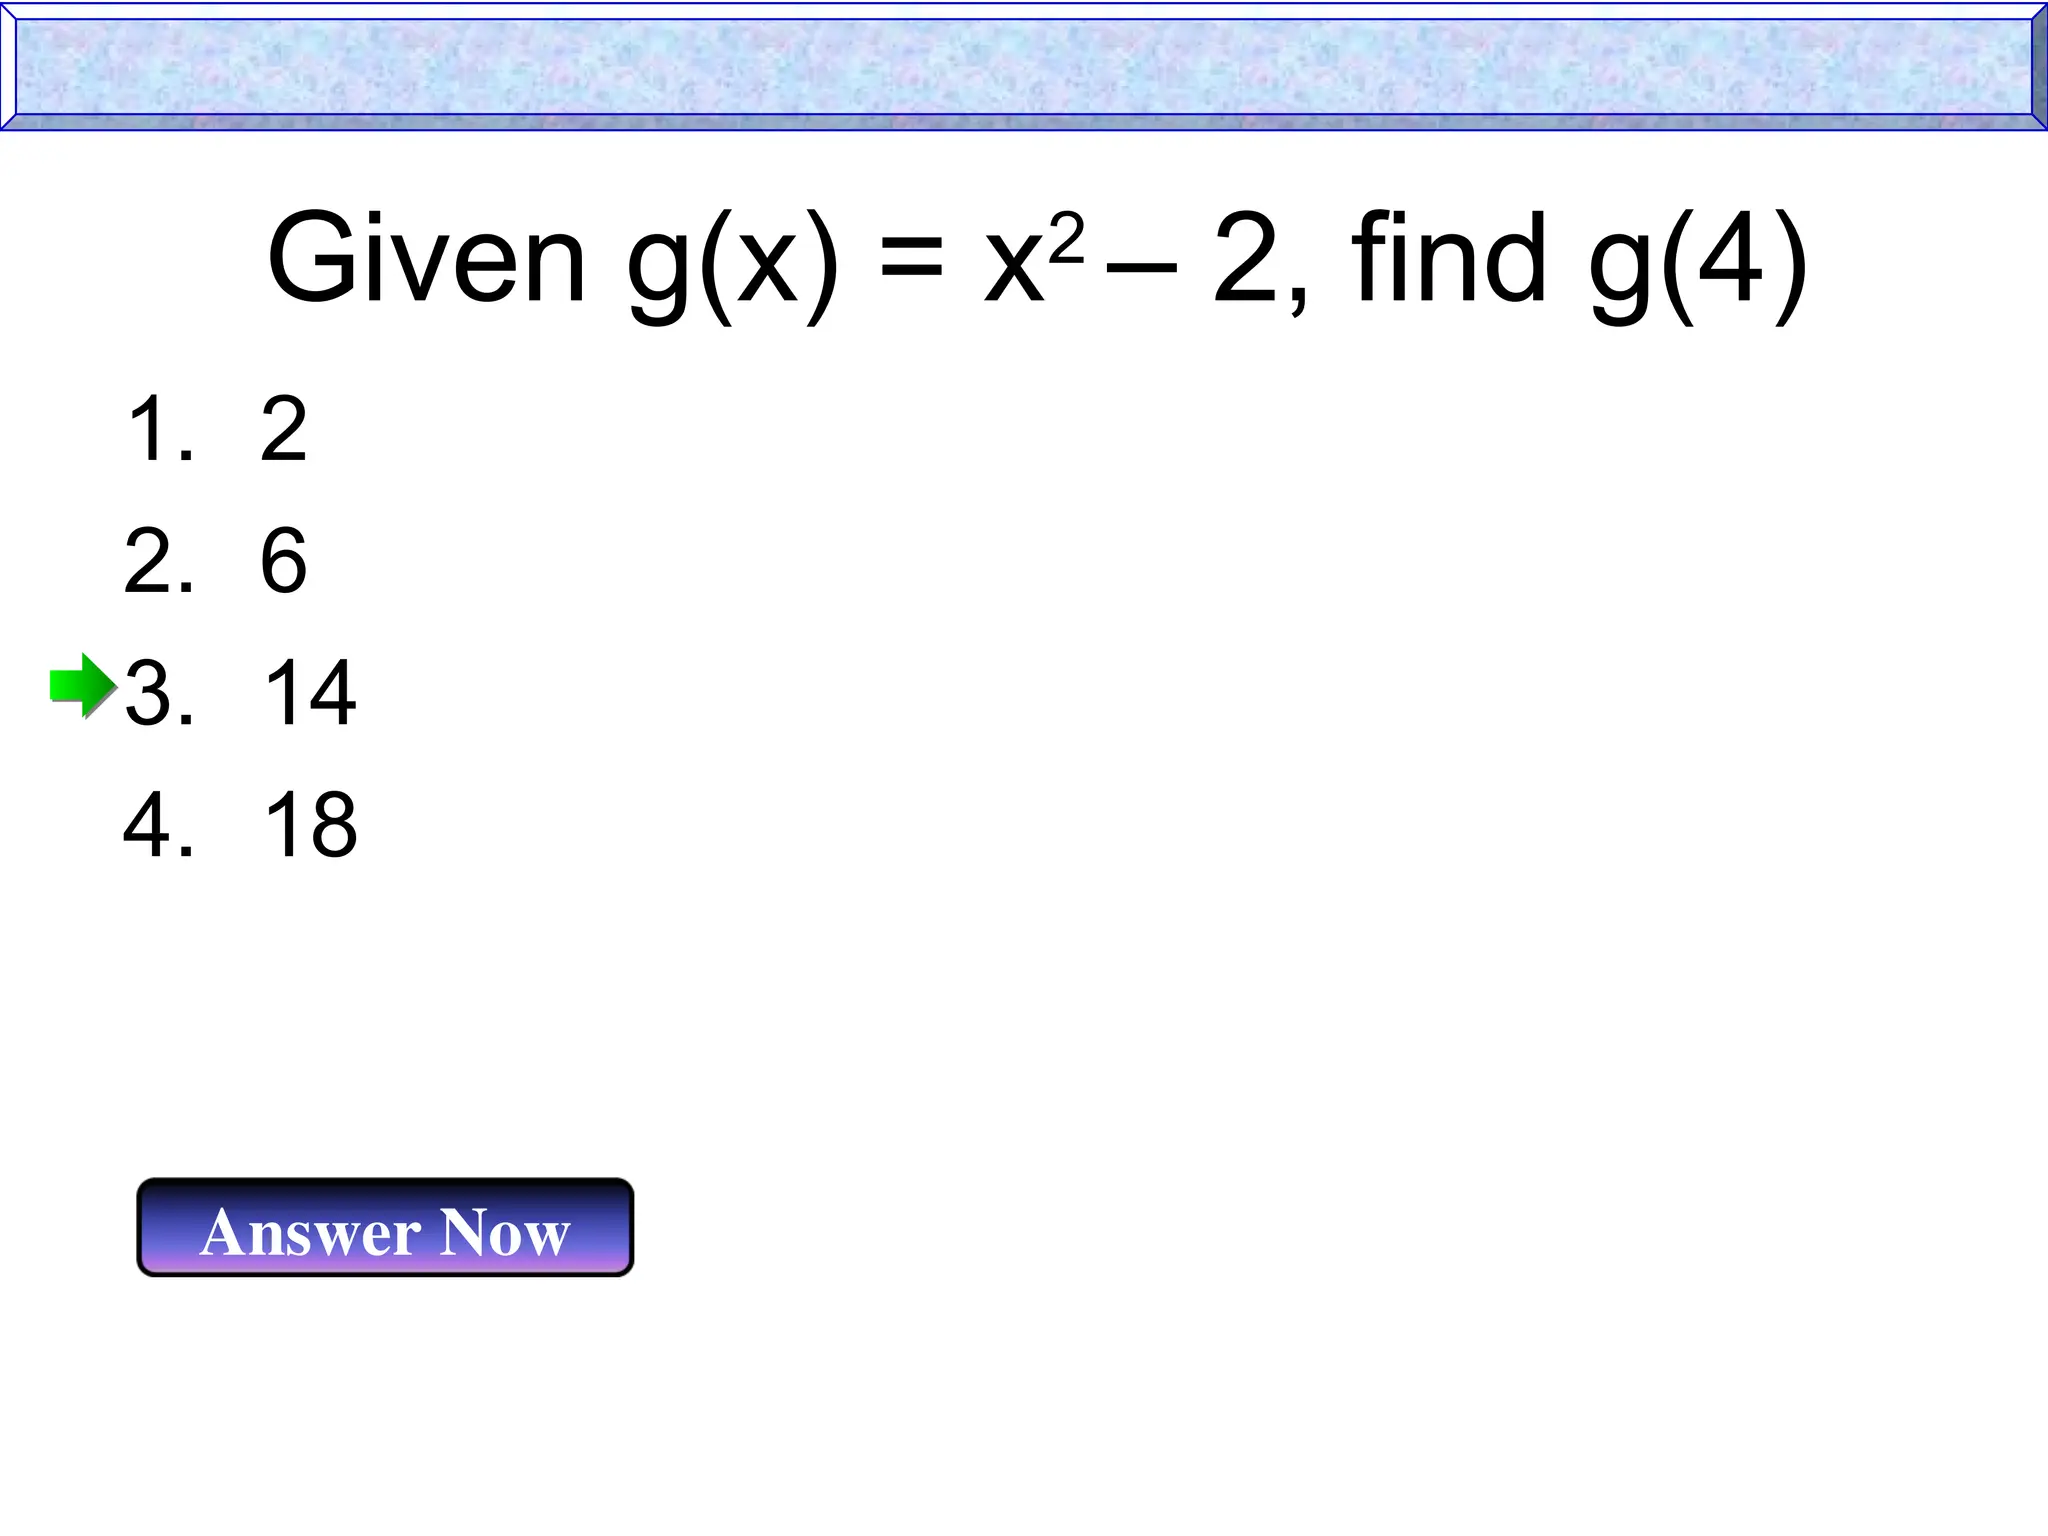
Given g(x) =x2
– 2, find g(4)
Answer Now
1. 2
2. 6
3. 14
4. 18
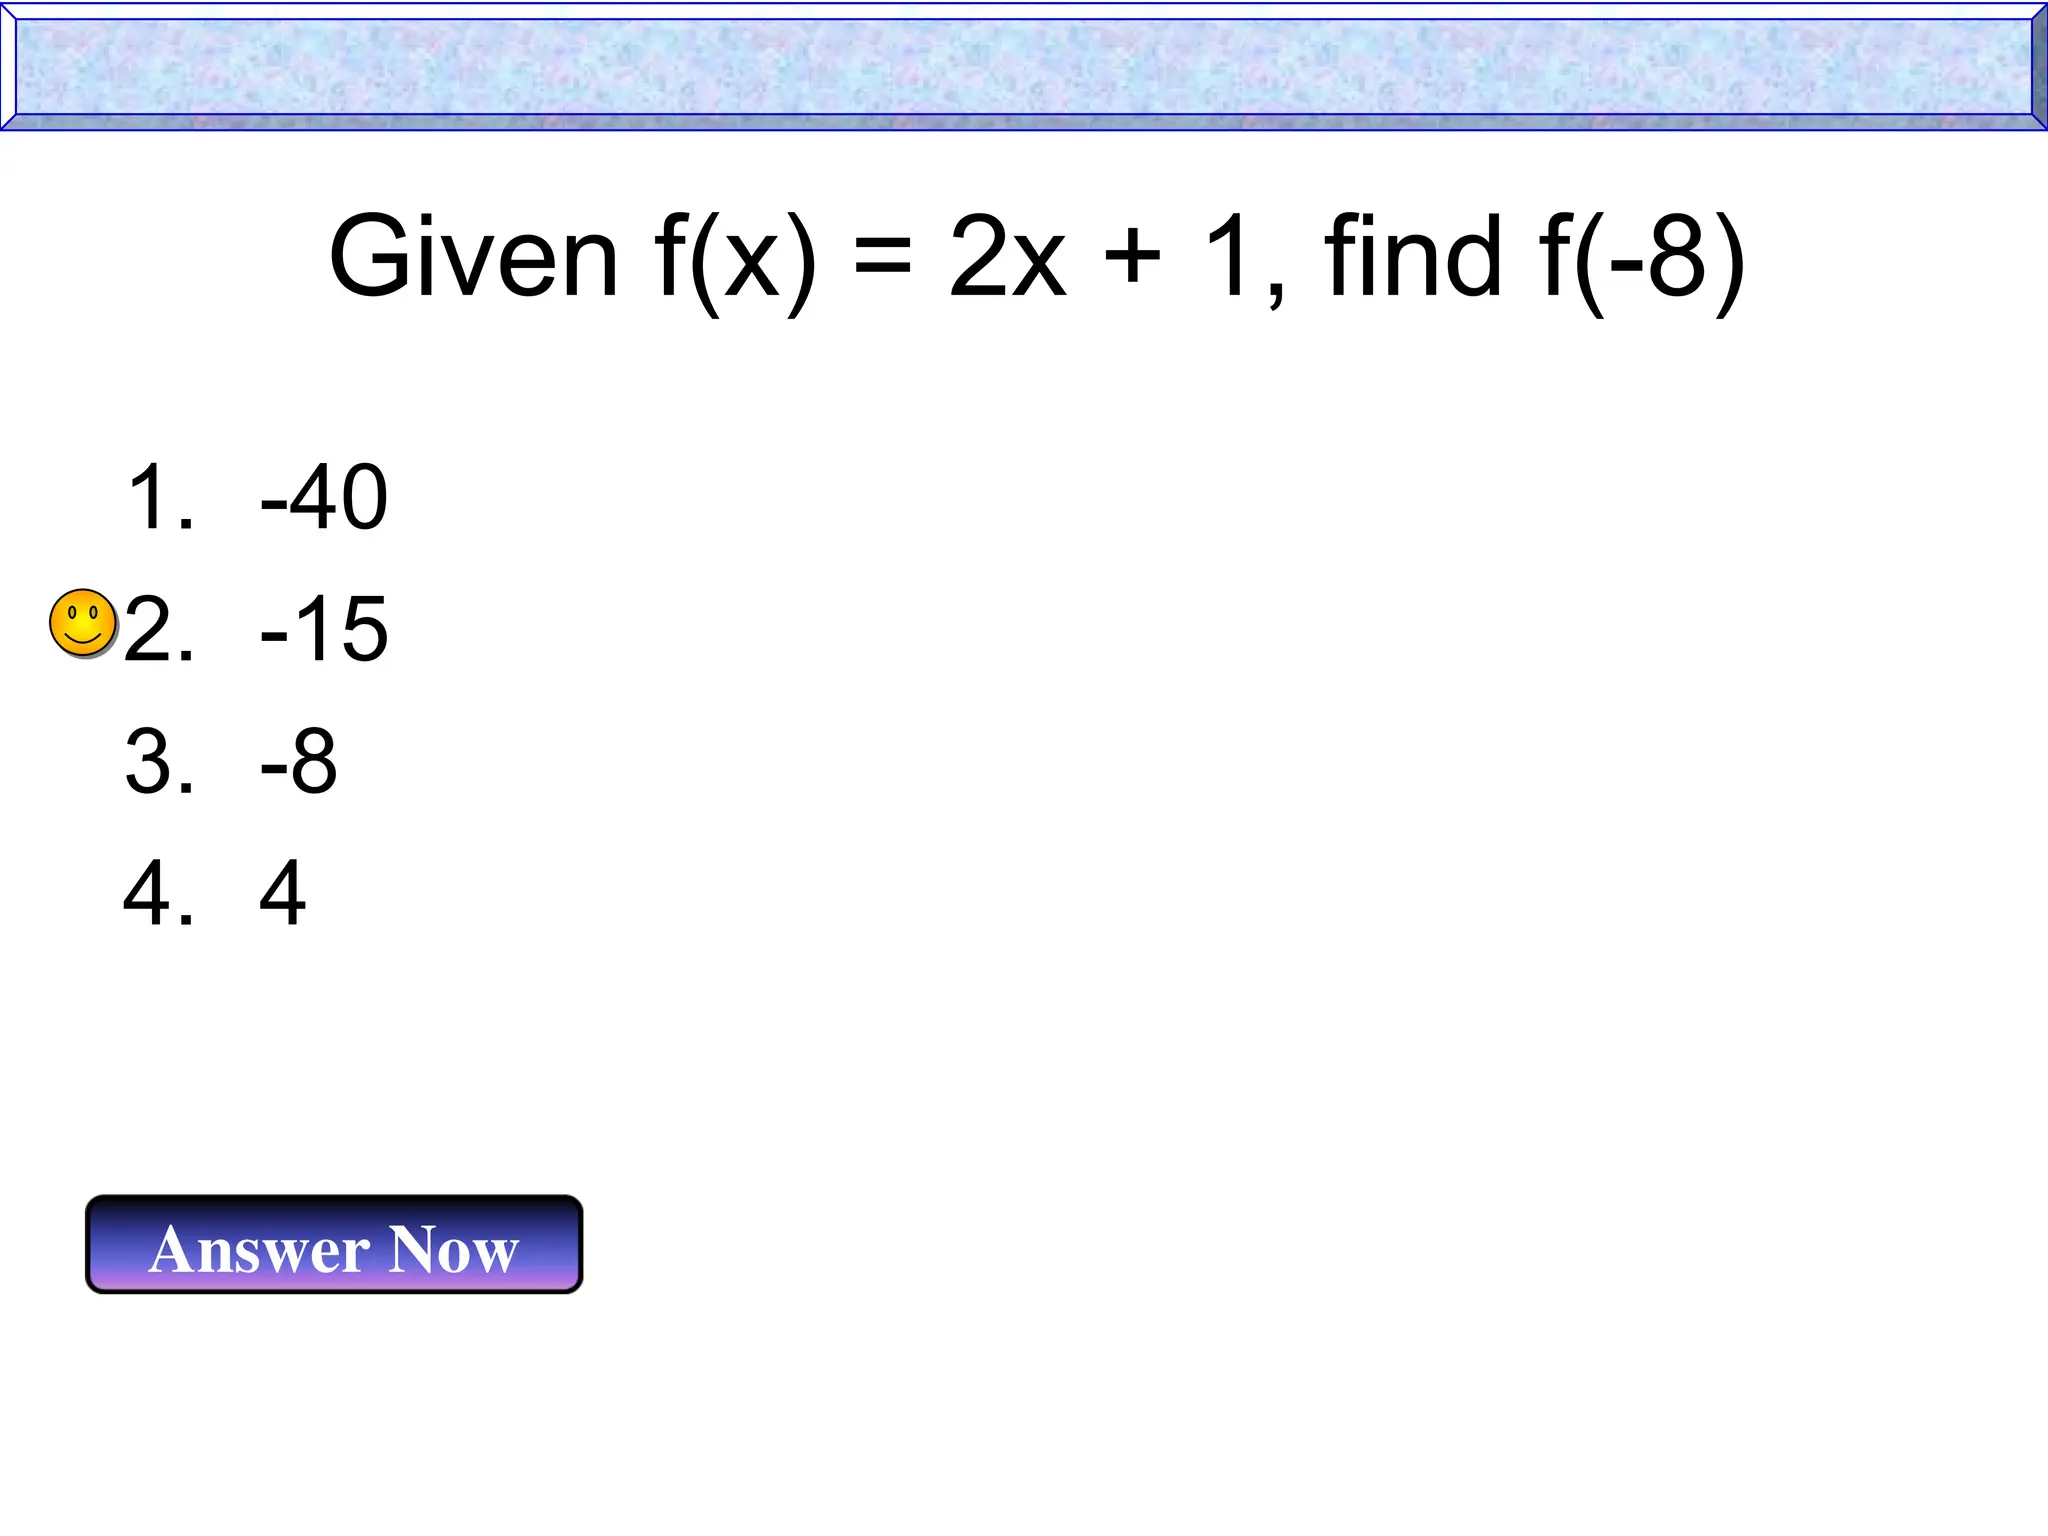
69.
Given f(x) =2x + 1, find f(-8)
Answer Now
1. -40
2. -15
3. -8
4. 4
70.
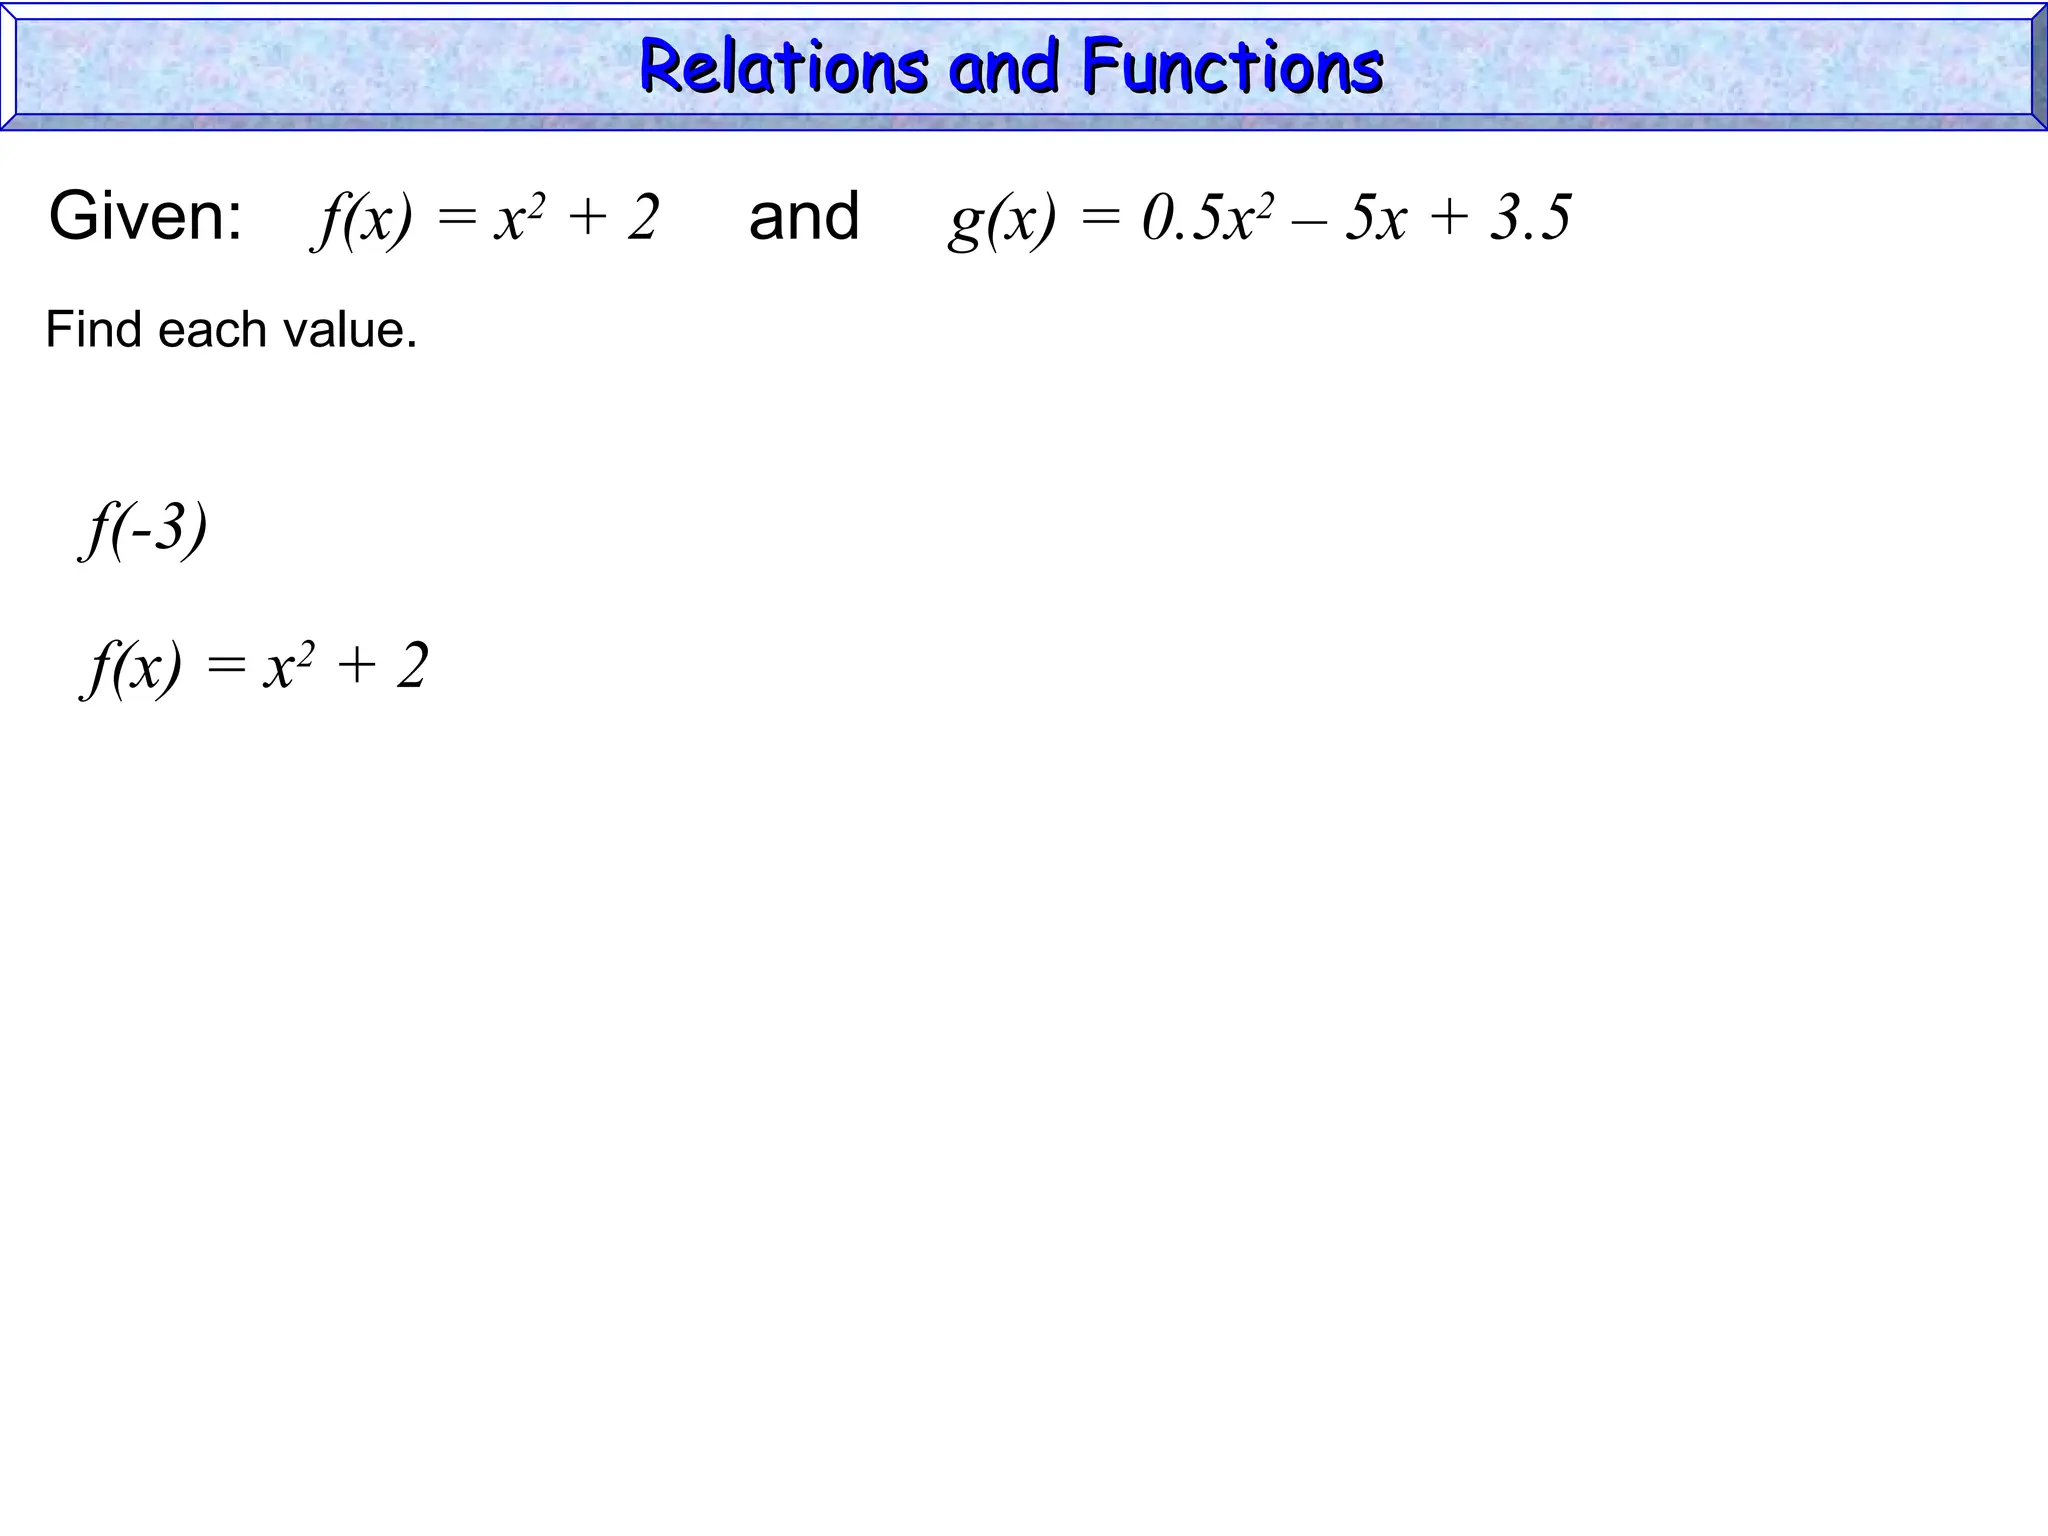
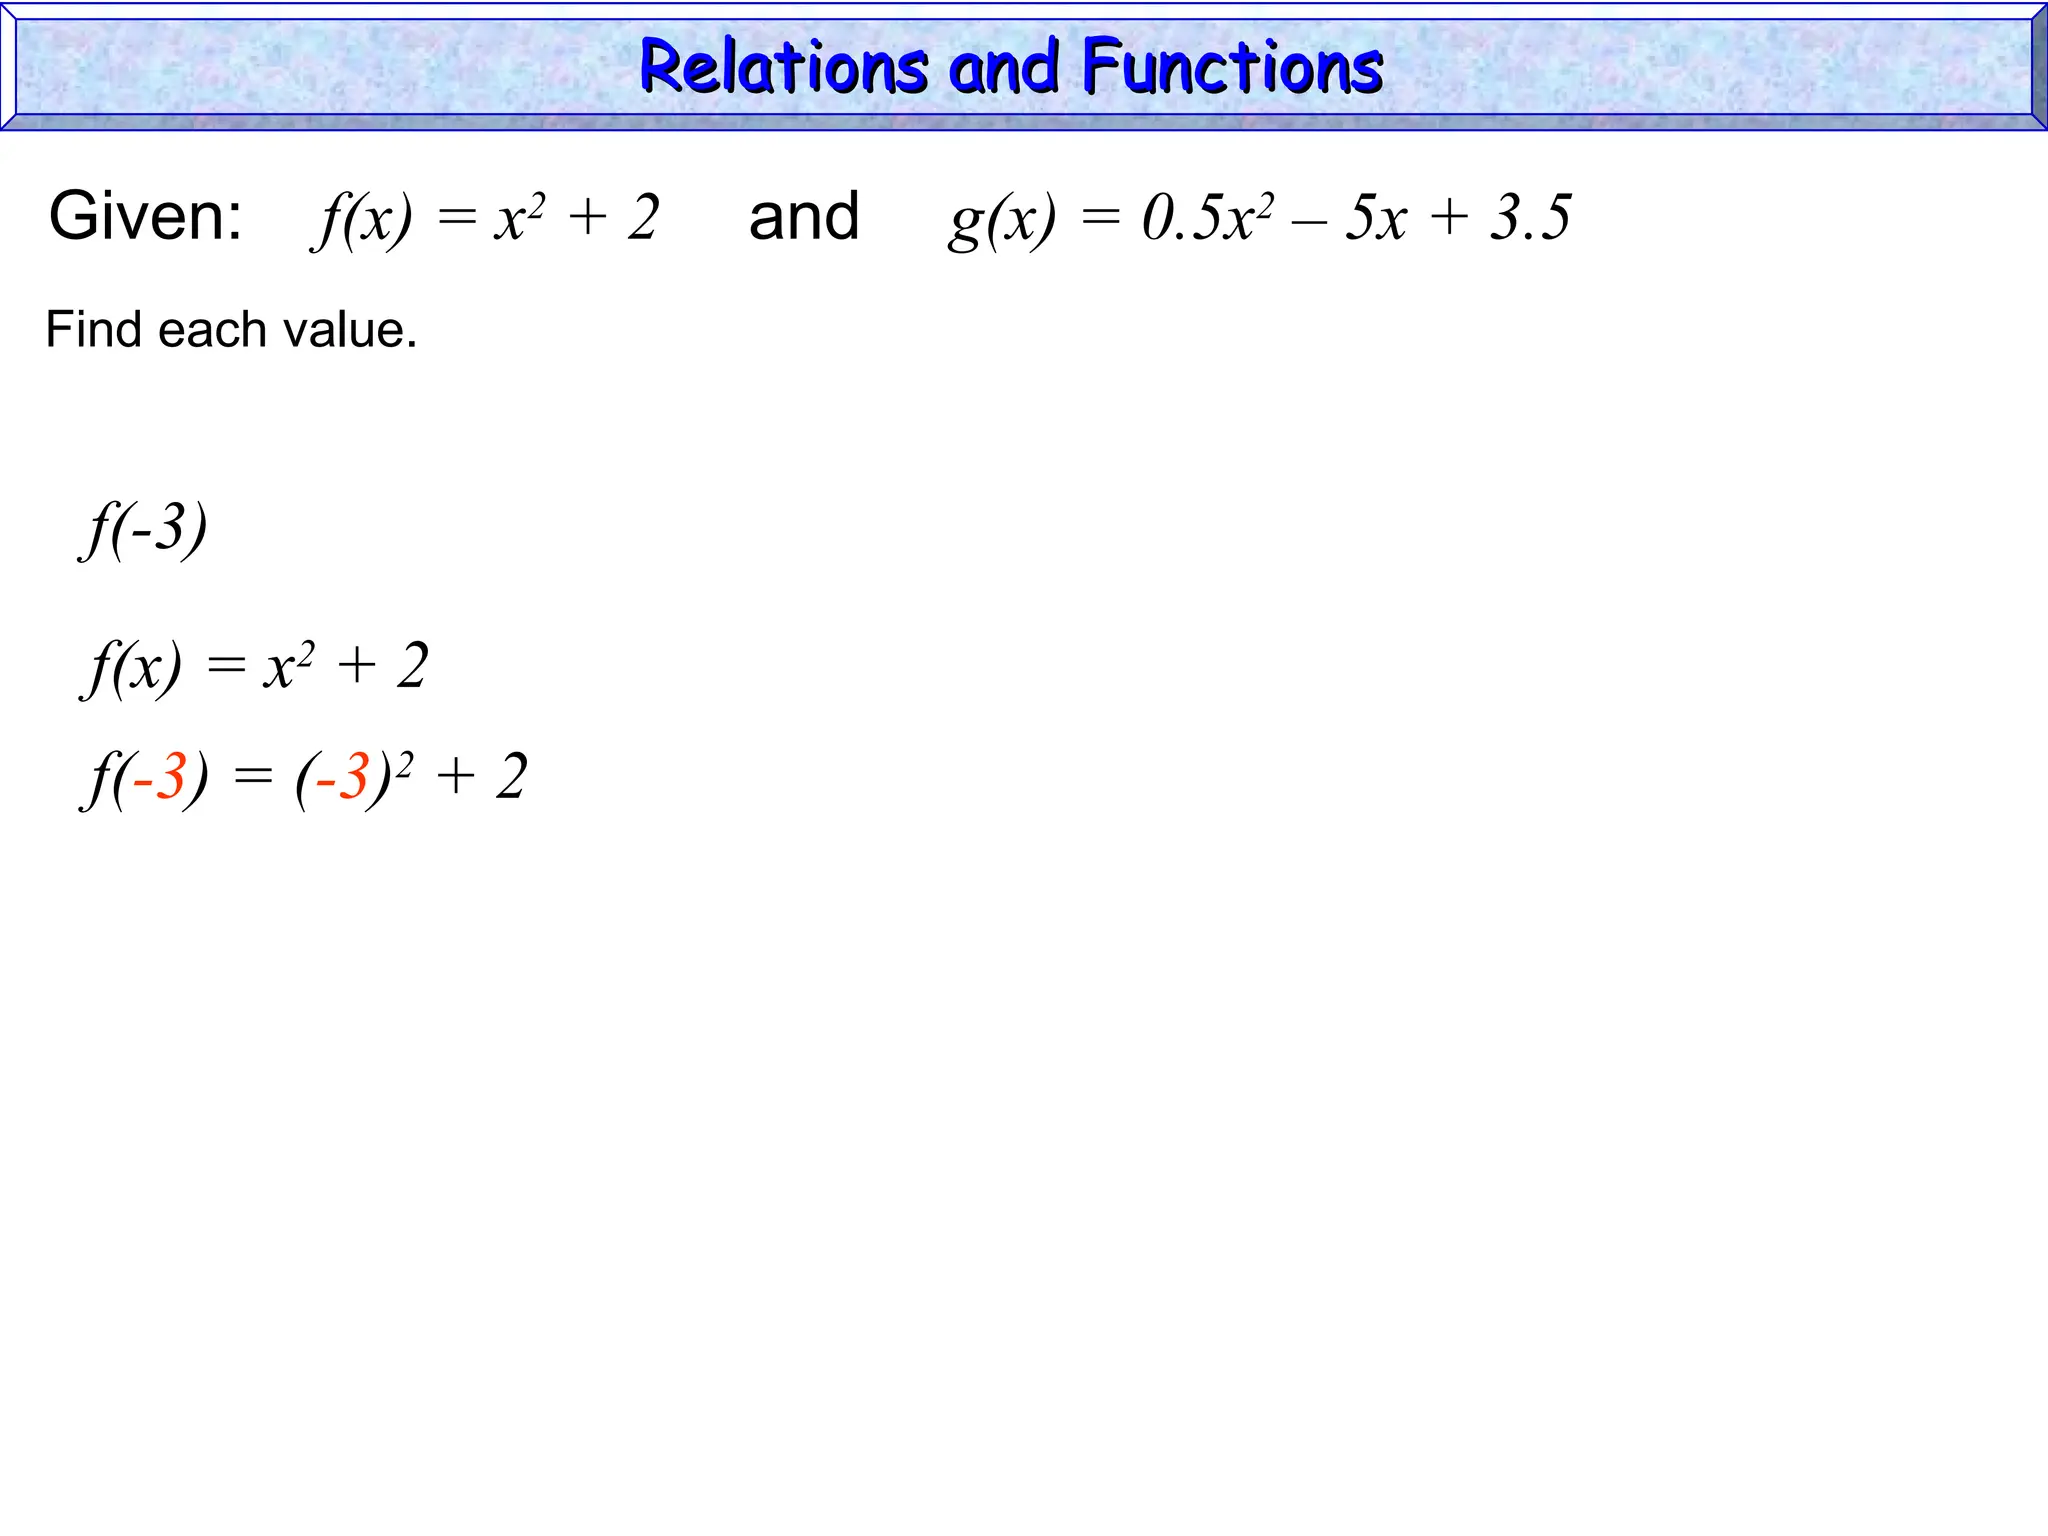
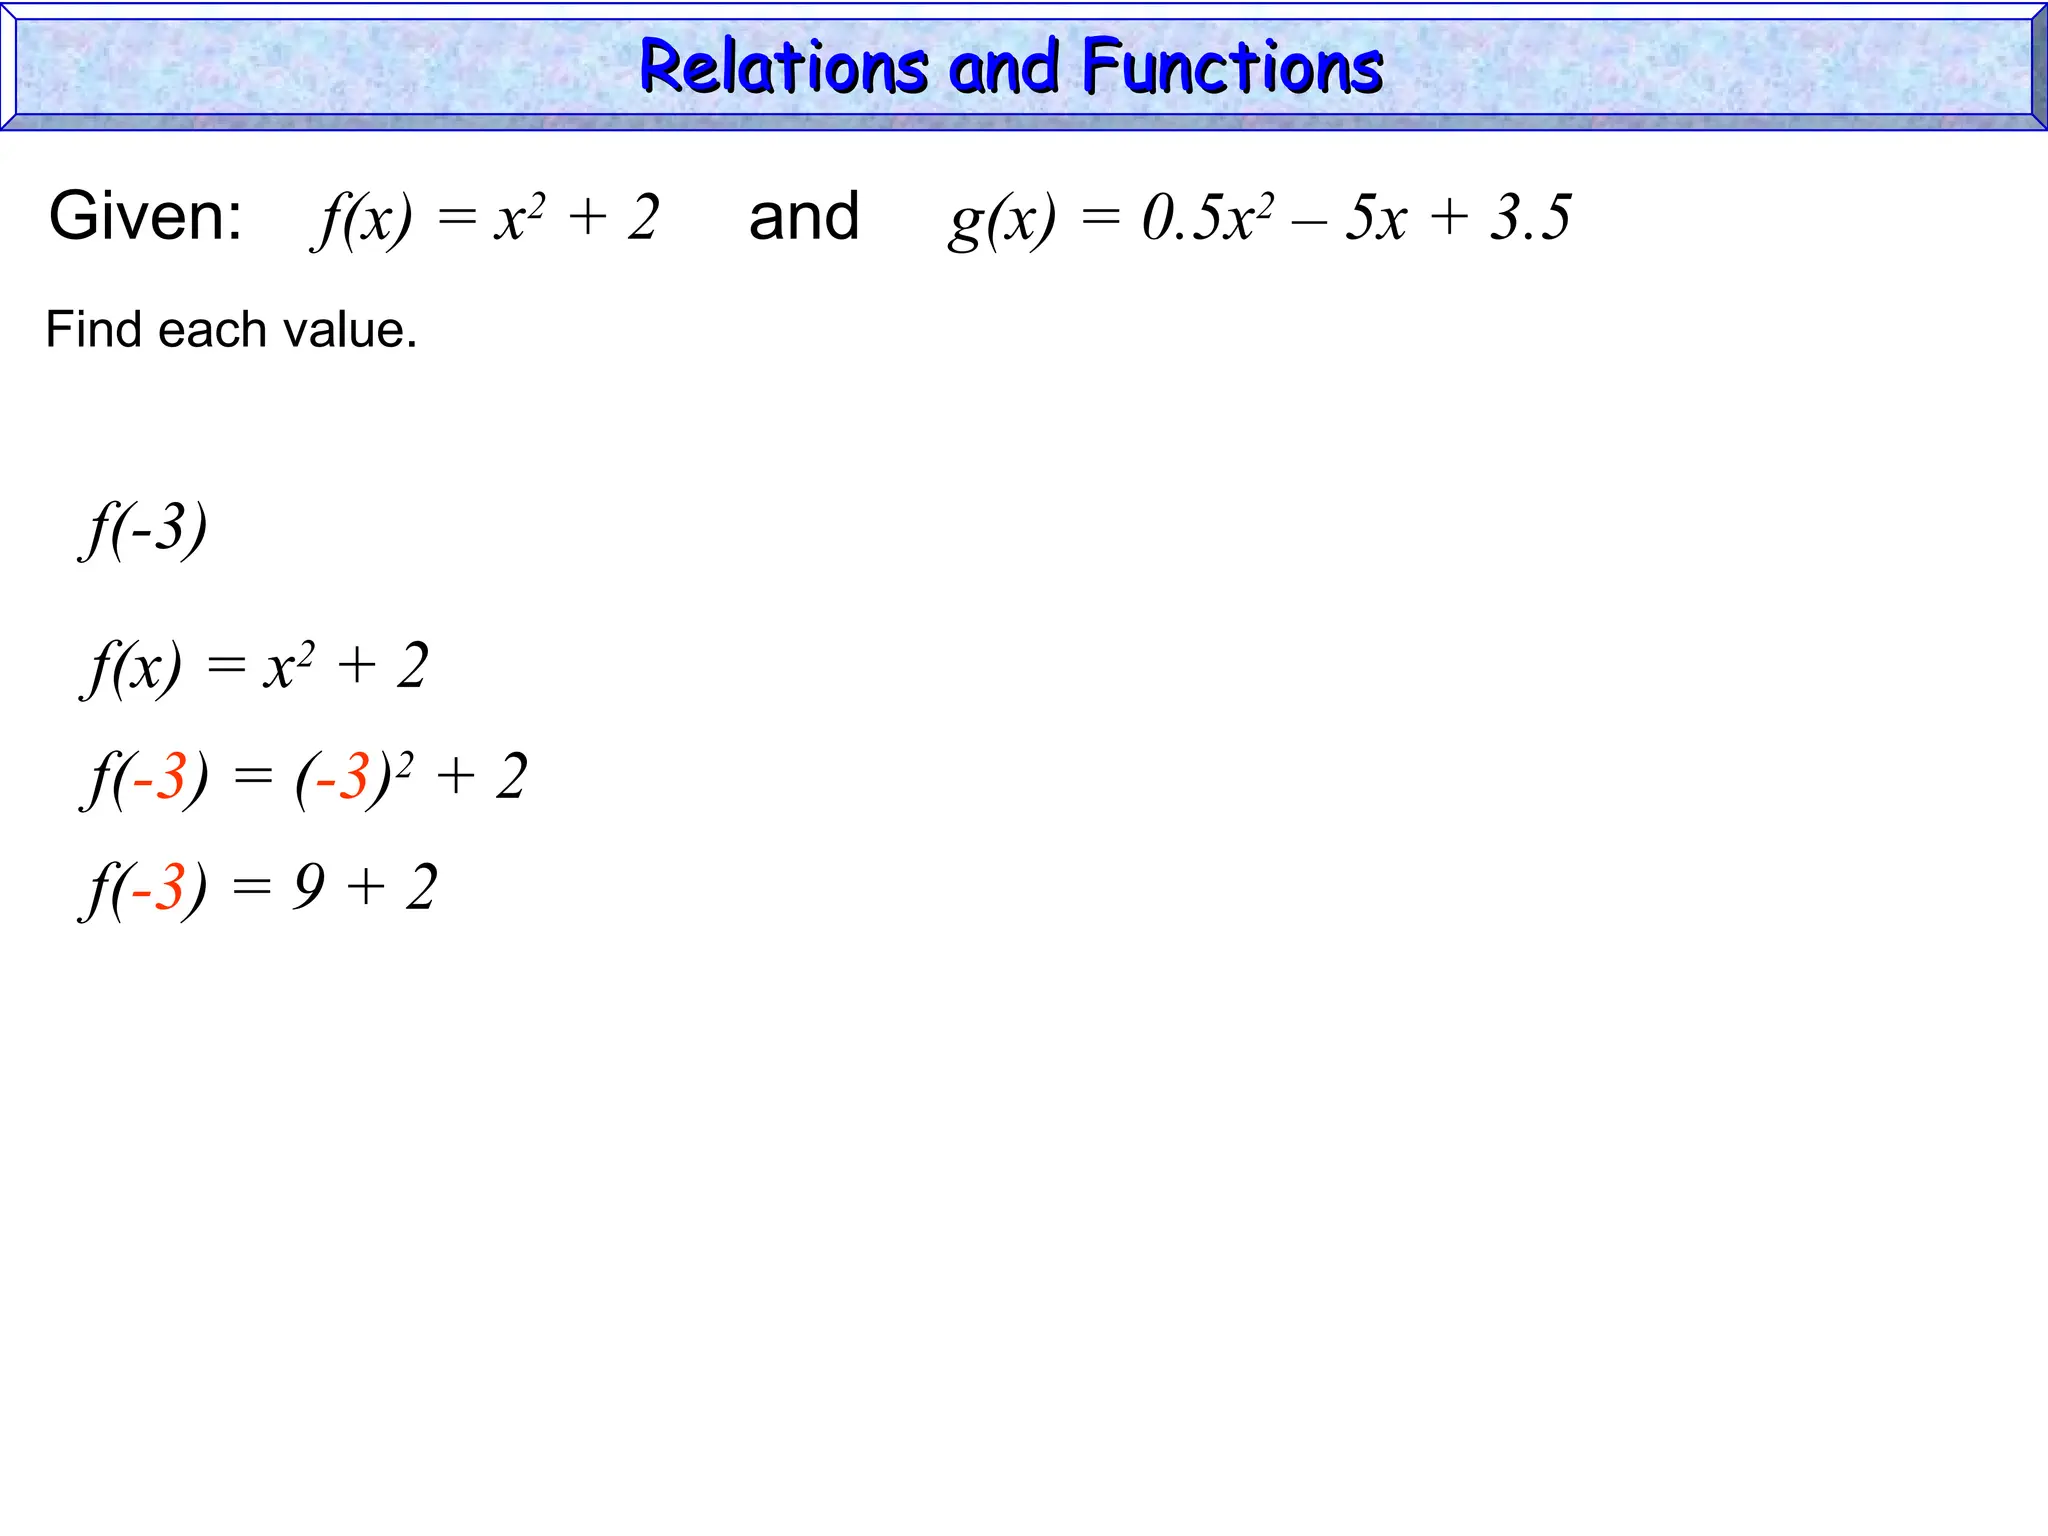
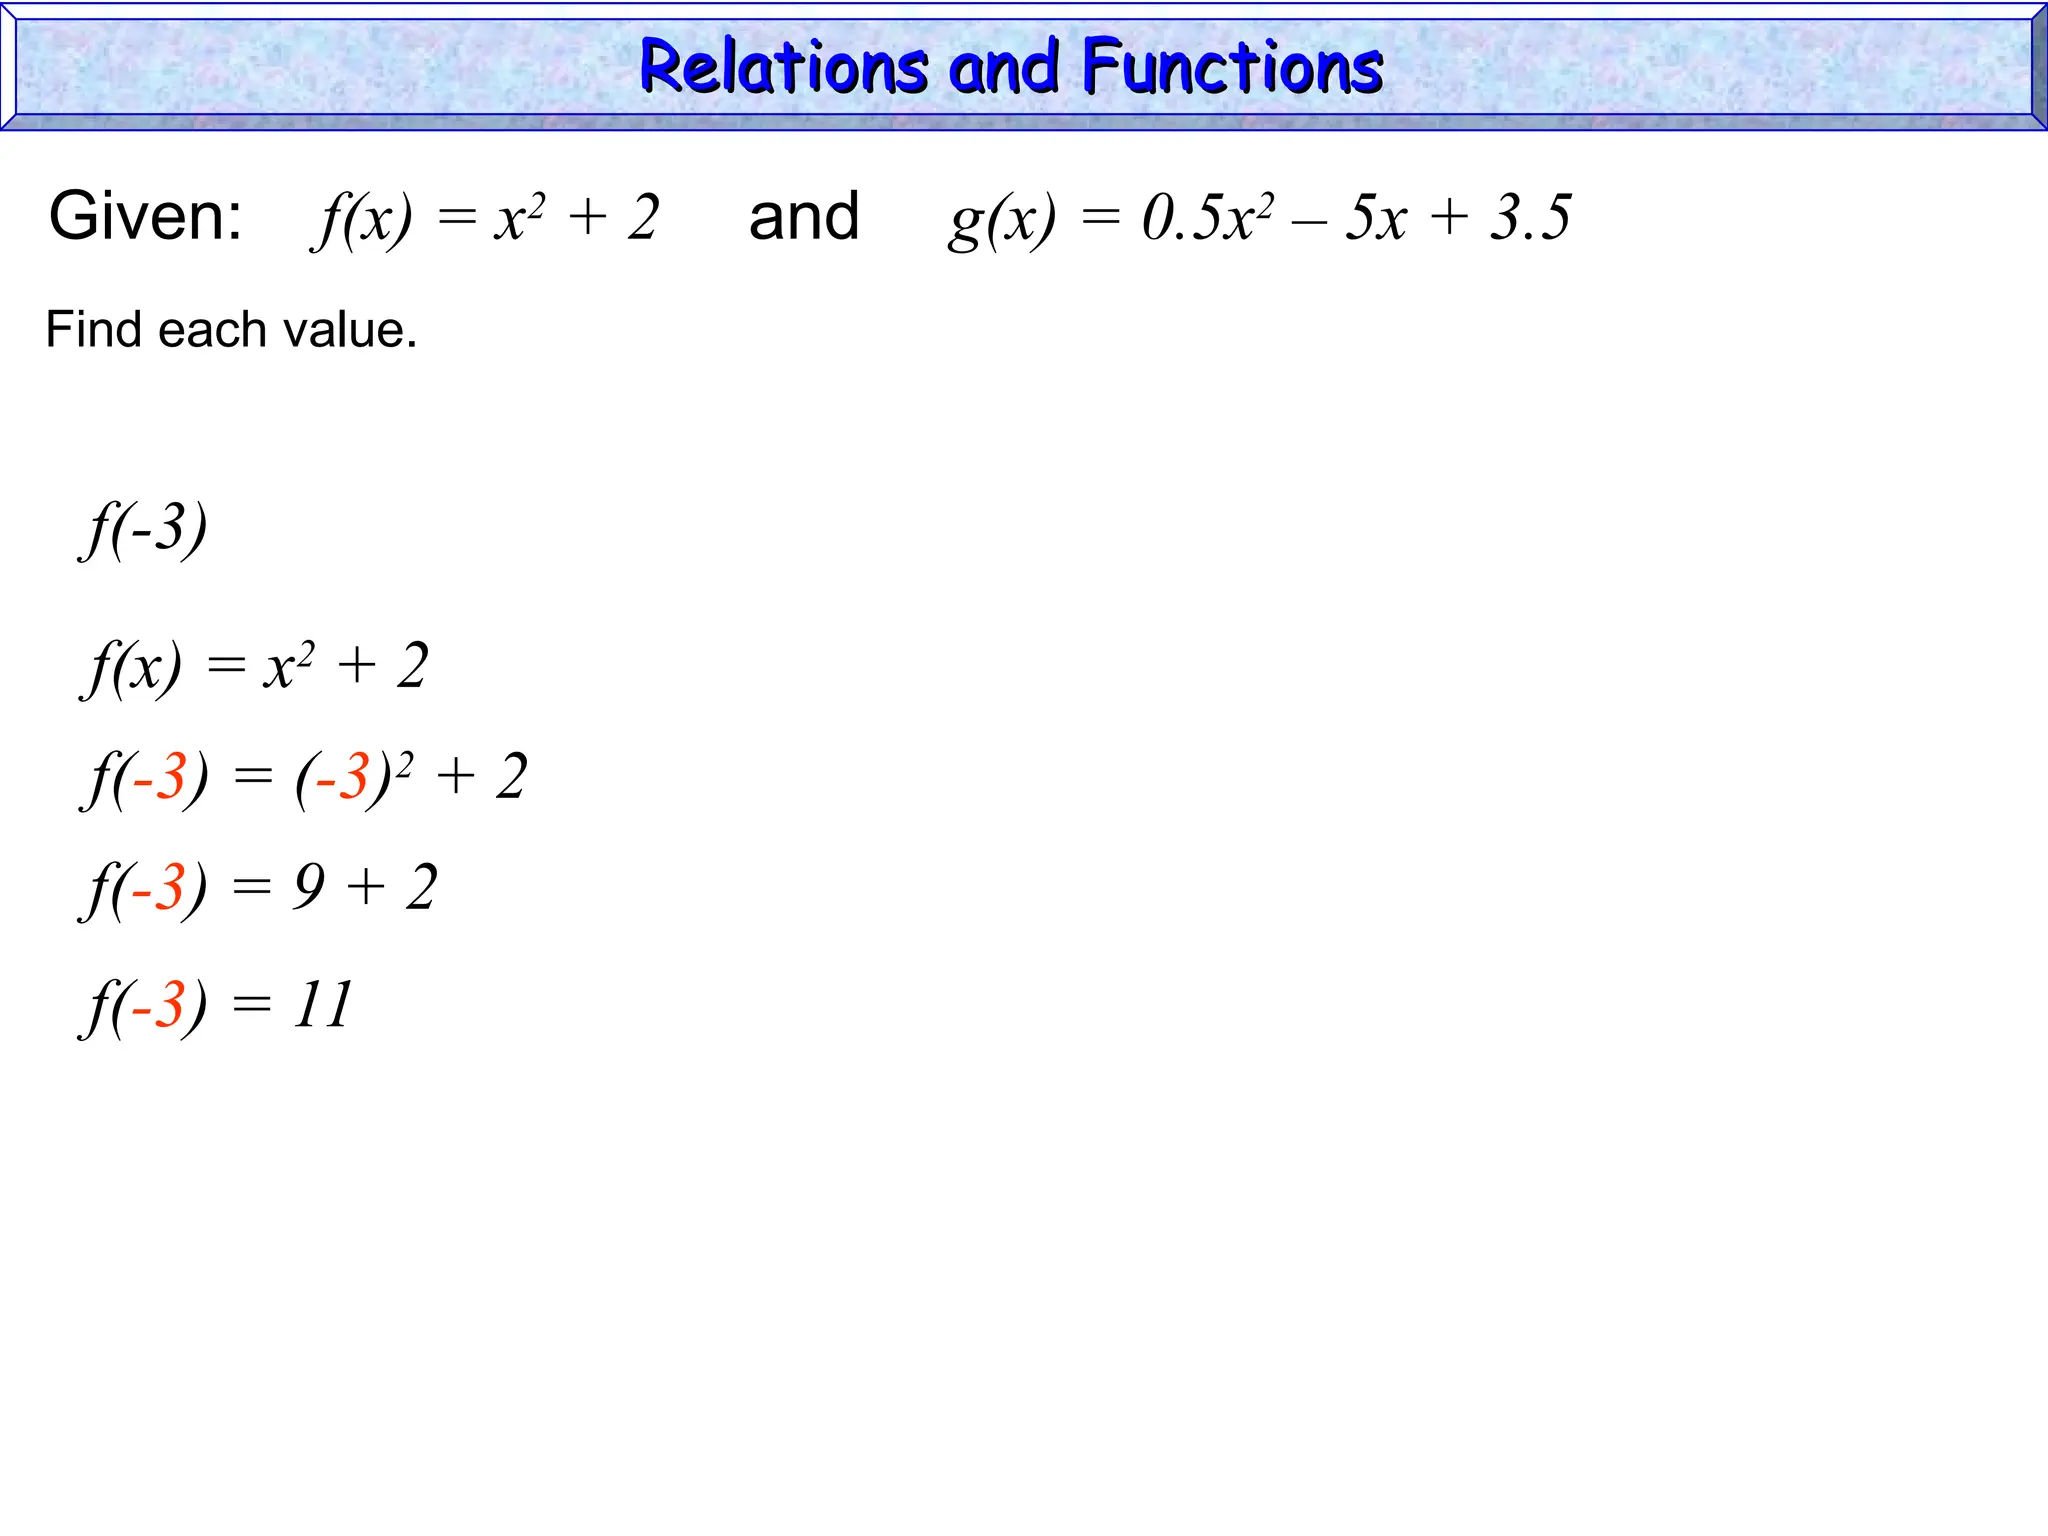
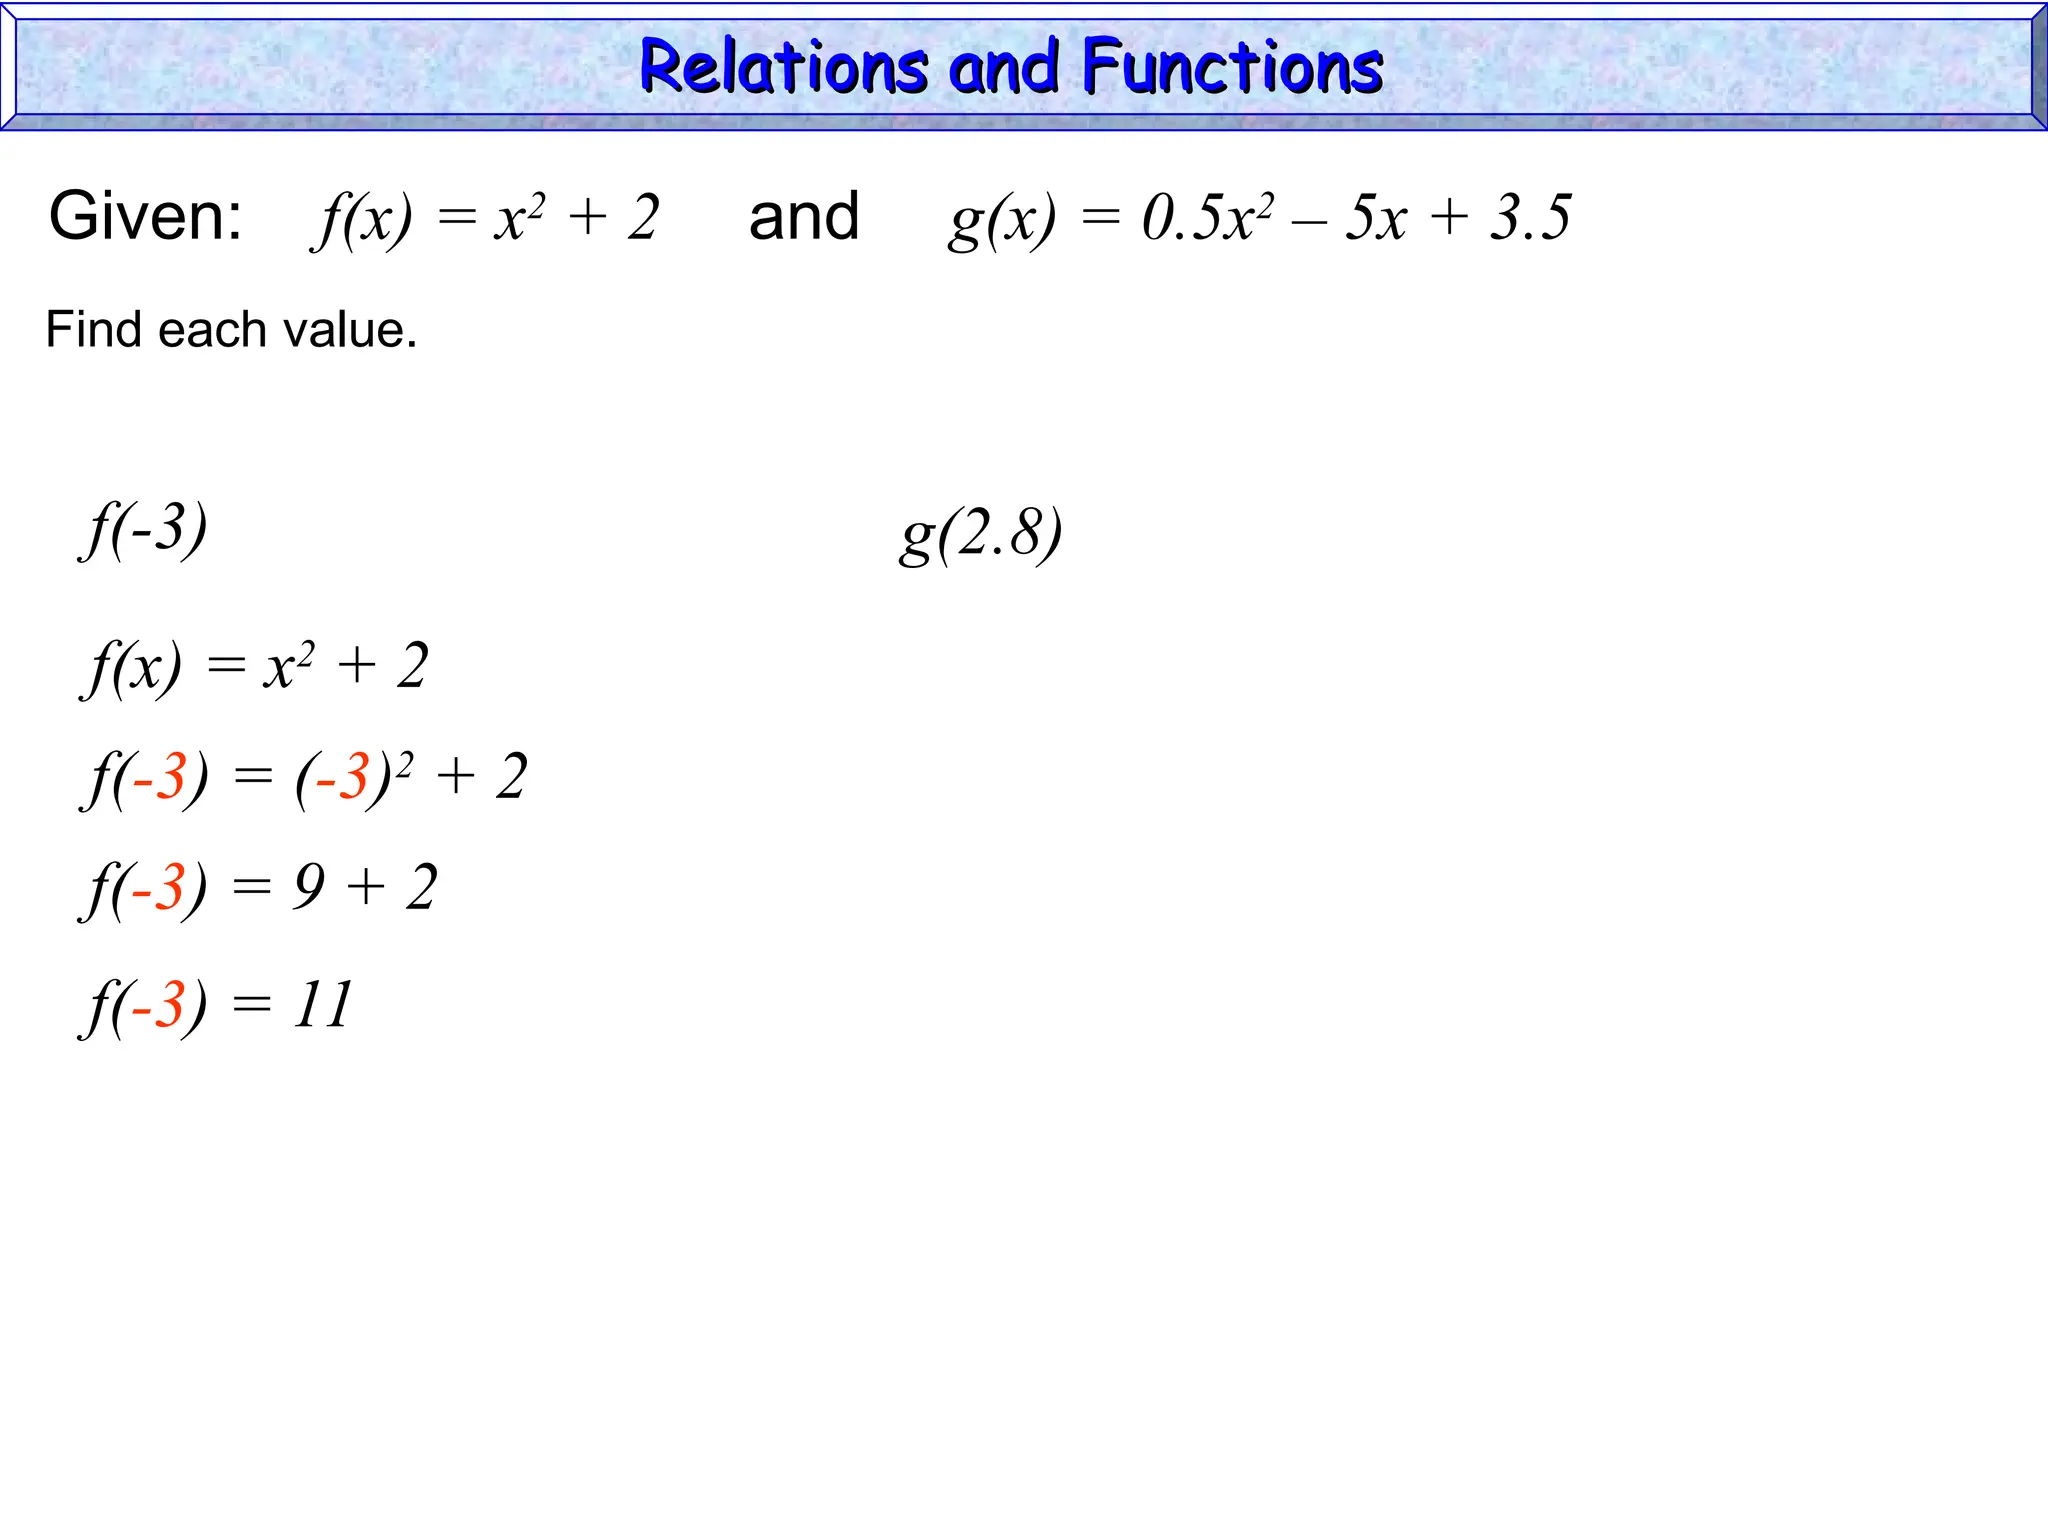
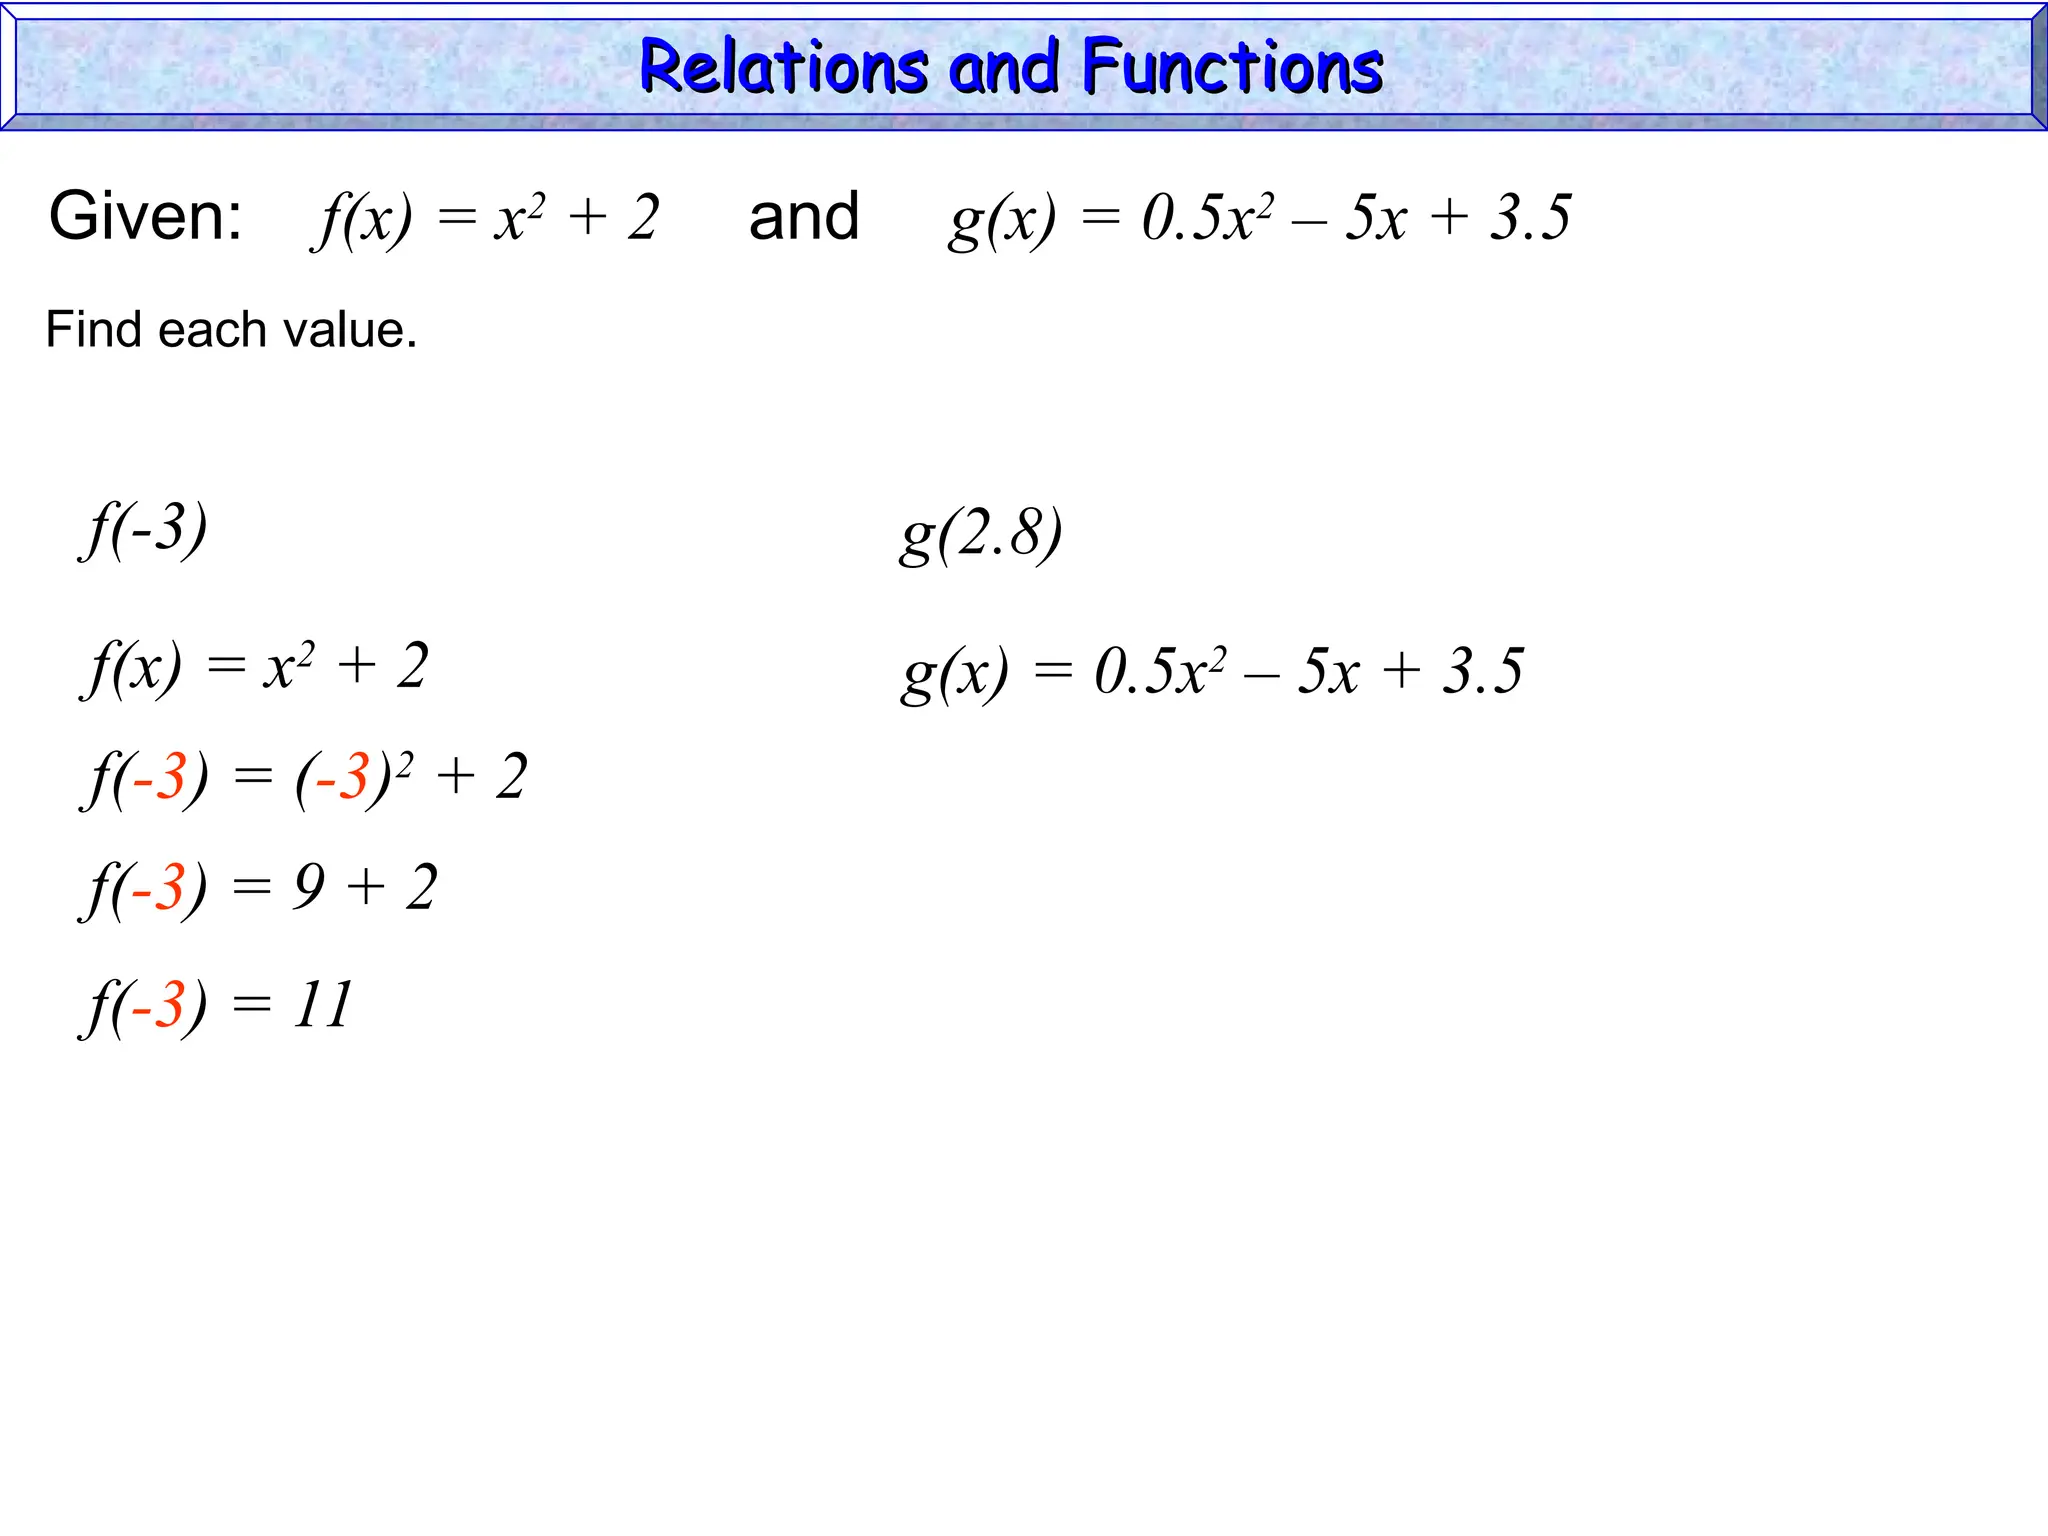
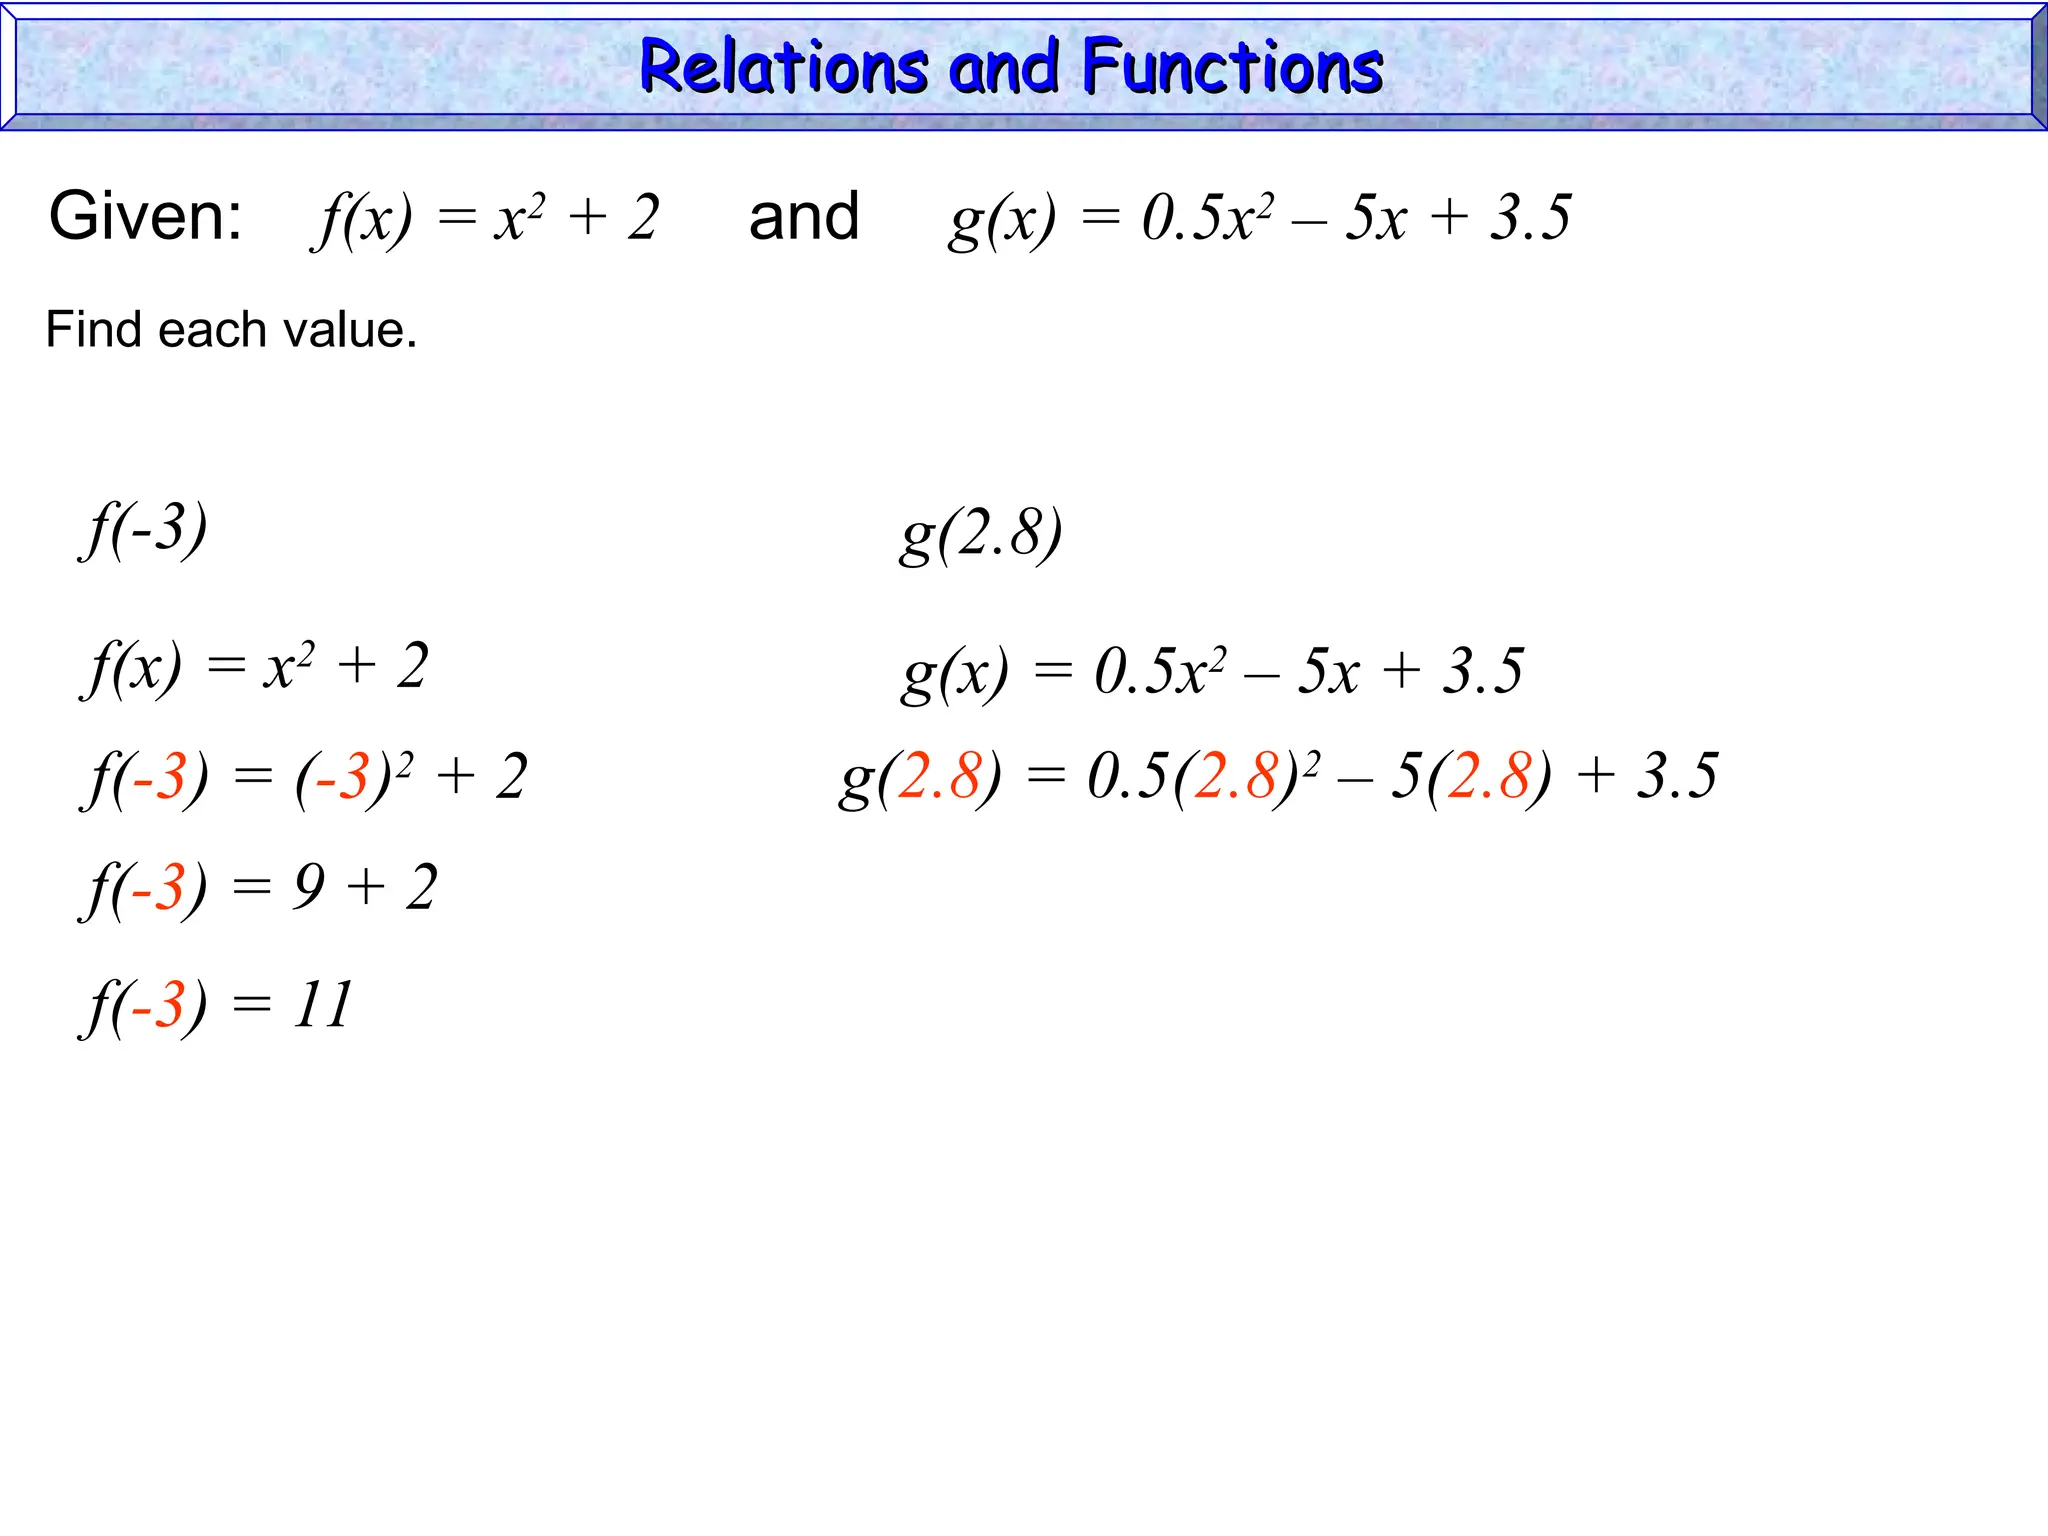
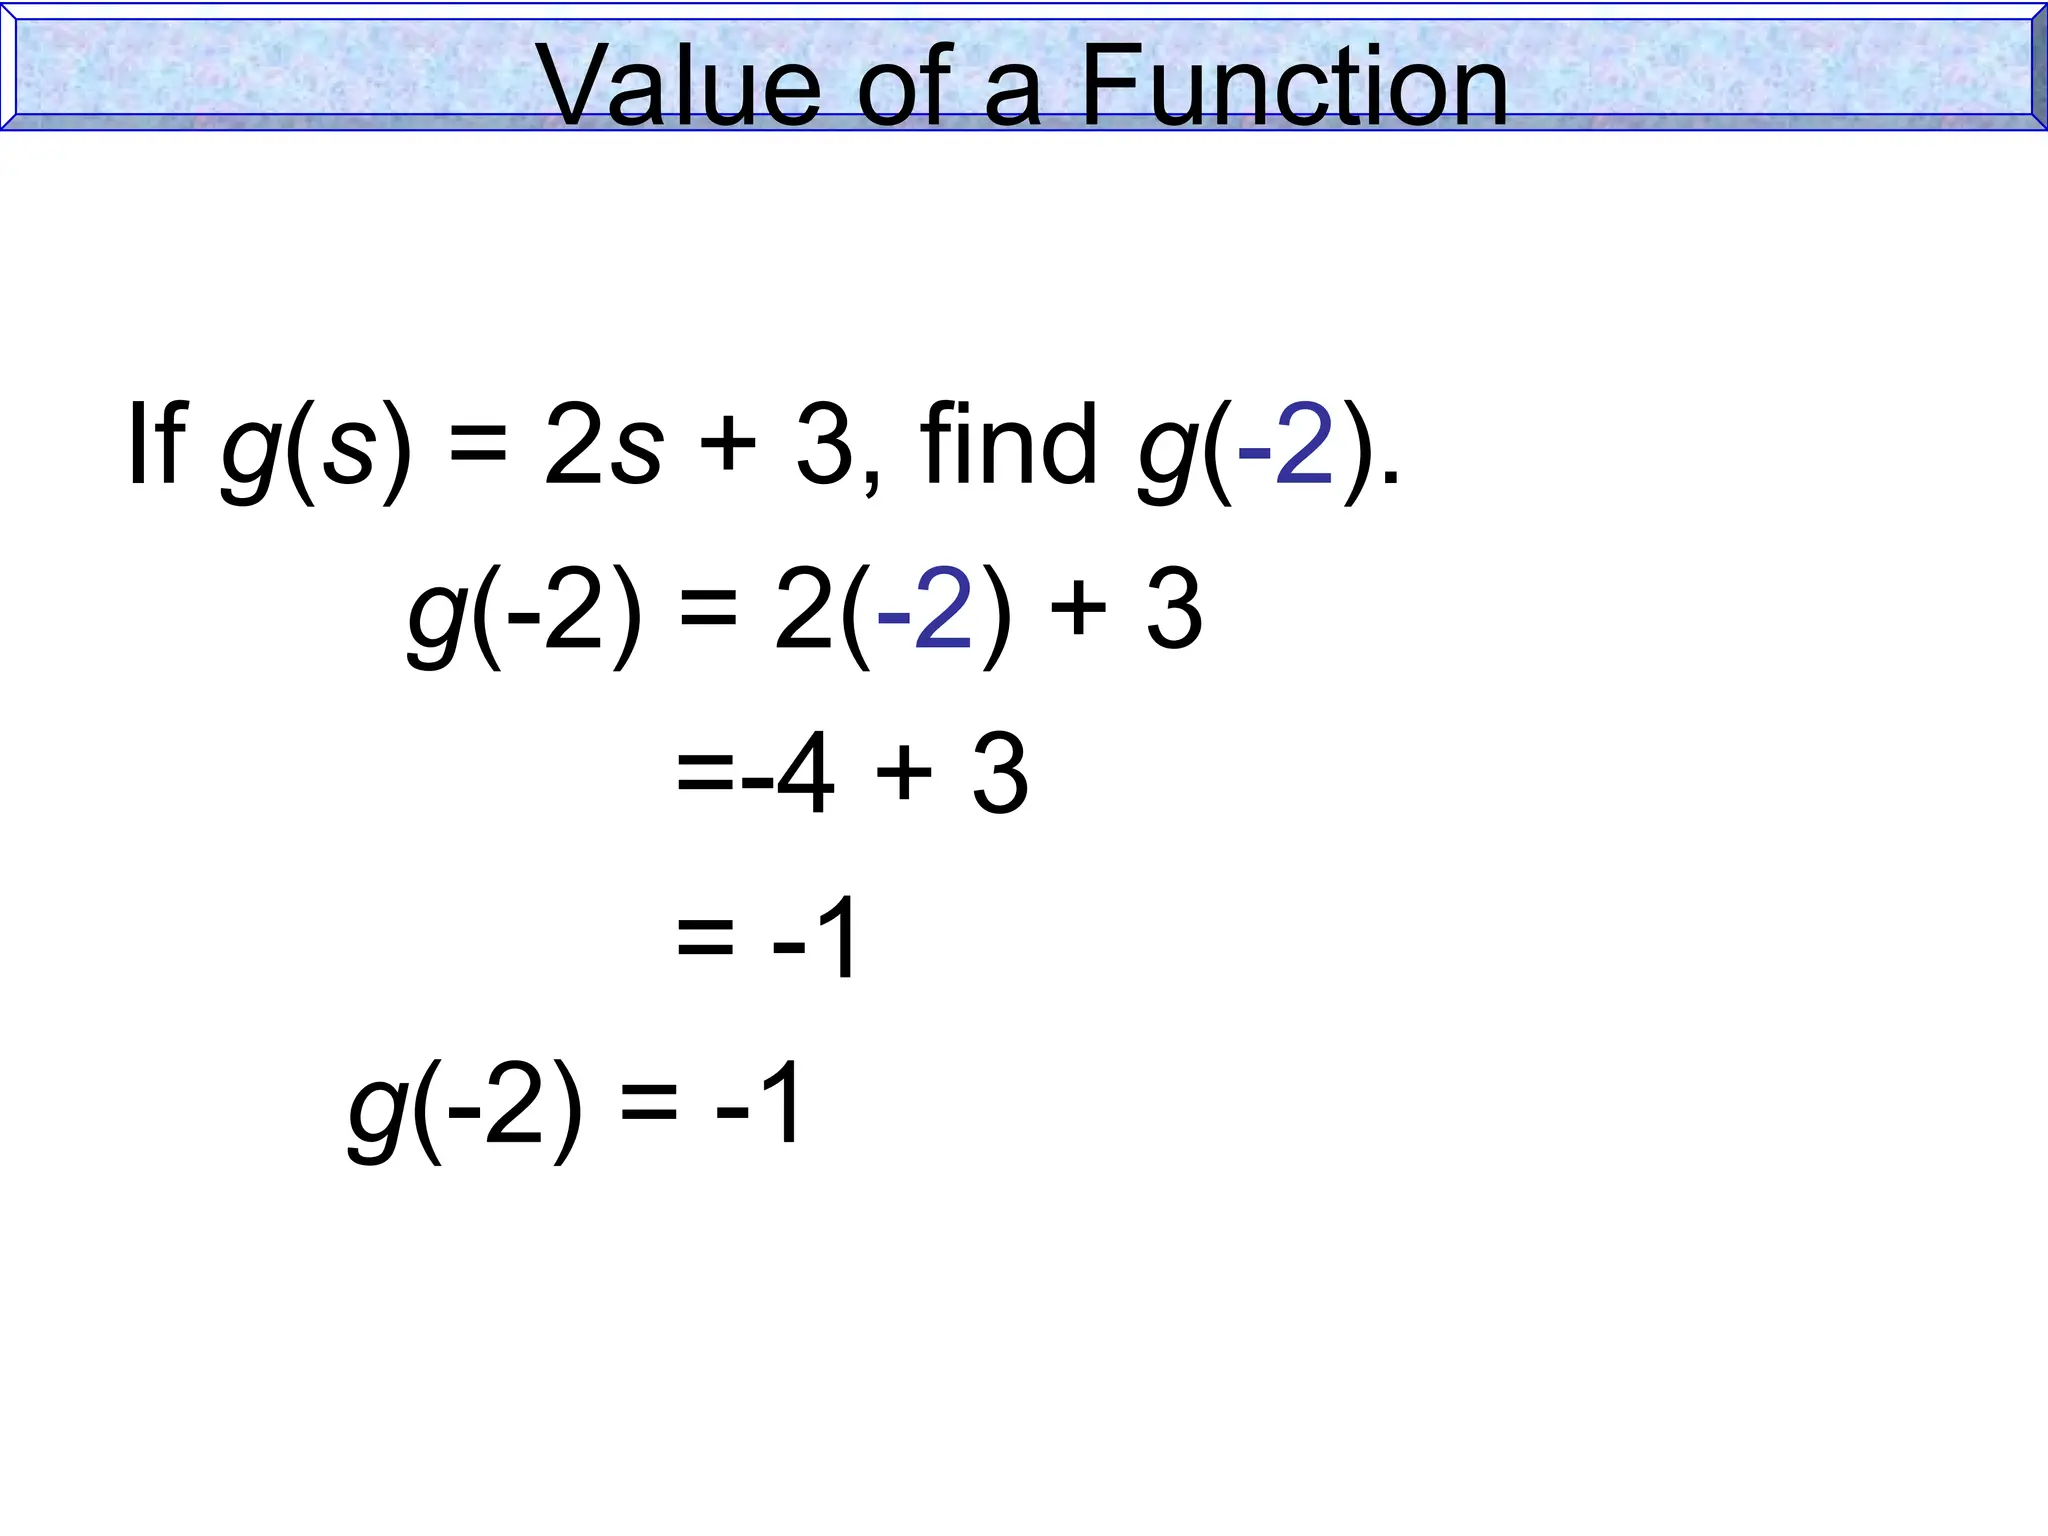
Value of aFunction
If g(s) = 2s + 3, find g(-2).
g(-2) = 2(-2) + 3
=-4 + 3
= -1
g(-2) = -1
71.
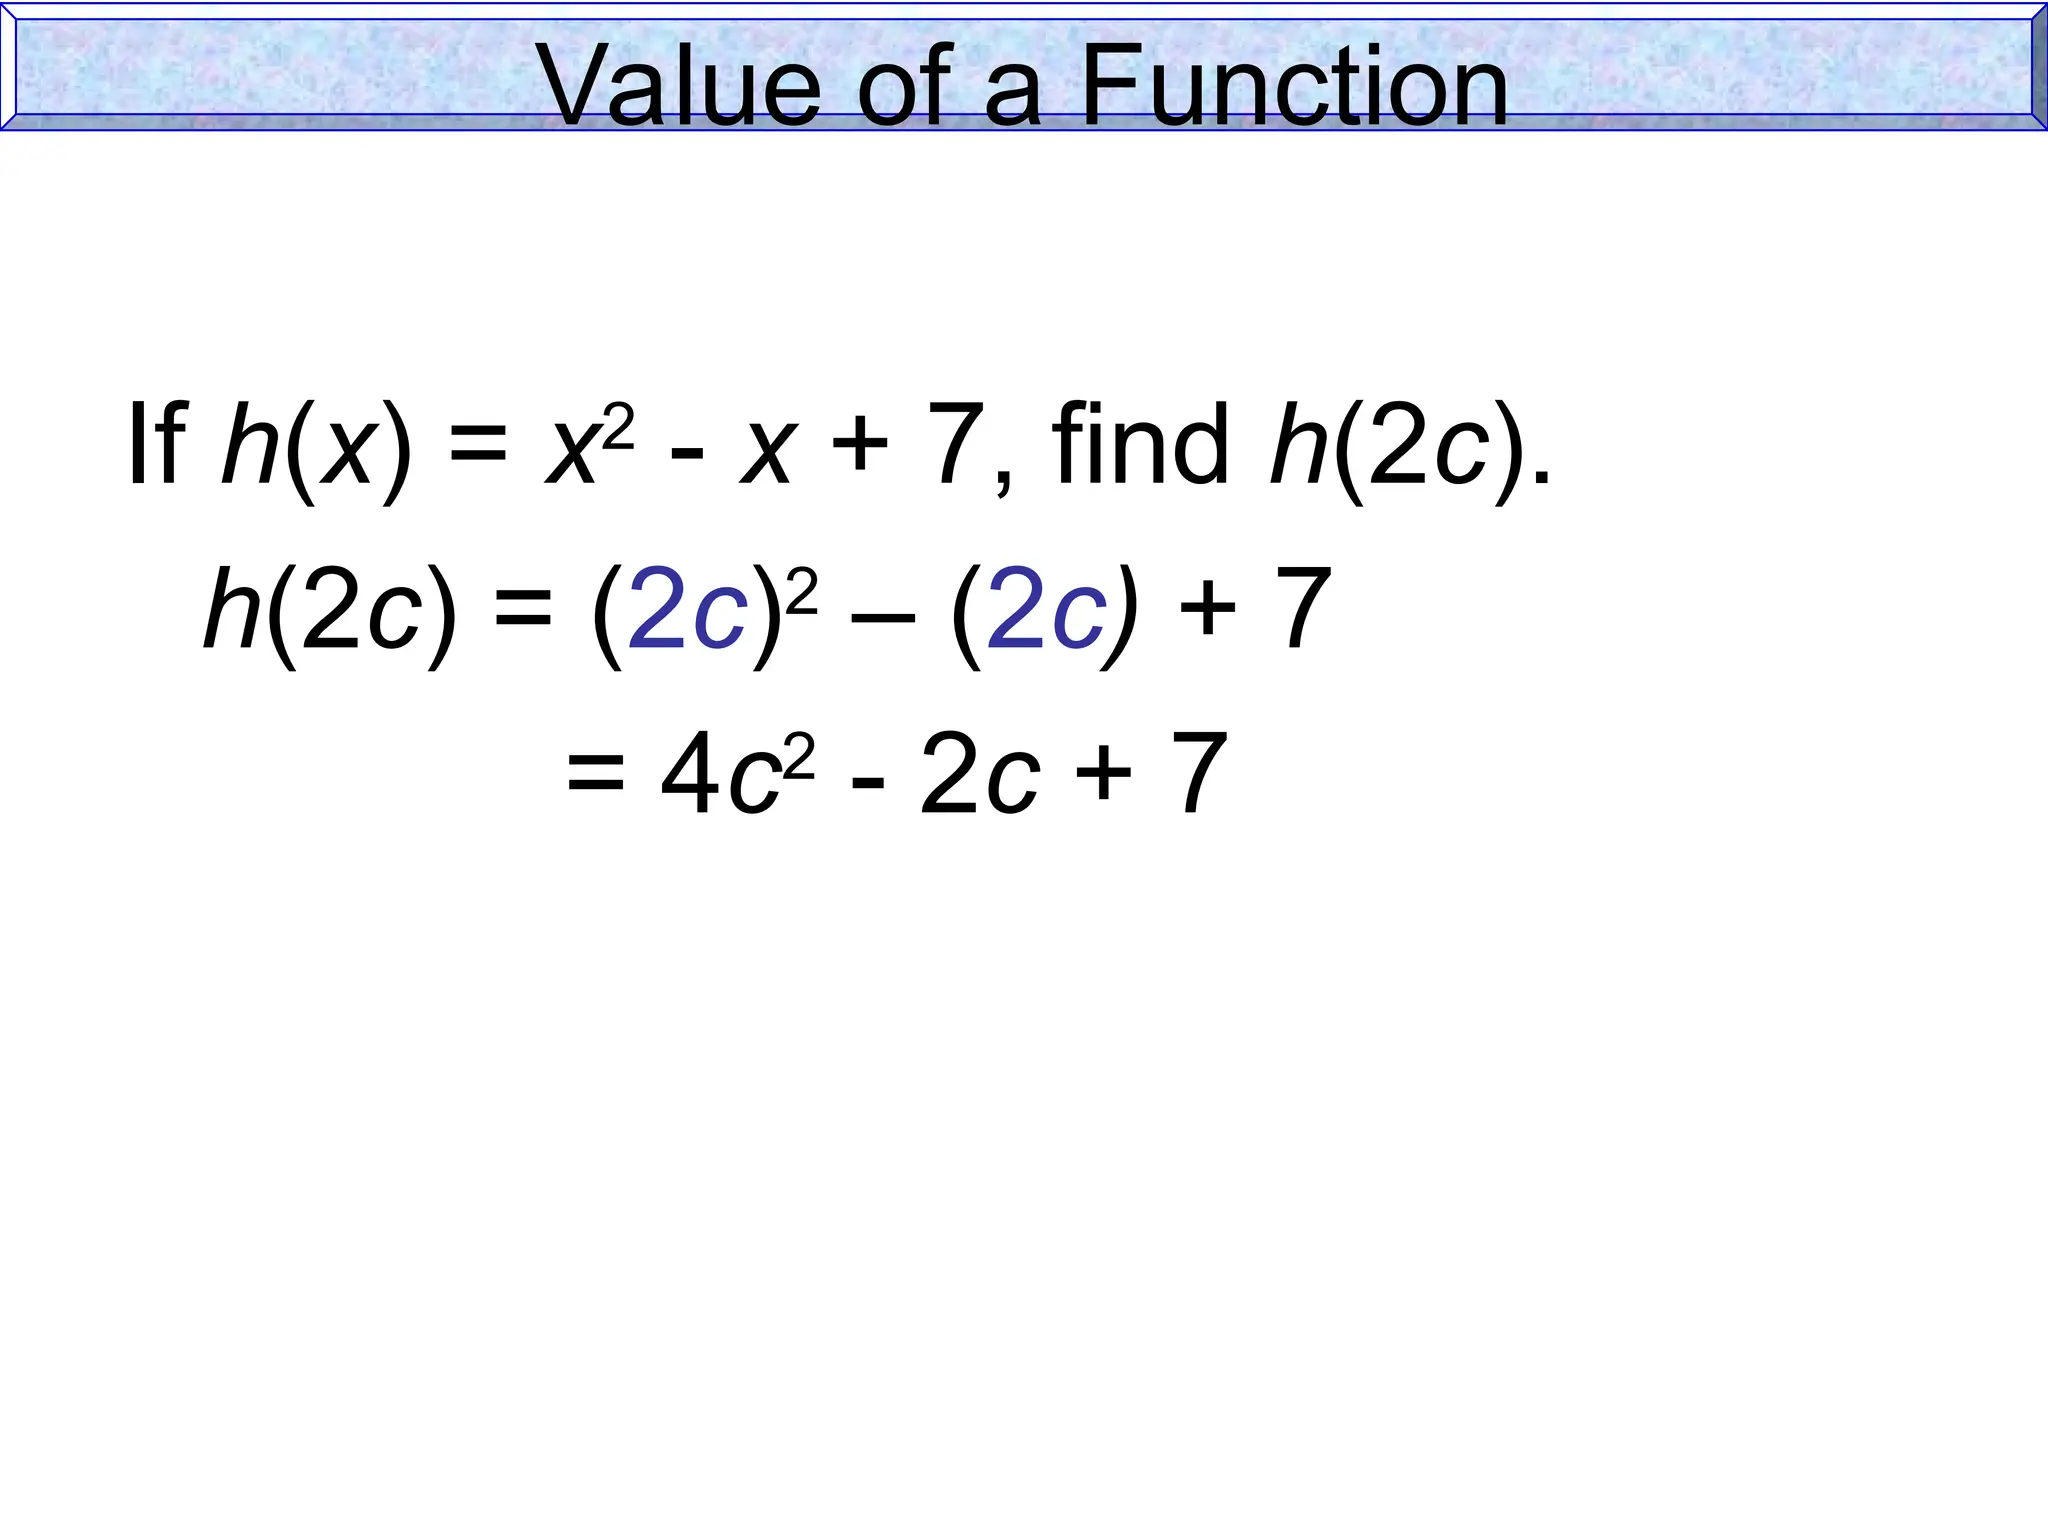
Value of aFunction
If h(x) = x2
- x + 7, find h(2c).
h(2c) = (2c)2
– (2c) + 7
= 4c2
- 2c + 7
72.
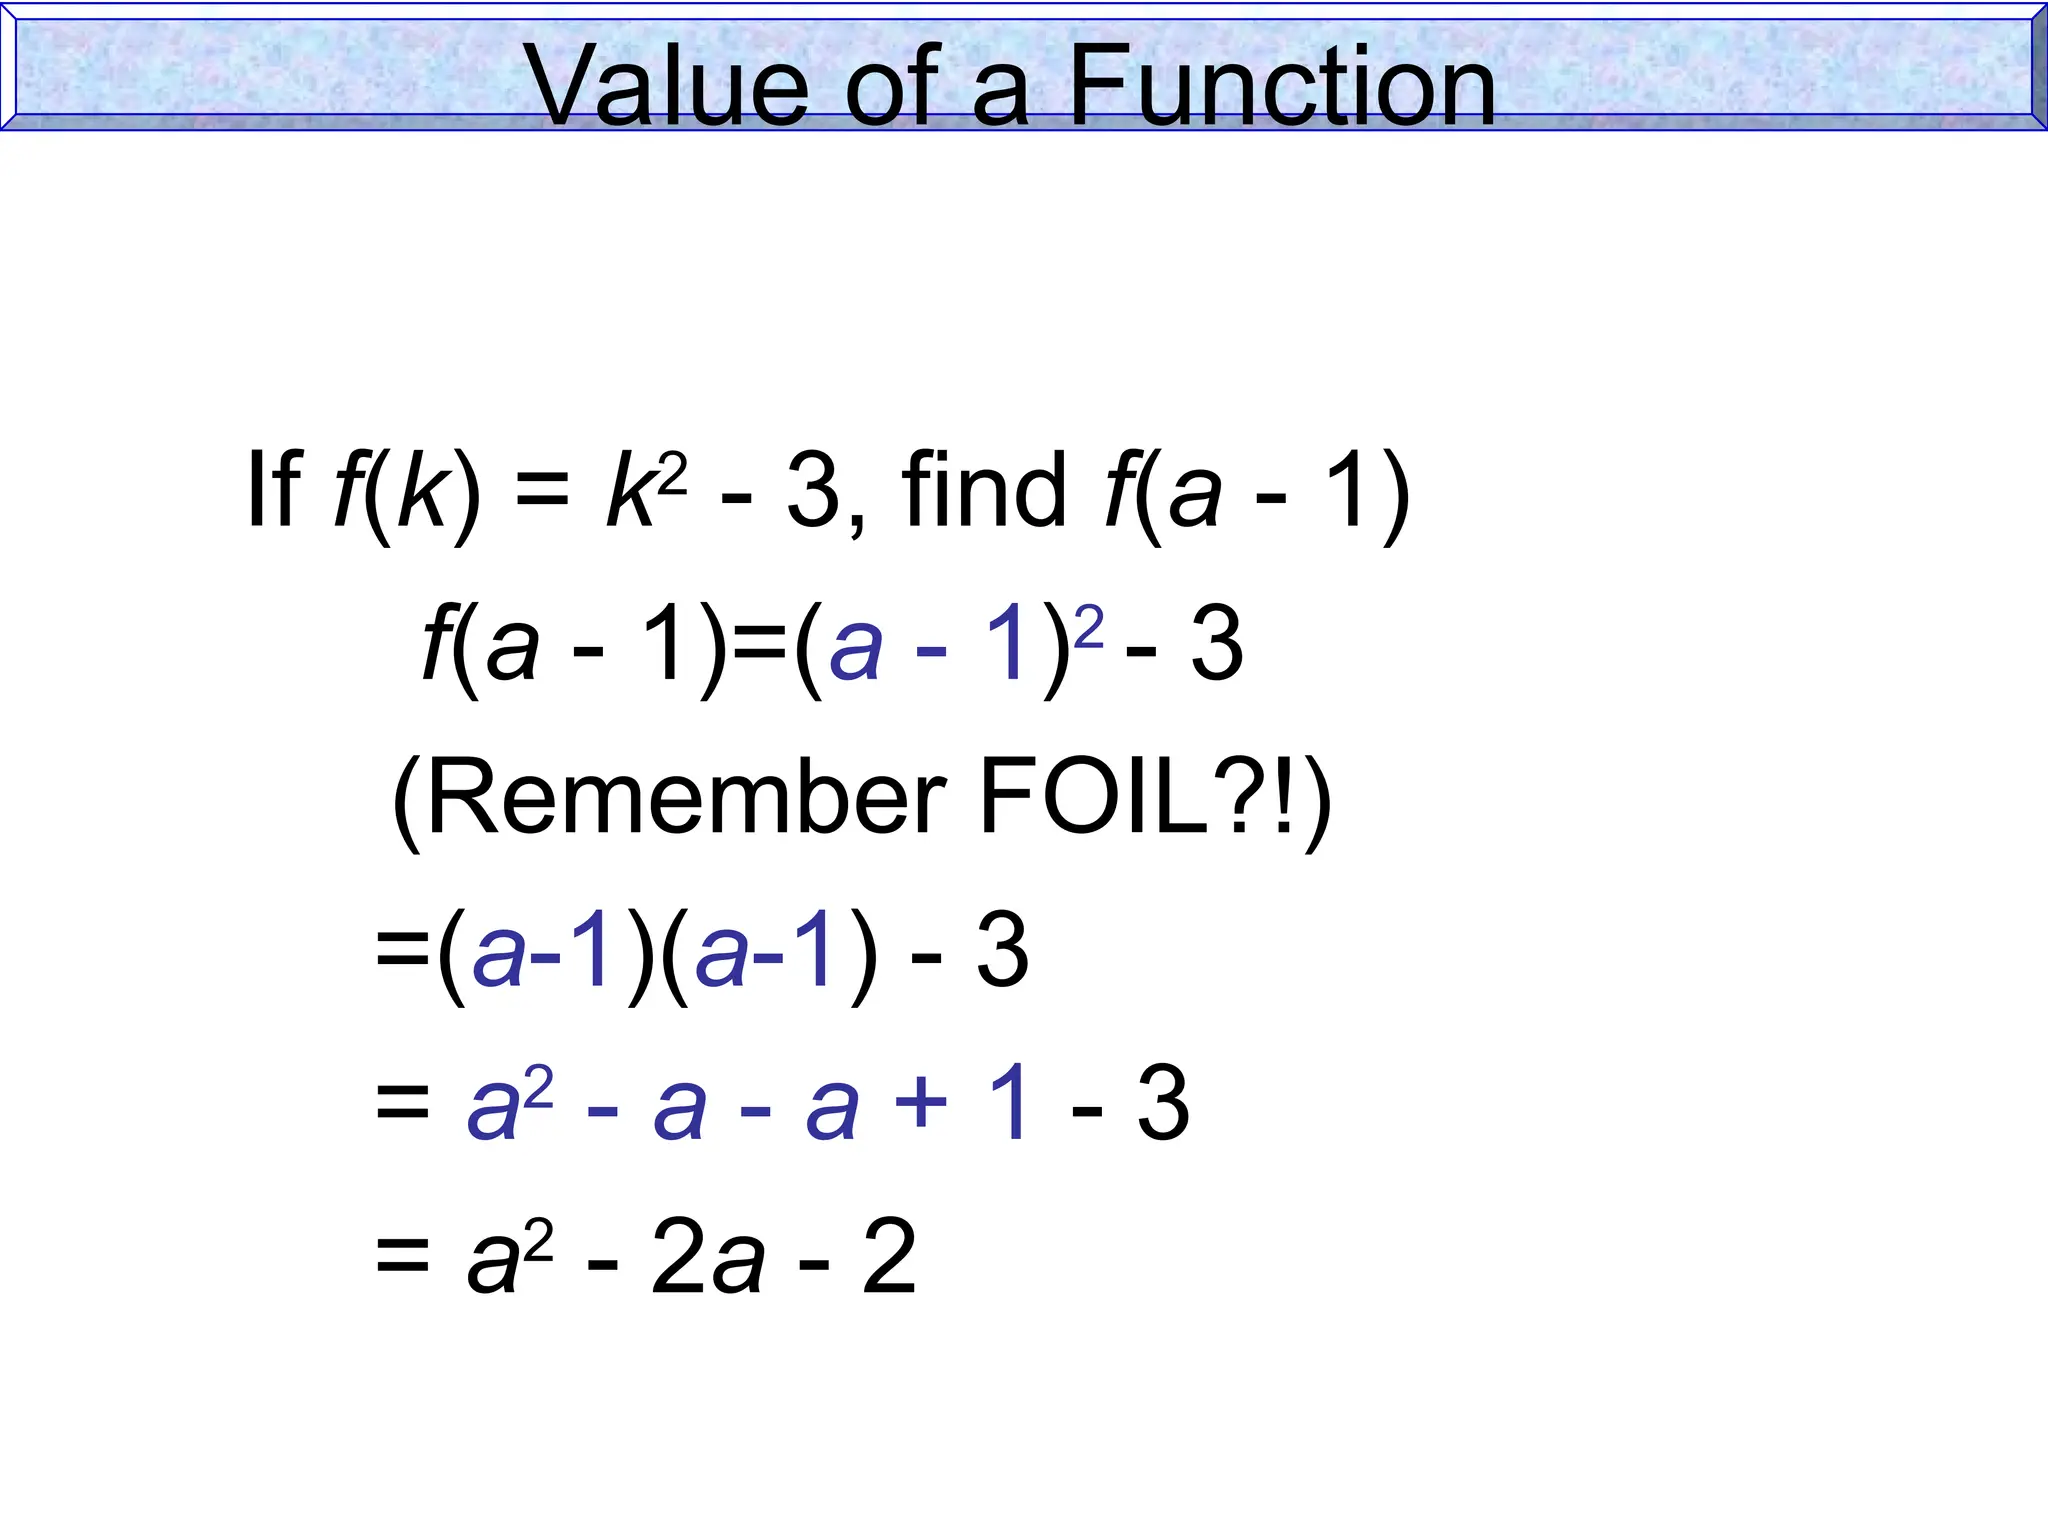
Value of aFunction
If f(k) = k2
- 3, find f(a - 1)
f(a - 1)=(a - 1)2
- 3
(Remember FOIL?!)
=(a-1)(a-1) - 3
= a2
- a - a + 1 - 3
= a2
- 2a - 2
73.
1
2
relation
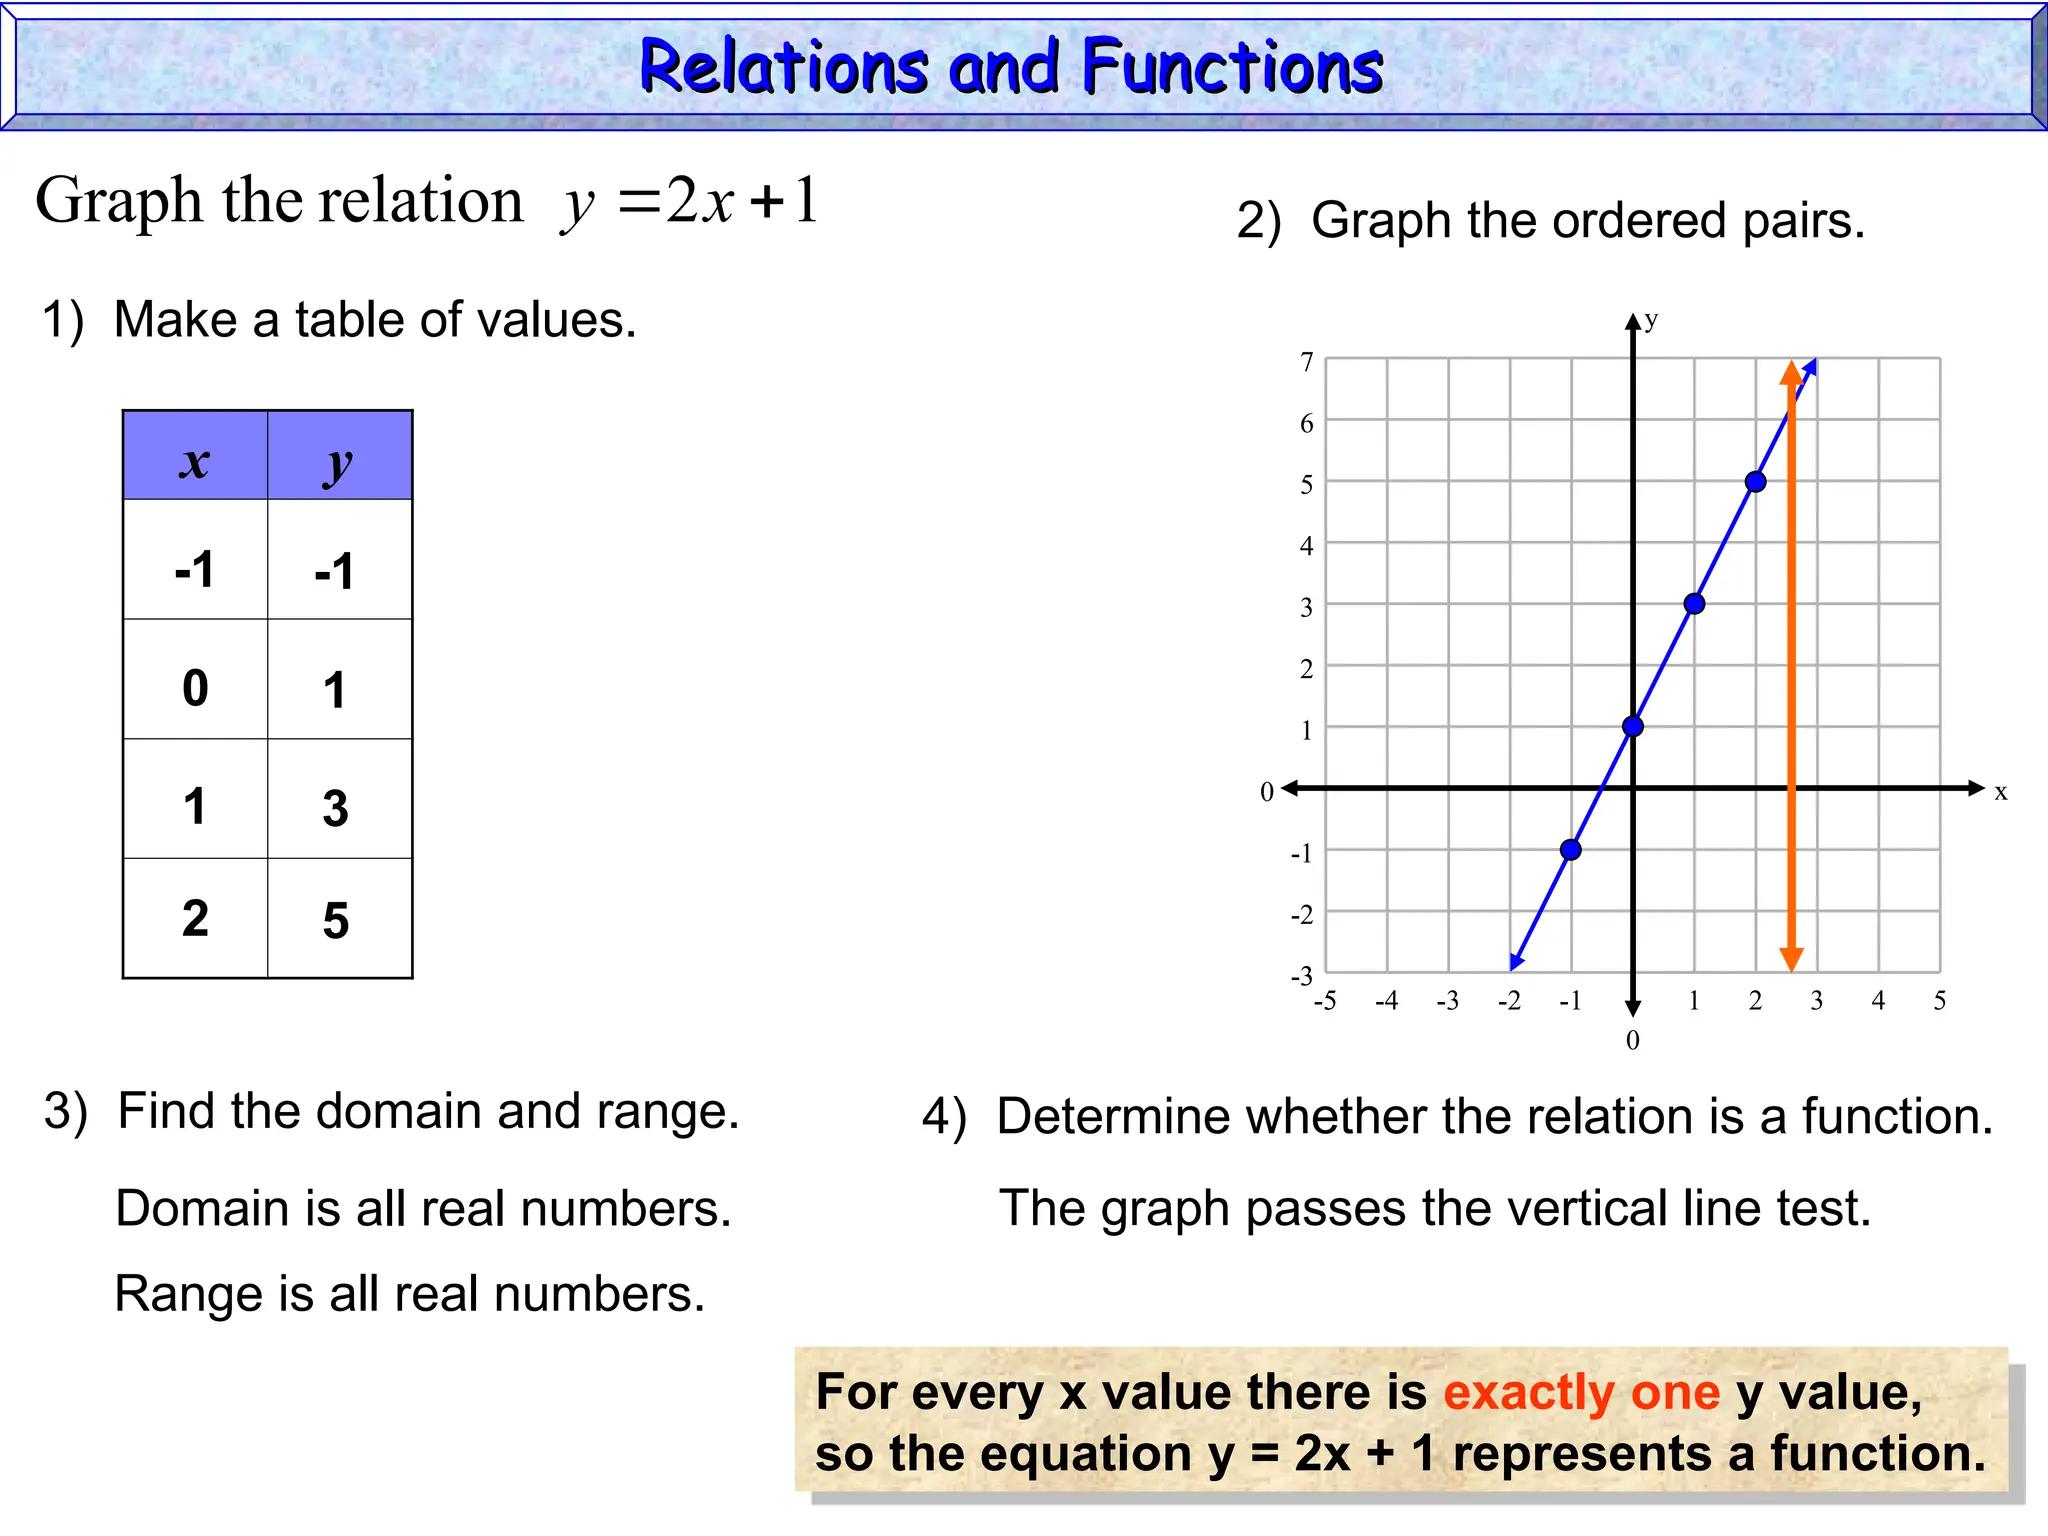
Graph the
x
y
x y
1) Make a table of values.
-1
0
1
2
-1
1
3
5
2) Graph the ordered pairs.
0
y
0 x
5
-4 -2 1 3
-3
-3
-1
2
4
6
-5 -1 4
-2
3
-5 2
1
-3
5
7
3) Find the domain and range.
Domain is all real numbers.
Range is all real numbers.
4) Determine whether the relation is a function.
The graph passes the vertical line test.
For every x value there is exactly one y value,
so the equation y = 2x + 1 represents a function.
Relations and Functions
Relations and Functions
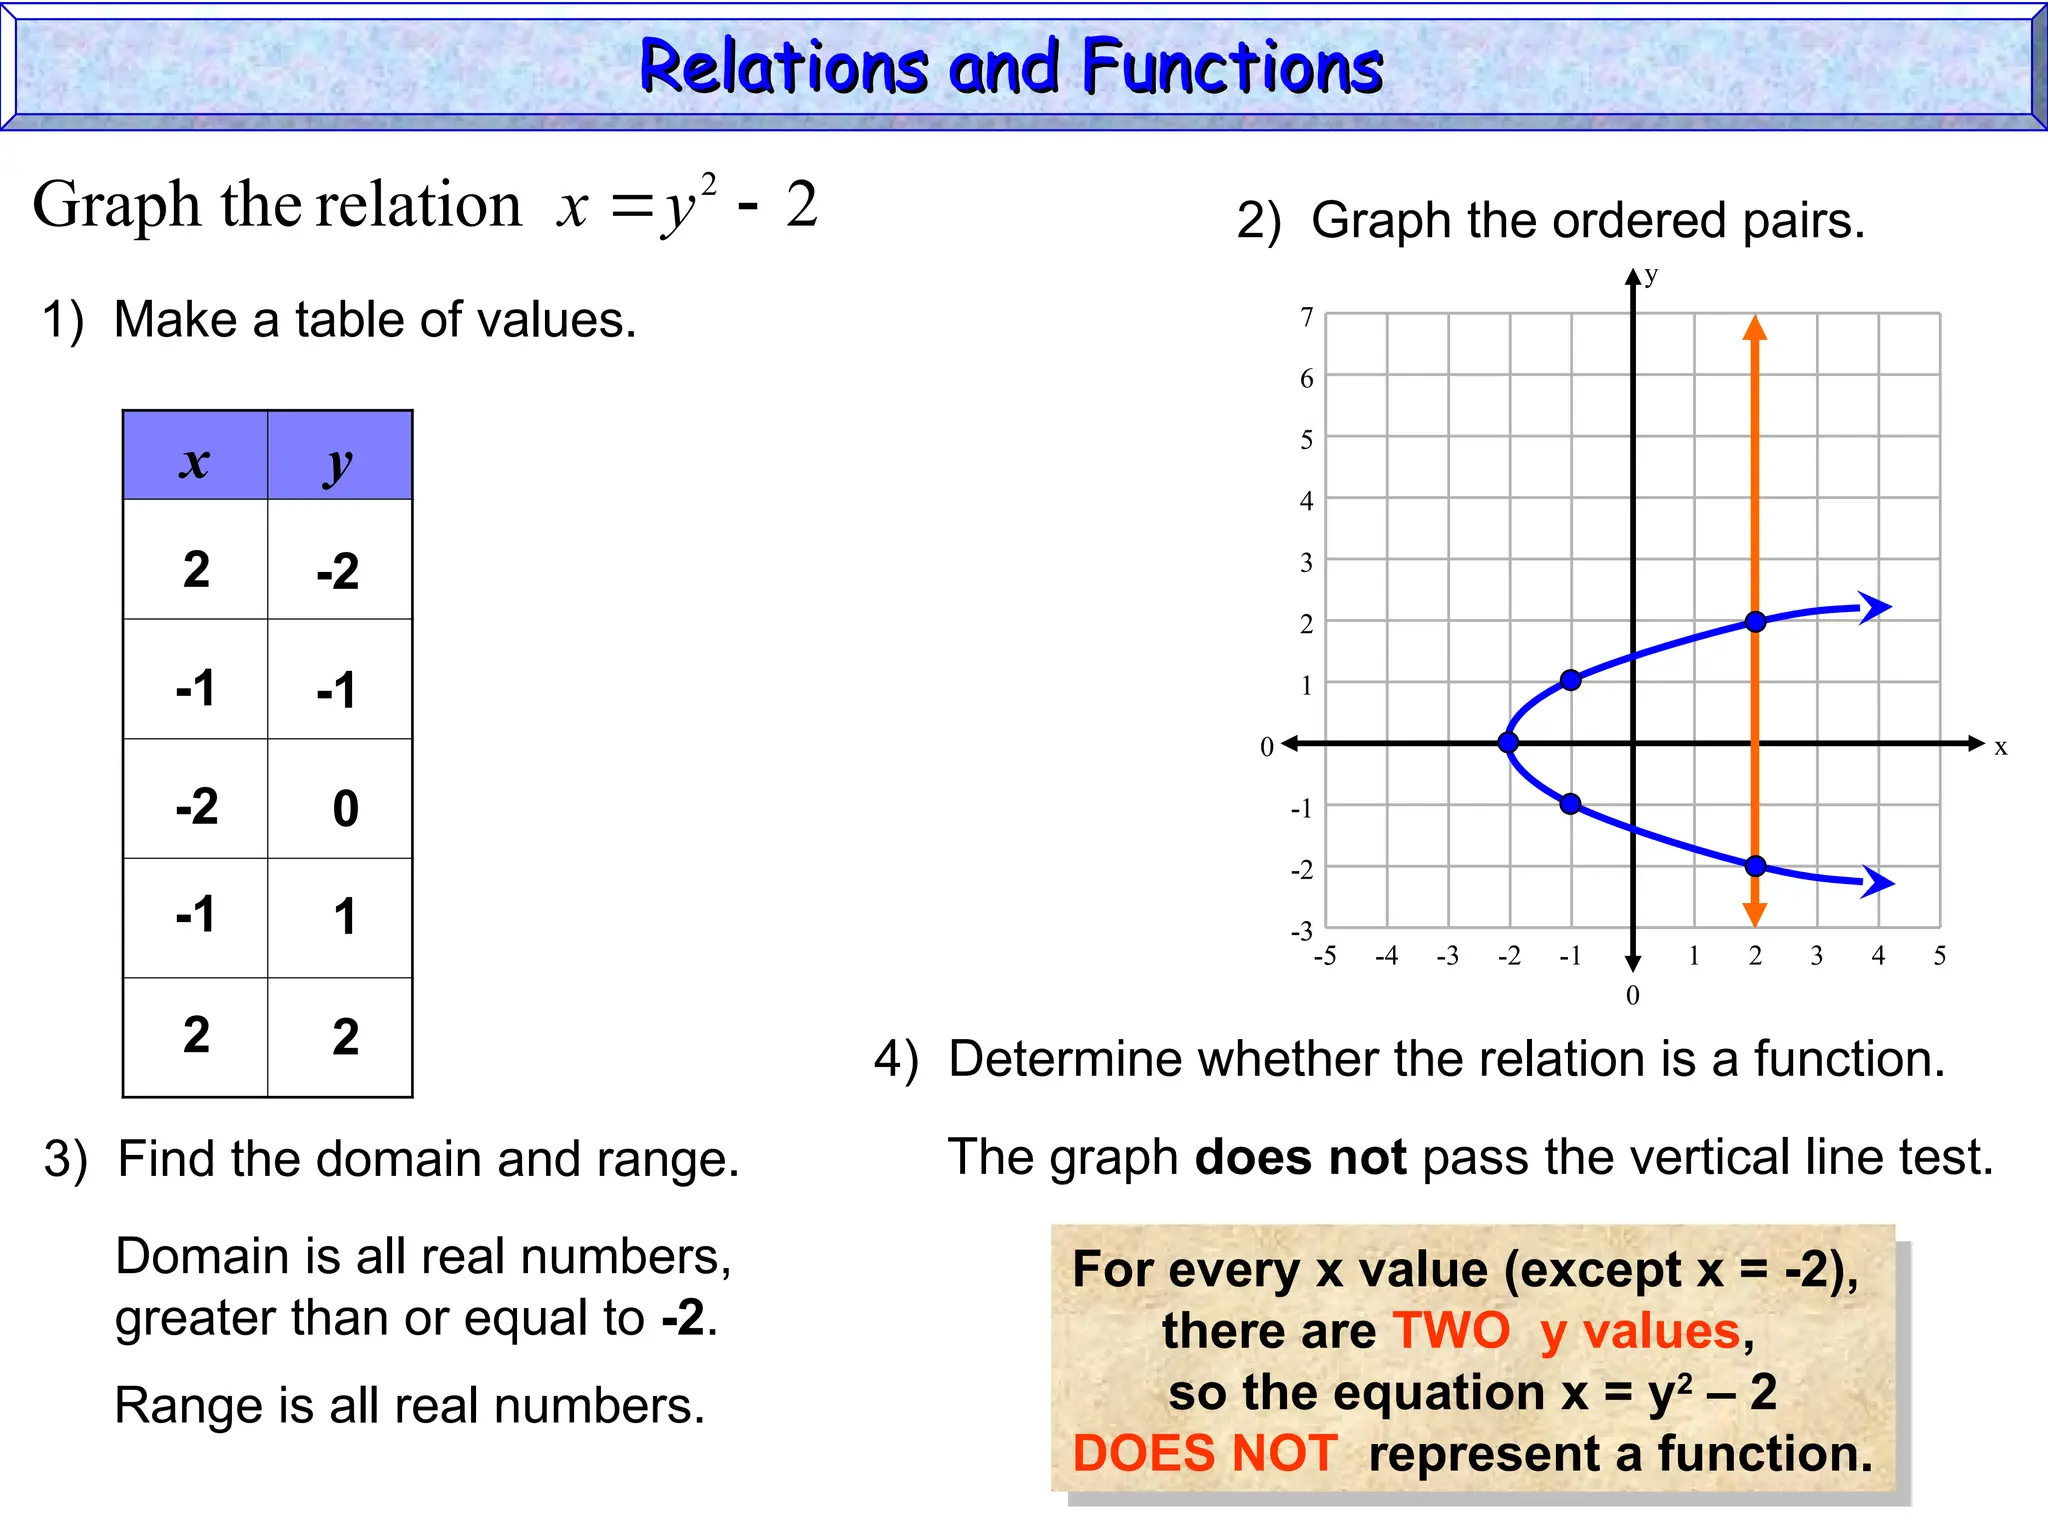
74.
2
relation
Graph the 2
y
x
xy
1) Make a table of values.
2
-1
-2
-2
-1
0
2) Graph the ordered pairs.
0
y
0 x
5
-4 -2 1 3
-3
-3
-1
2
4
6
-5 -1 4
-2
3
-5 2
1
-3
5
7
3) Find the domain and range.
Domain is all real numbers,
greater than or equal to -2.
Range is all real numbers.
4) Determine whether the relation is a function.
The graph does not pass the vertical line test.
For every x value (except x = -2),
there are TWO y values,
so the equation x = y2
– 2
DOES NOT represent a function.
-1 1
2 2
Relations and Functions
Relations and Functions
75.
Graphs of aFunction
Vertical Line Test:
If a vertical line is passed
over the graph and it intersects
the graph in exactly one point,
the graph represents a function.
76.
x
y
x
y
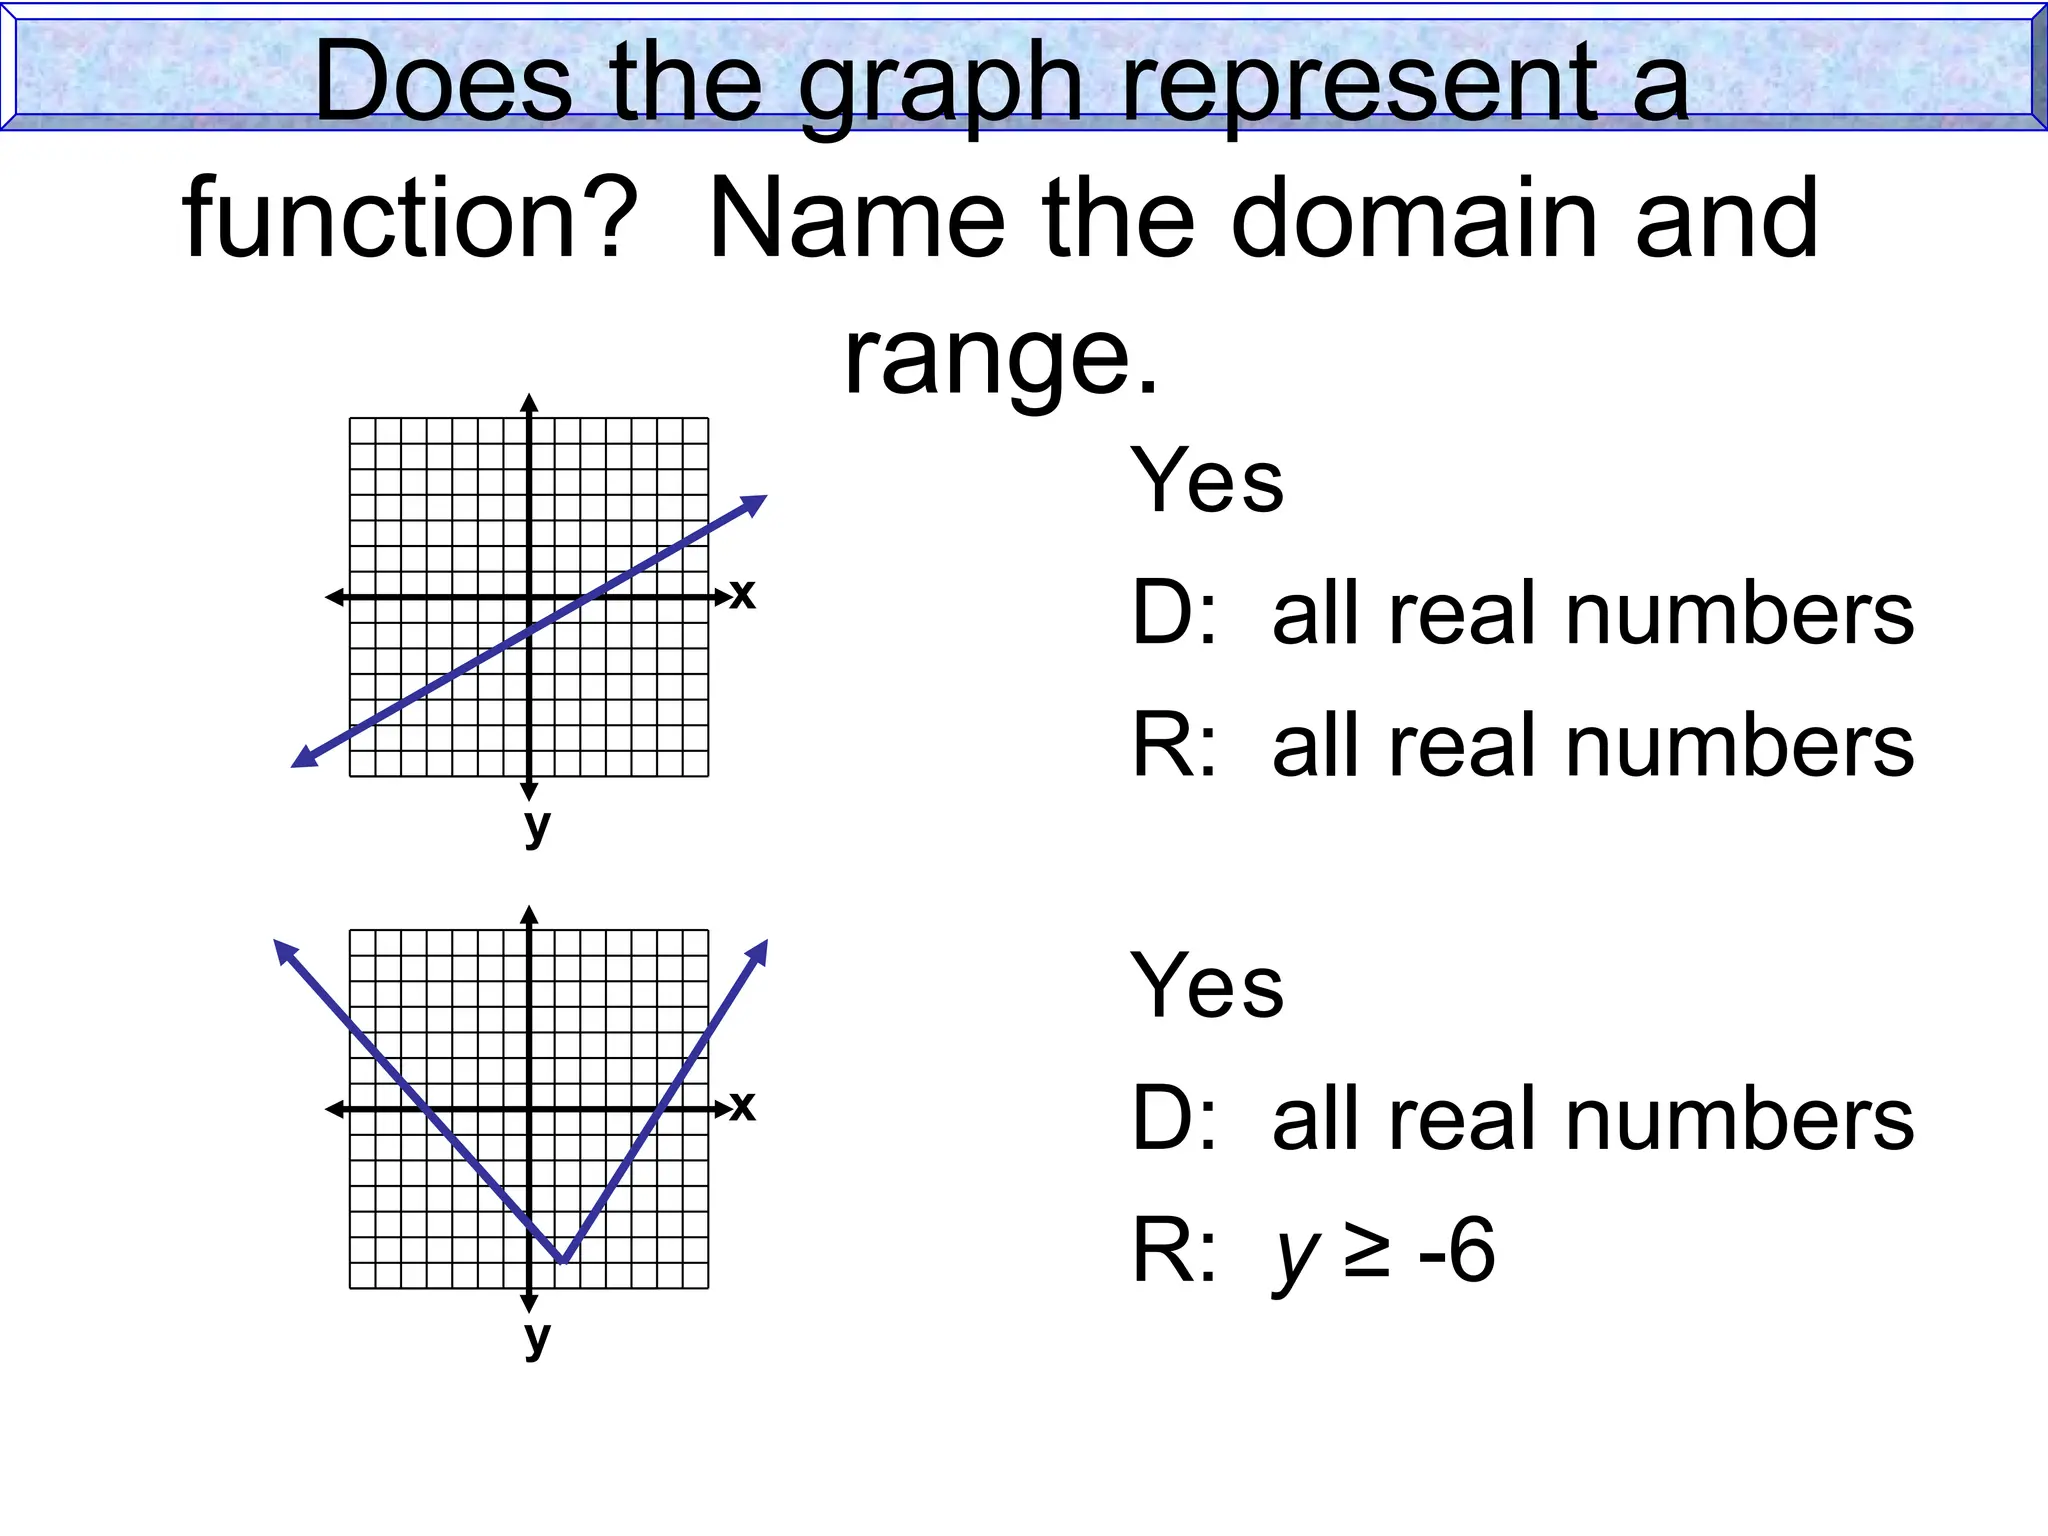
Does the graphrepresent a
function? Name the domain and
range.
Yes
D: all real numbers
R: all real numbers
Yes
D: all real numbers
R: y ≥ -6
77.
x
y
x
y
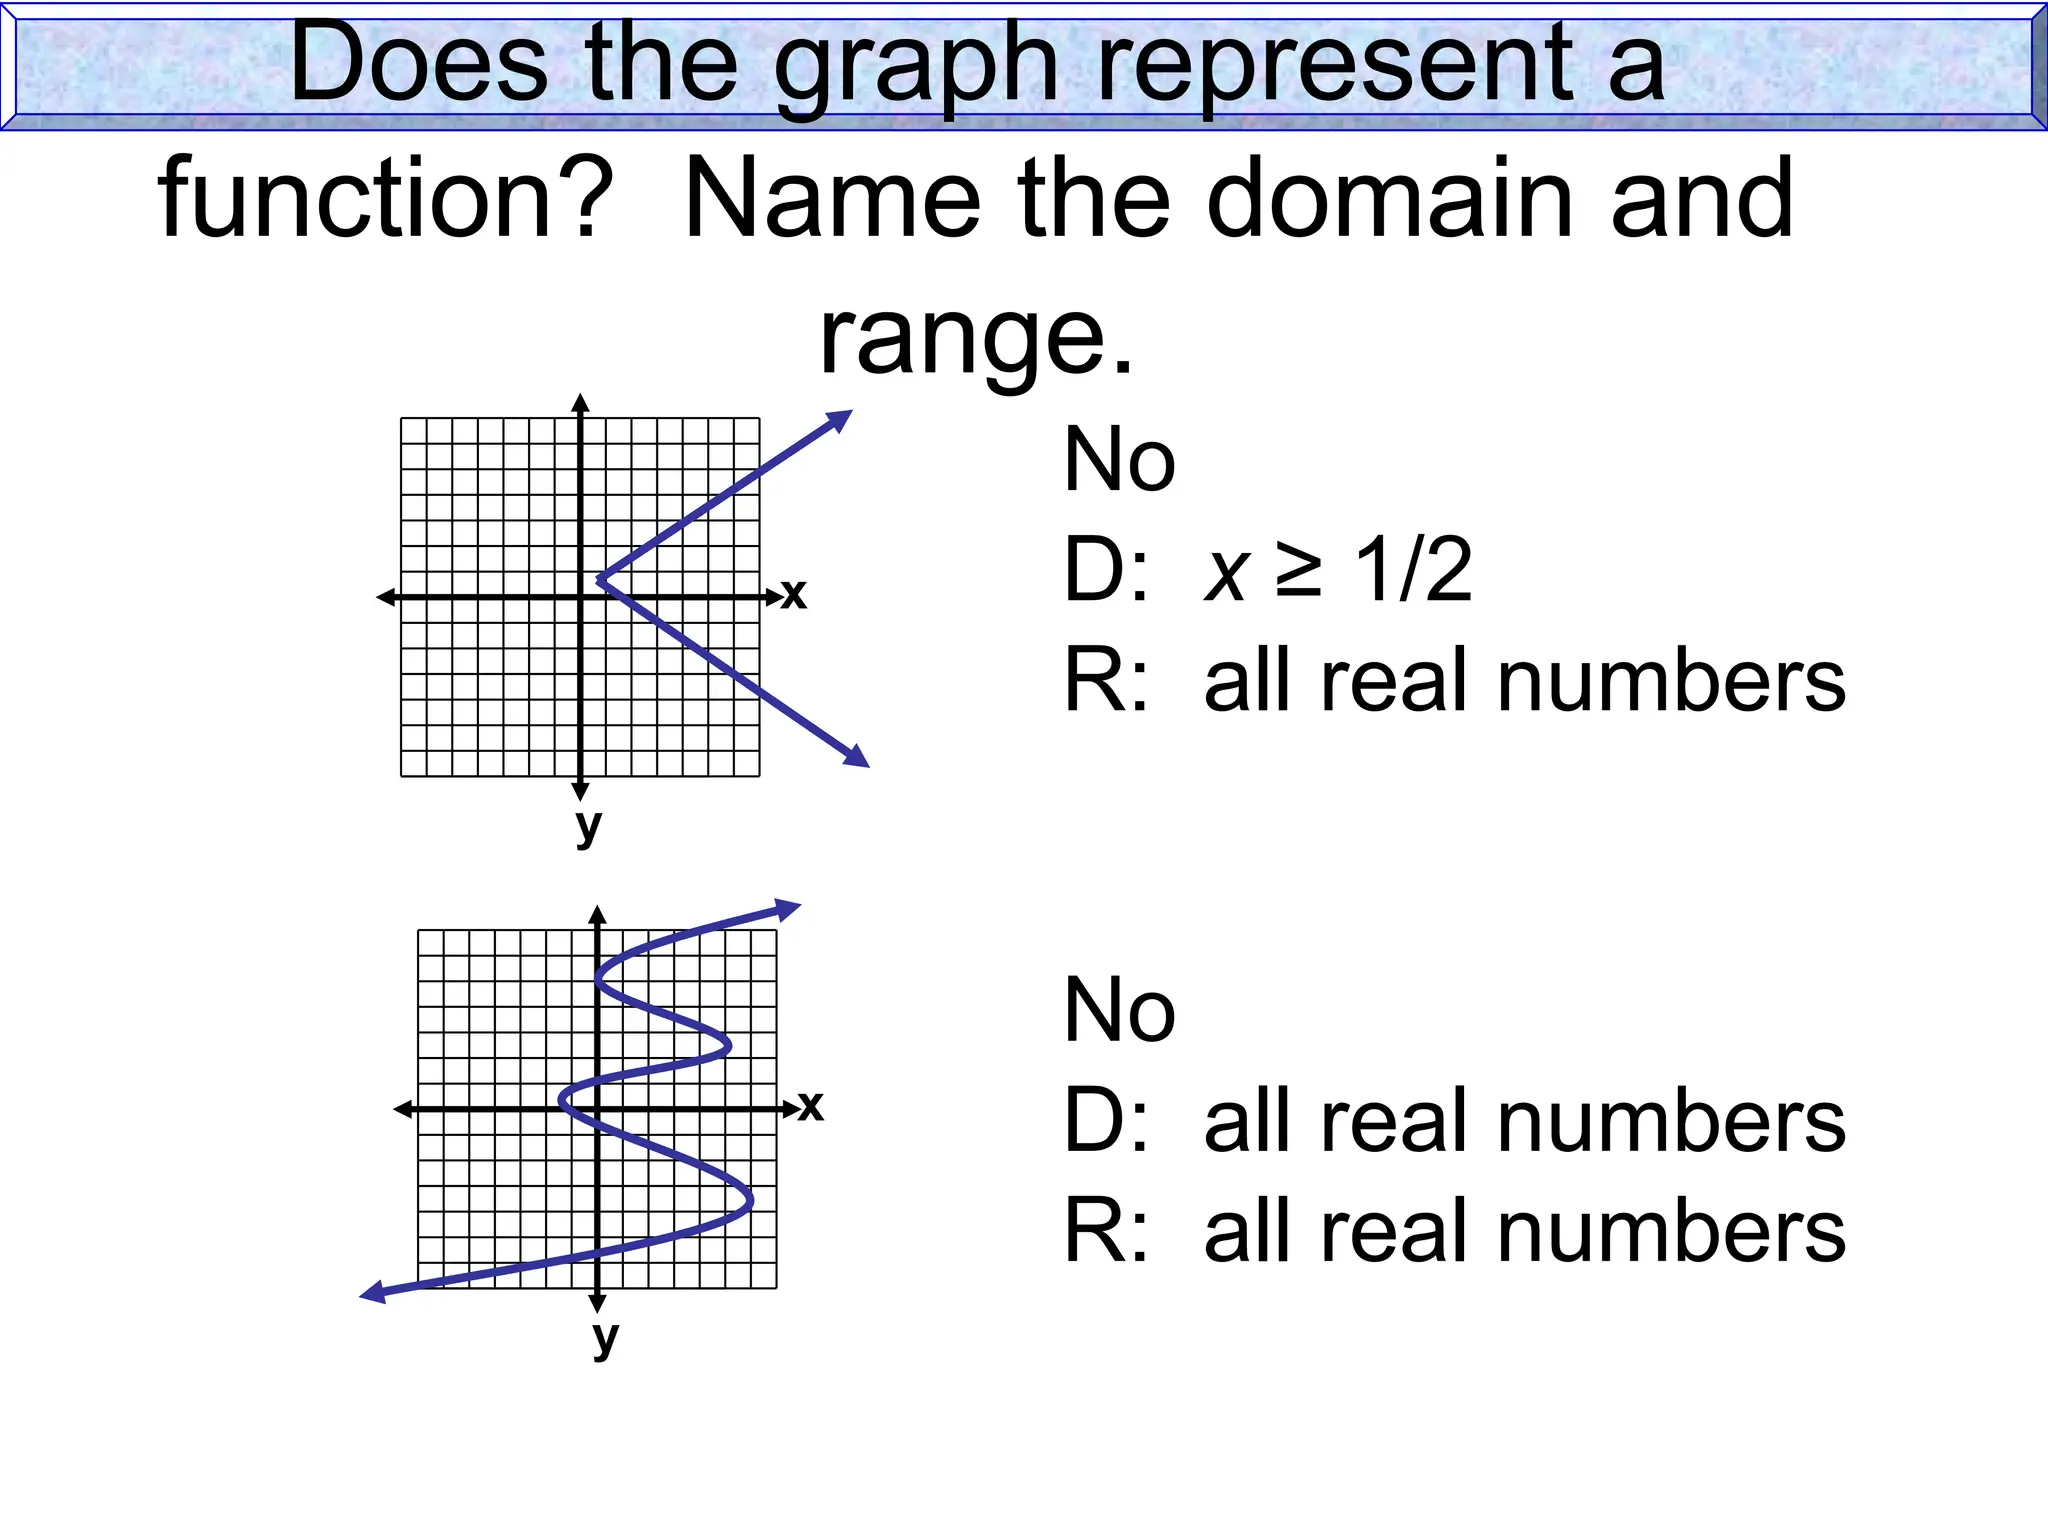
Does the graphrepresent a
function? Name the domain and
range.
No
D: x ≥ 1/2
R: all real numbers
No
D: all real numbers
R: all real numbers
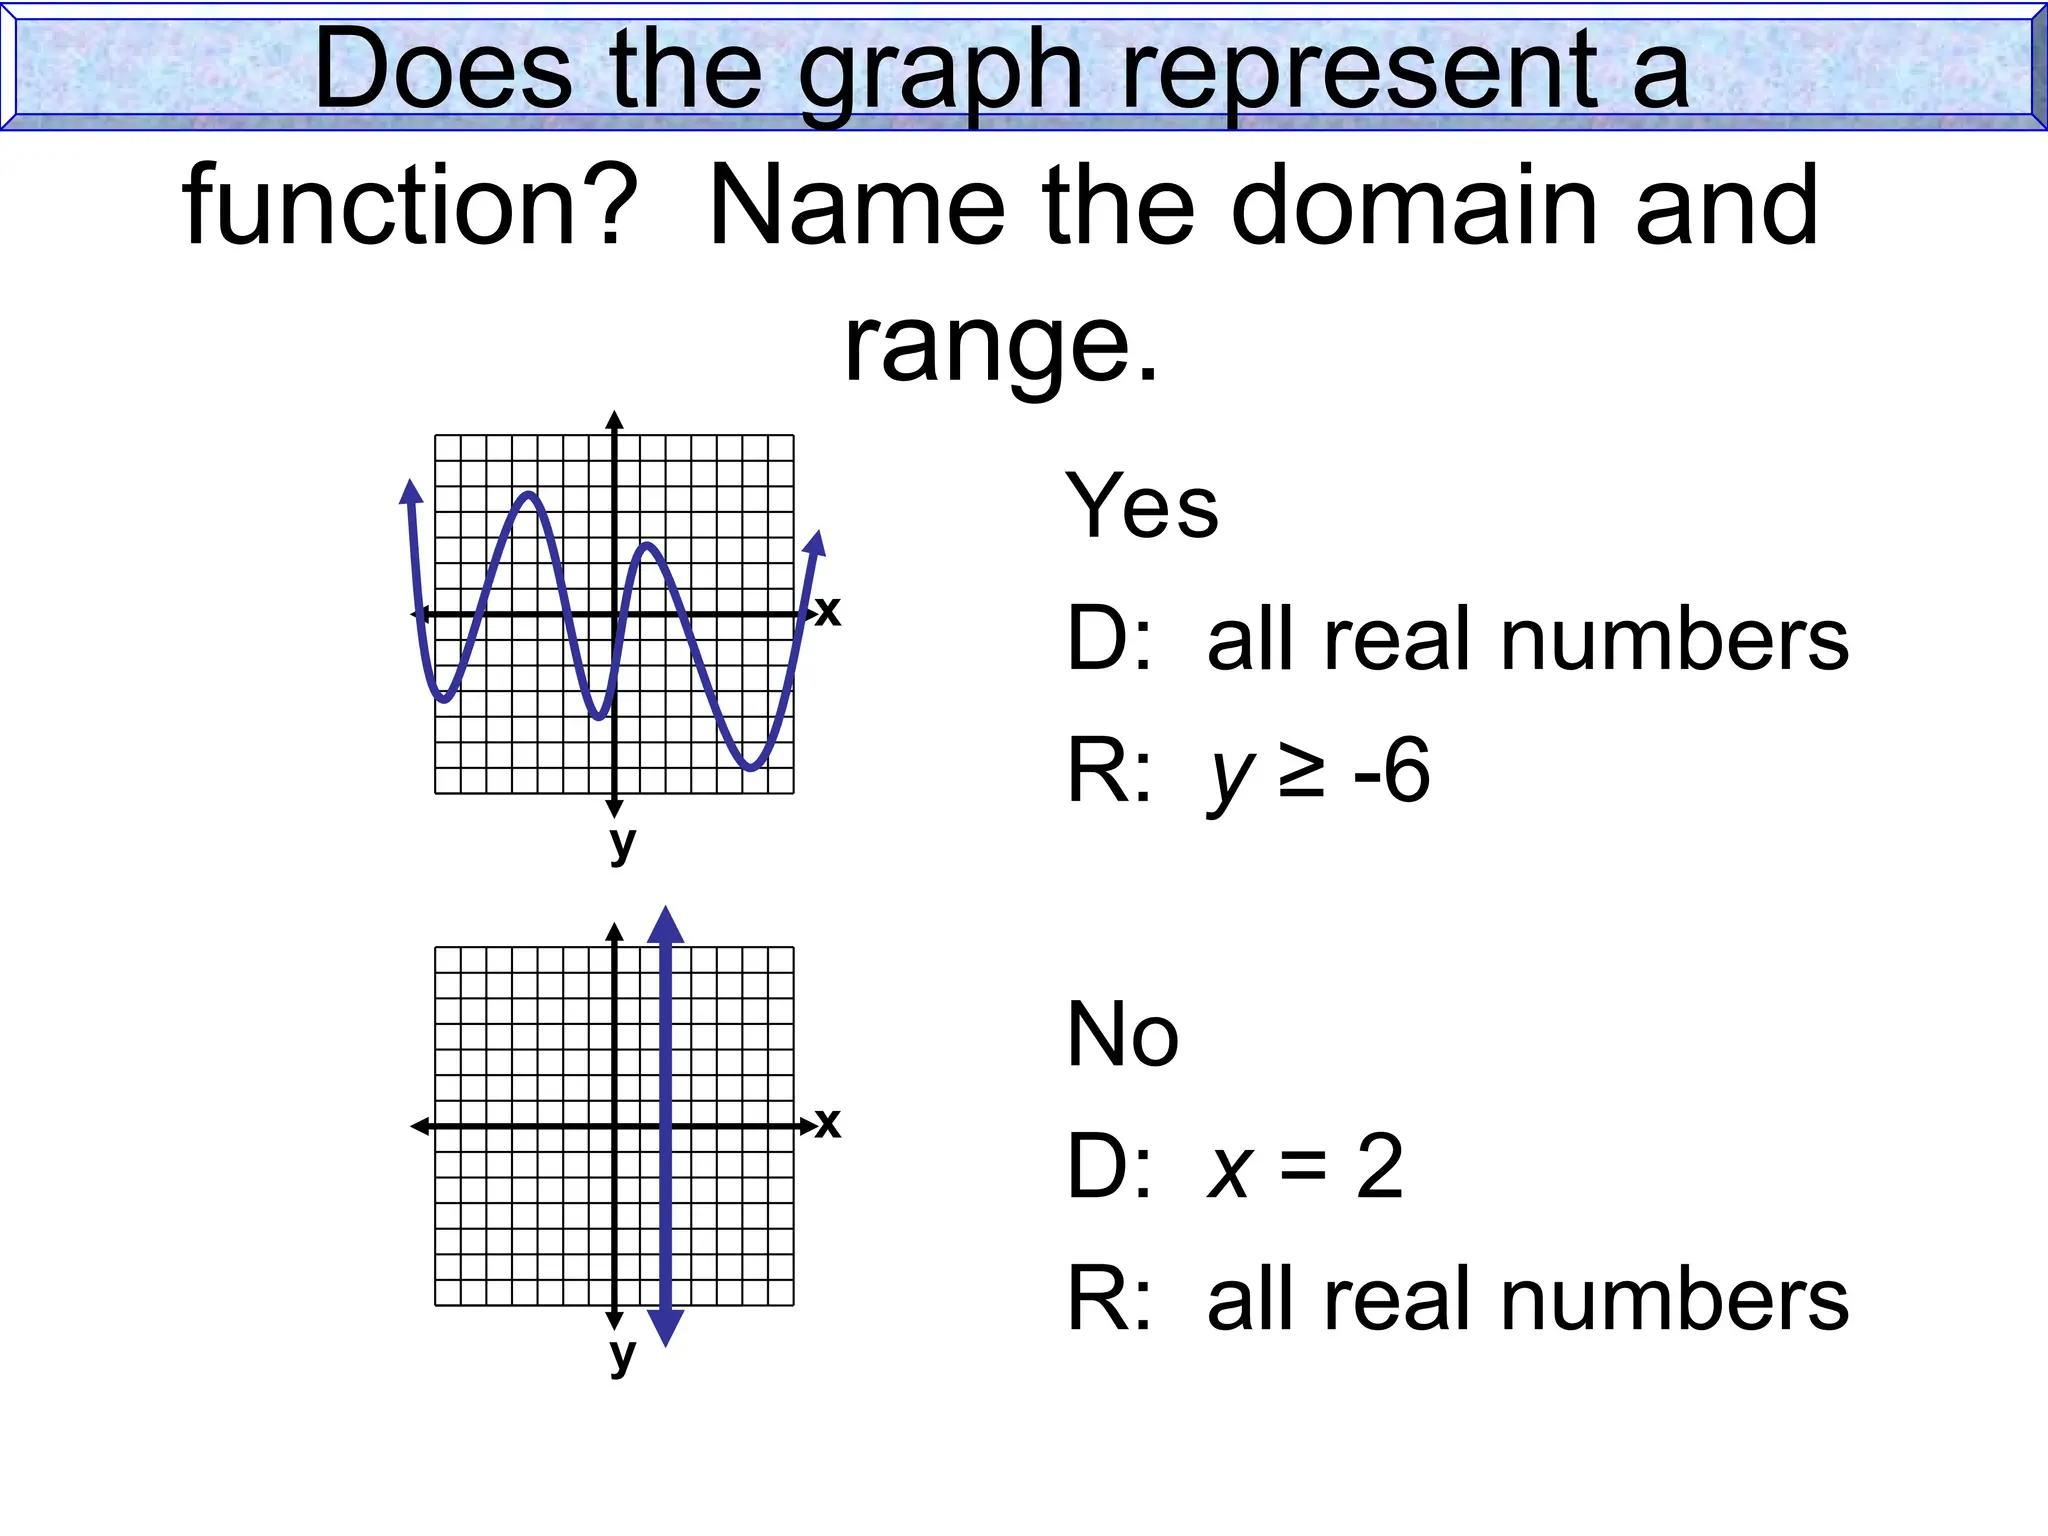
78.
Does the graphrepresent a
function? Name the domain and
range.
Yes
D: all real numbers
R: y ≥ -6
No
D: x = 2
R: all real numbers
x
y
x
y


![Patterns and Algebra(MYP2)(Week 1) [Autosaved].pptx](https://cdn.slidesharecdn.com/ss_thumbnails/patternsandalgebramyp2week1autosaved-250811142530-1aabc82a-thumbnail.jpg?width=640&height=640&fit=bounds)


