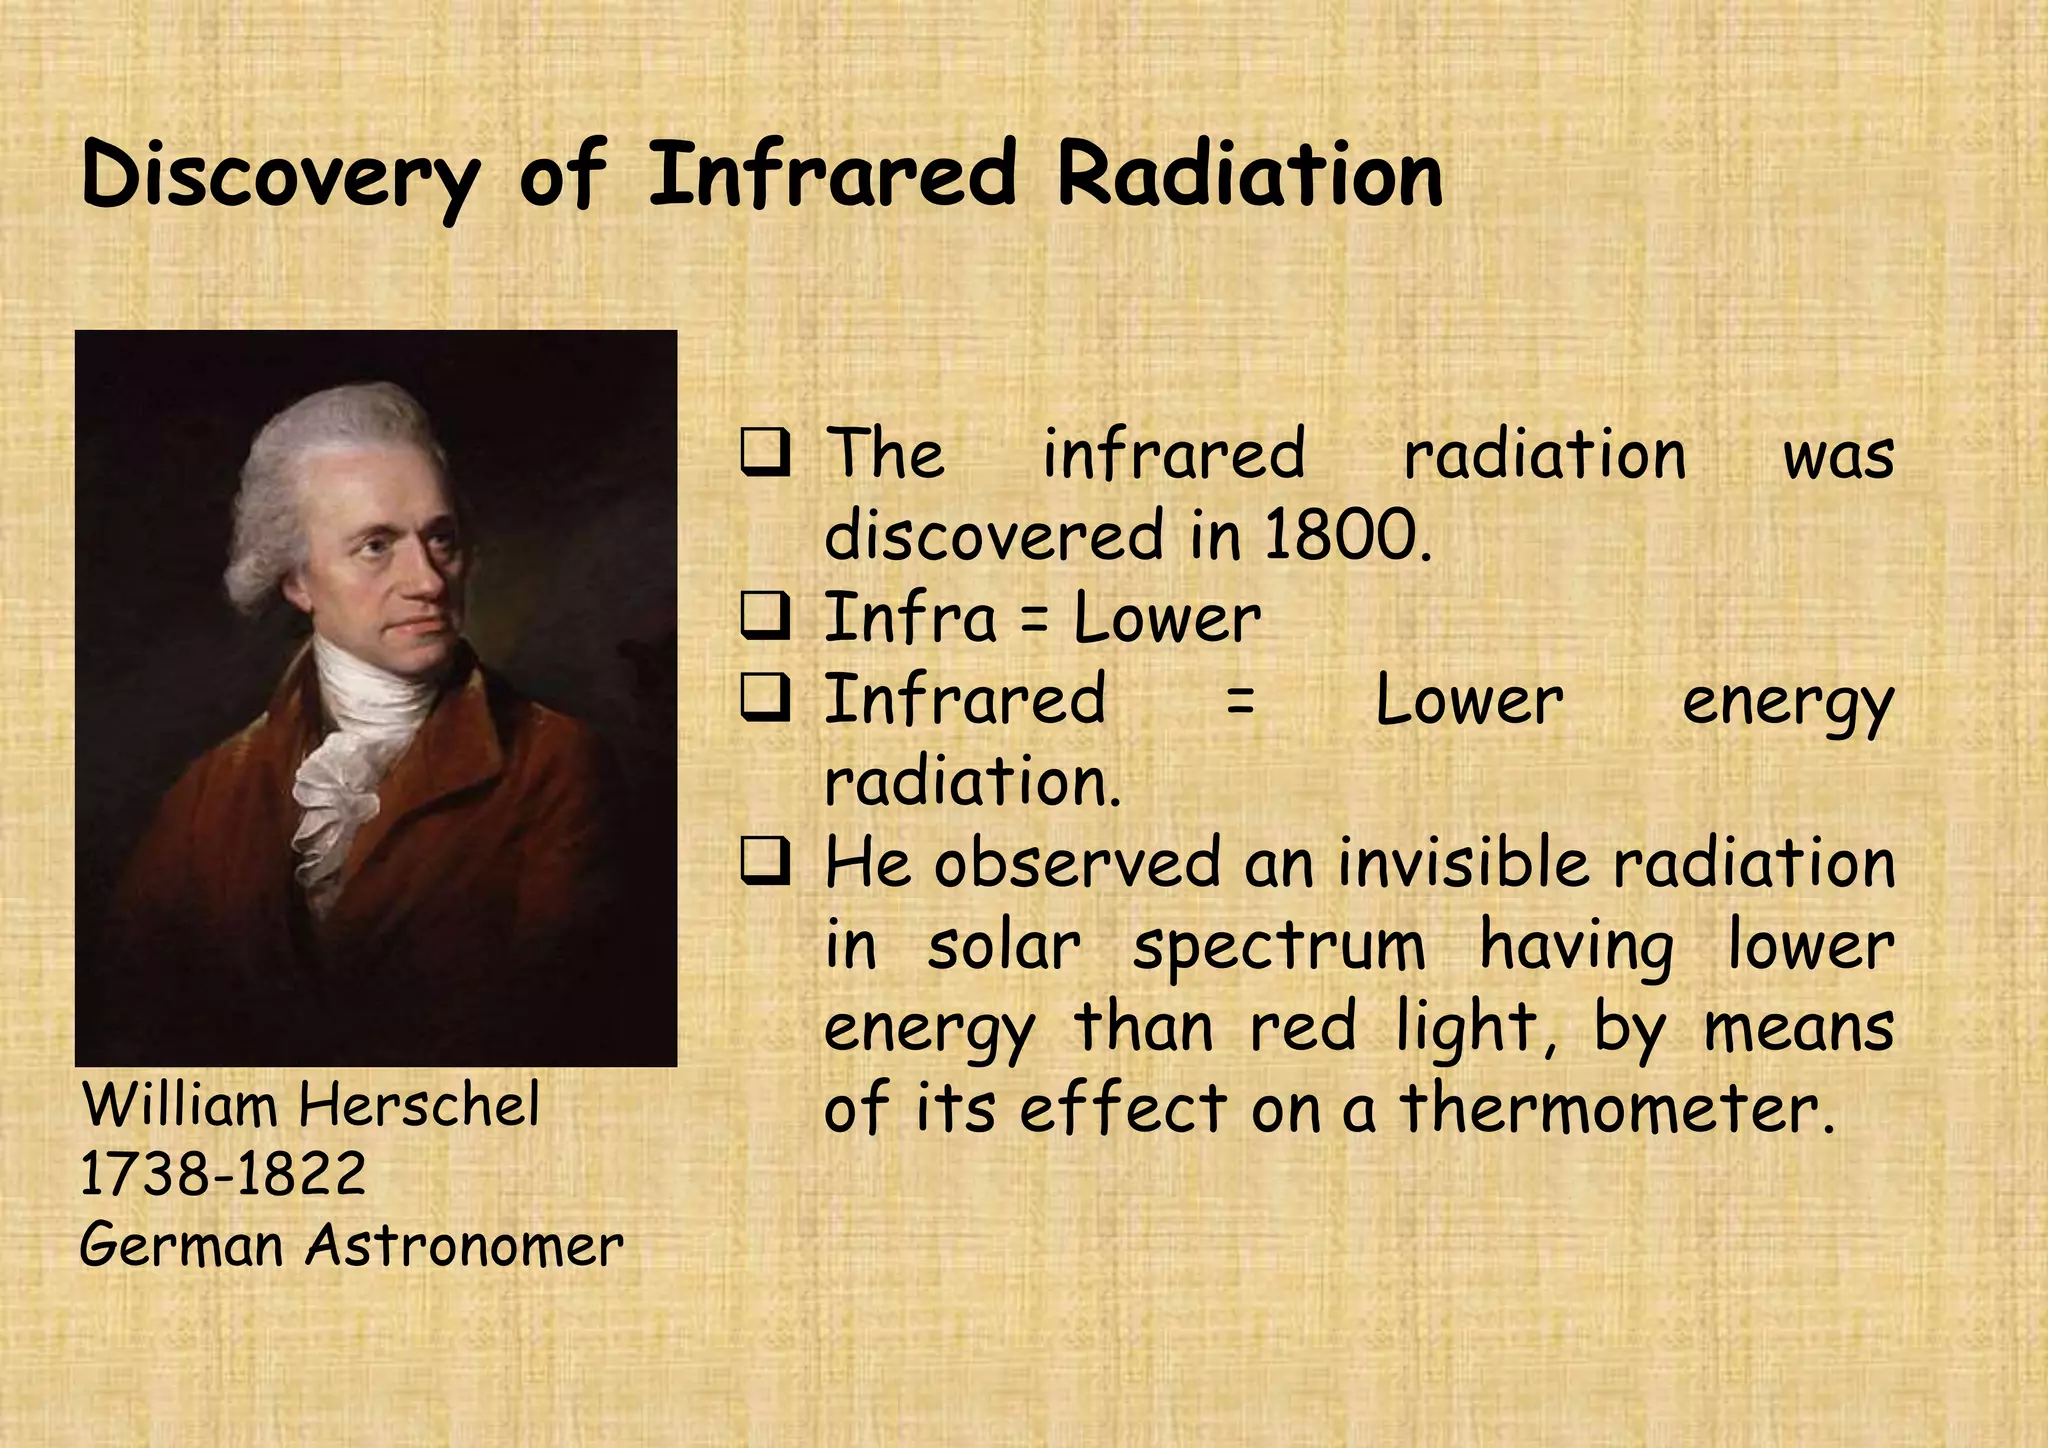
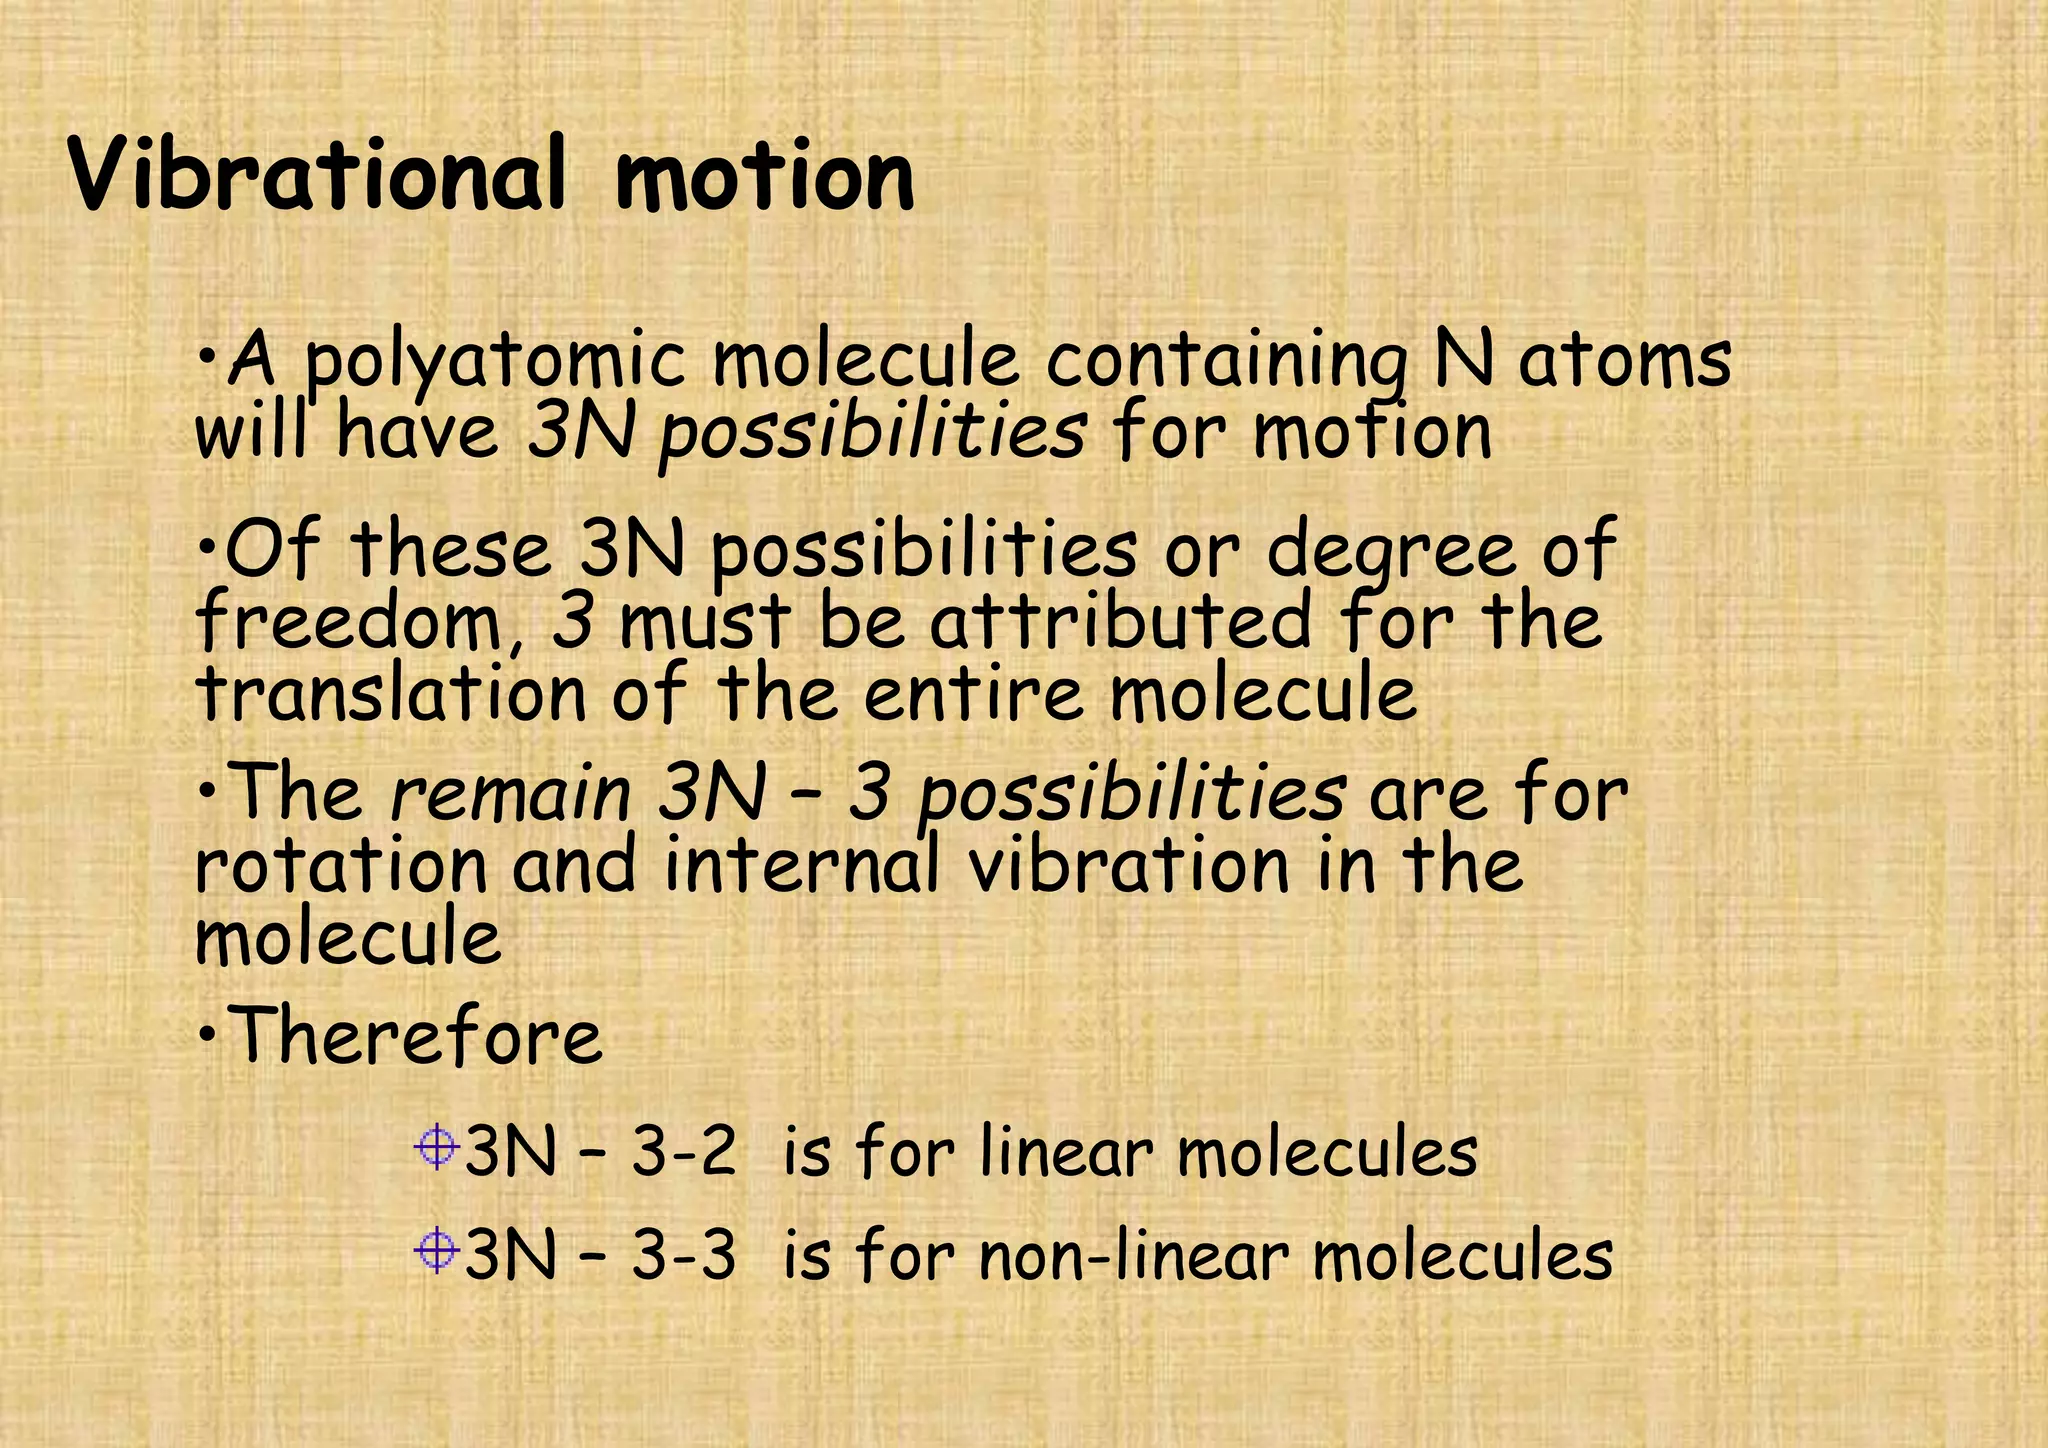
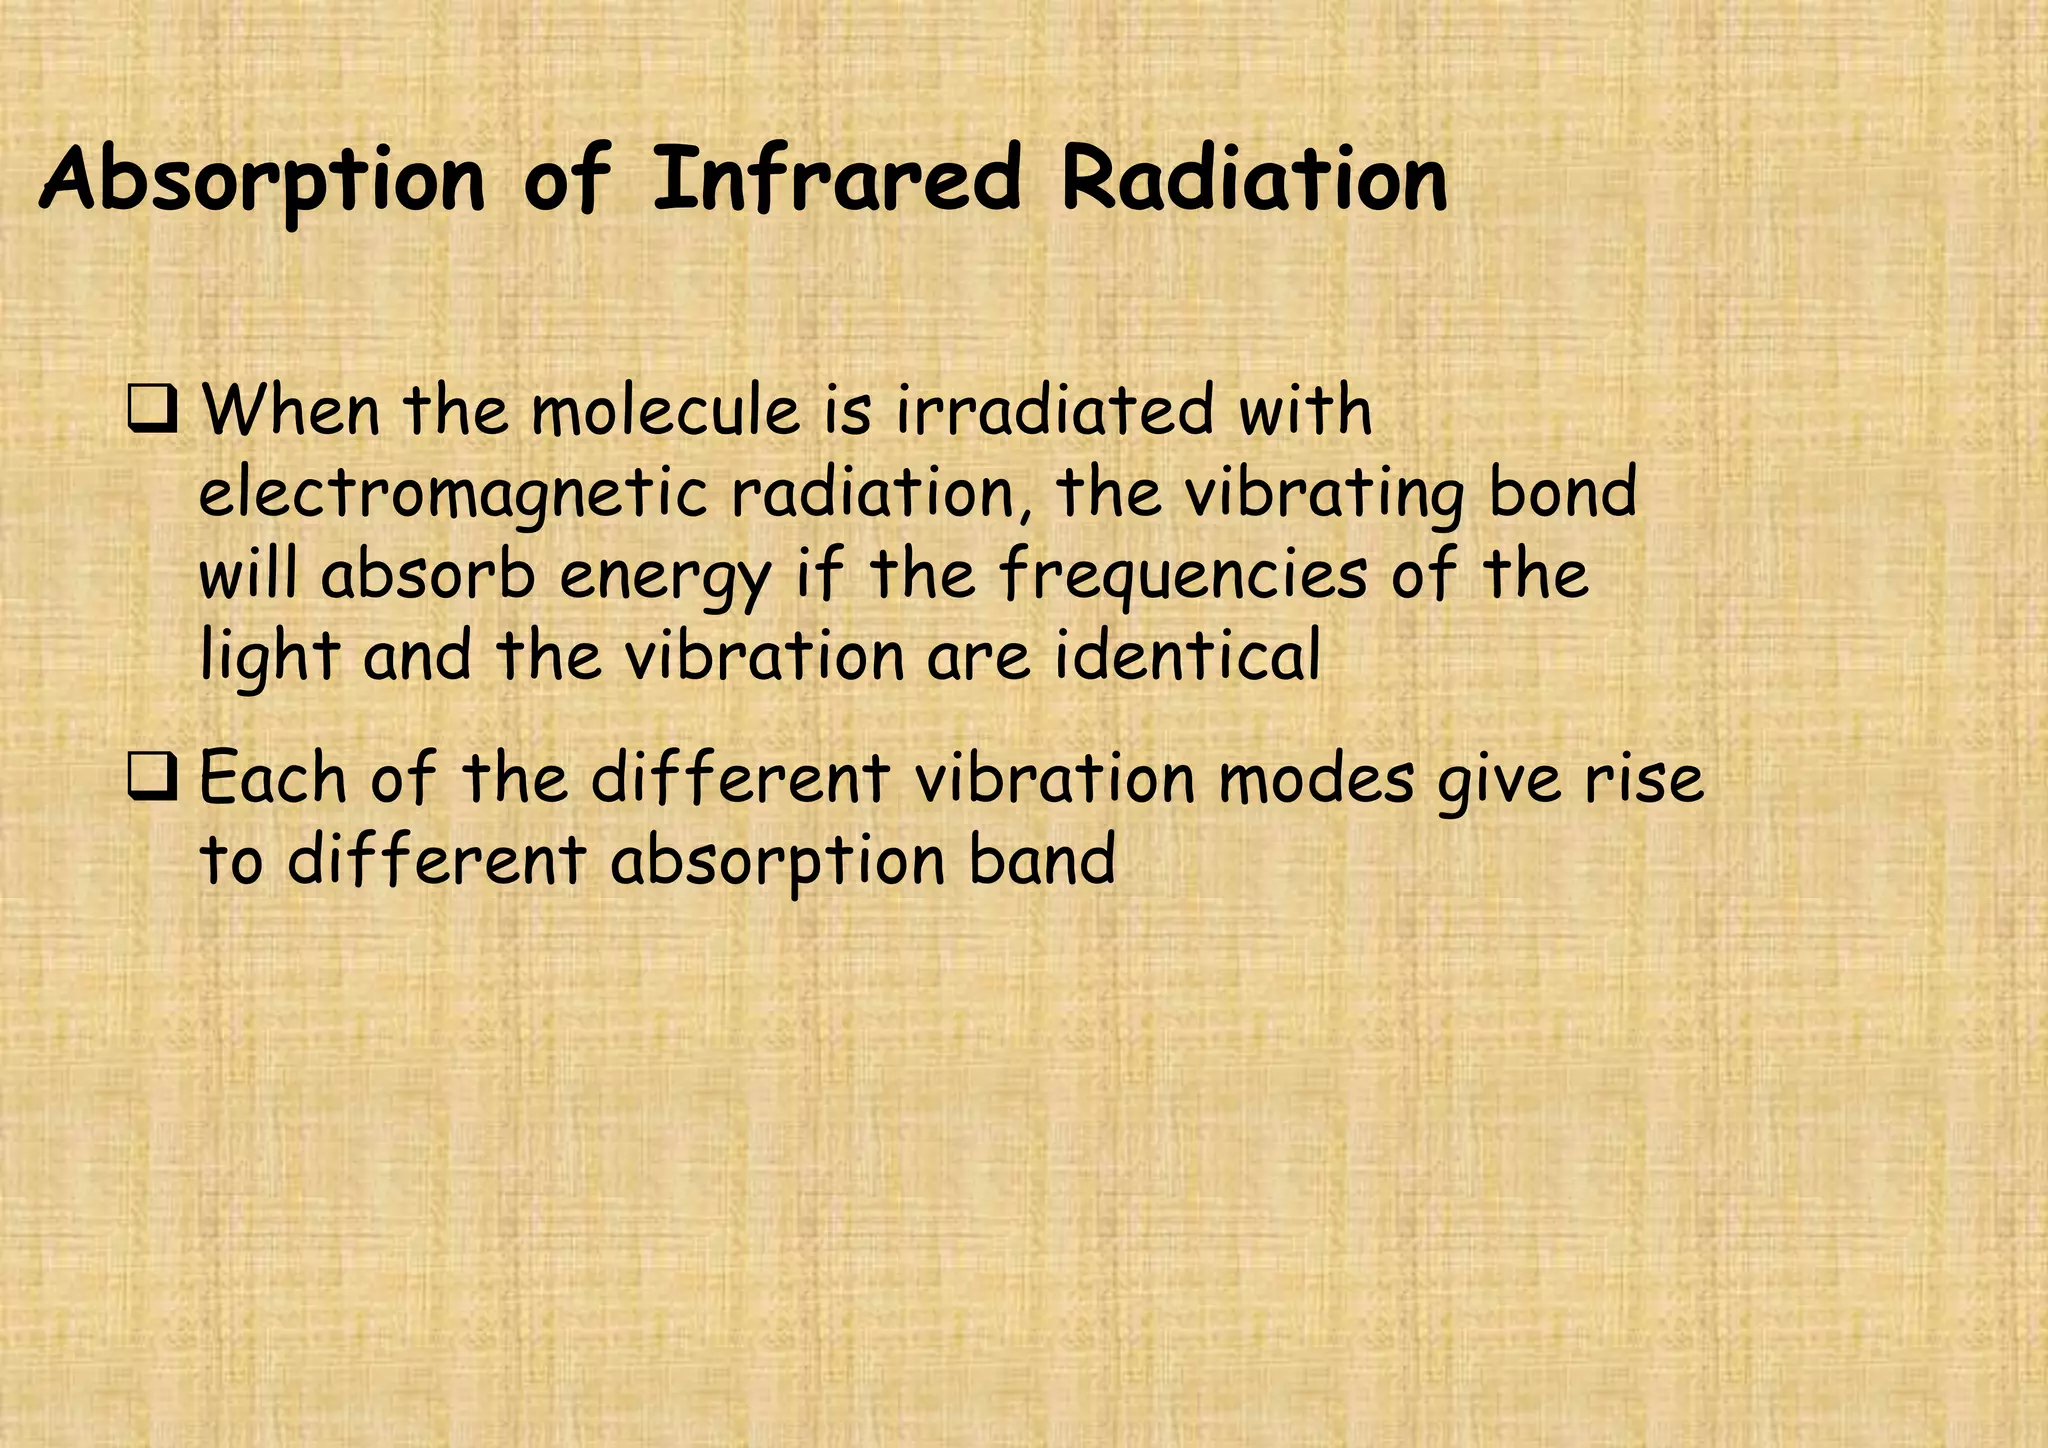
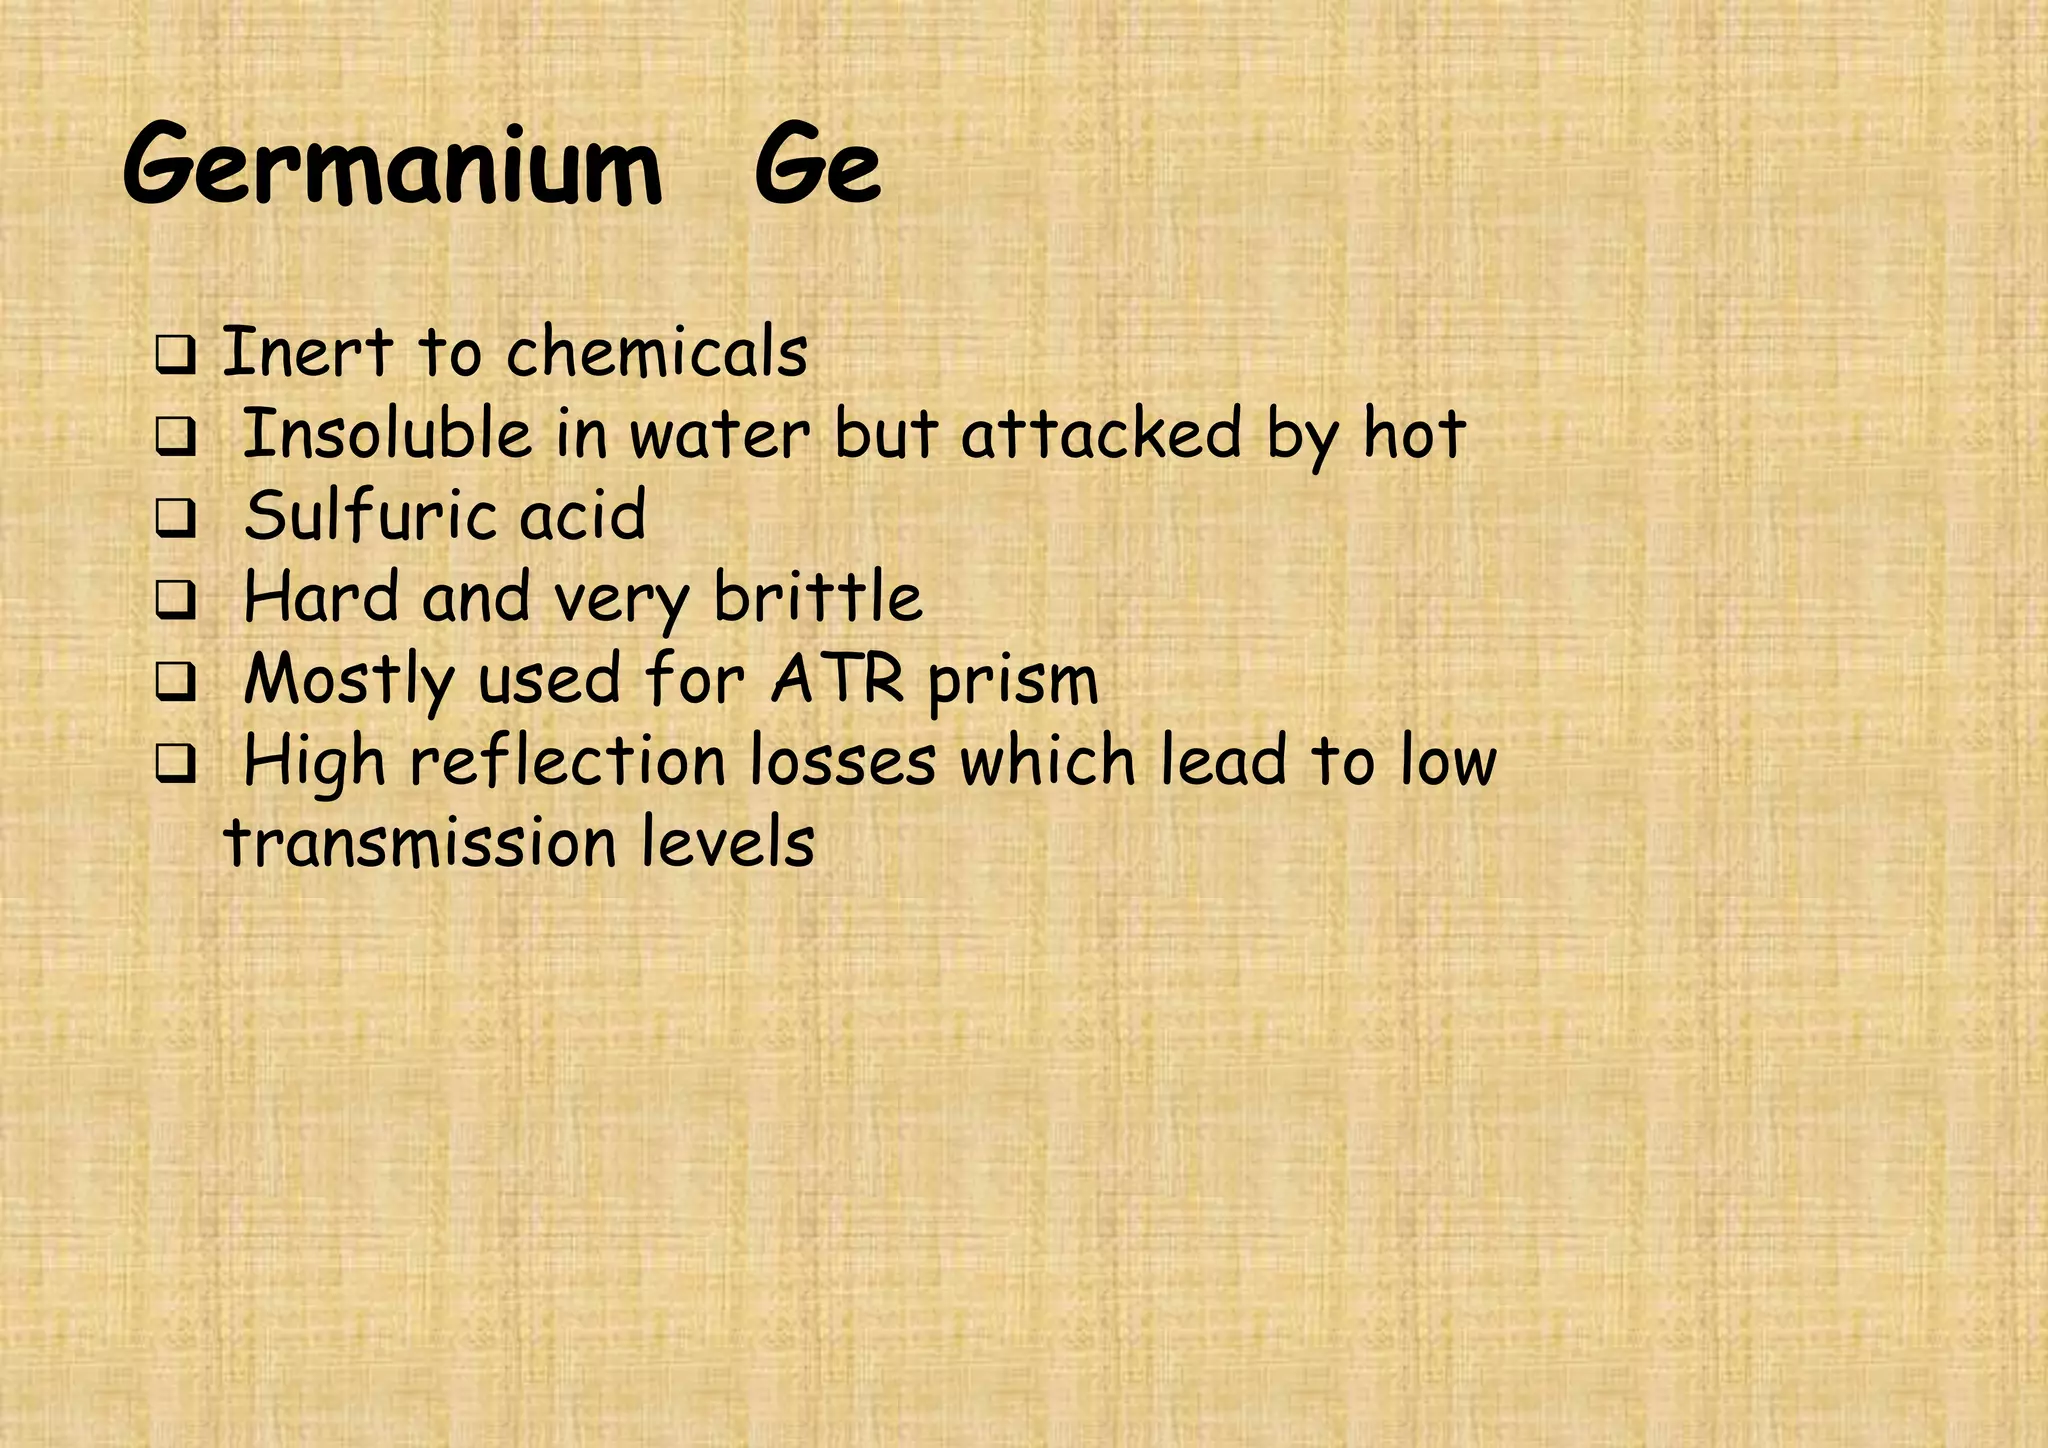
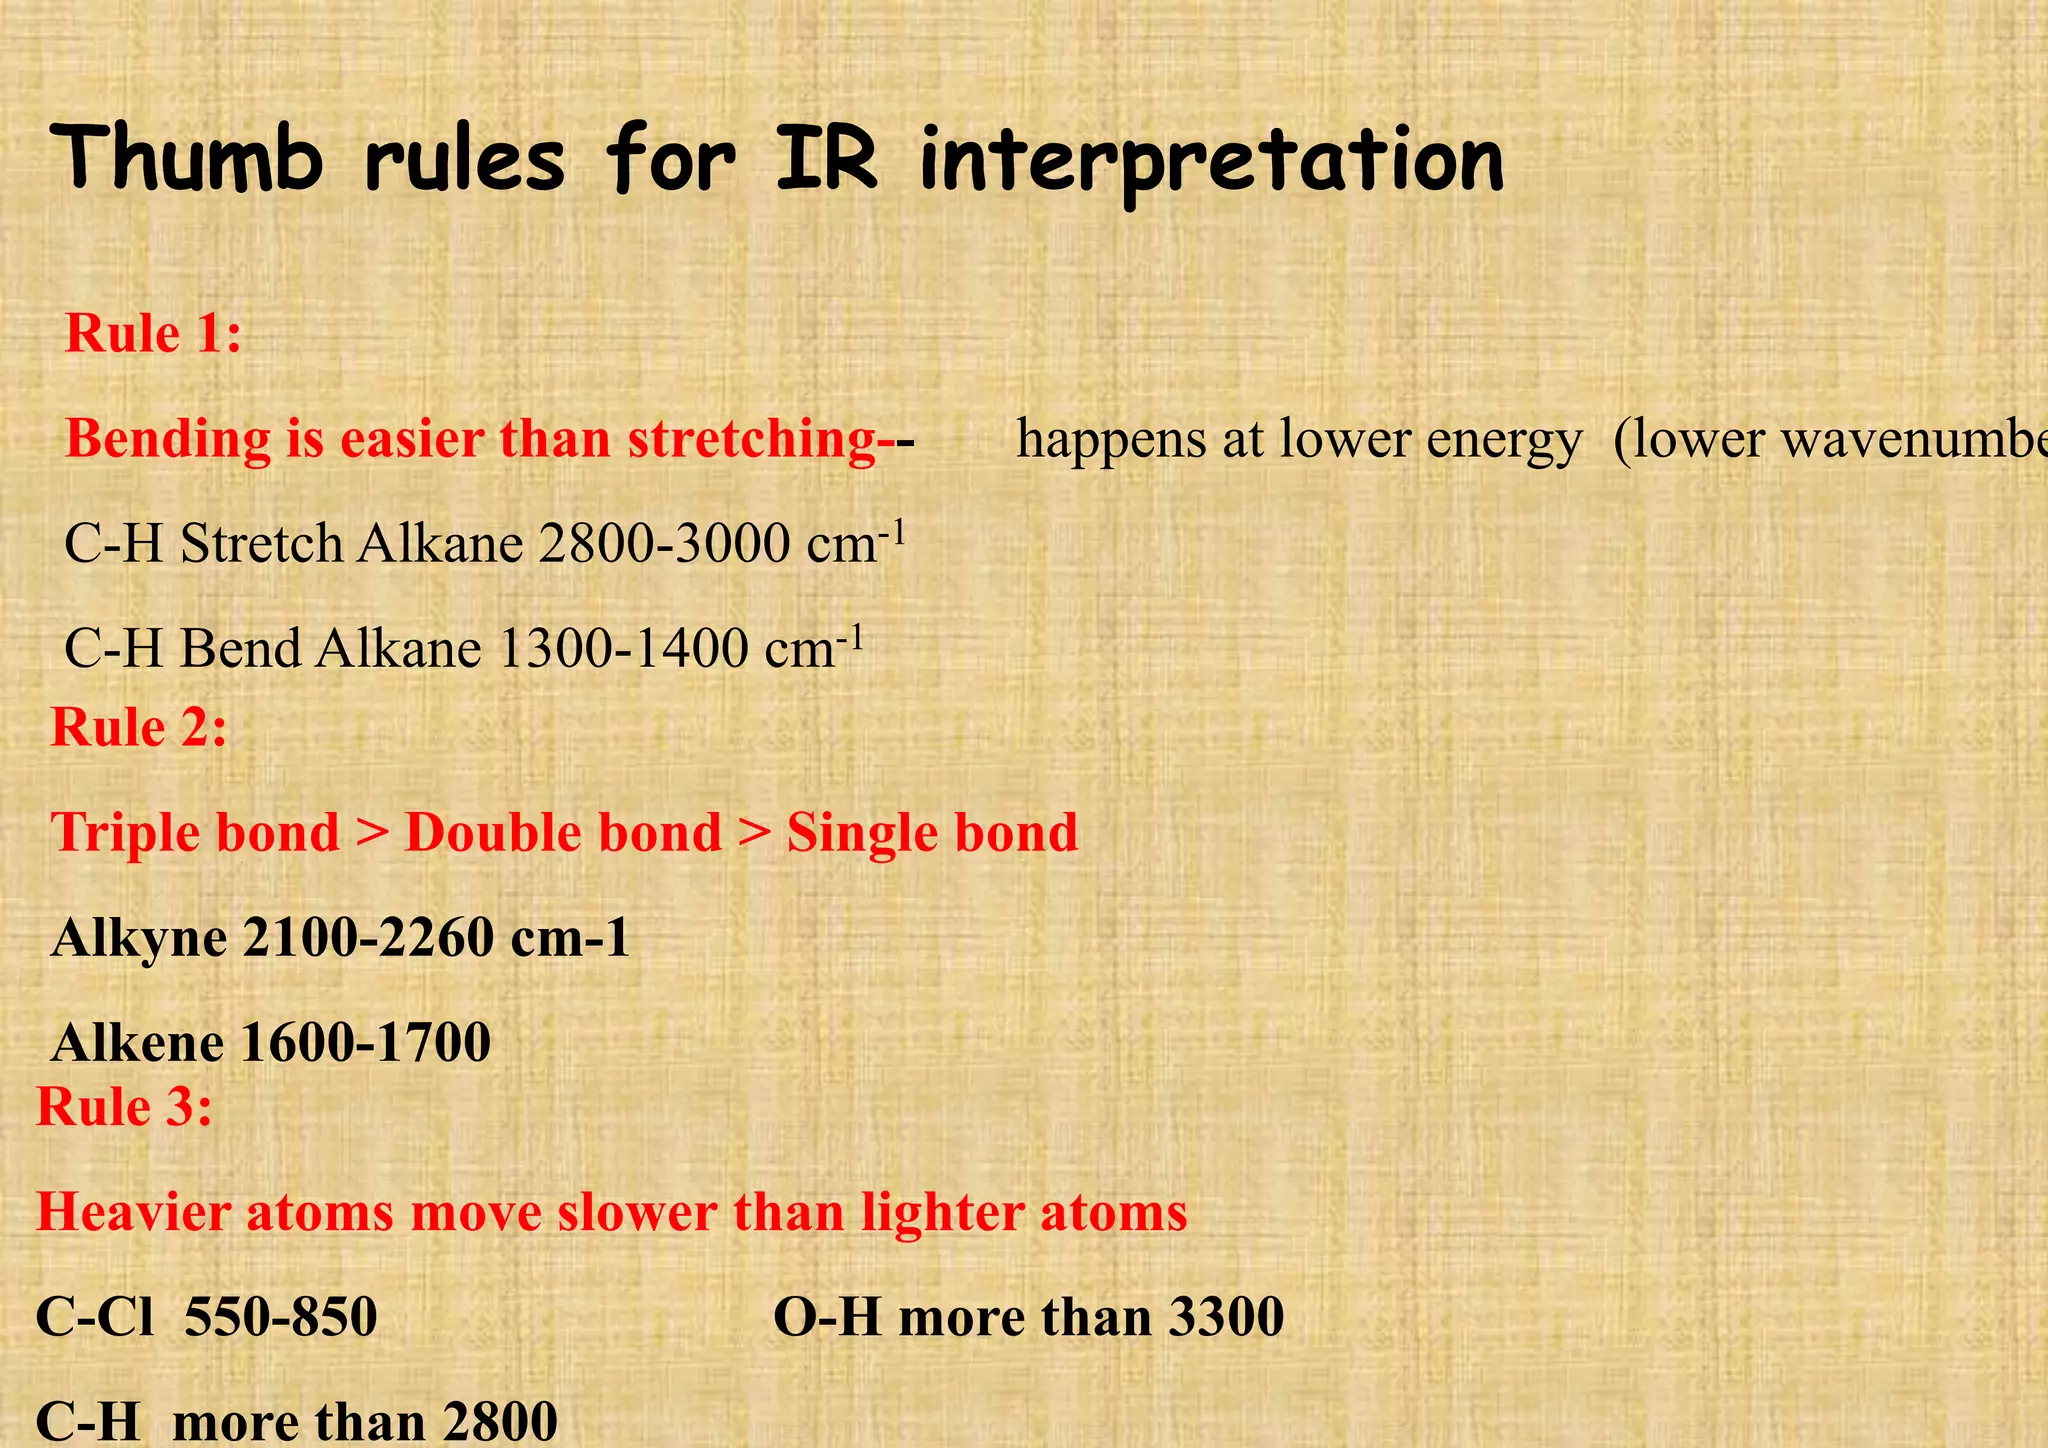
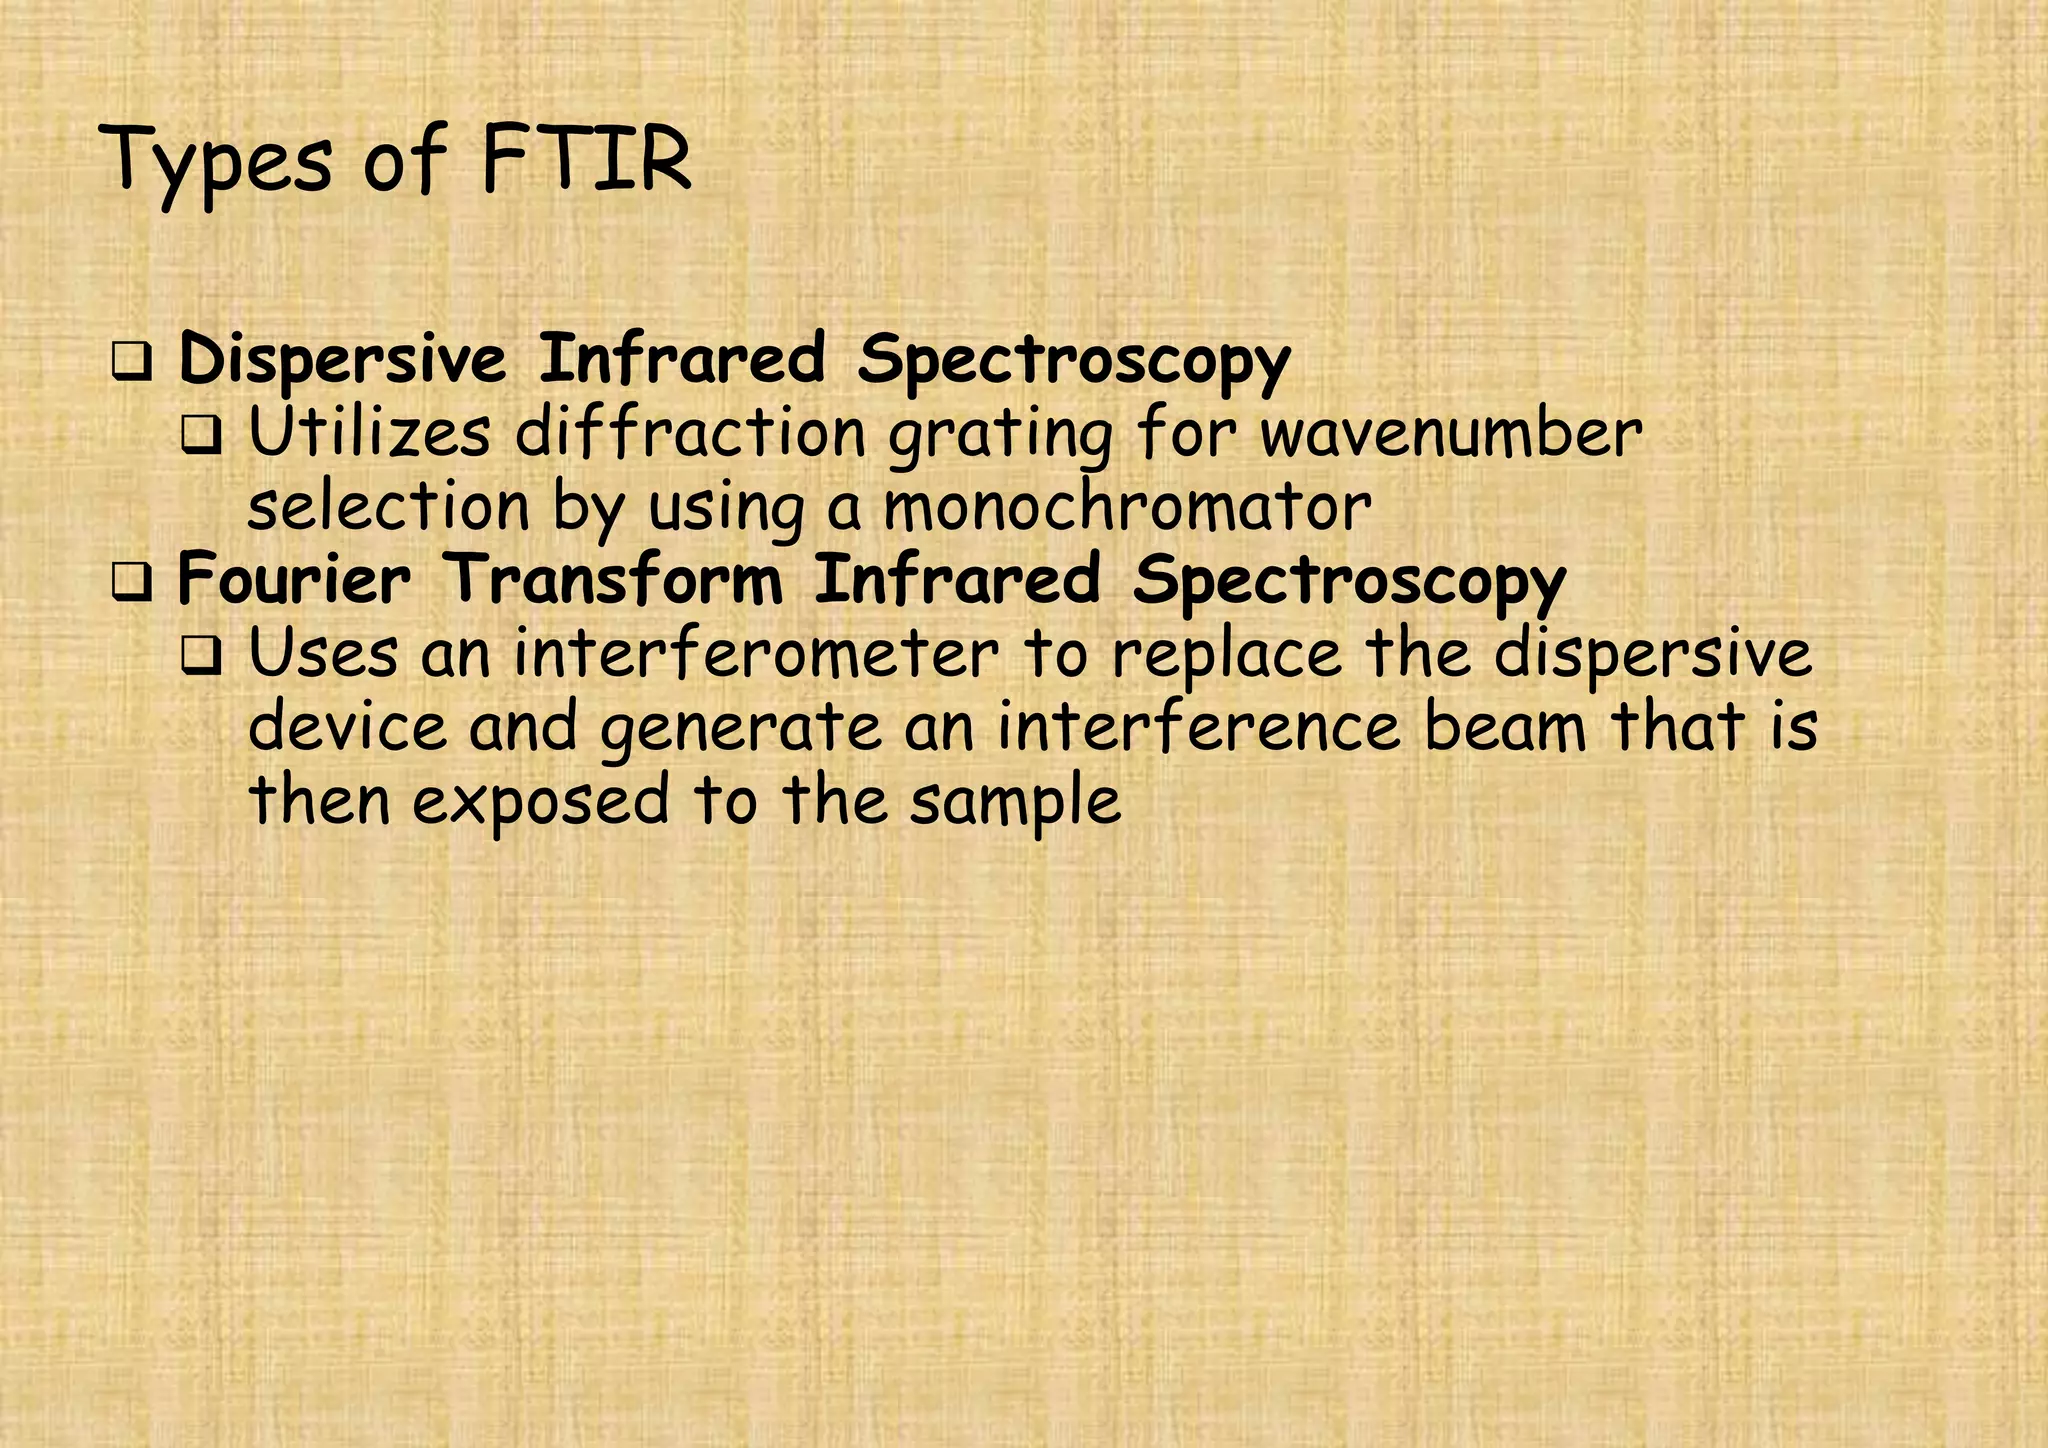
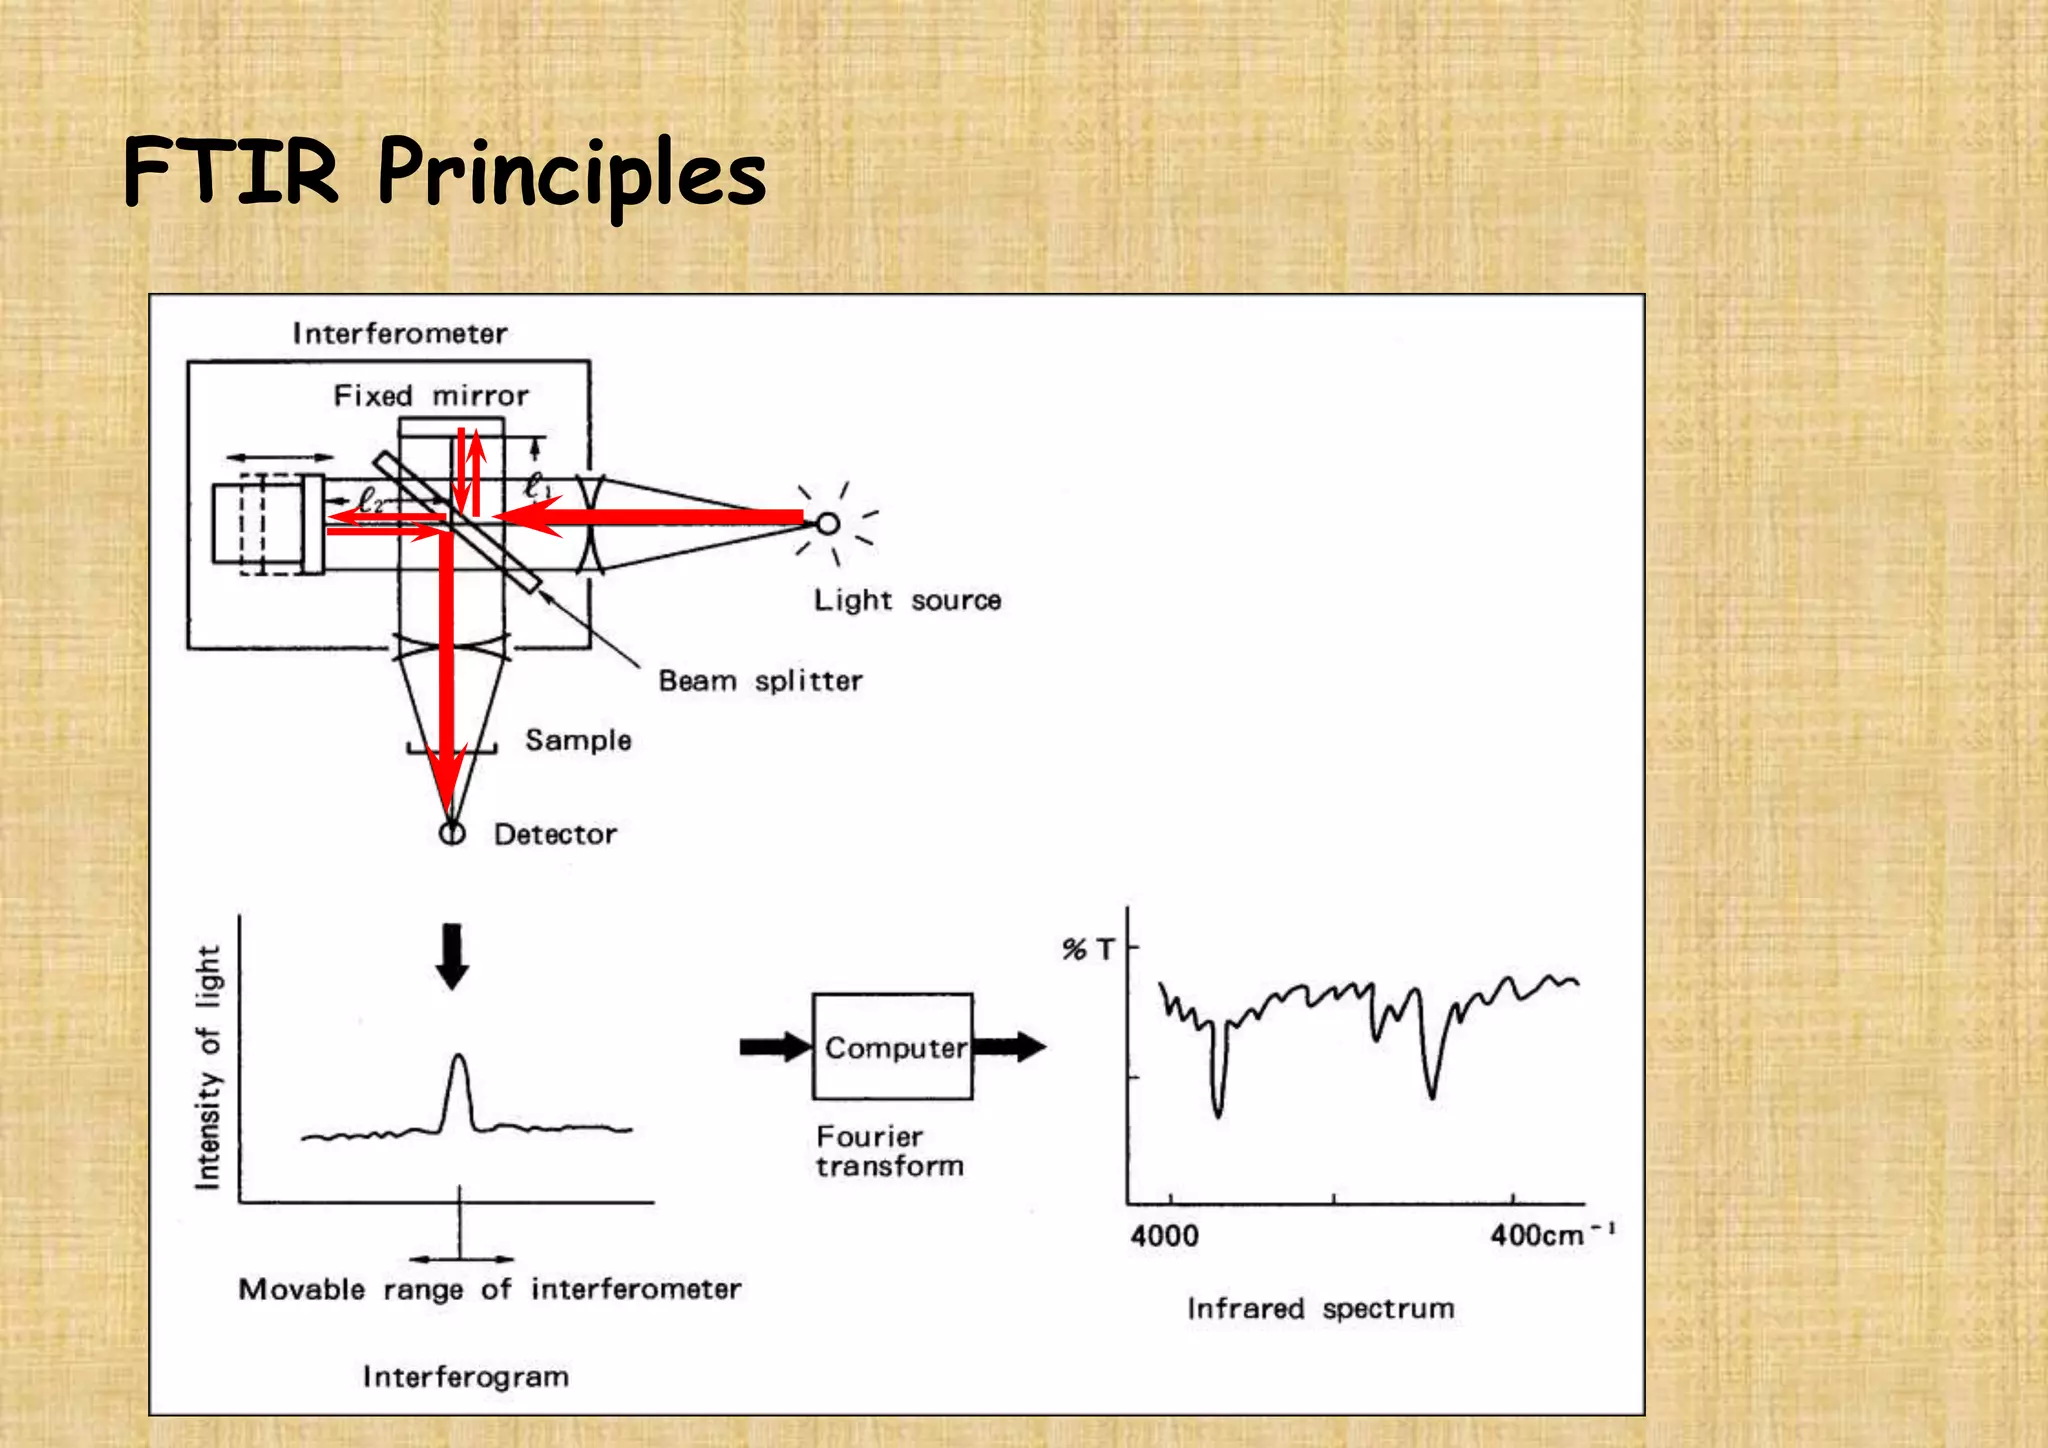
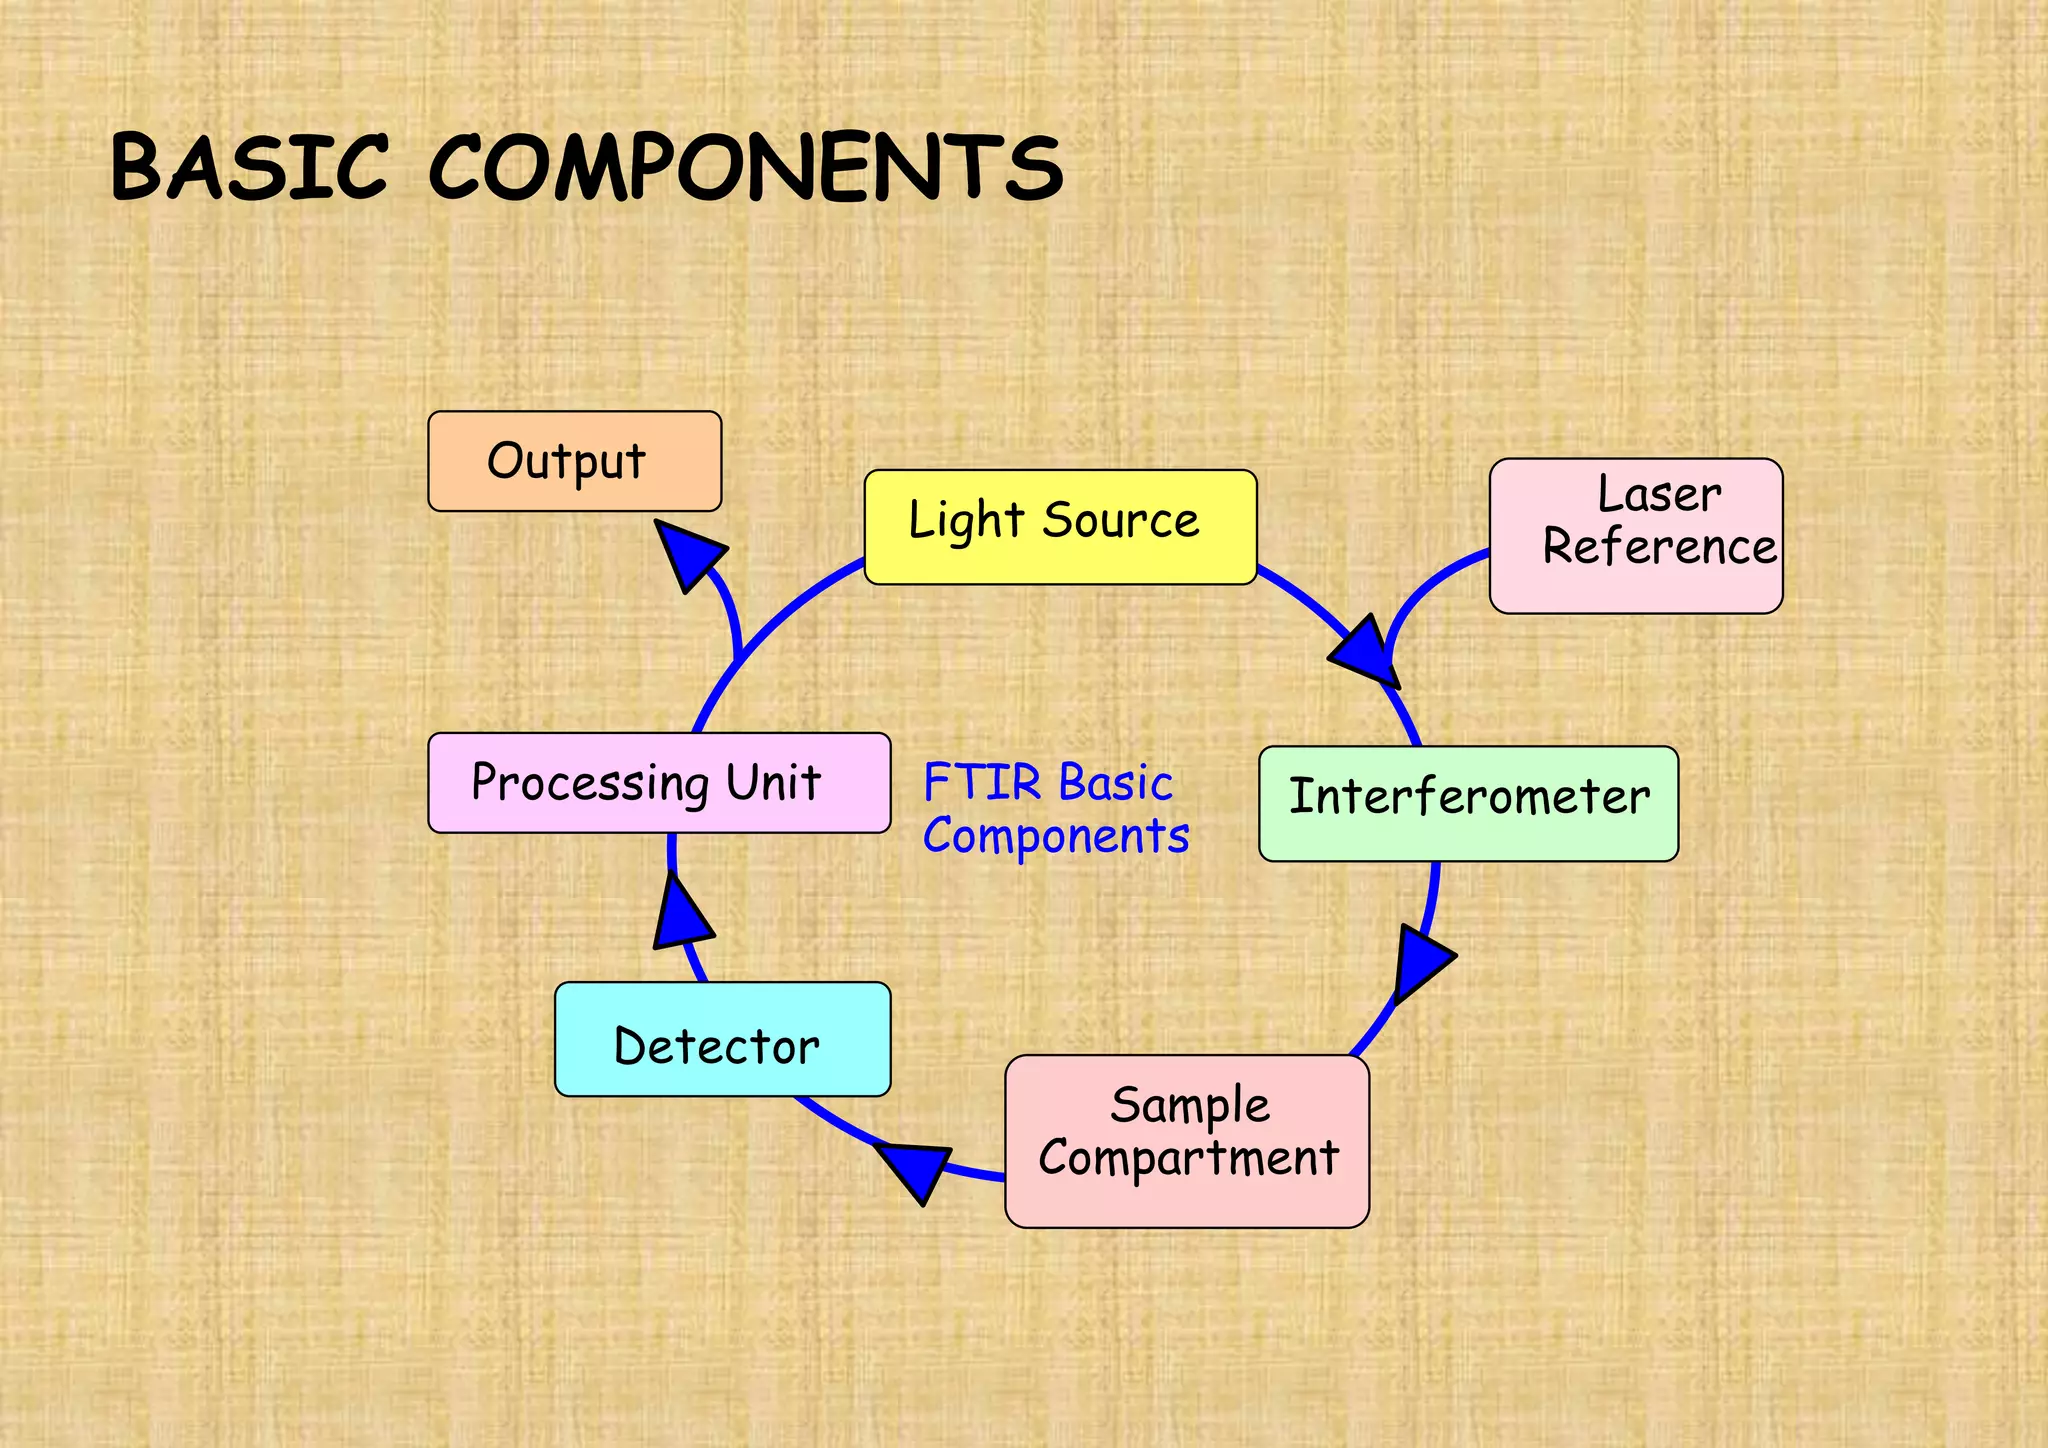
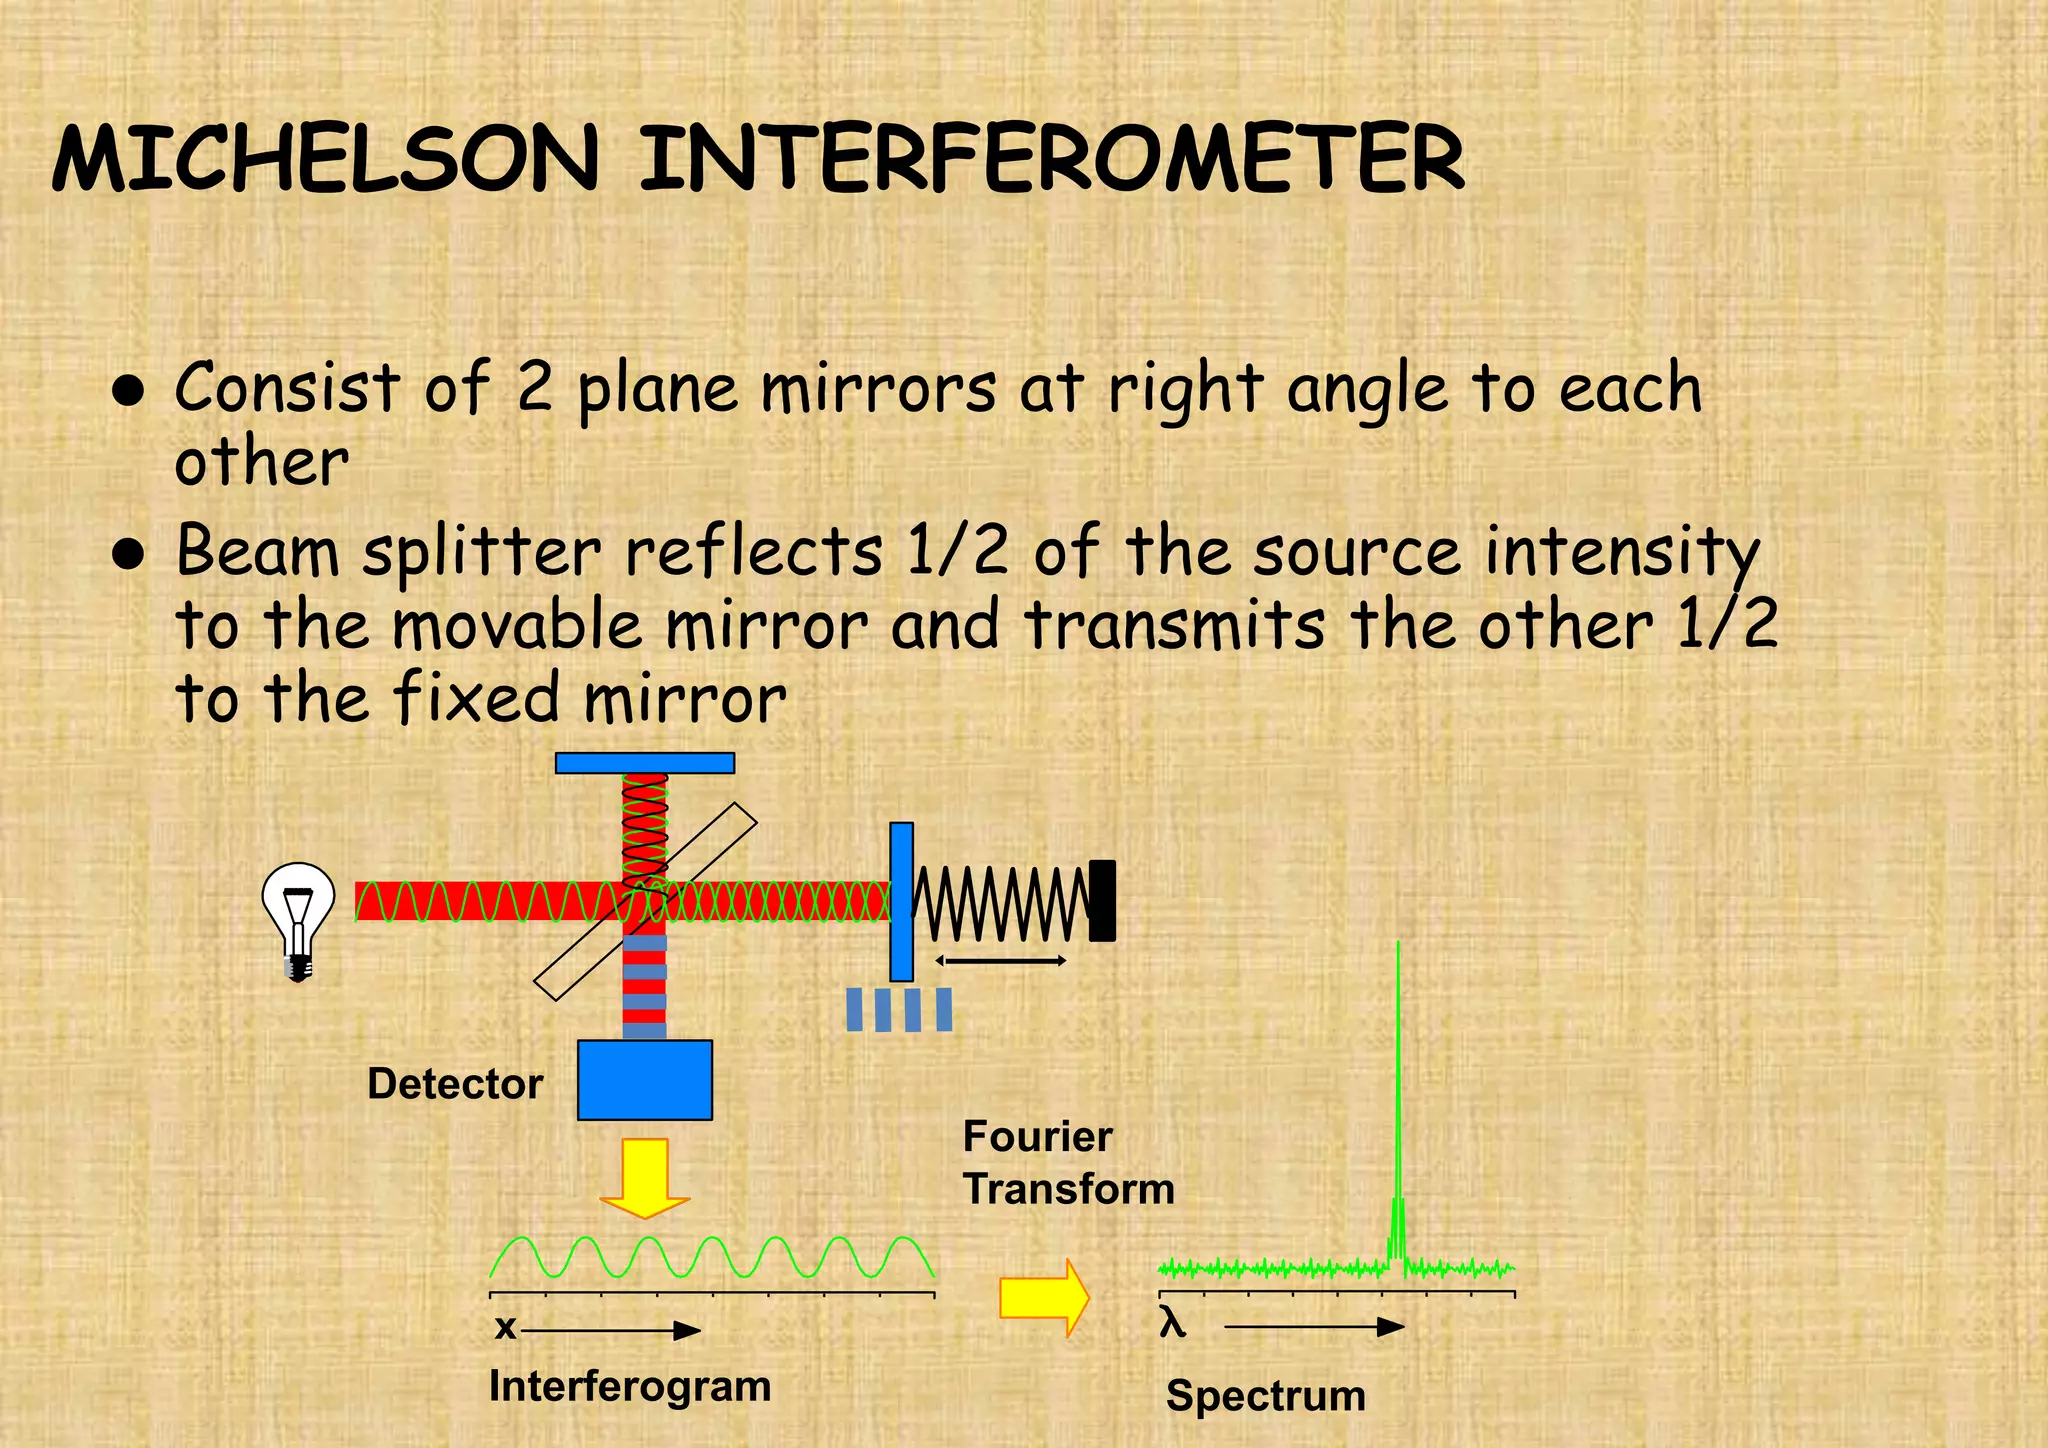
SlideShare a Scribd company logo
FTIR: THEORY, INSTRUMENTATION AND
APPLICATIONS
Dr. Amol Shinde
Shimadzu Analytical India Pvt Ltd
Mob: 8452912856
Email: amolshinde005@gmail.com
PART I:
THEORY
ELECTROMAGNETIC SPECTRUM
UV VIS NIR IR Far IR Microwave
10-5
10-5 10-4 10-3 10-2 10-1
Wavelength (cm)
Energy
0.78 2.5 25 1000Wavelength (mm)
Wavenumber (cm-1) 12,800 4000 400 10
Discovery of Infrared Radiation
William Herschel
1738-1822
German Astronomer
 The infrared radiation was
discovered in 1800.
 Infra = Lower
 Infrared = Lower energy
radiation.
 He observed an invisible radiation
in solar spectrum having lower
energy than red light, by means
of its effect on a thermometer.
 Electromagnetic radiation is an oscillating
electric force field transmitted through
space in the form of a transverse wave
 Responsible for phenomena such as
transmission, absorption, refraction and
reflection
Wave Properties
PROPERTIES OF LIGHT
n = frequency (cycle / second)
0 2 4 6 8 10
-1.0
-0.5
0.0
0.5
1.0
lOne cycle
nl = cA
A = amplitude
c = speed of light (3.0 * 1010 cm / sec)
l = wavelength (nm , μm )
E = Energy (ergs)
h = Planck’s Constant (erg sec)
c = Speed of light (μm/sec)
l = Wavelength (μm)
n = Frequency (cycles/sec)
E = hc/l = hn
ENERGY OF LIGHT
ELECTRONIC TRANSITION
Excited state E1
DE = E1 - E0 = hv
Energy level
Radiatione
Energy difference
DE
Grand state E0
e
 High energy radiation causes
 Electronic transition
 Low energy radiation causes
 Vibrational transition
 Rotational transition
ABSORPTION OF RADIATION
Energy
Vibrational transition
Rotational
transition R
v1
v2
v0
5
4
3
2
1
0
Electronic
transition
E1
E0
v0
v1
v2
E = hn in which h is Planck’s constant (6.626 * 10-34 Joules
and n is the frequency of the radiation
Vibrational motion
•A polyatomic molecule containing N atoms
will have 3N possibilities for motion
•Of these 3N possibilities or degree of
freedom, 3 must be attributed for the
translation of the entire molecule
•The remain 3N – 3 possibilities are for
rotation and internal vibration in the
molecule
•Therefore
3N – 3-2 is for linear molecules
3N – 3-3 is for non-linear molecules
Types of Vibrations
1. Stretching Vibrations
Bond length changes
2. Bending Vibrations
Bond angle changes
Types of Vibrations
 When the molecule is irradiated with
electromagnetic radiation, the vibrating bond
will absorb energy if the frequencies of the
light and the vibration are identical
 Each of the different vibration modes give rise
to different absorption band
Absorption of Infrared Radiation
 A molecule must undergo a net change in
dipole moment as a consequence of
vibrational or rotational motions in order to
absorb infrared radiation
Can all vibrations absorb IR?
 Frequencies fall outside the normal infrared regions
 Vibration does not produce a fluctuating dipole therefore
cannot interact with fluctuating electric fields of the
infrared light
Cl H
N N
Example of Dipole and Dipole movement
• When HCl vibrates, the
dipole (charge separation)
increases
• N2 has no dipole and is
infrared inactive
23
v1
v2
v3
Linear molecule CO2
v1
v2
v3
Non-linear molecule H2O
Only the vibration,which Changes Dipole moment
of molecule, has IR absorption
Can all vibrations absorb IR?
GROUP WAVENUMBERS
 Associated with the movements of a few atoms
 Largely independent of the rest of the
molecule
 Examples: C = O, C - Cl, NH, CH and OH
Fingerprint Region
• Complex region of the infrared spectrum
below 1500 cm-1.
• Functional group region
• Vibrational modes involve many atoms
• Characteristic of the molecule as a whole
Regions of Infrared Spectrum
4000 2500 2000 1500 625
2.5 4 5 7 16
Wavenumber (cm-1)
Wavelength (10-6m)
OVERTONE
 Relatively weak intensity that may not be observed
 Found in high wavenumber regions
 Appear at integer multiples of fundamental vibrations
 Occur at frequency about 2 or 3 times that of the
fundamental lines
 Not very common in mid-infrared spectra of molecules
Infrared Window Materials
 Used for transmission infrared radiation
 Used as a media for powdered samples
 Used as a cell for liquid samples
Consideration of Window Materials
 wavenumber transmission range
 chemical properties of sample and crystal
 physical properties of materials
 cost of materials
Material R.I Transmission
Range (cm-1)
% T
Sodium Chloride 1.49 600-50000 90
Potassium Bromide 1.52 340-40000 90
Calcium Fluoride 1.38 1100-50000 95
KRS-5 2.37 250-16600 70
Germanium 4.0 660-5500 50
Silica/Quartz 1.42 2500-50000 85
Diamond 2.38 125-40000 70
Characteristics of Window Materials
Sodium Chloride NaCl
 Widely used material for infrared cell windows
 Relatively the lowest cost
 Wide transmission range
 Low reflection losses
 Soluble in water and glycerine
 Slightly soluble in alcohol
 Hygroscopic, thus fog easily
Potassium Bromide KBr
 Most widely used window material
 Good resistance to thermal and mechanical shock.
 Wider transmission range
 Dissolve readily in water, glycerine and
 Alcohol
 More hygroscopic than sodium chloride
 Scratches and deforms much readily than
 sodium chloride
Calcium Fluoride CaF2
 Insoluble in water
 Useful for aqueous and deuterium oxide
solutions analysis
 Good resistance to most acids and alkalis but is
attacked by ammonium salts
 Hard , and hence high mechanical strength
 Limited transmission range
 KRS-5 (Thallium Bromide/ Iodide)
 Difficult to dissolve in water
 Attacked by aqueous solutions of high pH and
solutions of phosphates
 Toxic, usually only harmful if absorbed through a
cut or ingested
 Widely used as an internal reflection plate in ATR
 Difficult to polish
Germanium Ge
 Inert to chemicals
 Insoluble in water but attacked by hot
 Sulfuric acid
 Hard and very brittle
 Mostly used for ATR prism
 High reflection losses which lead to low
transmission levels
Quartz/ Silica
 Commonly used for near infrared region
 Very resistant material
 Soluble in hydrofluoric acid and slightly soluble in
alkalis
 Three types namely, natural, ultraviolet and
infrared grade
Diamond
 Hardest window material used in infrared
spectroscopy
 Superior physical and chemical properties
 Mostly used for ATR reflector plate for
intractable samples
 Extremely expensive
 Having IR absorption 3000~1500cm-1
Thumb rules for IR interpretation
Rule 1:
Bending is easier than stretching-- happens at lower energy (lower wavenumbe
C-H Stretch Alkane 2800-3000 cm-1
C-H Bend Alkane 1300-1400 cm-1
Rule 3:
Heavier atoms move slower than lighter atoms
C-Cl 550-850 O-H more than 3300
C-H more than 2800
Rule 2:
Triple bond ˃ Double bond ˃ Single bond
Alkyne 2100-2260 cm-1
Alkene 1600-1700
PART II:
INSTRUMENTATION
Types of FTIR
 Dispersive Infrared Spectroscopy
 Utilizes diffraction grating for wavenumber
selection by using a monochromator
 Fourier Transform Infrared Spectroscopy
 Uses an interferometer to replace the dispersive
device and generate an interference beam that is
then exposed to the sample
FTIR Principles
Interference Phenomenon
Bright zone
Dark zone
X=0 X=2x1.25=2.5µ
A)Fixed mirror
Light reflected
by
B)Movable mirror
X=2(l1-l2)=0
C)Movable mirror
X=2 (l1-l2)=1.25µm
2.5μm
1.25µm
2.5μm of monochromatic light
5μm of monochromatic light
Interference Phenomenon
Interferogram
Each wavelength
Addition
Background spectrum
CO2
H2O
H2O
Michelson interferometer
Interferogram
Fourier
transformed
Air
Polystyrene film
S/B
Infrared spectrum
Power
spectrum
(1768-1830)
HOW FTIR WORKS
BASIC COMPONENTS
Light Source
Interferometer
Sample
Compartment
Detector
Processing Unit
Output
FTIR Basic
Components
Laser
Reference
INFRARED LIGHT SOURCE
 Infrared source consist of inert solid which is
heated electrically to temperature 1500 ~ 2000oK
 The continuous radiation which is emitted
resembles that of black body radiation
MICHELSON INTERFEROMETER
 Consist of 2 plane mirrors at right angle to each
other
 Beam splitter reflects 1/2 of the source intensity
to the movable mirror and transmits the other 1/2
to the fixed mirror
Spectrum
Fourier
Transform
Interferogram
Detector
TYPES OF INFRARED DETECTOR
 Thermocouples detector
 Pyro-electric detector (DLATGS, TGS, etc)
 MCT detector (Mercury Cadmium Tellurium)
Temperature controlled DLATGS detector
 High sensitivity deuterated L-alanine triglycine
sulfate detector (DLATGS)
 Maintain instrument temperature below
detector curie point (61oC)
 Detector is doped with L-alanine so that
electrical field is automatically re-poled when
temperature exceeding curie point
Advantages of Pyroelectric detector
 Excellent S/N ratio
 Stable
 Fast response
 Wide range
MCT DETECTOR
 High sensitivity
 Faster response
 Necessary to cool by LN2
 Narrow band
Advantages of FTIR Vs Dispersive
 Multiplex advantage (Fellgett)
Scans all wavenumbers at a time
 Aperture advantage (Jacquinot)
No dispersive elements, so high throughput
 Laser reference advantage (Connes)
Internal wavelength calibration
 Application advantage
High speed and sensitive measurement
possible
Hinges using film
(4 positions)
Linkage part
Top plate (fixed)
Dynamic Alignment System
Processing circuit
He-Ne laser
Beam
splitter
Piezo actuator
Fixed mirror
Movable mirror
Sampling
circuit for
interference
condition
determination
Sensor B
Sensor A
Light source
Sample compartment
FJS system
Processing circuit
Flexible Joint
Support
Dynamic Alignment System
 Laser light passing through the interferometer is
detected by photodiodes
 Signals are generated
 Difference between the result and optimum
interference condition is calculated
 Result is fed back to the interferometer
 The difference is eliminated by the use of a piezo
actuator
ADVANTAGES
 Stable and prompt measurement is achieved
through dynamic alignment mechanism
 To ensure that alignment of the optics is
accurate
 Energy is stabilized in short time
PIEZO ACTUATOR
Power amplifier
Piezo actuator
Fixed mirror
Contracts or releases to
tilt the angle of the
fixed mirror for optimal
interference
Data Manipulations
 Peak table generation
 Baseline correction
 Smoothing
 Normalization
 Deconvolution
 Derivative calculations
 JCAMP & ASCII file
conversions
 Film Thickness
 Purity check algorithm
 Peak ratio calculations
 Spectrum subtraction
 Data conversion
calculations:
 Kubelka-Munk
 Kramers-Kronig
 ATR Correction
PART III:
APPLICATIONS
Deciding Factors
 Physical nature of the sample
 Type of information of the sample
 Limitation of a technique
• What is the objective of the analysis
• Background information of the sample
• Solubility of the sample
• Hardness of the sample
• Degradation of polymers
• Reactivity
What information one should have?
Transmission techniques
1. Potassium Bromide (KBr) pellet method
1. Liquid film method
2. Film method
3. Nujol method (very thick suspension)
1. Attenuated total reflectance (ATR)
2. Diffuse reflectance (DRS)
3. Specular reflectance
4. Reflection Absorption Spectroscopy
5. Micro sampling techniques
Reflection techniques
KBR pellet method
 Popular method for measuring powdered samples
 Suitable for hard and brittle polymers
 Polymer in the form of small particles dispersed
in a disc of potassium bromide
Hydraulic Press and Evacuable Die
 KBr discs are prepared by grinding the polymer
sample (2mg) with KBr (100-200 mg) and
compressing the whole into a transparent disc
 A good spectrum will depend on whether the
sample is finely grind
 Compression to a cohesive disc is done by using
an evacuable die
 13mm in diameter
Hydraulic Press and Evacuable Die
Mini-Hand Press
 3mm diameter KBr pellet with briquetting frame
 Hand-driven press
 Small amount of sample
 Simple and quick
Hydraulic Press Mini-hand Press
13mm in diameter KBr
pellet
3mm in diameter KBr
pellet with briquetting
frame
With hydraulic press and
vacuum pump
Hand-driven press
Takes longer time Simple and quick
High through put Low through put but
enough for FTIR
To be able to keep in
desiccator
Make each measurement
Hydraulic Press vs. Mini-Hand Press
Caffeine powder
Mini-hand Press, KBr pellet method
4cm-1, 45scans
LIQUID FILM METHOD
1. Demountable cell
2. Sealed liquid cell
3. Fixed thickness cell
Demountable cell
 Qualitative analysis only
 Non-volatile liquid and paste
 Use spacer of 0.025 mm ~ 0.1 mm (25 µm to 100 µm )
thickness for low absorption liquid
 No spacer is needed for high absorption liquid
Demountable cell
Sealed liquid cell
 Qualitative and quantitative analysis
 Volatile and Non-volatile liquid
 Use spacer of 0.025 mm ~ 0.5 mm (25 µm to 500
µm ) thickness for low absorption liquid
 THREE CRITERIAN FOR SOLVENT
1. Sample must be soluble or miscible with the solvent
2. Solvent must not have absorption bands in the region of
interest
3. Diluent must not react with the sample
Sealed liquid cell
Fixed Thickness Cell
 For quantitative measurement of liquid or volatile
samples
 3 types of cell window
NaCl, KBr, KRS-5
 Thickness
0.025mm ~ 5.0mm
Gas cells
 For quantitative measurement of gas samples
 5 cm and 10 cm pathlength.
Long Pathlength Gas cells
 Measurement of low concentration of gas samples
 1 meter and 2 meter is the pathlength
 MCT detector is used
Microsample measurement
1. Reflection type beam condenser
2. Single reflection ATR
3. IR Microscope
Reflection Beam Condenser
Can be used to measure
liquid of 2-3 µL
IR Spectra of polyester fibre with RBS 8000
Reflection Beam Condenser
ATR measurement
 The sample is held in contact with a prism made of highly refractive index
material which transmits infrared rays.
 The incident angle of IR beam is larger than the critical angle hence the IR
beam is totally reflected by the interface between sample and the prism.
Principle of ATR Measurement
Long wavelength penetrate deeper
Lower critical angle , more penetration
Penetration depth calculation
Example of penetration depth
Characteristic of Prisms
Transparency,
hardest
Insoluble2.3840000~650Diamond
Yellow, hardInsoluble2.420000~650ZnSe
Silver, fragileInsoluble4.05000~700Ge
Orange, soft,
poisonous
Practically
insoluble
2.3720000~290KRS-5
CharacteristicsSolubility in
water
Refractive
index
Wavenumber
range (cm-1)
Material
Effect of sample contact
ATR spectra of polystyrene at different clamping power
Effect of Wavelength
1.27μm1.66μm2.78μm5.03μm25μm(400cm-1
)
0.51μm0.66μm1.11μm2.01μm10μm(1000cm-1
)
0.25μm0.33μm0.56μm0.66μm5.0μm(2000cm-1
)
0.13μm0.17μm0.28μm0.50μm2.5μm(4000cm-1
)
60º45º60º45°Wavelength
(Wavenumber)
Incident angleIncident angle
Ge (n=4.0)KRS-5, ZnSe &
Diamond (n=2.4)
Effect of Wavelength
Acrylonitrile-butadiene rubber containing carbon black as
a reinforcement
3000 1500 400
KRS-5
Ge
Incident angle = 45o
Effect of R.I of prism
Anomalous
dispersion of
refractive index
Multiple reflection ATR
Vertical Variable Angle ATR
By varying the incident angle of IR rays, the sample
profile can be studied
ATR 8000
Why Diamond ATR?
Diamond ATR makes up for all of the limitations of ATR
while maintaining all of the advantages
 100X reduction in ATR element size allows intimate
contact with samples and greatly reduces samples by
requirement
 Mechanical strength of the diamond ATR element
allows for compression of the sample for intimate
contact
 Resistant to all corrosive and abrasive solvents and
samples
 Cleans up easily because of the low friction
coefficient of diamond
DIAMOND ATR
DIAMOND ATR
1reflection Diamond ATR
DuraSamplIR
1 reflection Diamond prism1 reflection Diamond prism
contact size : about 1.5mm in diameter
Sample pressure device
Diffuse Reflectance
DRS method is applicable to almost all samples that can
be pulverized.
Sample preparation is easy
Specular
reflectance
lightDiffuse
reflectance light
Incident light
Diffuse Reflectance
To minimize the specular reflectance
 Grind the sample and KBr to fine particle
 Dilute the sample to 1~5% of KBr powder
 Do not press the sample surface
Diffuse Reflectance Measurement
DRS 8000
Diffuse Reflectance Measurement
SiC sandpaper disk
Sample
 SiC sampler is effective in sampling sample from large
forming and plastic products.
 Holder can be directly attached to DRS
 Emery paper is used as blank
mirror
sample
MCT
CCD
TRANSMISSION REFLECTION
ATR Objective mirror
1. Cone type prism
2. 45 degree angle
3. 15x magnification
4. Slide on for visible measurement and ATR
Measurement
Microvise holder
Used to hold film samples
Diamond Compression Cell
Trans.
Spectra of single yarn before and after compression
20um
Before
After
Diamond Compression Cell
Microscopy modes:
 Reflectance mode (surface contaminants)
1. Reference material
2. Gold mirror
3. Aluminum coated mirror
4. Aluminum foil
 Transmission mode (film, fibers)
1. Diamond cell can be used to compress the sample
for transmittance measurement
2. Put small sample on a BaF2 window
Ftir theory and applications

More Related Content

What's hot

INDUCTIVELY COUPLED PLASMA -ATOMIC EMISSION SPECTROSCOPY
INDUCTIVELY COUPLED PLASMA -ATOMIC EMISSION SPECTROSCOPYINDUCTIVELY COUPLED PLASMA -ATOMIC EMISSION SPECTROSCOPY
INDUCTIVELY COUPLED PLASMA -ATOMIC EMISSION SPECTROSCOPY
Parimi Anuradha
 
XRF Theory and Application
XRF Theory and ApplicationXRF Theory and Application
XRF Theory and Application
Sirwan Hasan
 
Basics of spectroscopy
Basics of spectroscopyBasics of spectroscopy
Basics of spectroscopy
Jenson Samraj
 
FOURIER -TRANSFORM INFRARED SPECTROMETER [FTIR]
FOURIER -TRANSFORM INFRARED SPECTROMETER [FTIR]	FOURIER -TRANSFORM INFRARED SPECTROMETER [FTIR]
FOURIER -TRANSFORM INFRARED SPECTROMETER [FTIR]
Sagar Savale
 
Basic introduction of FTIR
Basic introduction of FTIRBasic introduction of FTIR
Basic introduction of FTIR
jitesh yadav
 
X ray spectroscopy. ppt
X ray spectroscopy. ppt X ray spectroscopy. ppt
X ray spectroscopy. ppt
AkankshaBehl3
 
Thermogravimetric analysis ppt
Thermogravimetric analysis pptThermogravimetric analysis ppt
Thermogravimetric analysis ppt
yudhishthir singh
 
Fourier transform infrared spectroscopy
Fourier transform infrared spectroscopyFourier transform infrared spectroscopy
Fourier transform infrared spectroscopyGaurav Yogesh
 
Infrared Spectroscopy (IR)
Infrared Spectroscopy (IR)Infrared Spectroscopy (IR)
Infrared Spectroscopy (IR)
Mona Ismail
 
Dispersive ir spectrophotometer
Dispersive ir spectrophotometerDispersive ir spectrophotometer
Dispersive ir spectrophotometer
HimaniPeshavaria
 
Atomic emission spectroscopy PPT
Atomic emission spectroscopy PPTAtomic emission spectroscopy PPT
Atomic emission spectroscopy PPT
HumnaMehmood
 
Flame emission & atomic absorption spectroscopy
Flame emission & atomic absorption spectroscopyFlame emission & atomic absorption spectroscopy
Flame emission & atomic absorption spectroscopy
Himal Barakoti
 
Differential thermal analysis - instrumental methods of analysis
Differential thermal analysis - instrumental methods of analysis Differential thermal analysis - instrumental methods of analysis
Differential thermal analysis - instrumental methods of analysis
SIVASWAROOP YARASI
 
Atomic absorption spectroscopy
Atomic absorption spectroscopyAtomic absorption spectroscopy
Atomic absorption spectroscopyChetan Sharma
 
FOURIER TRANSFORM - INFRARED SPECTROSCOPY
FOURIER TRANSFORM - INFRARED SPECTROSCOPYFOURIER TRANSFORM - INFRARED SPECTROSCOPY
FOURIER TRANSFORM - INFRARED SPECTROSCOPY
SalmanLatif14
 
Introduction to molecular spectroscopy
Introduction to molecular spectroscopyIntroduction to molecular spectroscopy
Introduction to molecular spectroscopy
Neel Kamal Kalita
 

What's hot (20)

INDUCTIVELY COUPLED PLASMA -ATOMIC EMISSION SPECTROSCOPY
INDUCTIVELY COUPLED PLASMA -ATOMIC EMISSION SPECTROSCOPYINDUCTIVELY COUPLED PLASMA -ATOMIC EMISSION SPECTROSCOPY
INDUCTIVELY COUPLED PLASMA -ATOMIC EMISSION SPECTROSCOPY
 
XRF Theory and Application
XRF Theory and ApplicationXRF Theory and Application
XRF Theory and Application
 
Basics of spectroscopy
Basics of spectroscopyBasics of spectroscopy
Basics of spectroscopy
 
FTIR
FTIRFTIR
FTIR
 
FOURIER -TRANSFORM INFRARED SPECTROMETER [FTIR]
FOURIER -TRANSFORM INFRARED SPECTROMETER [FTIR]	FOURIER -TRANSFORM INFRARED SPECTROMETER [FTIR]
FOURIER -TRANSFORM INFRARED SPECTROMETER [FTIR]
 
Basic introduction of FTIR
Basic introduction of FTIRBasic introduction of FTIR
Basic introduction of FTIR
 
X ray spectroscopy. ppt
X ray spectroscopy. ppt X ray spectroscopy. ppt
X ray spectroscopy. ppt
 
Thermogravimetric analysis ppt
Thermogravimetric analysis pptThermogravimetric analysis ppt
Thermogravimetric analysis ppt
 
Fourier transform infrared spectroscopy
Fourier transform infrared spectroscopyFourier transform infrared spectroscopy
Fourier transform infrared spectroscopy
 
Infrared Spectroscopy (IR)
Infrared Spectroscopy (IR)Infrared Spectroscopy (IR)
Infrared Spectroscopy (IR)
 
Dispersive ir spectrophotometer
Dispersive ir spectrophotometerDispersive ir spectrophotometer
Dispersive ir spectrophotometer
 
Atomic emission spectroscopy PPT
Atomic emission spectroscopy PPTAtomic emission spectroscopy PPT
Atomic emission spectroscopy PPT
 
Flame emission & atomic absorption spectroscopy
Flame emission & atomic absorption spectroscopyFlame emission & atomic absorption spectroscopy
Flame emission & atomic absorption spectroscopy
 
Ftir
FtirFtir
Ftir
 
Differential thermal analysis - instrumental methods of analysis
Differential thermal analysis - instrumental methods of analysis Differential thermal analysis - instrumental methods of analysis
Differential thermal analysis - instrumental methods of analysis
 
Atomic absorption spectroscopy
Atomic absorption spectroscopyAtomic absorption spectroscopy
Atomic absorption spectroscopy
 
FOURIER TRANSFORM - INFRARED SPECTROSCOPY
FOURIER TRANSFORM - INFRARED SPECTROSCOPYFOURIER TRANSFORM - INFRARED SPECTROSCOPY
FOURIER TRANSFORM - INFRARED SPECTROSCOPY
 
Application of ir
Application of irApplication of ir
Application of ir
 
IR SPECTROSCOPY
IR SPECTROSCOPYIR SPECTROSCOPY
IR SPECTROSCOPY
 
Introduction to molecular spectroscopy
Introduction to molecular spectroscopyIntroduction to molecular spectroscopy
Introduction to molecular spectroscopy
 

Similar to Ftir theory and applications

M.Sc. Part I 1.3 INFRARED SPECTROPHOTOMETRY PPT (1).ppsx
M.Sc. Part I  1.3 INFRARED SPECTROPHOTOMETRY PPT (1).ppsxM.Sc. Part I  1.3 INFRARED SPECTROPHOTOMETRY PPT (1).ppsx
M.Sc. Part I 1.3 INFRARED SPECTROPHOTOMETRY PPT (1).ppsx
SIMARANJAISWAL41M3S
 
M.Sc. Part I 1.3 INFRARED SPECTROPHOTOMETRY PPT.ppsx
M.Sc. Part I  1.3 INFRARED SPECTROPHOTOMETRY PPT.ppsxM.Sc. Part I  1.3 INFRARED SPECTROPHOTOMETRY PPT.ppsx
M.Sc. Part I 1.3 INFRARED SPECTROPHOTOMETRY PPT.ppsx
Dipu77
 
Sachin new ftir
Sachin new ftirSachin new ftir
Infrared spectroscopy
Infrared spectroscopyInfrared spectroscopy
Infrared spectroscopy
ANKUSH JADHAV
 
IR Spectroscopy
IR SpectroscopyIR Spectroscopy
IR Spectroscopy
krishslide
 
IR Spectroscopy.pdf
IR Spectroscopy.pdfIR Spectroscopy.pdf
IR Spectroscopy.pdf
Mayur Bodhankar
 
IR spectroscopy
IR spectroscopyIR spectroscopy
IR spectroscopy
PawanYadav285
 
Photometry by Dr. Anurag Yadav
Photometry by Dr. Anurag YadavPhotometry by Dr. Anurag Yadav
Photometry by Dr. Anurag Yadav
Dr Anurag Yadav
 
IR spectroscopy
IR spectroscopyIR spectroscopy
IR spectroscopy
Aamna Tabassum
 
Infrared instrumentation
Infrared instrumentationInfrared instrumentation
Infrared instrumentation
NIPER MOHALI
 
Introduction to Fourier Transfer Infrared Spectroscopy
Introduction to Fourier Transfer Infrared SpectroscopyIntroduction to Fourier Transfer Infrared Spectroscopy
Introduction to Fourier Transfer Infrared Spectroscopy
RahulVerma550005
 
4_2020_03_20!07_33_21_PM.ppt
4_2020_03_20!07_33_21_PM.ppt4_2020_03_20!07_33_21_PM.ppt
4_2020_03_20!07_33_21_PM.ppt
RajniGarg39
 
IR SPECTROCOPY, Instrumentation of IR spectroscopy, Application of IR spectro...
IR SPECTROCOPY, Instrumentation of IR spectroscopy, Application of IR spectro...IR SPECTROCOPY, Instrumentation of IR spectroscopy, Application of IR spectro...
IR SPECTROCOPY, Instrumentation of IR spectroscopy, Application of IR spectro...
DipeshGamare
 
IR spectroscopy
IR spectroscopyIR spectroscopy
I R spectroscopy
I R spectroscopyI R spectroscopy
I R spectroscopy
ceutics1315
 
Pharmaceutical Analysis Infra Red spectroscopy instrumentation
Pharmaceutical Analysis Infra Red spectroscopy instrumentationPharmaceutical Analysis Infra Red spectroscopy instrumentation
Pharmaceutical Analysis Infra Red spectroscopy instrumentation
njoecreations99
 
Spectrophotometry methods for molecule analysis
Spectrophotometry methods for molecule analysisSpectrophotometry methods for molecule analysis
Spectrophotometry methods for molecule analysis
ygpark2221
 
Ftir infra 3000 presentation
Ftir infra 3000 presentationFtir infra 3000 presentation
Ftir infra 3000 presentation
SIVAPRASAD PATNAM
 
Ir instrumentation
Ir instrumentationIr instrumentation
Ir instrumentation
Randeep Patro
 

Similar to Ftir theory and applications (20)

M.Sc. Part I 1.3 INFRARED SPECTROPHOTOMETRY PPT (1).ppsx
M.Sc. Part I  1.3 INFRARED SPECTROPHOTOMETRY PPT (1).ppsxM.Sc. Part I  1.3 INFRARED SPECTROPHOTOMETRY PPT (1).ppsx
M.Sc. Part I 1.3 INFRARED SPECTROPHOTOMETRY PPT (1).ppsx
 
M.Sc. Part I 1.3 INFRARED SPECTROPHOTOMETRY PPT.ppsx
M.Sc. Part I  1.3 INFRARED SPECTROPHOTOMETRY PPT.ppsxM.Sc. Part I  1.3 INFRARED SPECTROPHOTOMETRY PPT.ppsx
M.Sc. Part I 1.3 INFRARED SPECTROPHOTOMETRY PPT.ppsx
 
Sachin new ftir
Sachin new ftirSachin new ftir
Sachin new ftir
 
Infrared spectroscopy
Infrared spectroscopyInfrared spectroscopy
Infrared spectroscopy
 
Ir
IrIr
Ir
 
IR Spectroscopy
IR SpectroscopyIR Spectroscopy
IR Spectroscopy
 
IR Spectroscopy.pdf
IR Spectroscopy.pdfIR Spectroscopy.pdf
IR Spectroscopy.pdf
 
IR spectroscopy
IR spectroscopyIR spectroscopy
IR spectroscopy
 
Photometry by Dr. Anurag Yadav
Photometry by Dr. Anurag YadavPhotometry by Dr. Anurag Yadav
Photometry by Dr. Anurag Yadav
 
IR spectroscopy
IR spectroscopyIR spectroscopy
IR spectroscopy
 
Infrared instrumentation
Infrared instrumentationInfrared instrumentation
Infrared instrumentation
 
Introduction to Fourier Transfer Infrared Spectroscopy
Introduction to Fourier Transfer Infrared SpectroscopyIntroduction to Fourier Transfer Infrared Spectroscopy
Introduction to Fourier Transfer Infrared Spectroscopy
 
4_2020_03_20!07_33_21_PM.ppt
4_2020_03_20!07_33_21_PM.ppt4_2020_03_20!07_33_21_PM.ppt
4_2020_03_20!07_33_21_PM.ppt
 
IR SPECTROCOPY, Instrumentation of IR spectroscopy, Application of IR spectro...
IR SPECTROCOPY, Instrumentation of IR spectroscopy, Application of IR spectro...IR SPECTROCOPY, Instrumentation of IR spectroscopy, Application of IR spectro...
IR SPECTROCOPY, Instrumentation of IR spectroscopy, Application of IR spectro...
 
IR spectroscopy
IR spectroscopyIR spectroscopy
IR spectroscopy
 
I R spectroscopy
I R spectroscopyI R spectroscopy
I R spectroscopy
 
Pharmaceutical Analysis Infra Red spectroscopy instrumentation
Pharmaceutical Analysis Infra Red spectroscopy instrumentationPharmaceutical Analysis Infra Red spectroscopy instrumentation
Pharmaceutical Analysis Infra Red spectroscopy instrumentation
 
Spectrophotometry methods for molecule analysis
Spectrophotometry methods for molecule analysisSpectrophotometry methods for molecule analysis
Spectrophotometry methods for molecule analysis
 
Ftir infra 3000 presentation
Ftir infra 3000 presentationFtir infra 3000 presentation
Ftir infra 3000 presentation
 
Ir instrumentation
Ir instrumentationIr instrumentation
Ir instrumentation
 

Recently uploaded

Cancer cell metabolism: special Reference to Lactate Pathway
Cancer cell metabolism: special Reference to Lactate PathwayCancer cell metabolism: special Reference to Lactate Pathway
Cancer cell metabolism: special Reference to Lactate Pathway
AADYARAJPANDEY1
 
Earliest Galaxies in the JADES Origins Field: Luminosity Function and Cosmic ...
Earliest Galaxies in the JADES Origins Field: Luminosity Function and Cosmic ...Earliest Galaxies in the JADES Origins Field: Luminosity Function and Cosmic ...
Earliest Galaxies in the JADES Origins Field: Luminosity Function and Cosmic ...
Sérgio Sacani
 
Structures and textures of metamorphic rocks
Structures and textures of metamorphic rocksStructures and textures of metamorphic rocks
Structures and textures of metamorphic rocks
kumarmathi863
 
Seminar of U.V. Spectroscopy by SAMIR PANDA
 Seminar of U.V. Spectroscopy by SAMIR PANDA Seminar of U.V. Spectroscopy by SAMIR PANDA
Seminar of U.V. Spectroscopy by SAMIR PANDA
SAMIR PANDA
 
Observation of Io’s Resurfacing via Plume Deposition Using Ground-based Adapt...
Observation of Io’s Resurfacing via Plume Deposition Using Ground-based Adapt...Observation of Io’s Resurfacing via Plume Deposition Using Ground-based Adapt...
Observation of Io’s Resurfacing via Plume Deposition Using Ground-based Adapt...
Sérgio Sacani
 
EY - Supply Chain Services 2018_template.pptx
EY - Supply Chain Services 2018_template.pptxEY - Supply Chain Services 2018_template.pptx
EY - Supply Chain Services 2018_template.pptx
AlguinaldoKong
 
platelets_clotting_biogenesis.clot retractionpptx
platelets_clotting_biogenesis.clot retractionpptxplatelets_clotting_biogenesis.clot retractionpptx
platelets_clotting_biogenesis.clot retractionpptx
muralinath2
 
Hemostasis_importance& clinical significance.pptx
Hemostasis_importance& clinical significance.pptxHemostasis_importance& clinical significance.pptx
Hemostasis_importance& clinical significance.pptx
muralinath2
 
ESR_factors_affect-clinic significance-Pathysiology.pptx
ESR_factors_affect-clinic significance-Pathysiology.pptxESR_factors_affect-clinic significance-Pathysiology.pptx
ESR_factors_affect-clinic significance-Pathysiology.pptx
muralinath2
 
Multi-source connectivity as the driver of solar wind variability in the heli...
Multi-source connectivity as the driver of solar wind variability in the heli...Multi-source connectivity as the driver of solar wind variability in the heli...
Multi-source connectivity as the driver of solar wind variability in the heli...
Sérgio Sacani
 
plant biotechnology Lecture note ppt.pptx
plant biotechnology Lecture note ppt.pptxplant biotechnology Lecture note ppt.pptx
plant biotechnology Lecture note ppt.pptx
yusufzako14
 
insect taxonomy importance systematics and classification
insect taxonomy importance systematics and classificationinsect taxonomy importance systematics and classification
insect taxonomy importance systematics and classification
anitaento25
 
general properties of oerganologametal.ppt
general properties of oerganologametal.pptgeneral properties of oerganologametal.ppt
general properties of oerganologametal.ppt
IqrimaNabilatulhusni
 
Comparative structure of adrenal gland in vertebrates
Comparative structure of adrenal gland in vertebratesComparative structure of adrenal gland in vertebrates
Comparative structure of adrenal gland in vertebrates
sachin783648
 
THE IMPORTANCE OF MARTIAN ATMOSPHERE SAMPLE RETURN.
THE IMPORTANCE OF MARTIAN ATMOSPHERE SAMPLE RETURN.THE IMPORTANCE OF MARTIAN ATMOSPHERE SAMPLE RETURN.
THE IMPORTANCE OF MARTIAN ATMOSPHERE SAMPLE RETURN.
Sérgio Sacani
 
filosofia boliviana introducción jsjdjd.pptx
filosofia boliviana introducción jsjdjd.pptxfilosofia boliviana introducción jsjdjd.pptx
filosofia boliviana introducción jsjdjd.pptx
IvanMallco1
 
GBSN- Microbiology (Lab 3) Gram Staining
GBSN- Microbiology (Lab 3) Gram StainingGBSN- Microbiology (Lab 3) Gram Staining
GBSN- Microbiology (Lab 3) Gram Staining
Areesha Ahmad
 
Predicting property prices with machine learning algorithms.pdf
Predicting property prices with machine learning algorithms.pdfPredicting property prices with machine learning algorithms.pdf
Predicting property prices with machine learning algorithms.pdf
binhminhvu04
 
PRESENTATION ABOUT PRINCIPLE OF COSMATIC EVALUATION
PRESENTATION ABOUT PRINCIPLE OF COSMATIC EVALUATIONPRESENTATION ABOUT PRINCIPLE OF COSMATIC EVALUATION
PRESENTATION ABOUT PRINCIPLE OF COSMATIC EVALUATION
ChetanK57
 
Unveiling the Energy Potential of Marshmallow Deposits.pdf
Unveiling the Energy Potential of Marshmallow Deposits.pdfUnveiling the Energy Potential of Marshmallow Deposits.pdf
Unveiling the Energy Potential of Marshmallow Deposits.pdf
Erdal Coalmaker
 

Recently uploaded (20)

Cancer cell metabolism: special Reference to Lactate Pathway
Cancer cell metabolism: special Reference to Lactate PathwayCancer cell metabolism: special Reference to Lactate Pathway
Cancer cell metabolism: special Reference to Lactate Pathway
 
Earliest Galaxies in the JADES Origins Field: Luminosity Function and Cosmic ...
Earliest Galaxies in the JADES Origins Field: Luminosity Function and Cosmic ...Earliest Galaxies in the JADES Origins Field: Luminosity Function and Cosmic ...
Earliest Galaxies in the JADES Origins Field: Luminosity Function and Cosmic ...
 
Structures and textures of metamorphic rocks
Structures and textures of metamorphic rocksStructures and textures of metamorphic rocks
Structures and textures of metamorphic rocks
 
Seminar of U.V. Spectroscopy by SAMIR PANDA
 Seminar of U.V. Spectroscopy by SAMIR PANDA Seminar of U.V. Spectroscopy by SAMIR PANDA
Seminar of U.V. Spectroscopy by SAMIR PANDA
 
Observation of Io’s Resurfacing via Plume Deposition Using Ground-based Adapt...
Observation of Io’s Resurfacing via Plume Deposition Using Ground-based Adapt...Observation of Io’s Resurfacing via Plume Deposition Using Ground-based Adapt...
Observation of Io’s Resurfacing via Plume Deposition Using Ground-based Adapt...
 
EY - Supply Chain Services 2018_template.pptx
EY - Supply Chain Services 2018_template.pptxEY - Supply Chain Services 2018_template.pptx
EY - Supply Chain Services 2018_template.pptx
 
platelets_clotting_biogenesis.clot retractionpptx
platelets_clotting_biogenesis.clot retractionpptxplatelets_clotting_biogenesis.clot retractionpptx
platelets_clotting_biogenesis.clot retractionpptx
 
Hemostasis_importance& clinical significance.pptx
Hemostasis_importance& clinical significance.pptxHemostasis_importance& clinical significance.pptx
Hemostasis_importance& clinical significance.pptx
 
ESR_factors_affect-clinic significance-Pathysiology.pptx
ESR_factors_affect-clinic significance-Pathysiology.pptxESR_factors_affect-clinic significance-Pathysiology.pptx
ESR_factors_affect-clinic significance-Pathysiology.pptx
 
Multi-source connectivity as the driver of solar wind variability in the heli...
Multi-source connectivity as the driver of solar wind variability in the heli...Multi-source connectivity as the driver of solar wind variability in the heli...
Multi-source connectivity as the driver of solar wind variability in the heli...
 
plant biotechnology Lecture note ppt.pptx
plant biotechnology Lecture note ppt.pptxplant biotechnology Lecture note ppt.pptx
plant biotechnology Lecture note ppt.pptx
 
insect taxonomy importance systematics and classification
insect taxonomy importance systematics and classificationinsect taxonomy importance systematics and classification
insect taxonomy importance systematics and classification
 
general properties of oerganologametal.ppt
general properties of oerganologametal.pptgeneral properties of oerganologametal.ppt
general properties of oerganologametal.ppt
 
Comparative structure of adrenal gland in vertebrates
Comparative structure of adrenal gland in vertebratesComparative structure of adrenal gland in vertebrates
Comparative structure of adrenal gland in vertebrates
 
THE IMPORTANCE OF MARTIAN ATMOSPHERE SAMPLE RETURN.
THE IMPORTANCE OF MARTIAN ATMOSPHERE SAMPLE RETURN.THE IMPORTANCE OF MARTIAN ATMOSPHERE SAMPLE RETURN.
THE IMPORTANCE OF MARTIAN ATMOSPHERE SAMPLE RETURN.
 
filosofia boliviana introducción jsjdjd.pptx
filosofia boliviana introducción jsjdjd.pptxfilosofia boliviana introducción jsjdjd.pptx
filosofia boliviana introducción jsjdjd.pptx
 
GBSN- Microbiology (Lab 3) Gram Staining
GBSN- Microbiology (Lab 3) Gram StainingGBSN- Microbiology (Lab 3) Gram Staining
GBSN- Microbiology (Lab 3) Gram Staining
 
Predicting property prices with machine learning algorithms.pdf
Predicting property prices with machine learning algorithms.pdfPredicting property prices with machine learning algorithms.pdf
Predicting property prices with machine learning algorithms.pdf
 
PRESENTATION ABOUT PRINCIPLE OF COSMATIC EVALUATION
PRESENTATION ABOUT PRINCIPLE OF COSMATIC EVALUATIONPRESENTATION ABOUT PRINCIPLE OF COSMATIC EVALUATION
PRESENTATION ABOUT PRINCIPLE OF COSMATIC EVALUATION
 
Unveiling the Energy Potential of Marshmallow Deposits.pdf
Unveiling the Energy Potential of Marshmallow Deposits.pdfUnveiling the Energy Potential of Marshmallow Deposits.pdf
Unveiling the Energy Potential of Marshmallow Deposits.pdf
 

Ftir theory and applications

  • 1. FTIR: THEORY, INSTRUMENTATION AND APPLICATIONS Dr. Amol Shinde Shimadzu Analytical India Pvt Ltd Mob: 8452912856 Email: amolshinde005@gmail.com
  • 3. ELECTROMAGNETIC SPECTRUM UV VIS NIR IR Far IR Microwave 10-5 10-5 10-4 10-3 10-2 10-1 Wavelength (cm) Energy 0.78 2.5 25 1000Wavelength (mm) Wavenumber (cm-1) 12,800 4000 400 10
  • 4. Discovery of Infrared Radiation William Herschel 1738-1822 German Astronomer  The infrared radiation was discovered in 1800.  Infra = Lower  Infrared = Lower energy radiation.  He observed an invisible radiation in solar spectrum having lower energy than red light, by means of its effect on a thermometer.
  • 5.  Electromagnetic radiation is an oscillating electric force field transmitted through space in the form of a transverse wave  Responsible for phenomena such as transmission, absorption, refraction and reflection Wave Properties
  • 6. PROPERTIES OF LIGHT n = frequency (cycle / second) 0 2 4 6 8 10 -1.0 -0.5 0.0 0.5 1.0 lOne cycle nl = cA A = amplitude c = speed of light (3.0 * 1010 cm / sec) l = wavelength (nm , μm )
  • 7. E = Energy (ergs) h = Planck’s Constant (erg sec) c = Speed of light (μm/sec) l = Wavelength (μm) n = Frequency (cycles/sec) E = hc/l = hn ENERGY OF LIGHT
  • 8. ELECTRONIC TRANSITION Excited state E1 DE = E1 - E0 = hv Energy level Radiatione Energy difference DE Grand state E0 e
  • 9.  High energy radiation causes  Electronic transition  Low energy radiation causes  Vibrational transition  Rotational transition ABSORPTION OF RADIATION
  • 10. ABSORPTION OF RADIATION Energy Vibrational transition Rotational transition R v1 v2 v0 5 4 3 2 1 0 Electronic transition E1 E0 v0 v1 v2 E = hn in which h is Planck’s constant (6.626 * 10-34 Joules and n is the frequency of the radiation
  • 11. Vibrational motion •A polyatomic molecule containing N atoms will have 3N possibilities for motion •Of these 3N possibilities or degree of freedom, 3 must be attributed for the translation of the entire molecule •The remain 3N – 3 possibilities are for rotation and internal vibration in the molecule •Therefore 3N – 3-2 is for linear molecules 3N – 3-3 is for non-linear molecules
  • 12. Types of Vibrations 1. Stretching Vibrations Bond length changes 2. Bending Vibrations Bond angle changes
  • 14.  When the molecule is irradiated with electromagnetic radiation, the vibrating bond will absorb energy if the frequencies of the light and the vibration are identical  Each of the different vibration modes give rise to different absorption band Absorption of Infrared Radiation
  • 15. Absorption of Infrared Radiation  A molecule must undergo a net change in dipole moment as a consequence of vibrational or rotational motions in order to absorb infrared radiation
  • 16. Can all vibrations absorb IR?  Frequencies fall outside the normal infrared regions  Vibration does not produce a fluctuating dipole therefore cannot interact with fluctuating electric fields of the infrared light Cl H N N Example of Dipole and Dipole movement • When HCl vibrates, the dipole (charge separation) increases • N2 has no dipole and is infrared inactive 23
  • 17. v1 v2 v3 Linear molecule CO2 v1 v2 v3 Non-linear molecule H2O Only the vibration,which Changes Dipole moment of molecule, has IR absorption Can all vibrations absorb IR?
  • 18. GROUP WAVENUMBERS  Associated with the movements of a few atoms  Largely independent of the rest of the molecule  Examples: C = O, C - Cl, NH, CH and OH
  • 19. Fingerprint Region • Complex region of the infrared spectrum below 1500 cm-1. • Functional group region • Vibrational modes involve many atoms • Characteristic of the molecule as a whole
  • 20. Regions of Infrared Spectrum 4000 2500 2000 1500 625 2.5 4 5 7 16 Wavenumber (cm-1) Wavelength (10-6m)
  • 21. OVERTONE  Relatively weak intensity that may not be observed  Found in high wavenumber regions  Appear at integer multiples of fundamental vibrations  Occur at frequency about 2 or 3 times that of the fundamental lines  Not very common in mid-infrared spectra of molecules
  • 22. Infrared Window Materials  Used for transmission infrared radiation  Used as a media for powdered samples  Used as a cell for liquid samples
  • 23. Consideration of Window Materials  wavenumber transmission range  chemical properties of sample and crystal  physical properties of materials  cost of materials
  • 24. Material R.I Transmission Range (cm-1) % T Sodium Chloride 1.49 600-50000 90 Potassium Bromide 1.52 340-40000 90 Calcium Fluoride 1.38 1100-50000 95 KRS-5 2.37 250-16600 70 Germanium 4.0 660-5500 50 Silica/Quartz 1.42 2500-50000 85 Diamond 2.38 125-40000 70 Characteristics of Window Materials
  • 25. Sodium Chloride NaCl  Widely used material for infrared cell windows  Relatively the lowest cost  Wide transmission range  Low reflection losses  Soluble in water and glycerine  Slightly soluble in alcohol  Hygroscopic, thus fog easily
  • 26. Potassium Bromide KBr  Most widely used window material  Good resistance to thermal and mechanical shock.  Wider transmission range  Dissolve readily in water, glycerine and  Alcohol  More hygroscopic than sodium chloride  Scratches and deforms much readily than  sodium chloride
  • 27. Calcium Fluoride CaF2  Insoluble in water  Useful for aqueous and deuterium oxide solutions analysis  Good resistance to most acids and alkalis but is attacked by ammonium salts  Hard , and hence high mechanical strength  Limited transmission range
  • 28.  KRS-5 (Thallium Bromide/ Iodide)  Difficult to dissolve in water  Attacked by aqueous solutions of high pH and solutions of phosphates  Toxic, usually only harmful if absorbed through a cut or ingested  Widely used as an internal reflection plate in ATR  Difficult to polish
  • 29. Germanium Ge  Inert to chemicals  Insoluble in water but attacked by hot  Sulfuric acid  Hard and very brittle  Mostly used for ATR prism  High reflection losses which lead to low transmission levels
  • 30. Quartz/ Silica  Commonly used for near infrared region  Very resistant material  Soluble in hydrofluoric acid and slightly soluble in alkalis  Three types namely, natural, ultraviolet and infrared grade
  • 31. Diamond  Hardest window material used in infrared spectroscopy  Superior physical and chemical properties  Mostly used for ATR reflector plate for intractable samples  Extremely expensive  Having IR absorption 3000~1500cm-1
  • 32. Thumb rules for IR interpretation Rule 1: Bending is easier than stretching-- happens at lower energy (lower wavenumbe C-H Stretch Alkane 2800-3000 cm-1 C-H Bend Alkane 1300-1400 cm-1 Rule 3: Heavier atoms move slower than lighter atoms C-Cl 550-850 O-H more than 3300 C-H more than 2800 Rule 2: Triple bond ˃ Double bond ˃ Single bond Alkyne 2100-2260 cm-1 Alkene 1600-1700
  • 34. Types of FTIR  Dispersive Infrared Spectroscopy  Utilizes diffraction grating for wavenumber selection by using a monochromator  Fourier Transform Infrared Spectroscopy  Uses an interferometer to replace the dispersive device and generate an interference beam that is then exposed to the sample
  • 36. Interference Phenomenon Bright zone Dark zone X=0 X=2x1.25=2.5µ A)Fixed mirror Light reflected by B)Movable mirror X=2(l1-l2)=0 C)Movable mirror X=2 (l1-l2)=1.25µm 2.5μm 1.25µm 2.5μm of monochromatic light 5μm of monochromatic light
  • 42. INFRARED LIGHT SOURCE  Infrared source consist of inert solid which is heated electrically to temperature 1500 ~ 2000oK  The continuous radiation which is emitted resembles that of black body radiation
  • 43. MICHELSON INTERFEROMETER  Consist of 2 plane mirrors at right angle to each other  Beam splitter reflects 1/2 of the source intensity to the movable mirror and transmits the other 1/2 to the fixed mirror Spectrum Fourier Transform Interferogram Detector
  • 44. TYPES OF INFRARED DETECTOR  Thermocouples detector  Pyro-electric detector (DLATGS, TGS, etc)  MCT detector (Mercury Cadmium Tellurium)
  • 45. Temperature controlled DLATGS detector  High sensitivity deuterated L-alanine triglycine sulfate detector (DLATGS)  Maintain instrument temperature below detector curie point (61oC)  Detector is doped with L-alanine so that electrical field is automatically re-poled when temperature exceeding curie point
  • 46. Advantages of Pyroelectric detector  Excellent S/N ratio  Stable  Fast response  Wide range
  • 47. MCT DETECTOR  High sensitivity  Faster response  Necessary to cool by LN2  Narrow band
  • 48. Advantages of FTIR Vs Dispersive  Multiplex advantage (Fellgett) Scans all wavenumbers at a time  Aperture advantage (Jacquinot) No dispersive elements, so high throughput  Laser reference advantage (Connes) Internal wavelength calibration  Application advantage High speed and sensitive measurement possible
  • 49. Hinges using film (4 positions) Linkage part Top plate (fixed) Dynamic Alignment System Processing circuit He-Ne laser Beam splitter Piezo actuator Fixed mirror Movable mirror Sampling circuit for interference condition determination Sensor B Sensor A Light source Sample compartment FJS system Processing circuit Flexible Joint Support
  • 50. Dynamic Alignment System  Laser light passing through the interferometer is detected by photodiodes  Signals are generated  Difference between the result and optimum interference condition is calculated  Result is fed back to the interferometer  The difference is eliminated by the use of a piezo actuator
  • 51. ADVANTAGES  Stable and prompt measurement is achieved through dynamic alignment mechanism  To ensure that alignment of the optics is accurate  Energy is stabilized in short time
  • 52. PIEZO ACTUATOR Power amplifier Piezo actuator Fixed mirror Contracts or releases to tilt the angle of the fixed mirror for optimal interference
  • 53. Data Manipulations  Peak table generation  Baseline correction  Smoothing  Normalization  Deconvolution  Derivative calculations  JCAMP & ASCII file conversions  Film Thickness  Purity check algorithm  Peak ratio calculations  Spectrum subtraction  Data conversion calculations:  Kubelka-Munk  Kramers-Kronig  ATR Correction
  • 55. Deciding Factors  Physical nature of the sample  Type of information of the sample  Limitation of a technique
  • 56. • What is the objective of the analysis • Background information of the sample • Solubility of the sample • Hardness of the sample • Degradation of polymers • Reactivity What information one should have?
  • 57. Transmission techniques 1. Potassium Bromide (KBr) pellet method 1. Liquid film method 2. Film method 3. Nujol method (very thick suspension)
  • 58. 1. Attenuated total reflectance (ATR) 2. Diffuse reflectance (DRS) 3. Specular reflectance 4. Reflection Absorption Spectroscopy 5. Micro sampling techniques Reflection techniques
  • 59. KBR pellet method  Popular method for measuring powdered samples  Suitable for hard and brittle polymers  Polymer in the form of small particles dispersed in a disc of potassium bromide
  • 60. Hydraulic Press and Evacuable Die  KBr discs are prepared by grinding the polymer sample (2mg) with KBr (100-200 mg) and compressing the whole into a transparent disc  A good spectrum will depend on whether the sample is finely grind  Compression to a cohesive disc is done by using an evacuable die  13mm in diameter
  • 61. Hydraulic Press and Evacuable Die
  • 62. Mini-Hand Press  3mm diameter KBr pellet with briquetting frame  Hand-driven press  Small amount of sample  Simple and quick
  • 63. Hydraulic Press Mini-hand Press 13mm in diameter KBr pellet 3mm in diameter KBr pellet with briquetting frame With hydraulic press and vacuum pump Hand-driven press Takes longer time Simple and quick High through put Low through put but enough for FTIR To be able to keep in desiccator Make each measurement Hydraulic Press vs. Mini-Hand Press
  • 64. Caffeine powder Mini-hand Press, KBr pellet method 4cm-1, 45scans
  • 65. LIQUID FILM METHOD 1. Demountable cell 2. Sealed liquid cell 3. Fixed thickness cell
  • 66. Demountable cell  Qualitative analysis only  Non-volatile liquid and paste  Use spacer of 0.025 mm ~ 0.1 mm (25 µm to 100 µm ) thickness for low absorption liquid  No spacer is needed for high absorption liquid
  • 68. Sealed liquid cell  Qualitative and quantitative analysis  Volatile and Non-volatile liquid  Use spacer of 0.025 mm ~ 0.5 mm (25 µm to 500 µm ) thickness for low absorption liquid
  • 69.  THREE CRITERIAN FOR SOLVENT 1. Sample must be soluble or miscible with the solvent 2. Solvent must not have absorption bands in the region of interest 3. Diluent must not react with the sample Sealed liquid cell
  • 70. Fixed Thickness Cell  For quantitative measurement of liquid or volatile samples  3 types of cell window NaCl, KBr, KRS-5  Thickness 0.025mm ~ 5.0mm
  • 71. Gas cells  For quantitative measurement of gas samples  5 cm and 10 cm pathlength.
  • 72. Long Pathlength Gas cells  Measurement of low concentration of gas samples  1 meter and 2 meter is the pathlength  MCT detector is used
  • 73. Microsample measurement 1. Reflection type beam condenser 2. Single reflection ATR 3. IR Microscope
  • 74. Reflection Beam Condenser Can be used to measure liquid of 2-3 µL
  • 75. IR Spectra of polyester fibre with RBS 8000 Reflection Beam Condenser
  • 76. ATR measurement  The sample is held in contact with a prism made of highly refractive index material which transmits infrared rays.  The incident angle of IR beam is larger than the critical angle hence the IR beam is totally reflected by the interface between sample and the prism. Principle of ATR Measurement Long wavelength penetrate deeper Lower critical angle , more penetration Penetration depth calculation
  • 78. Characteristic of Prisms Transparency, hardest Insoluble2.3840000~650Diamond Yellow, hardInsoluble2.420000~650ZnSe Silver, fragileInsoluble4.05000~700Ge Orange, soft, poisonous Practically insoluble 2.3720000~290KRS-5 CharacteristicsSolubility in water Refractive index Wavenumber range (cm-1) Material
  • 79. Effect of sample contact ATR spectra of polystyrene at different clamping power
  • 82. Acrylonitrile-butadiene rubber containing carbon black as a reinforcement 3000 1500 400 KRS-5 Ge Incident angle = 45o Effect of R.I of prism Anomalous dispersion of refractive index
  • 85. Vertical Variable Angle ATR By varying the incident angle of IR rays, the sample profile can be studied ATR 8000
  • 86. Why Diamond ATR? Diamond ATR makes up for all of the limitations of ATR while maintaining all of the advantages  100X reduction in ATR element size allows intimate contact with samples and greatly reduces samples by requirement  Mechanical strength of the diamond ATR element allows for compression of the sample for intimate contact  Resistant to all corrosive and abrasive solvents and samples  Cleans up easily because of the low friction coefficient of diamond
  • 87. DIAMOND ATR DIAMOND ATR 1reflection Diamond ATR DuraSamplIR 1 reflection Diamond prism1 reflection Diamond prism contact size : about 1.5mm in diameter contact size : about 1.5mm in diameter Sample pressure device
  • 88. Diffuse Reflectance DRS method is applicable to almost all samples that can be pulverized. Sample preparation is easy Specular reflectance lightDiffuse reflectance light Incident light
  • 89. Diffuse Reflectance To minimize the specular reflectance  Grind the sample and KBr to fine particle  Dilute the sample to 1~5% of KBr powder  Do not press the sample surface
  • 91. Diffuse Reflectance Measurement SiC sandpaper disk Sample  SiC sampler is effective in sampling sample from large forming and plastic products.  Holder can be directly attached to DRS  Emery paper is used as blank
  • 93. ATR Objective mirror 1. Cone type prism 2. 45 degree angle 3. 15x magnification 4. Slide on for visible measurement and ATR Measurement
  • 94. Microvise holder Used to hold film samples
  • 96. Spectra of single yarn before and after compression 20um Before After Diamond Compression Cell
  • 97. Microscopy modes:  Reflectance mode (surface contaminants) 1. Reference material 2. Gold mirror 3. Aluminum coated mirror 4. Aluminum foil  Transmission mode (film, fibers) 1. Diamond cell can be used to compress the sample for transmittance measurement 2. Put small sample on a BaF2 window