More Related Content

PPT
Lecture 6 sections 2.3 and 2.7 graphs of lines and transformations 
PPTX

PPT

PPT

PPT
transformation of functions.ppt 
PPT
Higher Maths 1.2.2 - Graphs and Transformations 
PDF
2.5 Transformations of Functions 
PPT
Similar to shrink and stretch transformation properties

PPTX
2.8 translations of graphs 
PPT

PPT
Parent function and Transformation.ppt 
PPT
finction transformatin high schoolPPT.ppt 
PDF
3.5 Transformation of Functions 
PDF

PDF

PPTX
Transformations of functions 
PPTX
2.10 translations of graphs t 
PPT
PPTX
GraphTransformations.pptx 
PPTX
transformationsoffunctions-211108095210.pptx 
PPTX
Transformations of functions 
PPT

PPTX
Transformations of functions 
PPTX
Transformations of functions 
KEY

PPTX
M2L6 Transformations of Functions 
PDF

KEY
More from AteeqRehman86

PPTX
Chapter 7 all 7.1 - 7.6 lesson presentation.pptx 
PPTX
Chapter 7 all 7.1 - 7.5 lesson presentation.pptx 
PPTX
Conics_Parabola_Presentation high school.pptx 
PPTX
Basic ellipse and its properties ( P1).. 
PPTX
Perpendicular Bisectors in Triangles.pptx 
PPTX
Perpendicular Bisectors in Triangles.pptx 
PPTX
Practice_Problems_Solutions ellipse.pptx 
PPTX
activity teacher student relationship.pptx 
PPTX
activity teacher student relationship.pptx 
PPTX
Teacher_Student_Relationship_Guide_Interactive.pptx 
PPTX
friendly but not friends teacher and student relationship.pptx 
PPT
Conic section understanding high school.ppt Recently uploaded

PPTX
15 December 2025 Education for human flourishing Michael Stevenson .pptx 
PDF
UKSG Forum 2025 - They asked for everything - The Case of the Systematic Revi... 
PPTX
Semester 6 unit 2 Atopic dermatitis.pptx 
PDF
Models of Teaching - TNTEU - B.Ed I Semester - Teaching and Learning - BD1TL ... 
PDF
Digital Wellness in University Communities: Libraries as Guardians of Healthy... 
PDF
Projecte de la porta de primer B: L'antic Egipte 
PDF
NAVIGATE PHARMACY CAREER OPPORTUNITIES.pdf 
PPTX
The Cell & Cell Cycle-detailed structure and function of organelles.pptx 
PPTX
Accounting Skills Paper-II (Registers of PACs and Credit Co-operative Societies) 
PPTX
10-12-2025 Francois Staring How can Researchers and Initial Teacher Educators... 
PDF
1ST APPLICATION FOR ANNULMENT (4)8787666.pdf 
PPTX
TAMIS & TEMS - HOW, WHY and THE STEPS IN PROCTOLOGY 
PDF
Projecte de la porta d'i5B: Els animals marins 
PPTX
How to Manage Reception Report in Odoo 18 Inventory 
PDF
Current Electricity for first year physiotherapy 
PPTX
How to use search_read method in Odoo 18 
PPTX
How to Manage Line Discounts in Odoo 18 POS 
PPTX
Searching in PubMed andCochrane_Practical Presentation.pptx 
PDF
DHA/HAAD/MOH/DOH OPTOMETRY MCQ PYQ. .pdf 
PPTX
Semester 6 UNIT 2 Dislocation of hip.pptx shrink and stretch transformation properties
- 1.
Copyright © 2014,2010, 2006 Pearson Education, Inc. 1
Chapter 3
Quadratic
Functions and
Equations
- 2.
2
Copyright © 2014,2010, 2006 Pearson Education, Inc.
Transformations of
Graphs
♦ Graph functions using vertical and horizontal
shifts
♦ Graph functions using stretching and shrinking
♦ Graph functions using reflections
♦ Combine transformations
♦ Model data with transformations (optional)
3.5
- 3.
Copyright © 2014,2010, 2006 Pearson Education, Inc. 3
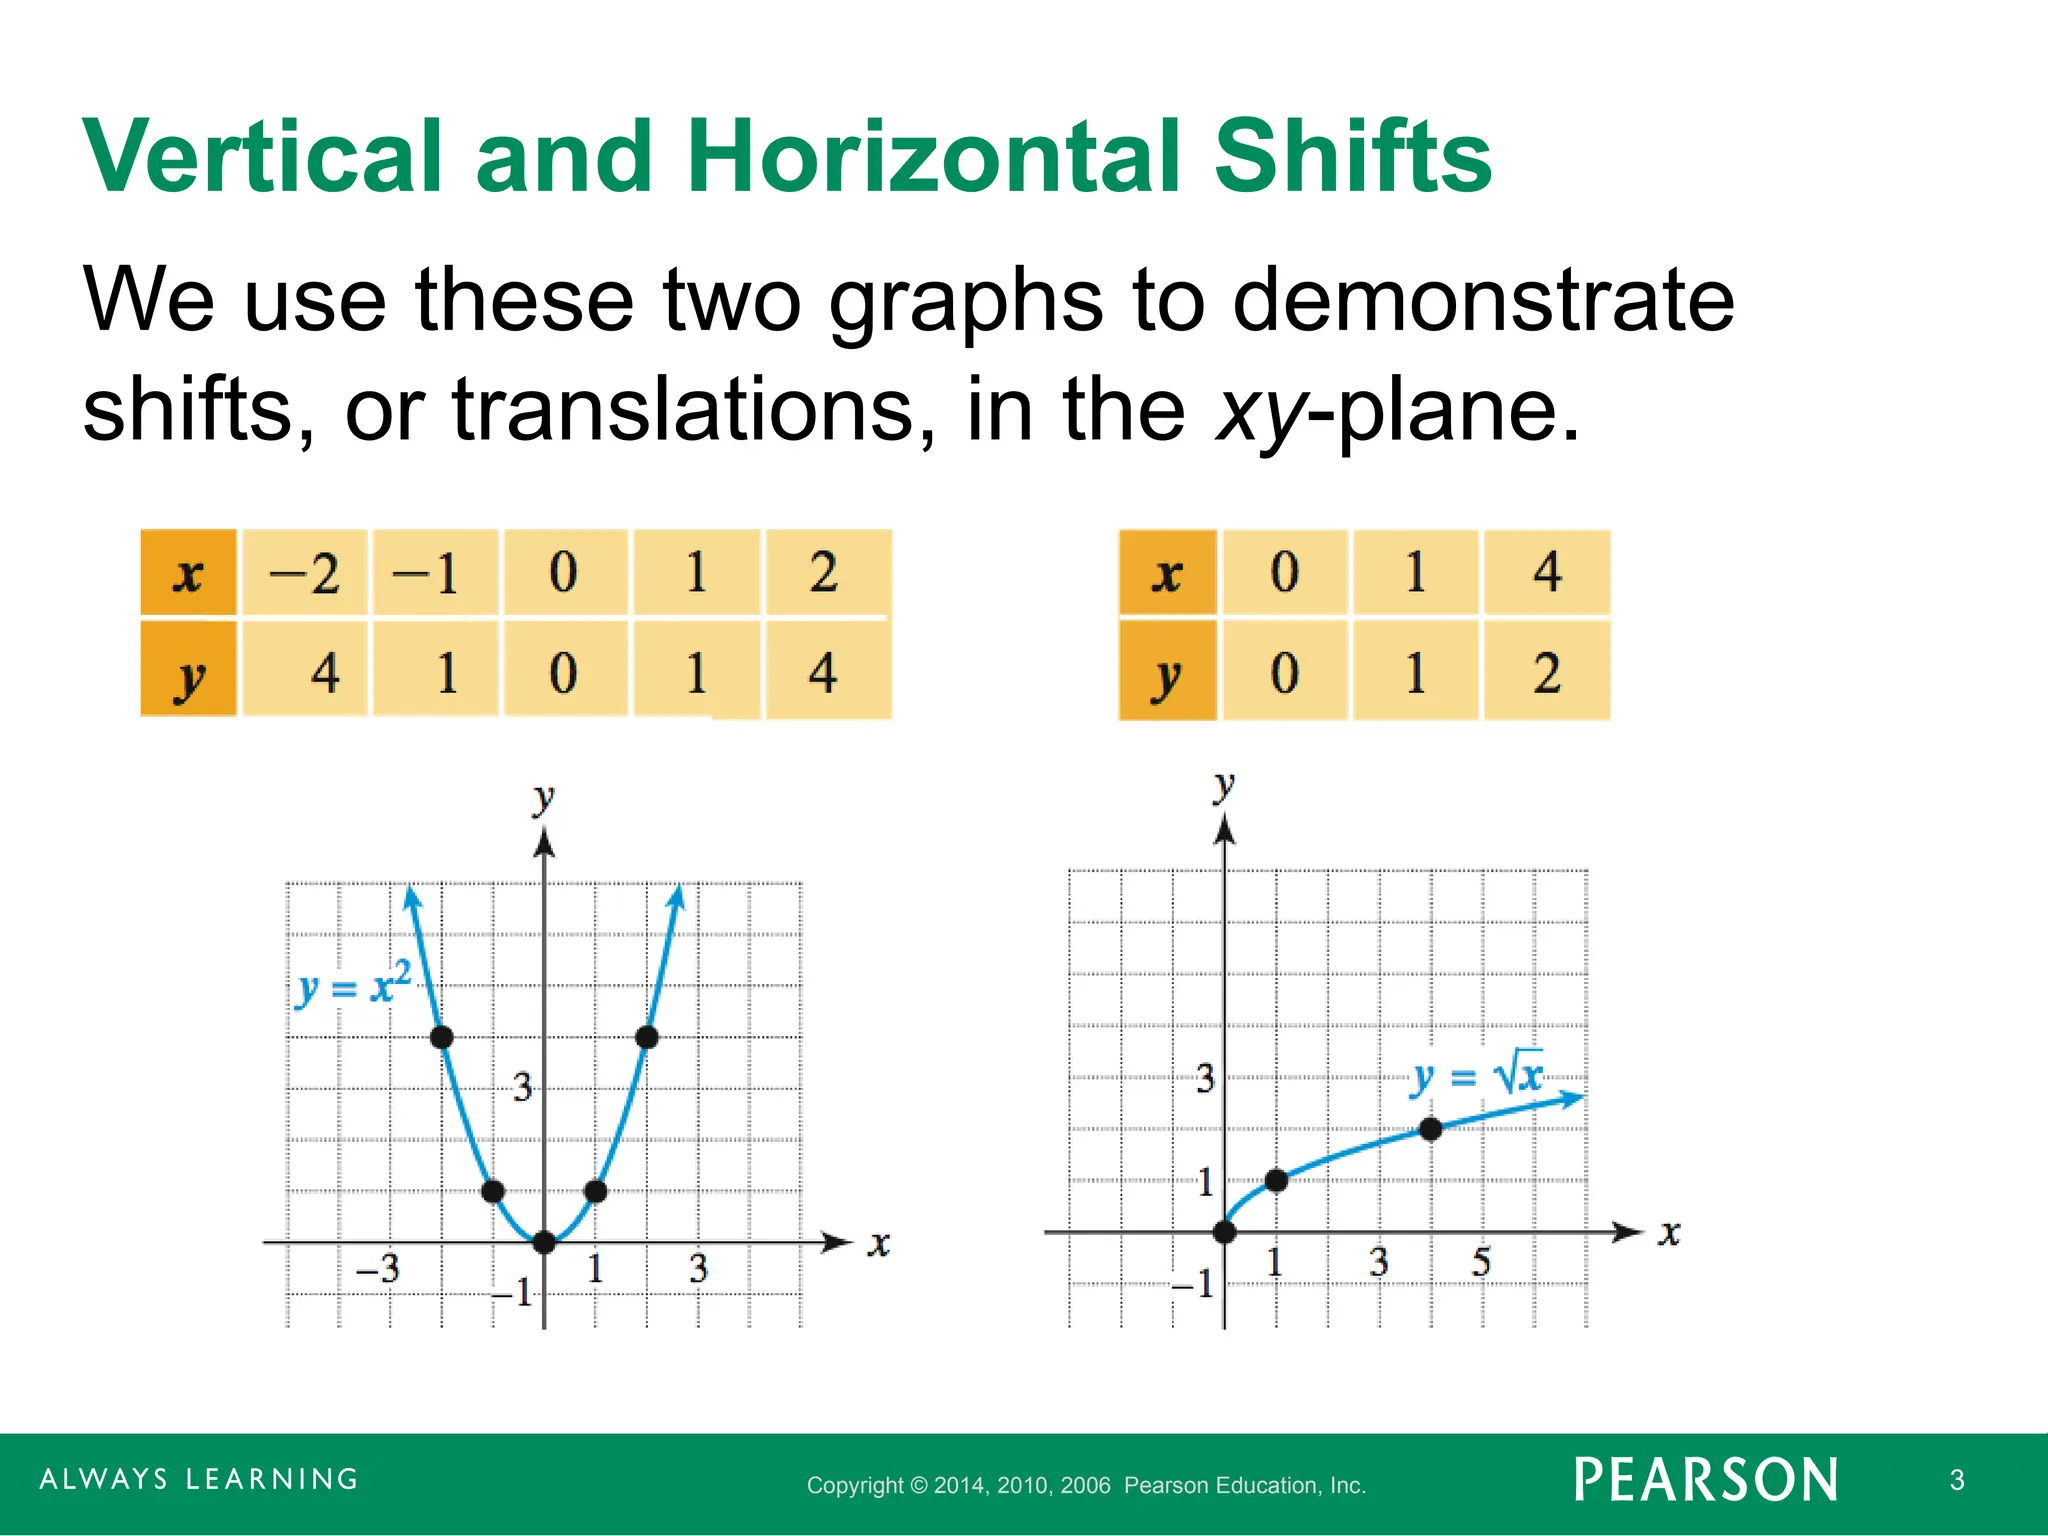
Vertical and Horizontal Shifts
We use these two graphs to demonstrate
shifts, or translations, in the xy-plane.
- 4.
Copyright © 2014,2010, 2006 Pearson Education, Inc. 4
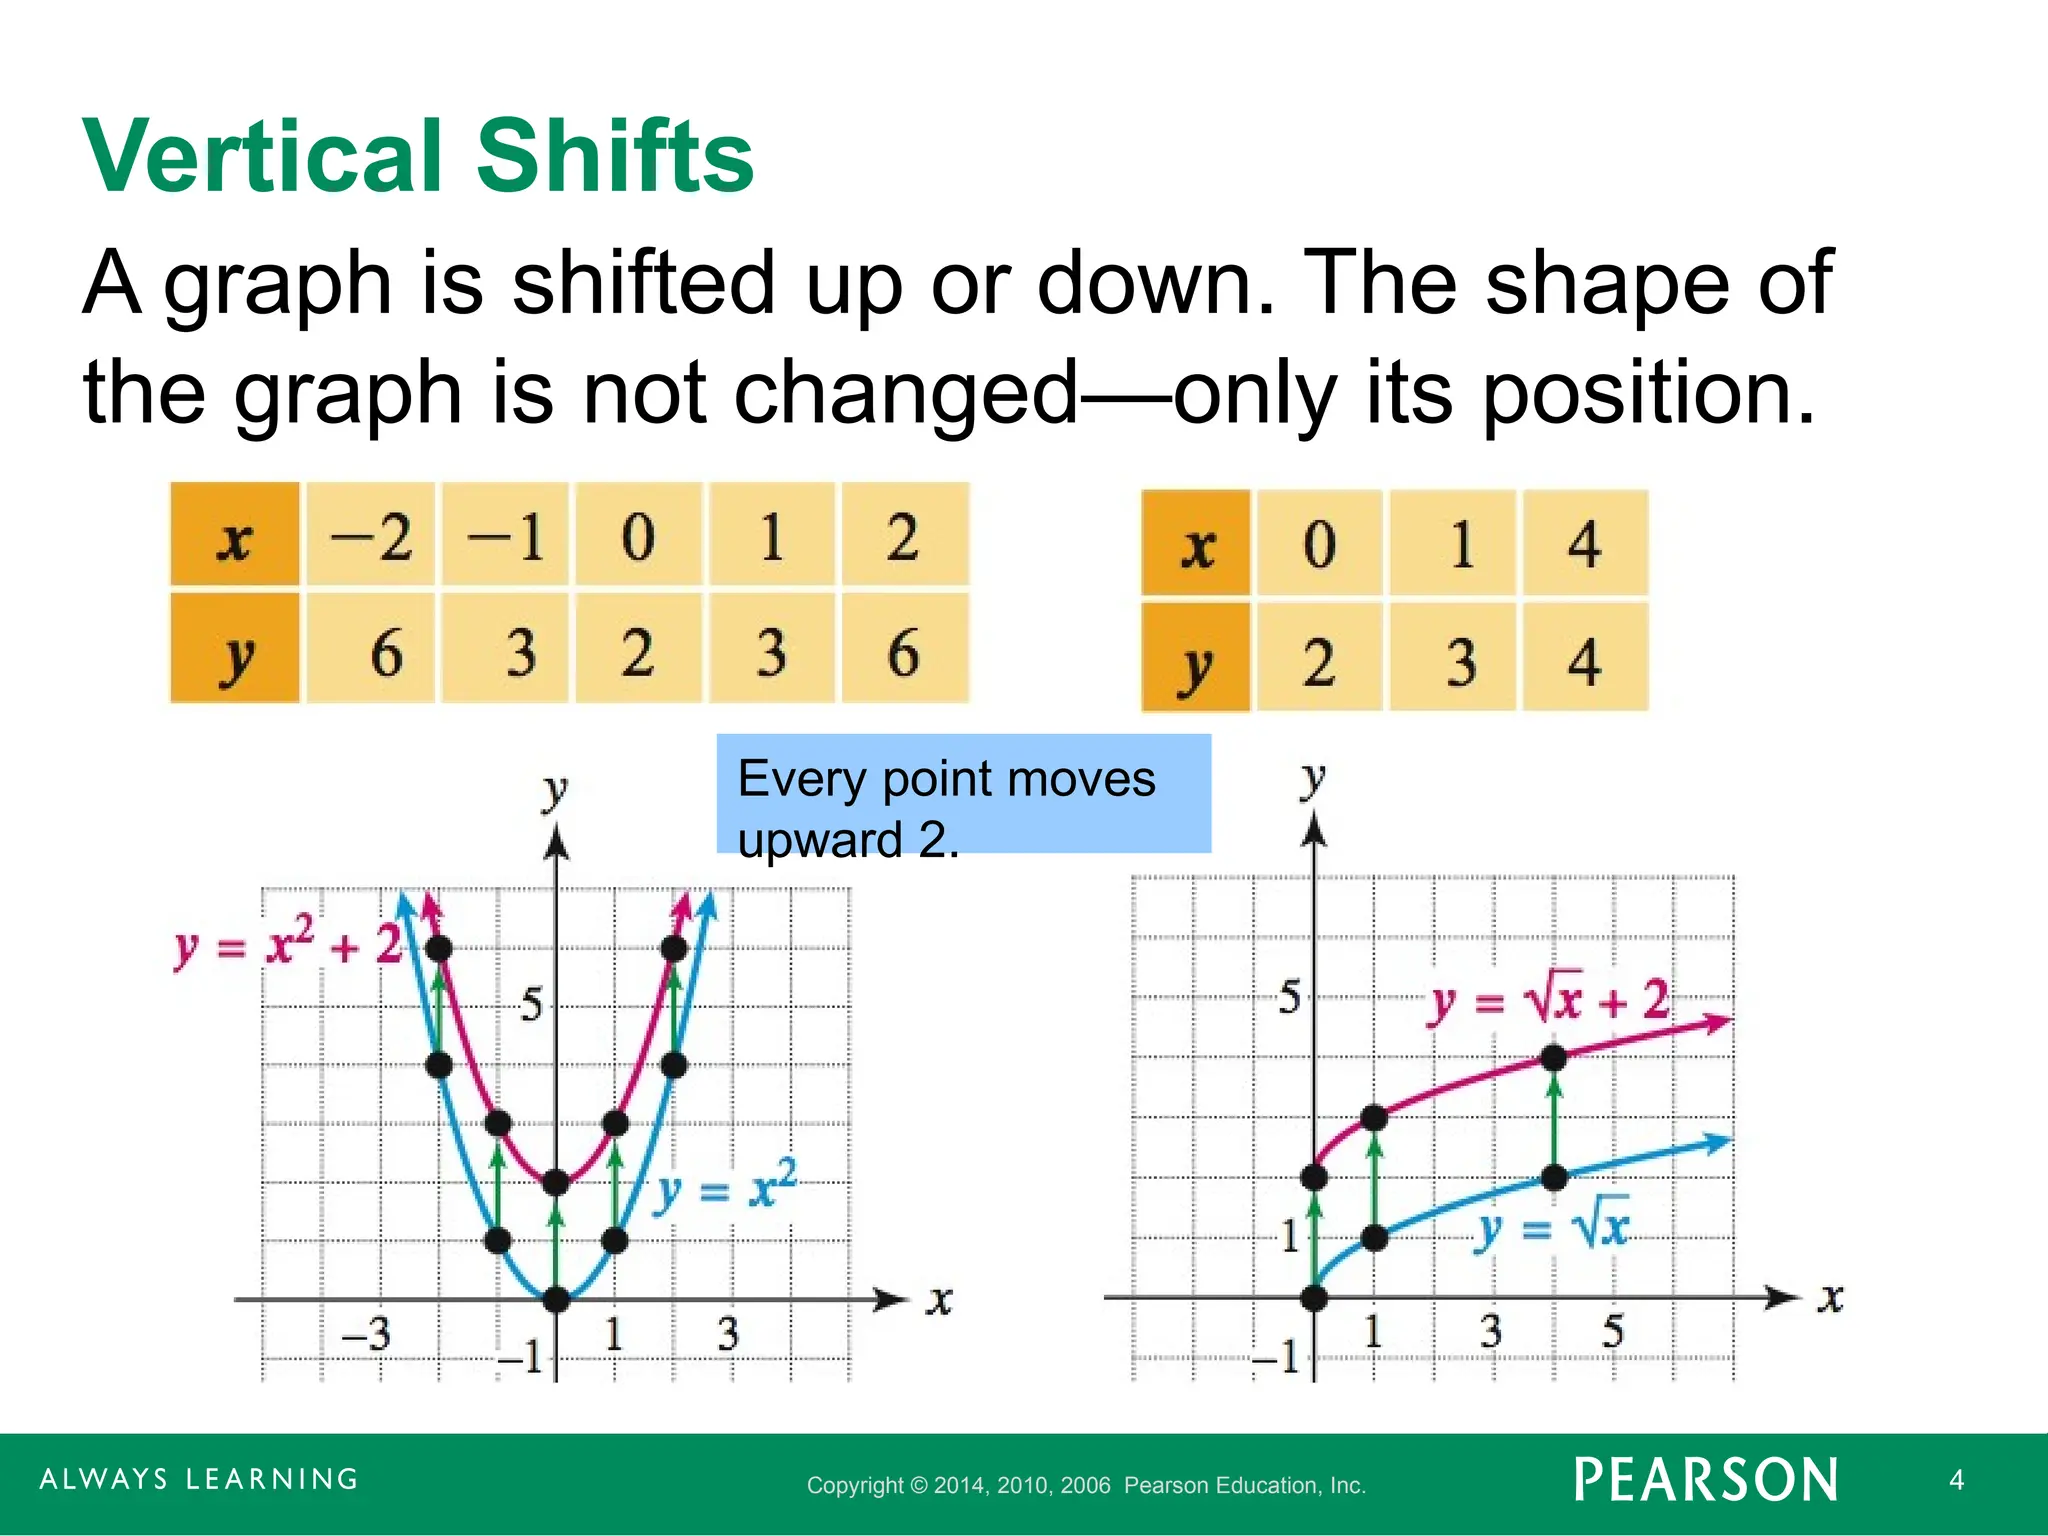
Vertical Shifts
A graph is shifted up or down. The shape of
the graph is not changed—only its position.
Every point moves
upward 2.
- 5.
Copyright © 2014,2010, 2006 Pearson Education, Inc. 5
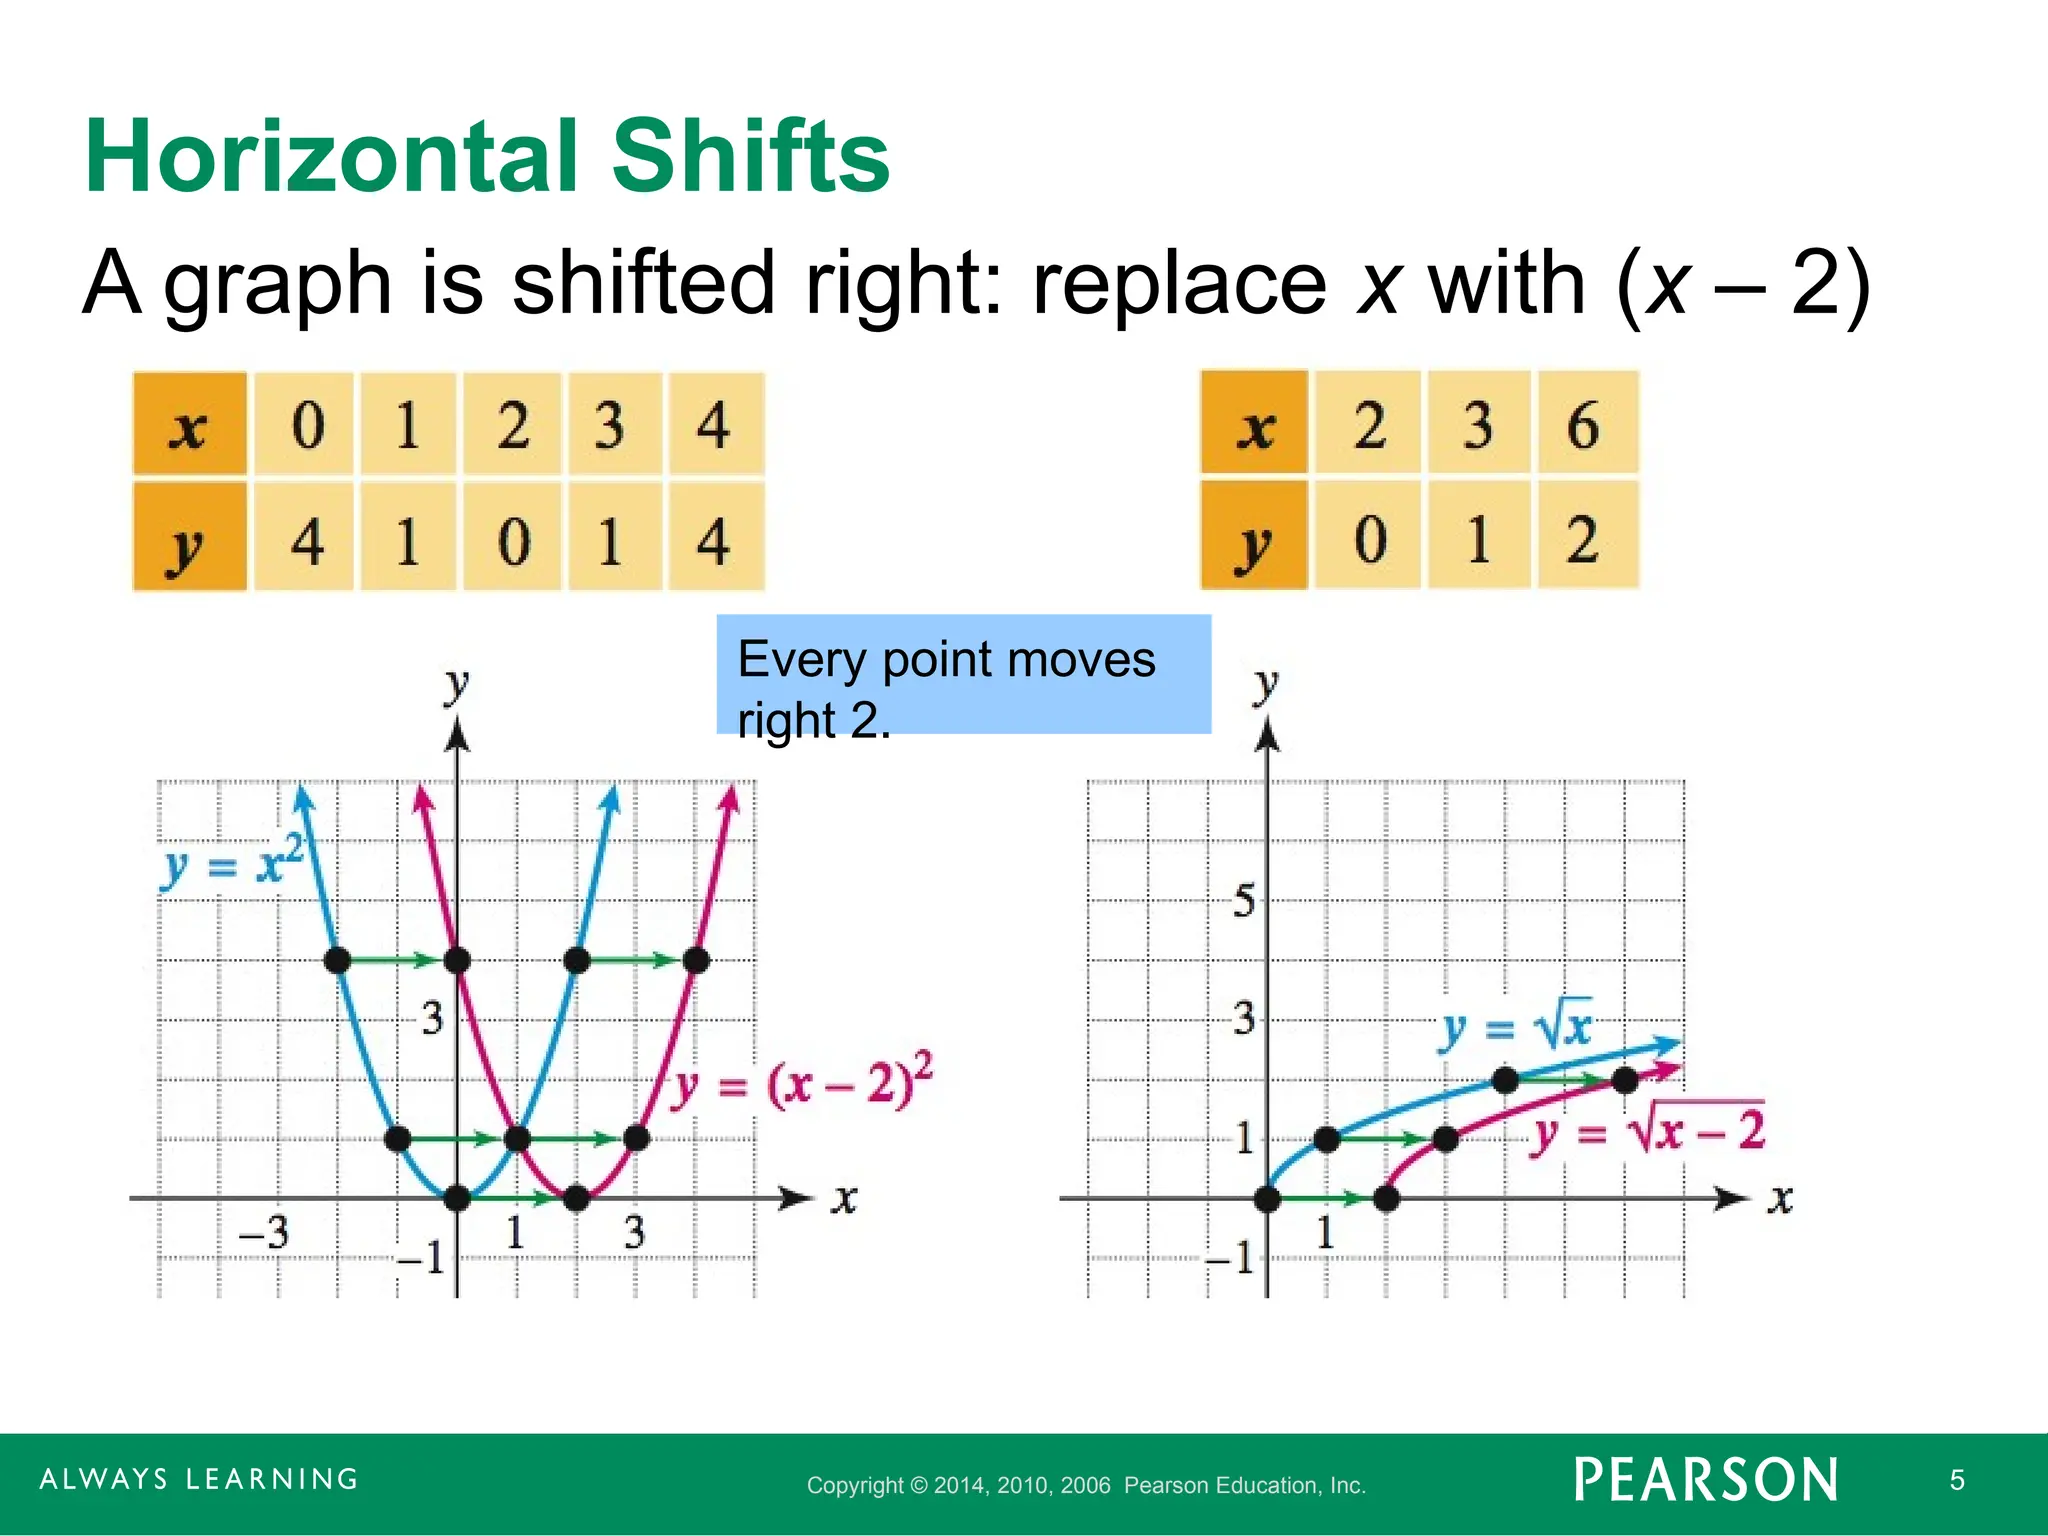
Horizontal Shifts
A graph is shifted right: replace x with (x – 2)
Every point moves
right 2.
- 6.
Copyright © 2014,2010, 2006 Pearson Education, Inc. 6
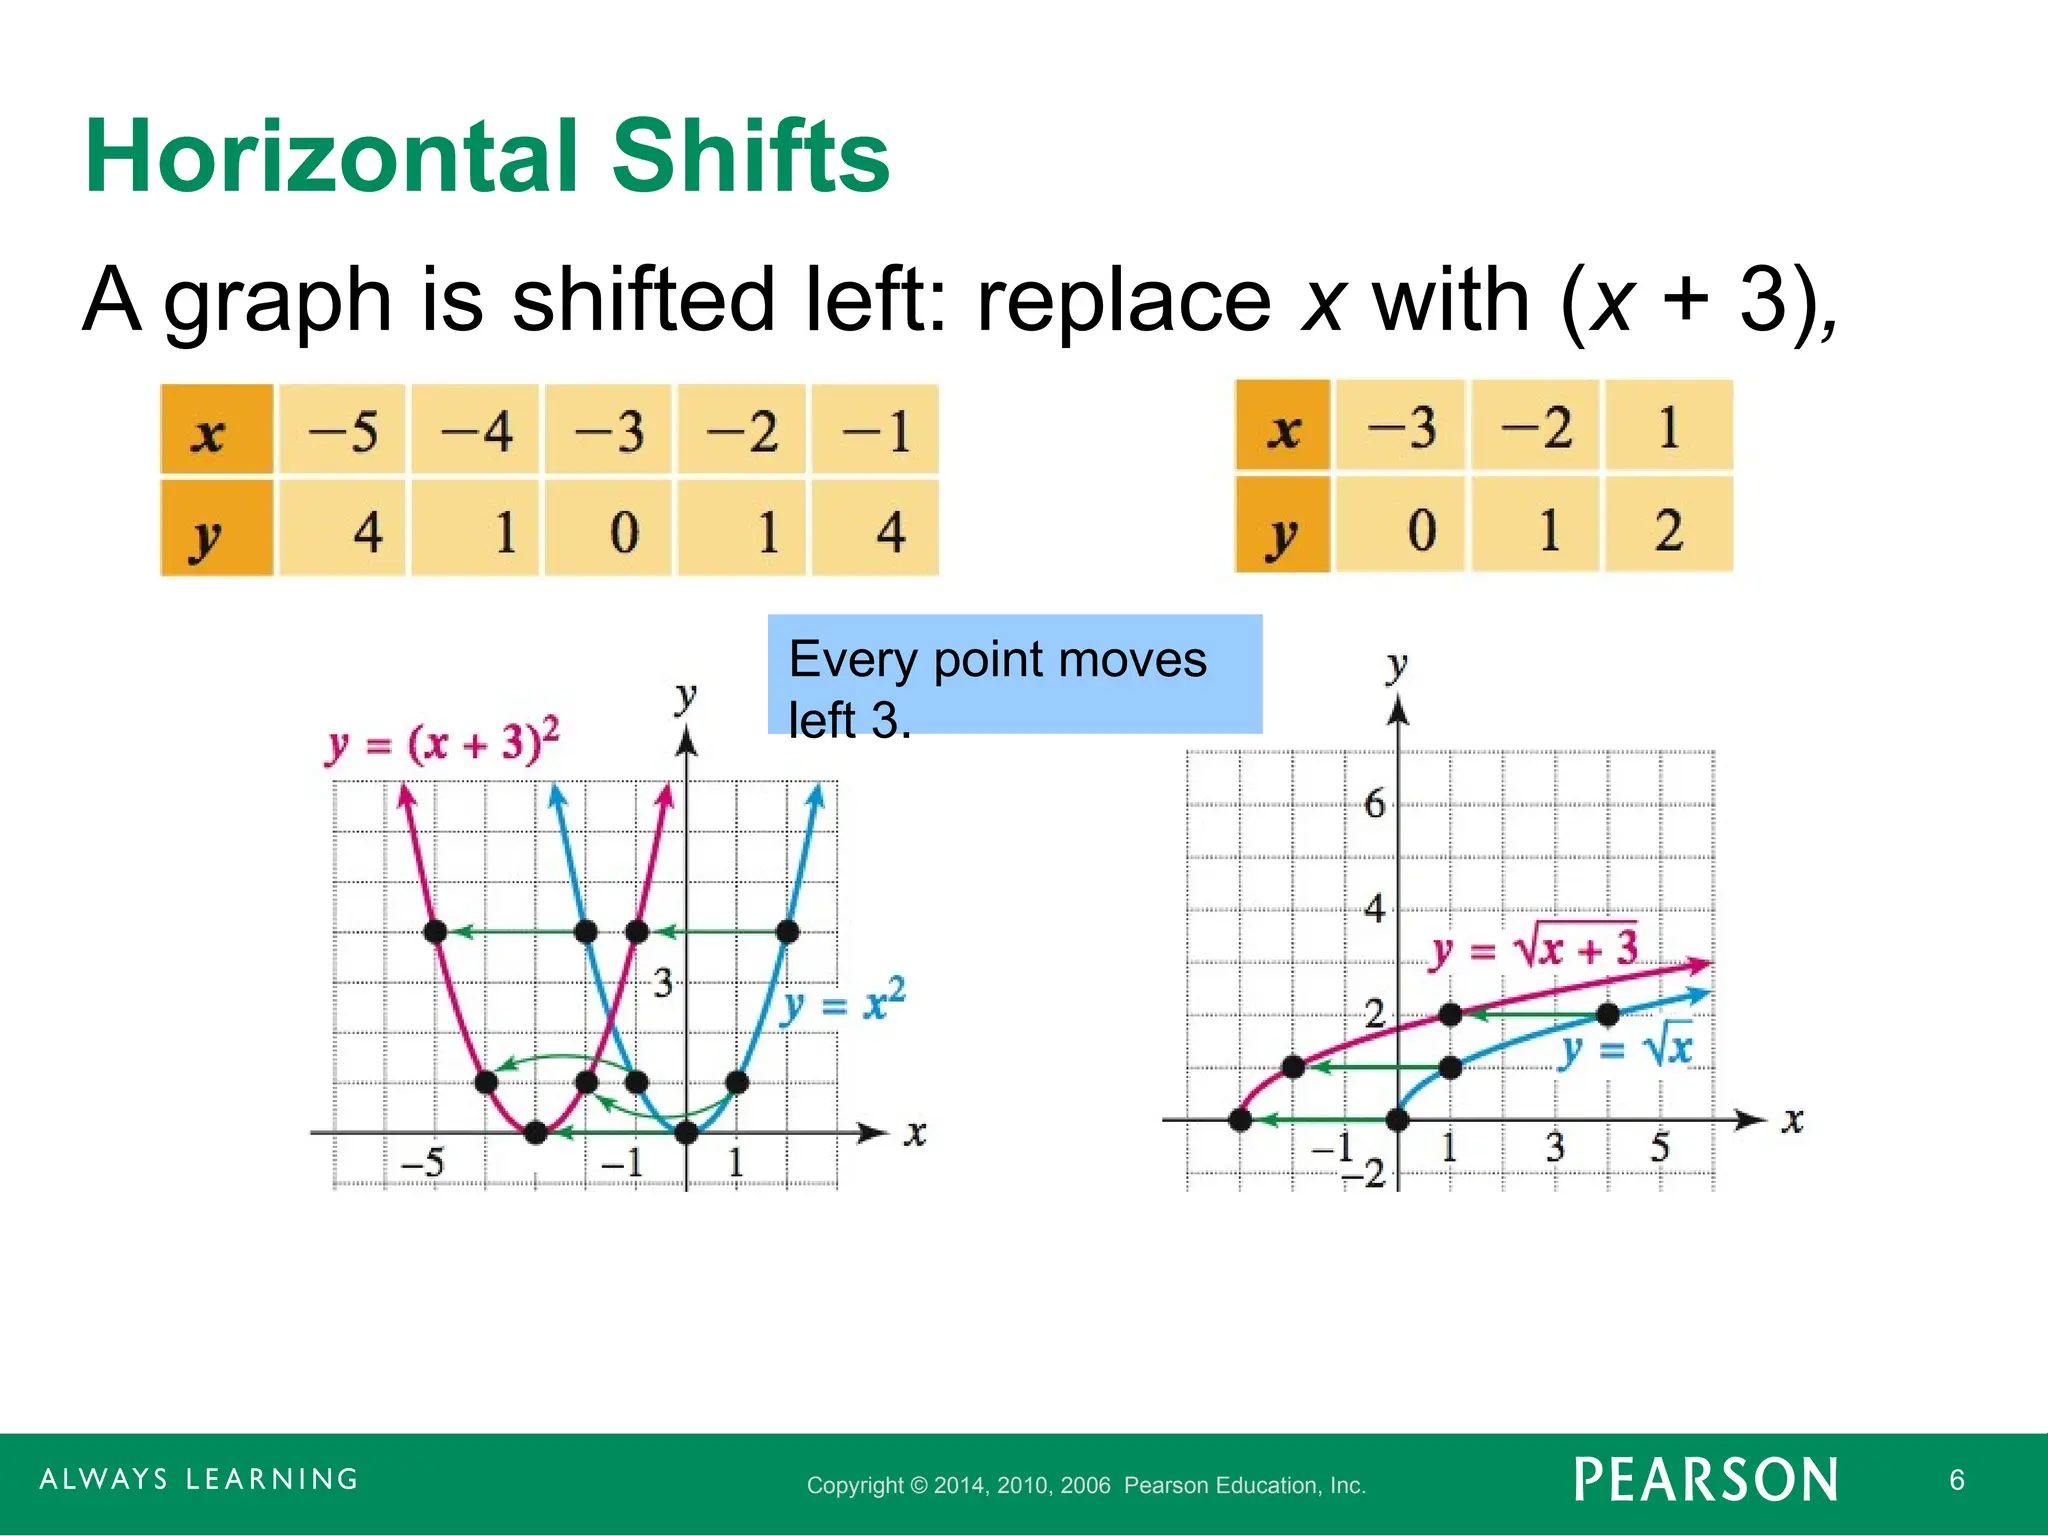
Horizontal Shifts
A graph is shifted left: replace x with (x + 3),
Every point moves
left 3.
- 7.
Copyright © 2014,2010, 2006 Pearson Education, Inc. 7
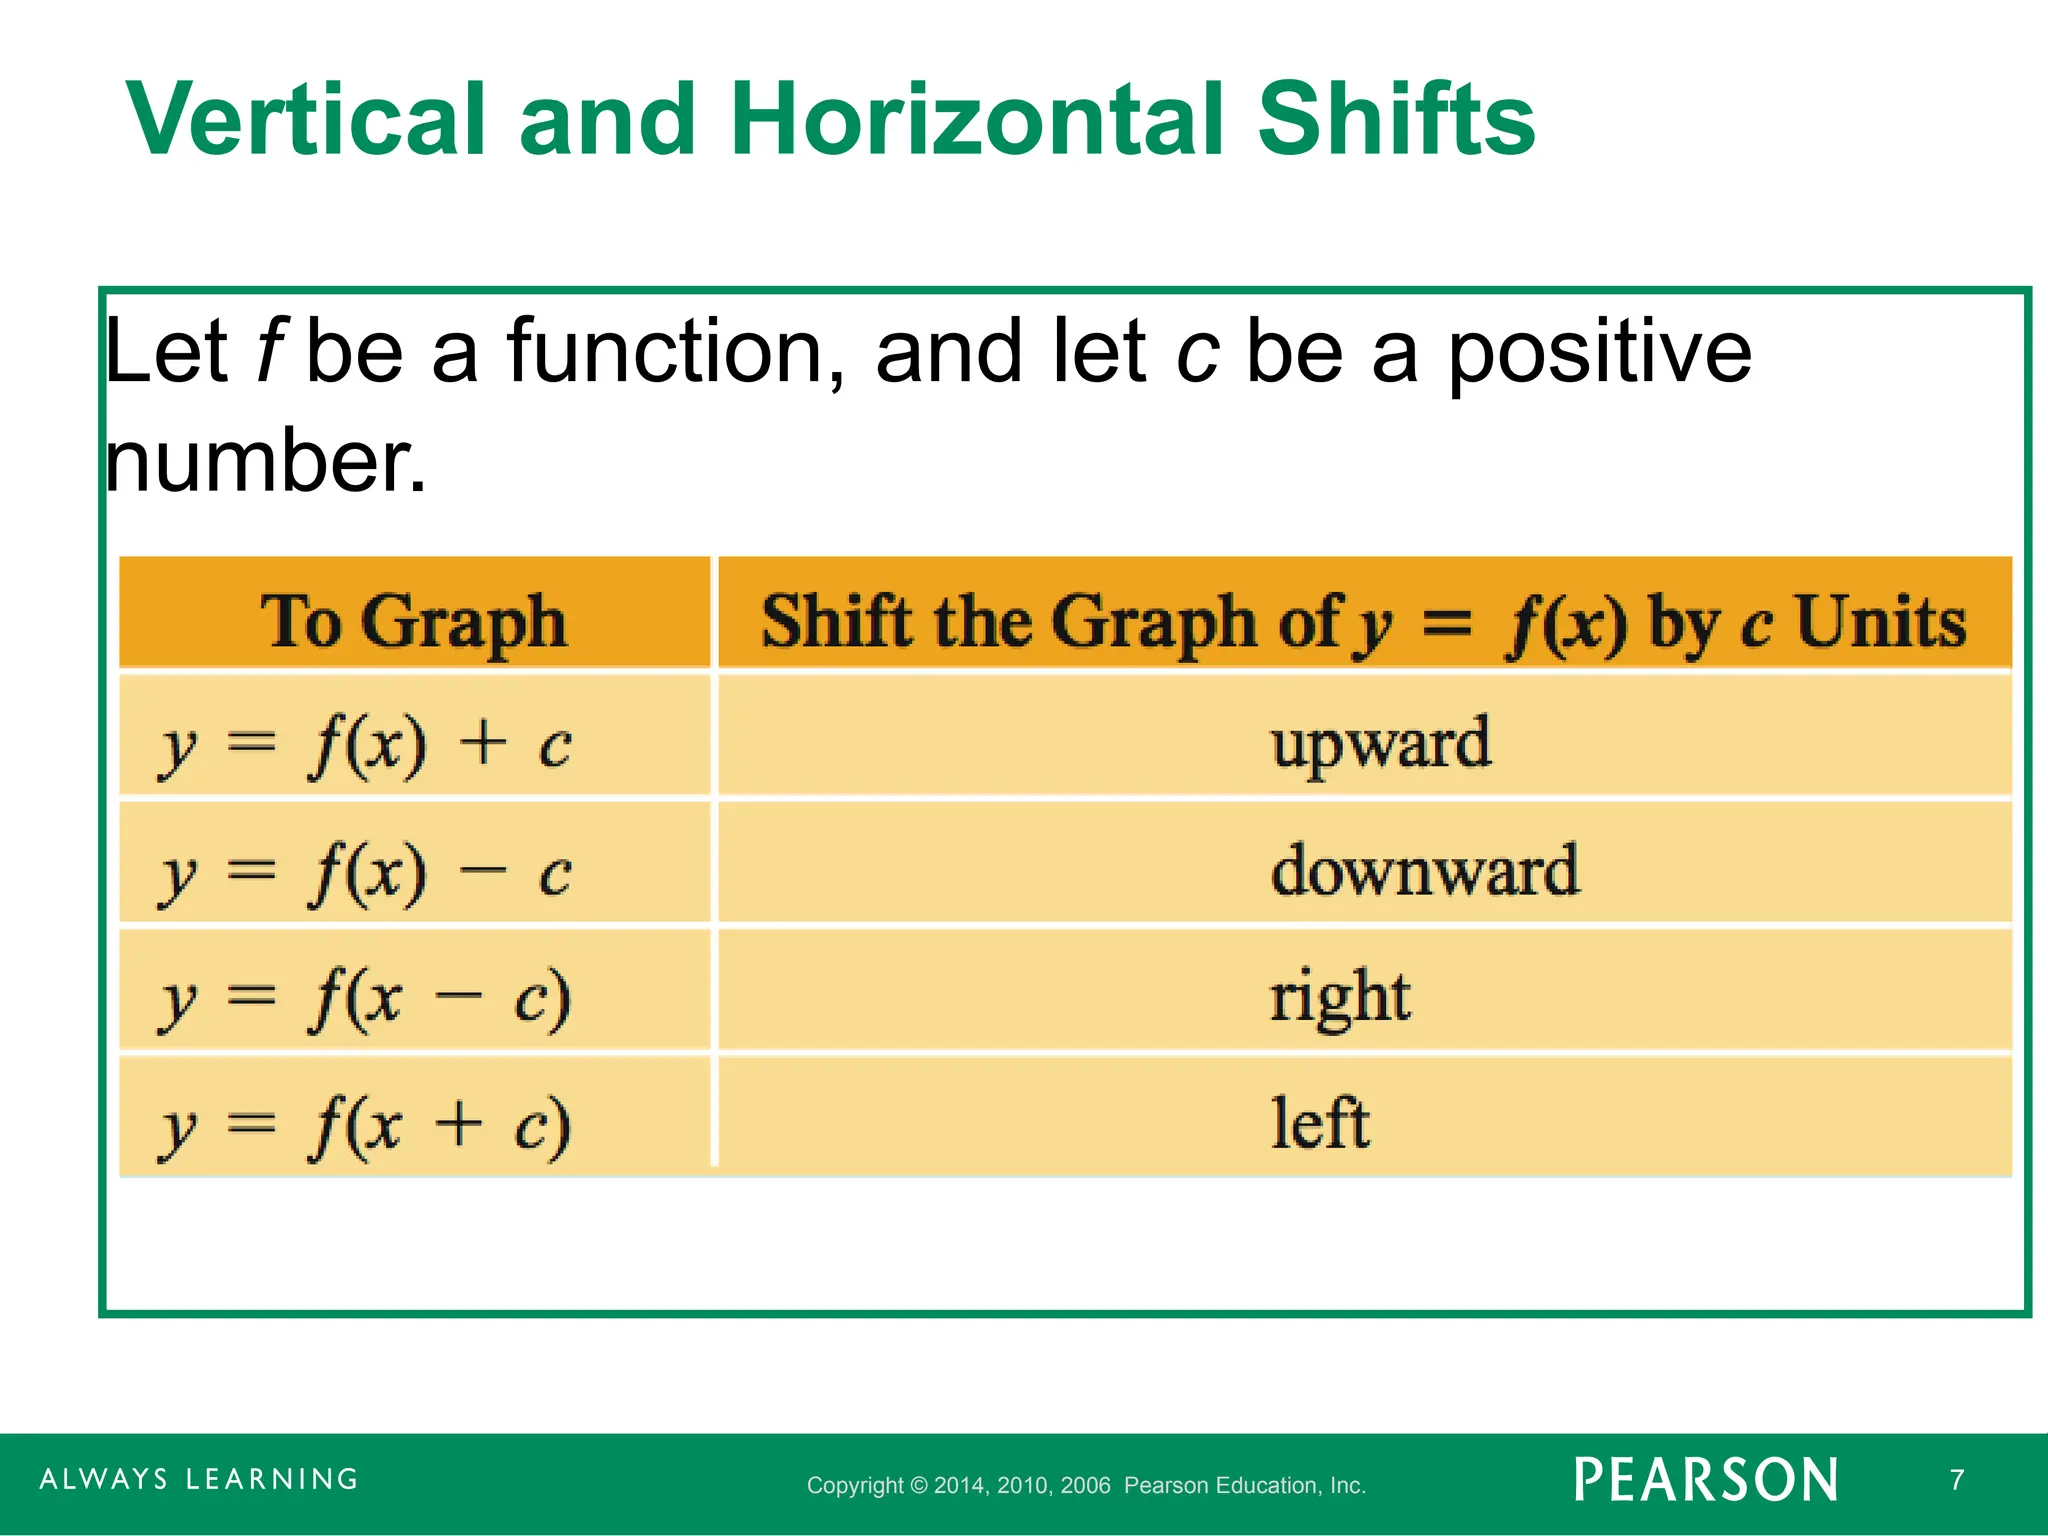
Vertical and Horizontal Shifts
Let f be a function, and let c be a positive
number.
- 8.
Copyright © 2014,2010, 2006 Pearson Education, Inc. 8
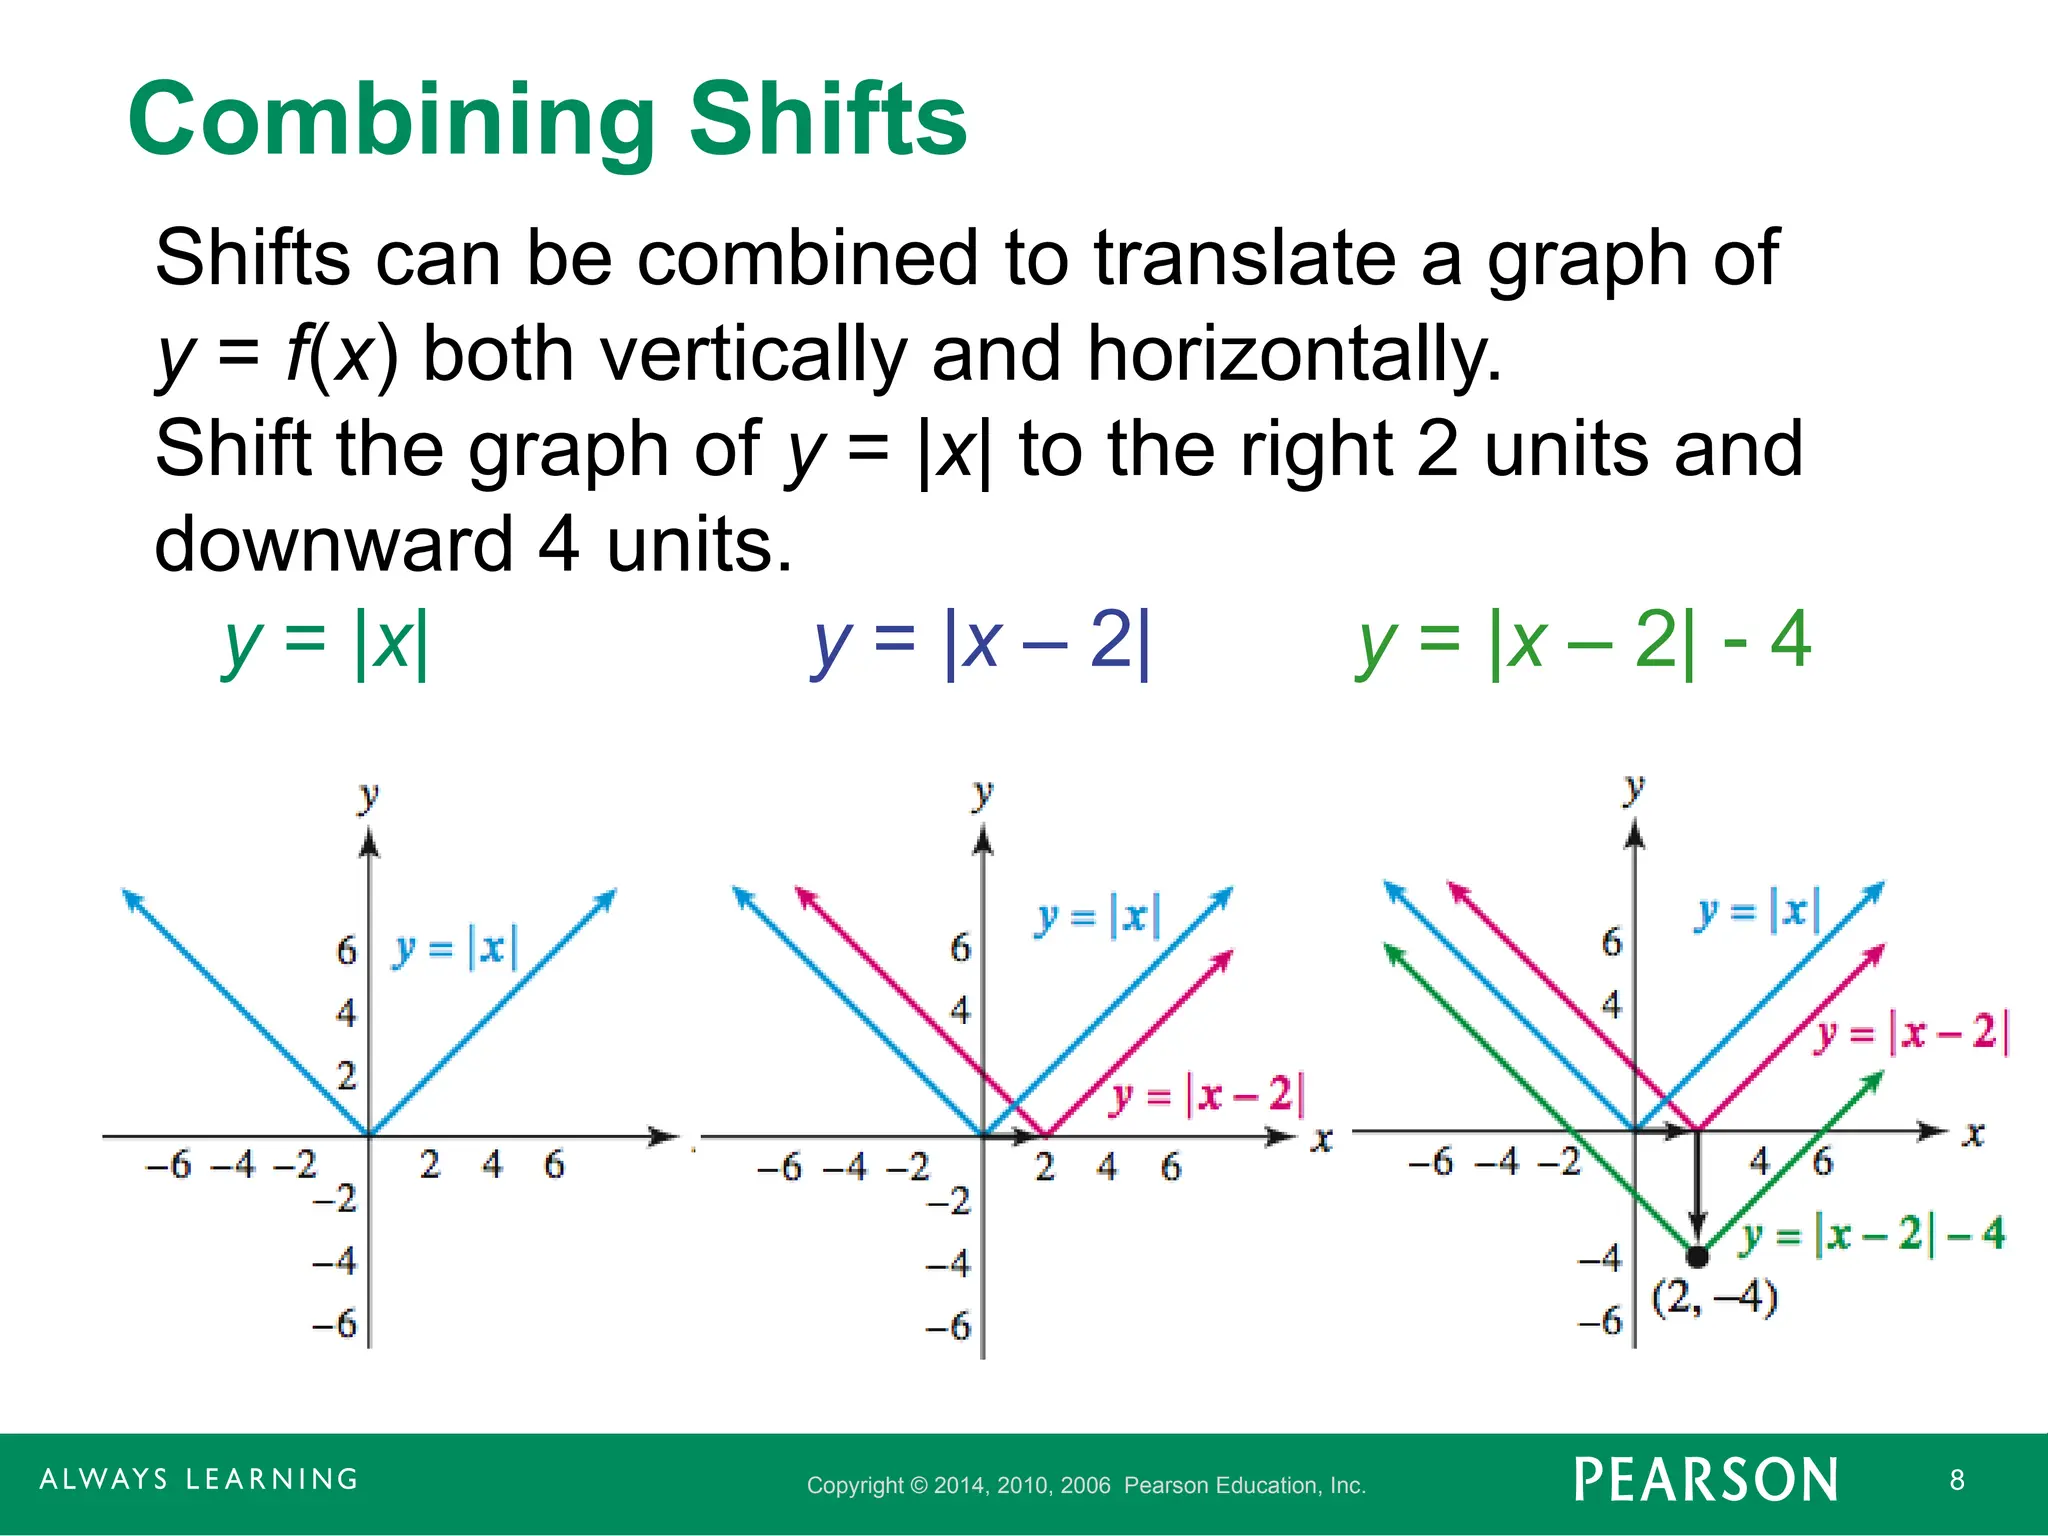
Combining Shifts
Shifts can be combined to translate a graph of
y = f(x) both vertically and horizontally.
Shift the graph of y = |x| to the right 2 units and
downward 4 units.
y = |x| y = |x – 2| y = |x – 2| 4
- 9.
Copyright © 2014,2010, 2006 Pearson Education, Inc. 9
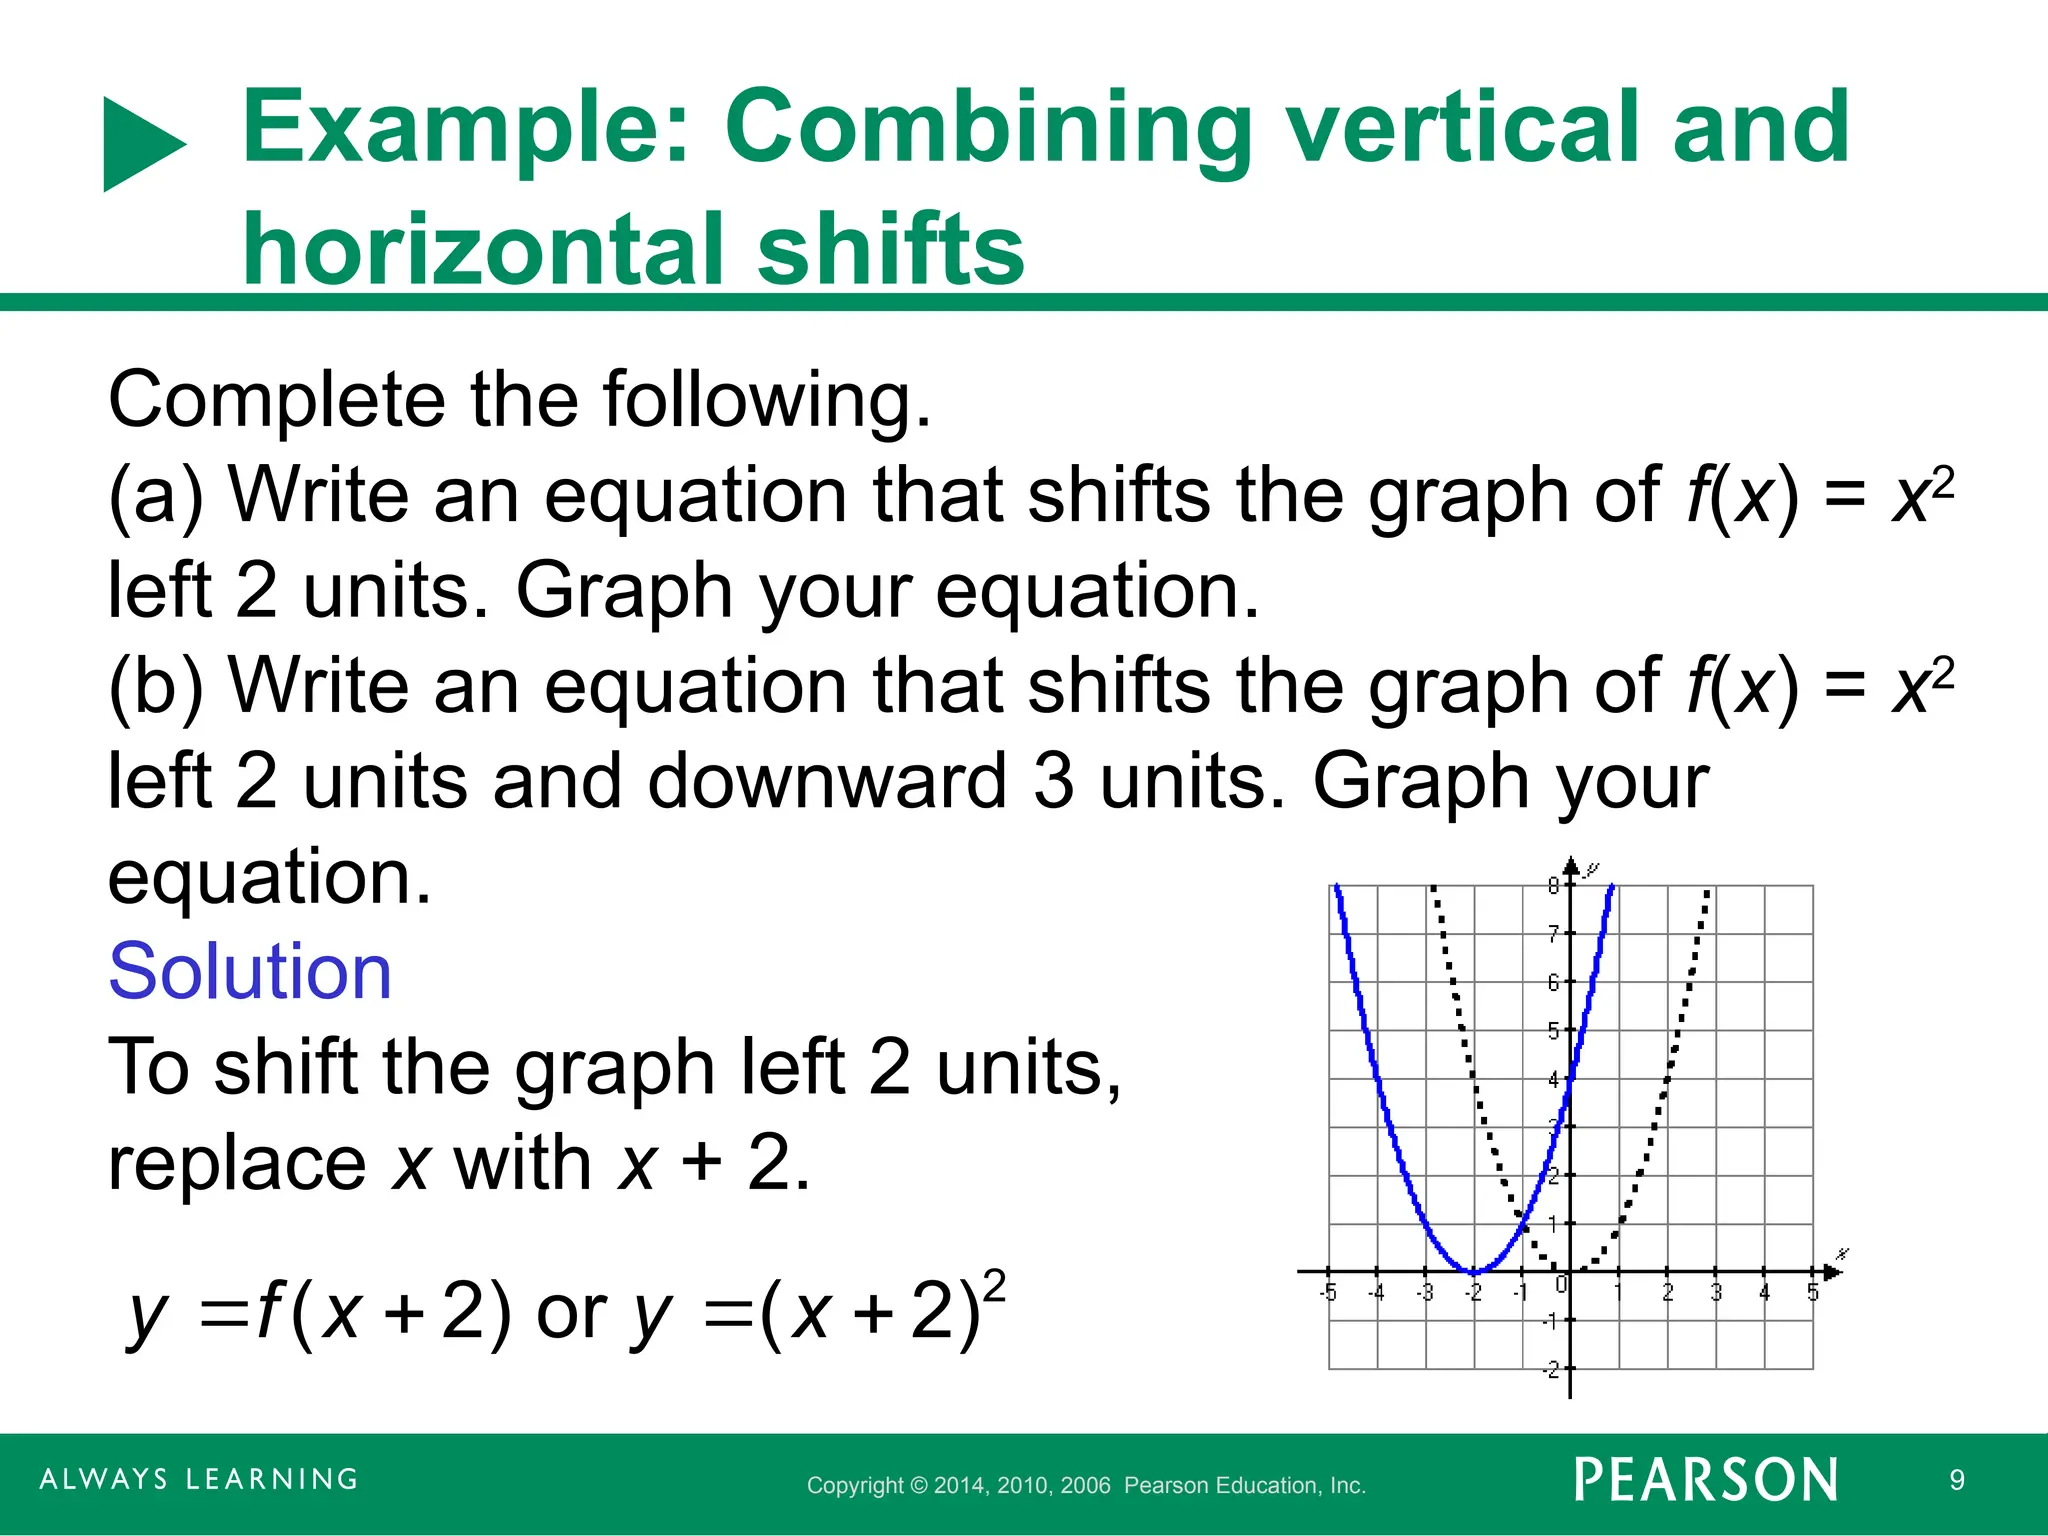
Example: Combining vertical and
horizontal shifts
Complete the following.
(a) Write an equation that shifts the graph of f(x) = x2
left 2 units. Graph your equation.
(b) Write an equation that shifts the graph of f(x) = x2
left 2 units and downward 3 units. Graph your
equation.
Solution
To shift the graph left 2 units,
replace x with x + 2.
2
( 2) or ( 2)
y f x y x
- 10.
Copyright © 2014,2010, 2006 Pearson Education, Inc. 10
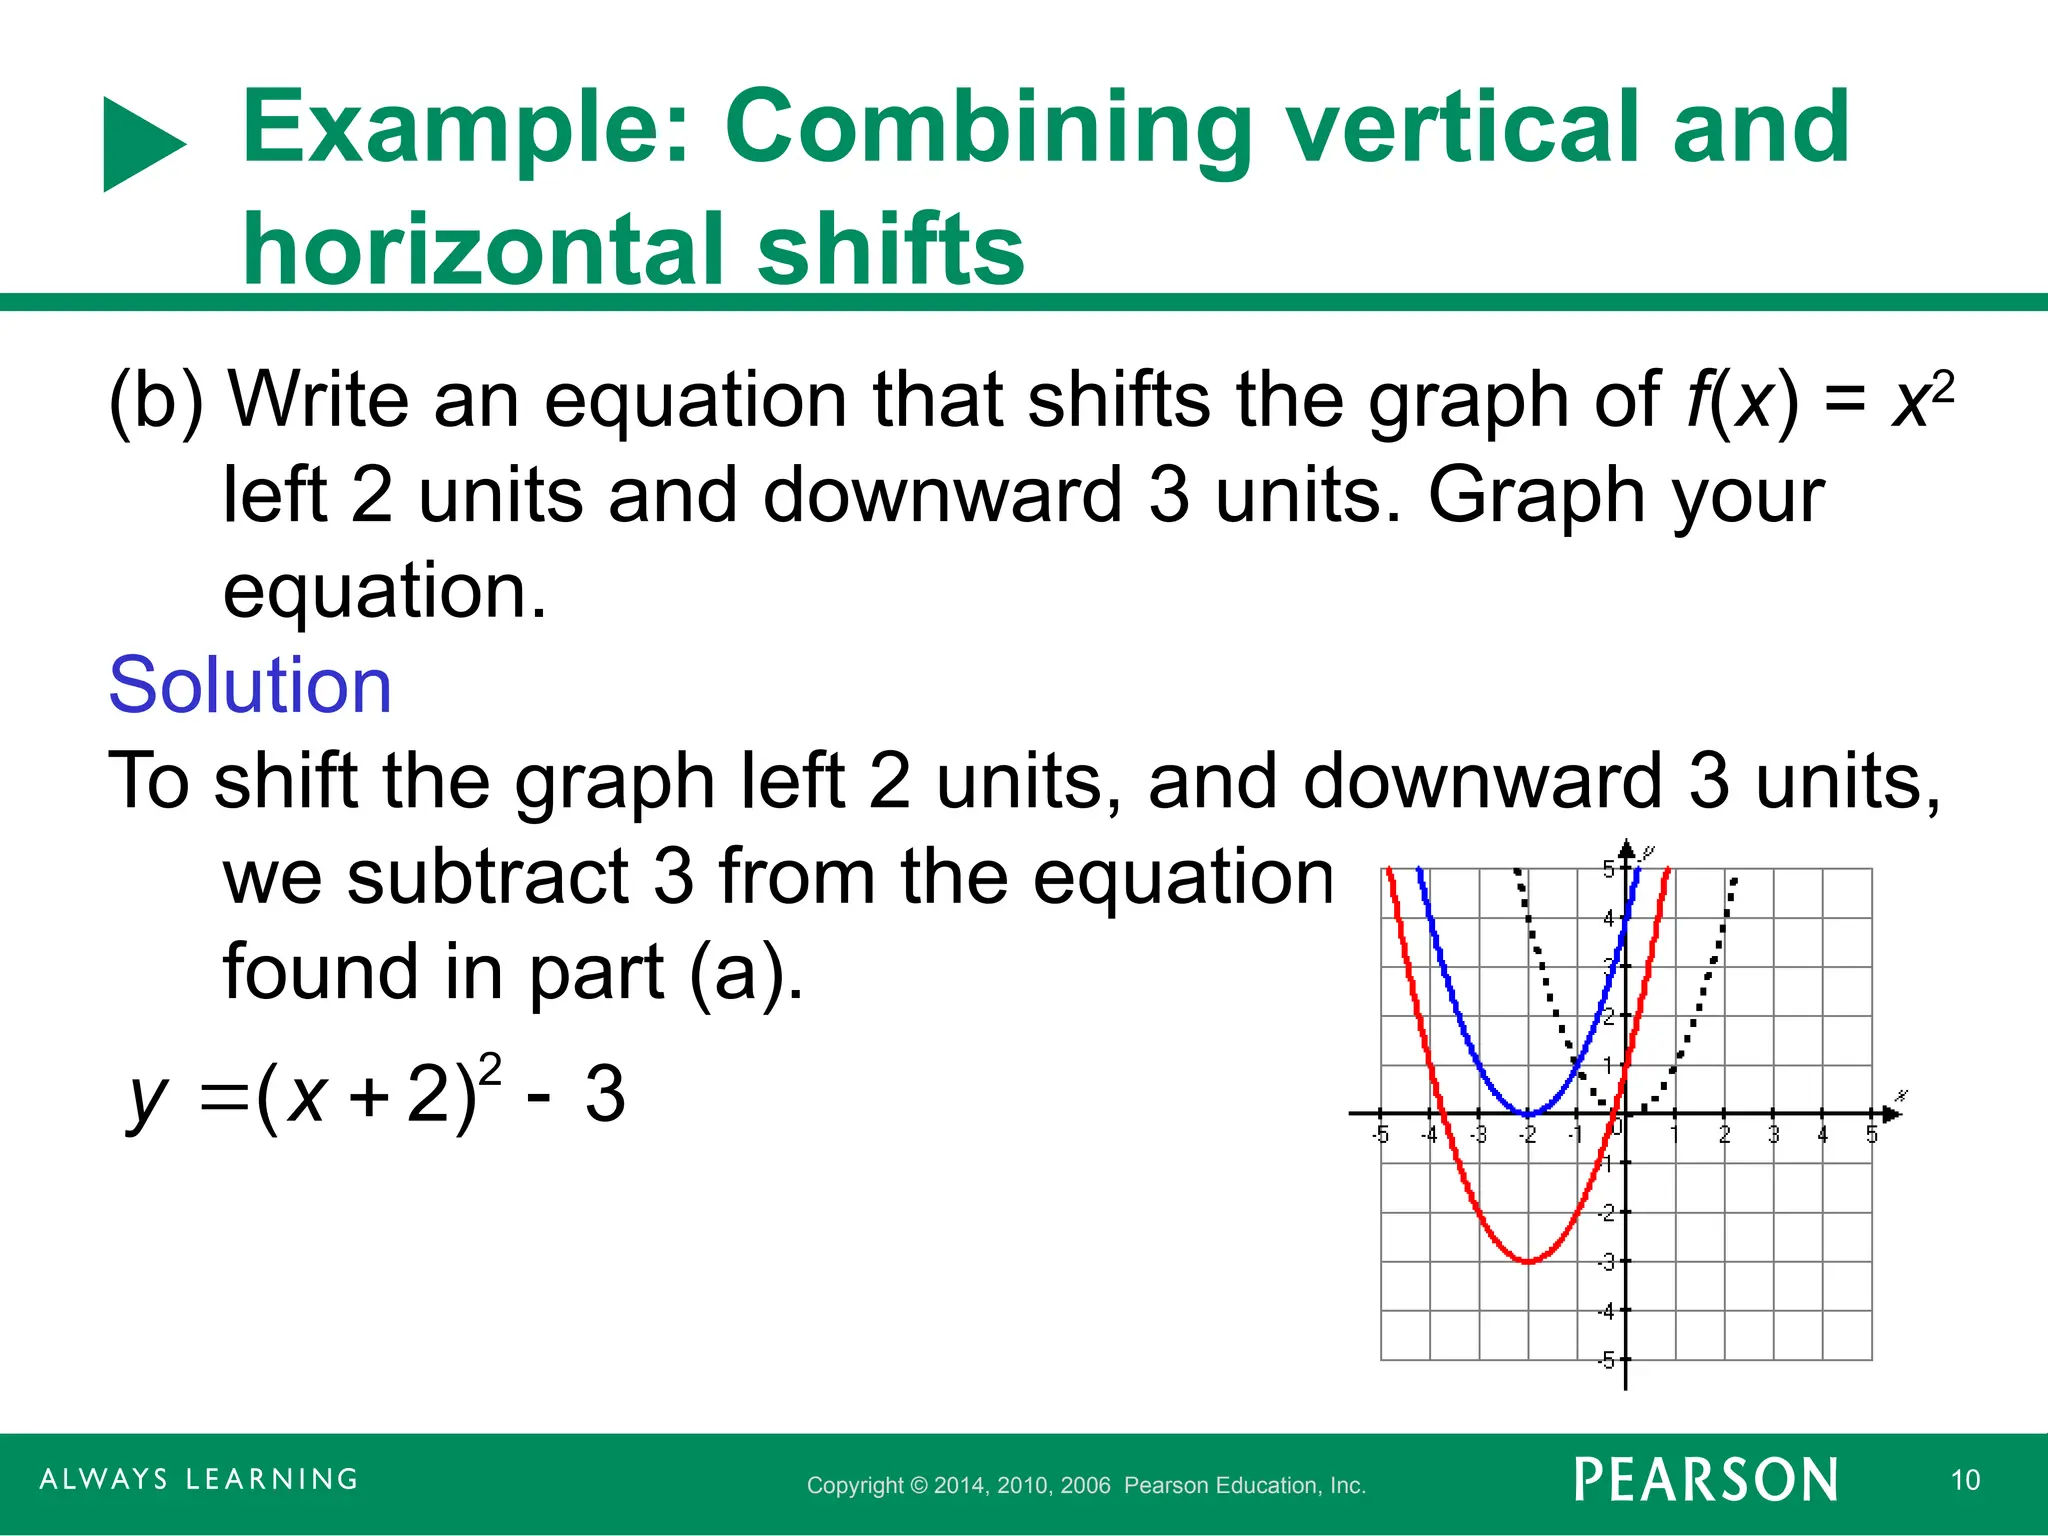
Example: Combining vertical and
horizontal shifts
(b) Write an equation that shifts the graph of f(x) = x2
left 2 units and downward 3 units. Graph your
equation.
Solution
To shift the graph left 2 units, and downward 3 units,
we subtract 3 from the equation
found in part (a).
2
( 2) 3
y x
- 11.
Copyright © 2014,2010, 2006 Pearson Education, Inc. 11
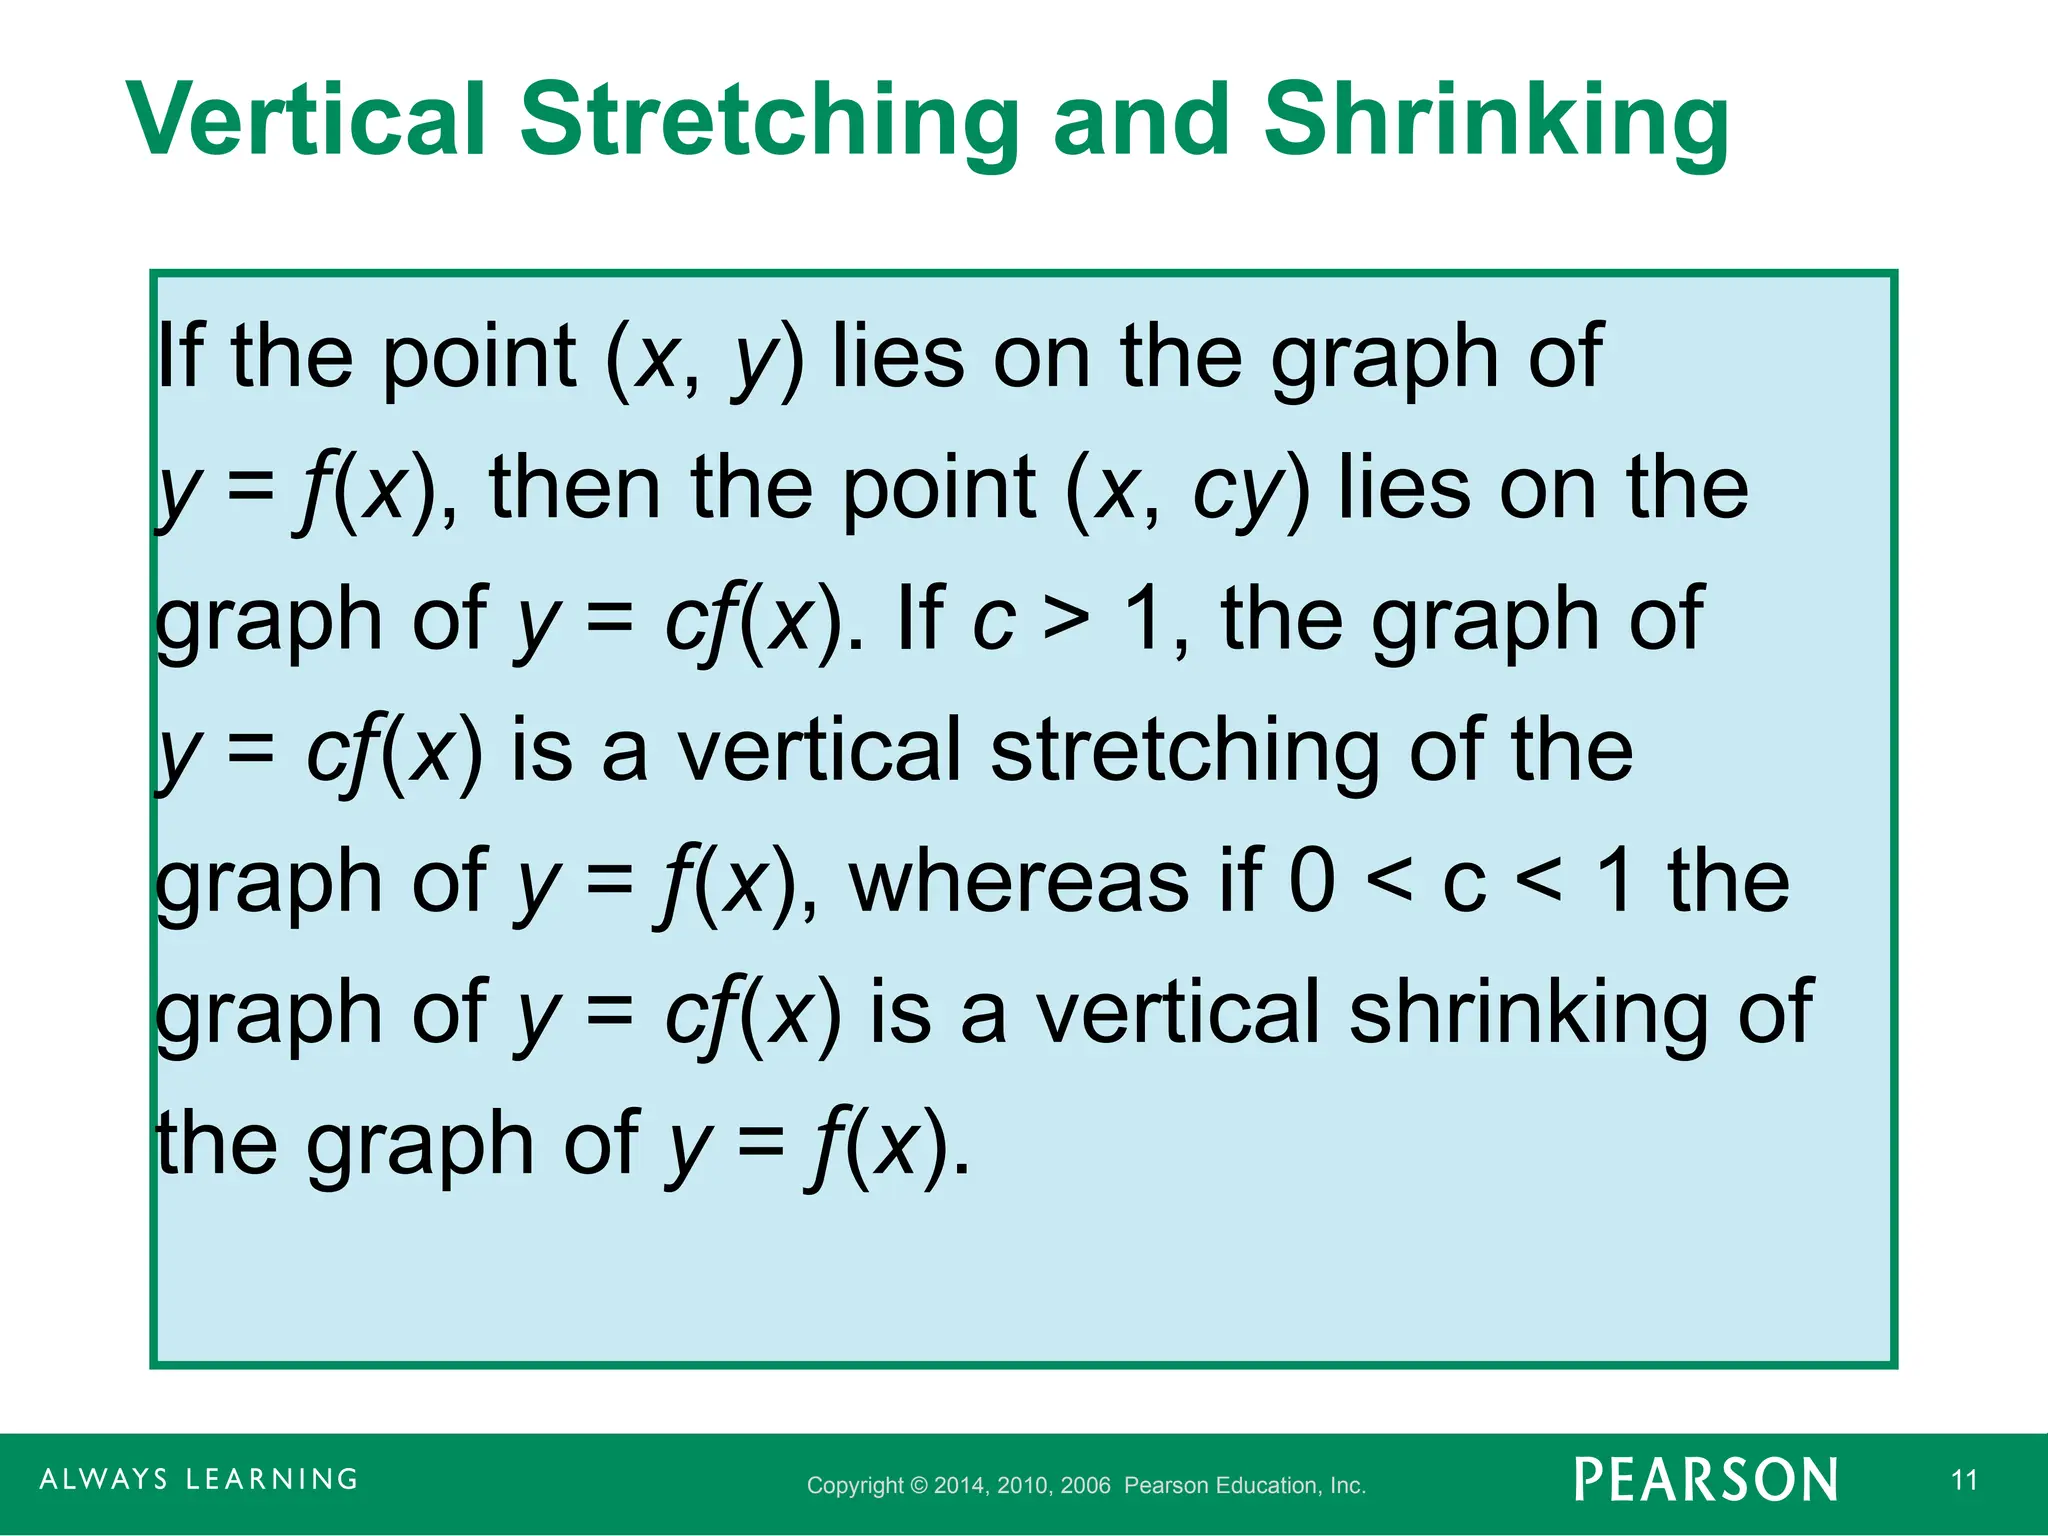
Vertical Stretching and Shrinking
If the point (x, y) lies on the graph of
y = f(x), then the point (x, cy) lies on the
graph of y = cf(x). If c > 1, the graph of
y = cf(x) is a vertical stretching of the
graph of y = f(x), whereas if 0 < c < 1 the
graph of y = cf(x) is a vertical shrinking of
the graph of y = f(x).
- 12.
Copyright © 2014,2010, 2006 Pearson Education, Inc. 12
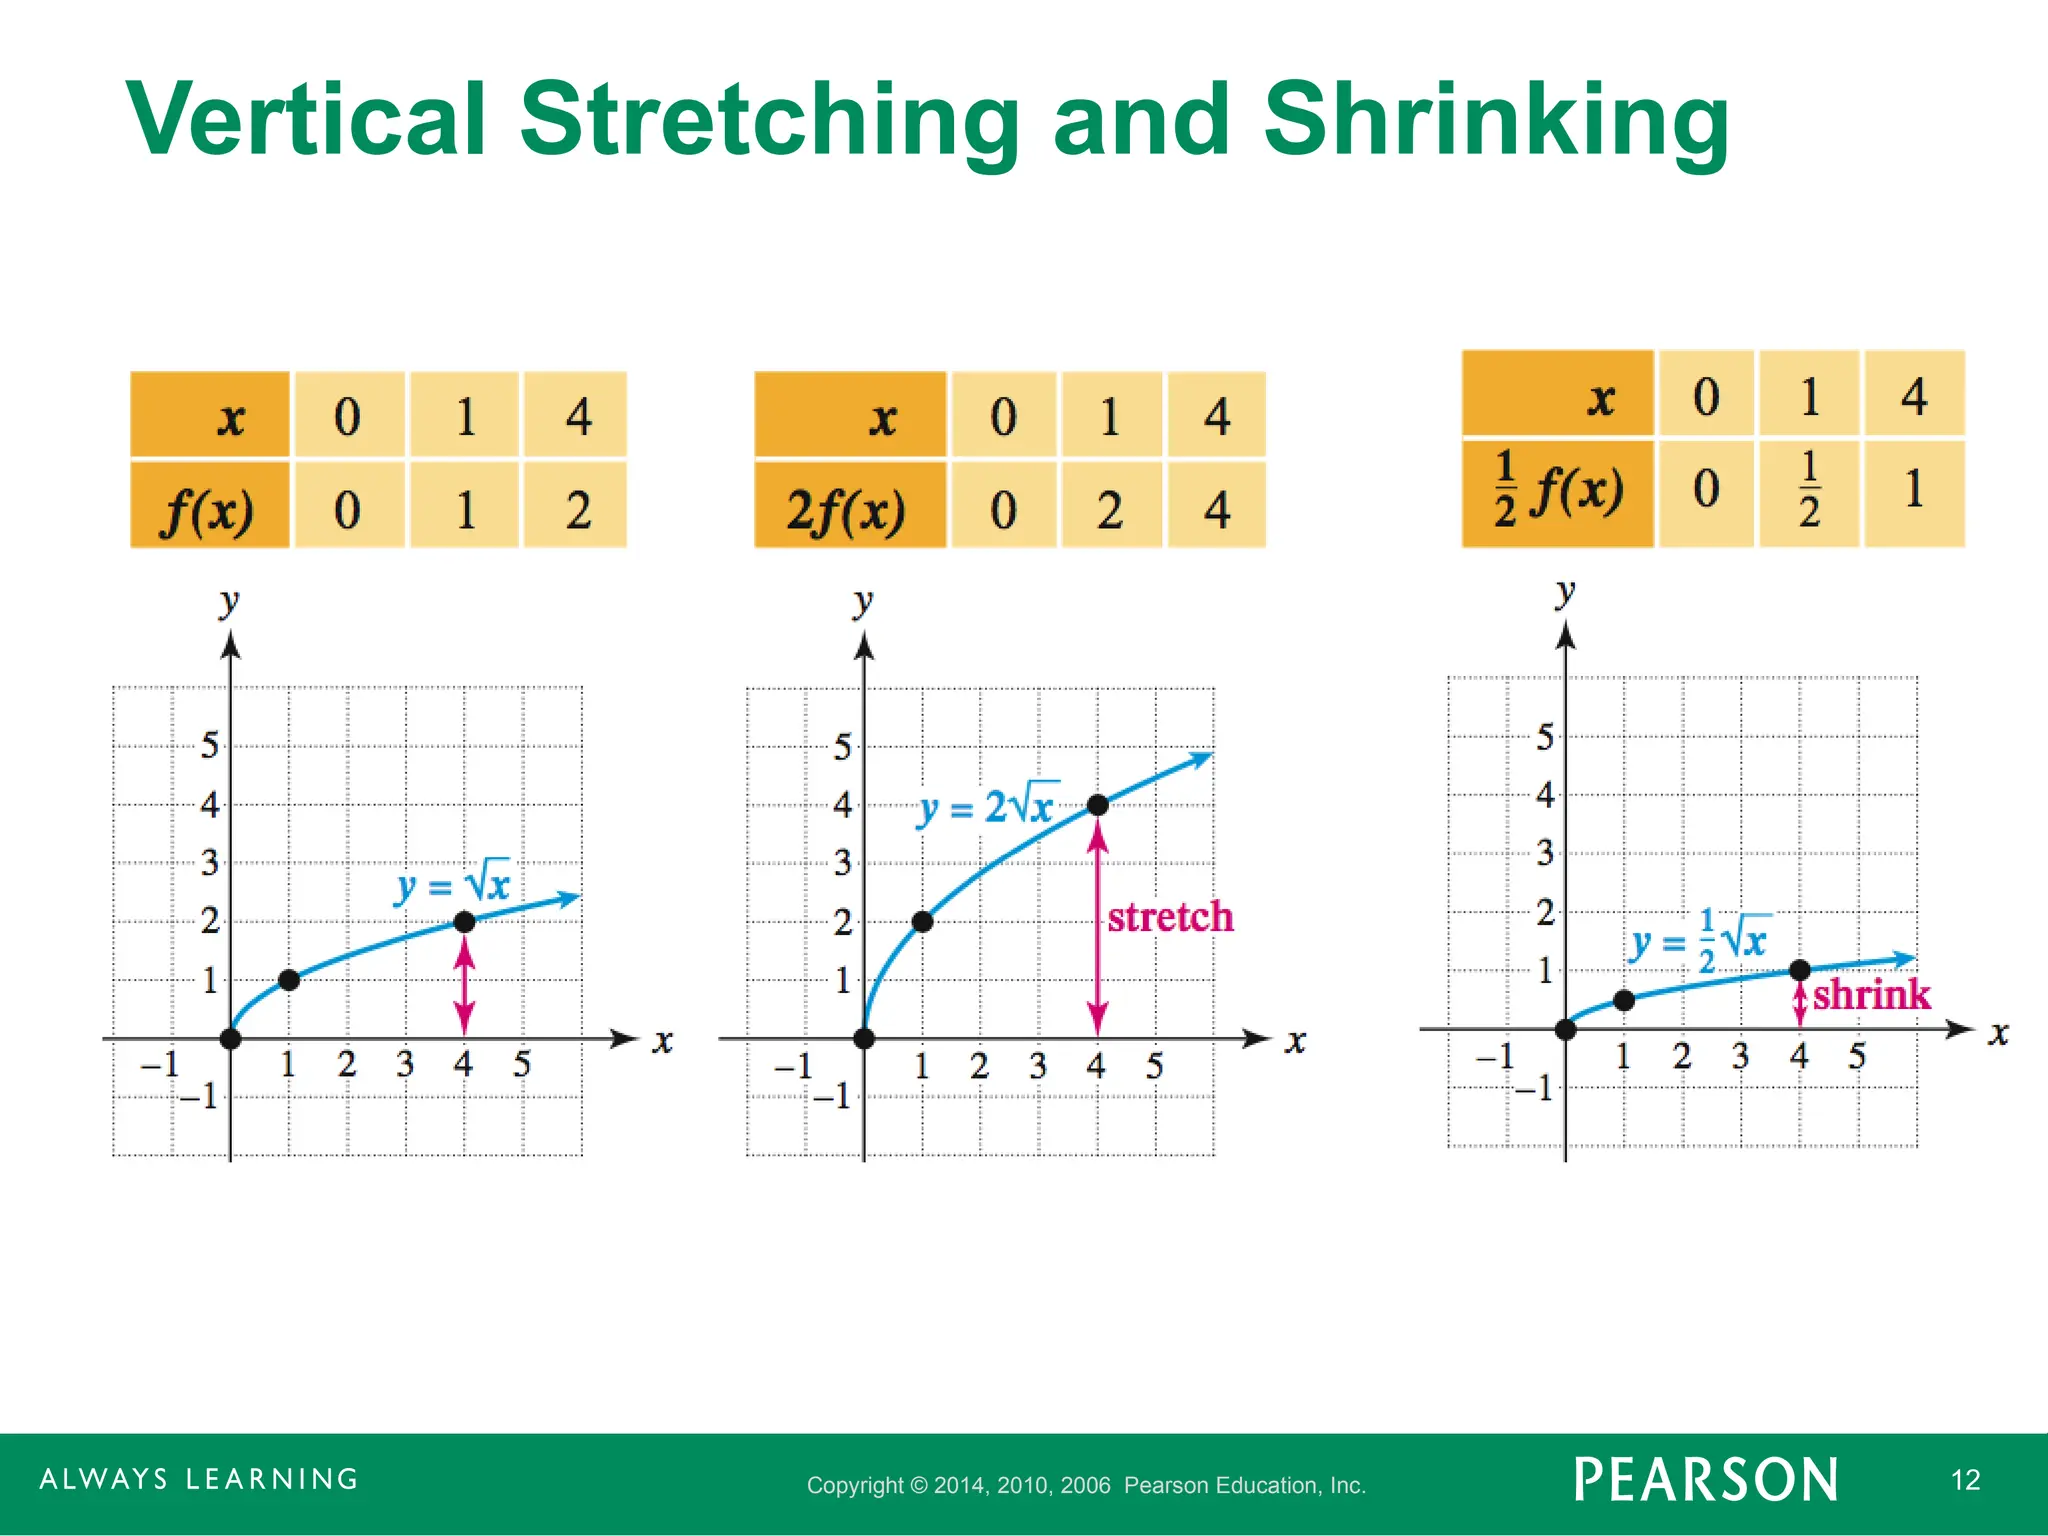
Vertical Stretching and Shrinking
- 13.
Copyright © 2014,2010, 2006 Pearson Education, Inc. 13
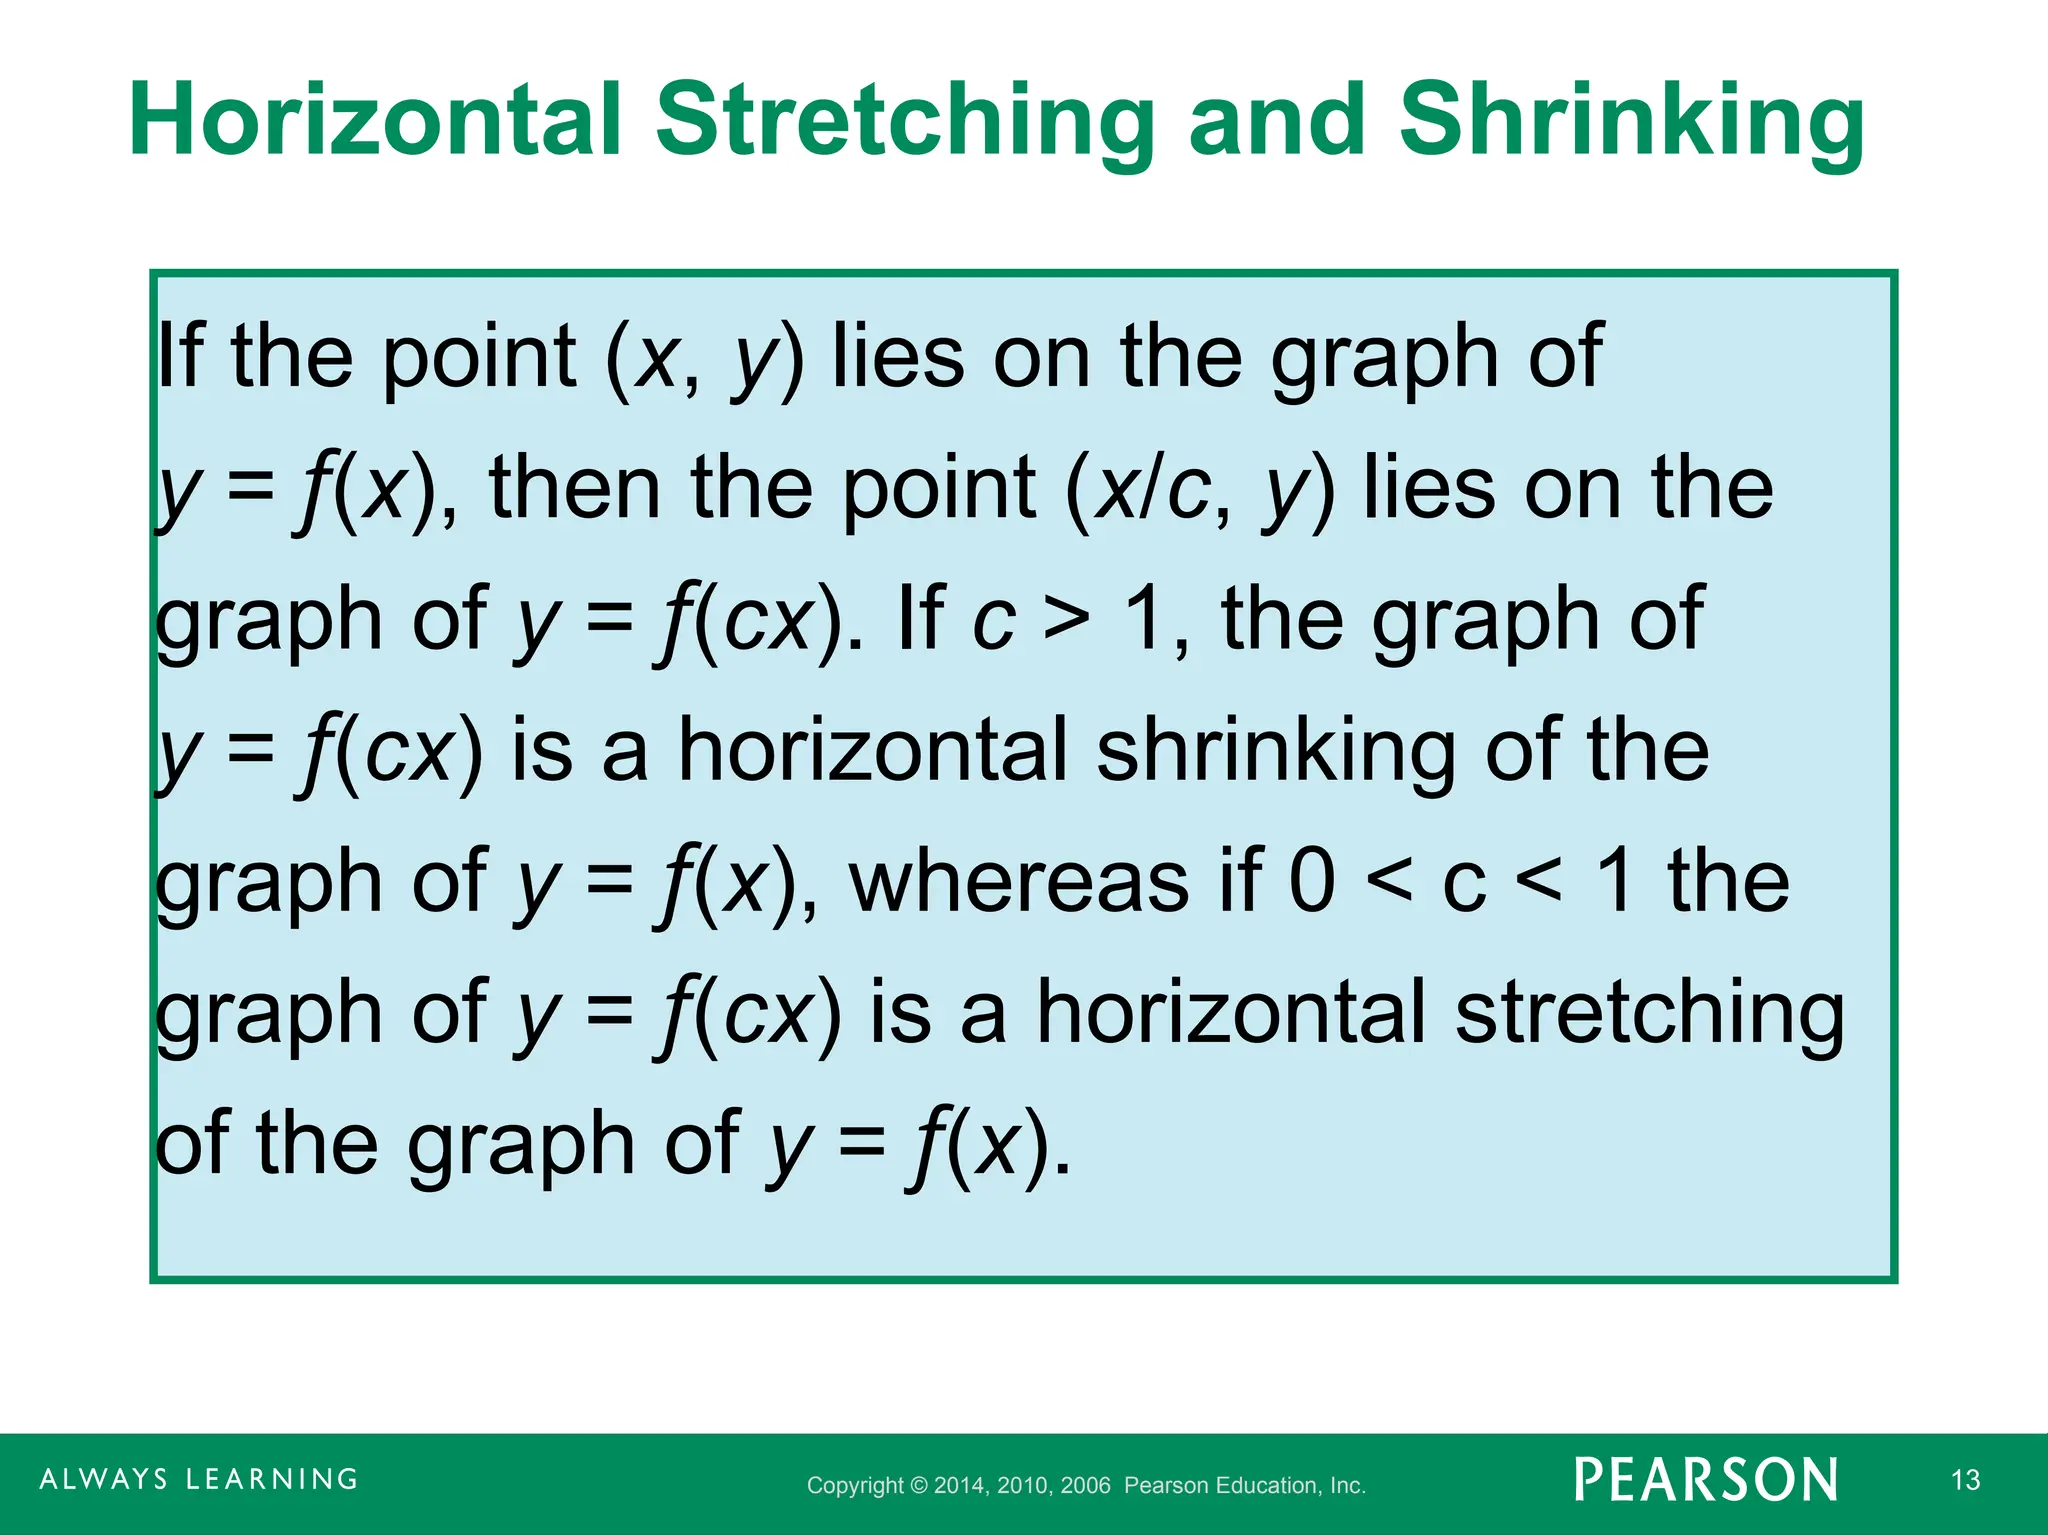
Horizontal Stretching and Shrinking
If the point (x, y) lies on the graph of
y = f(x), then the point (x/c, y) lies on the
graph of y = f(cx). If c > 1, the graph of
y = f(cx) is a horizontal shrinking of the
graph of y = f(x), whereas if 0 < c < 1 the
graph of y = f(cx) is a horizontal stretching
of the graph of y = f(x).
- 14.
Copyright © 2014,2010, 2006 Pearson Education, Inc. 14
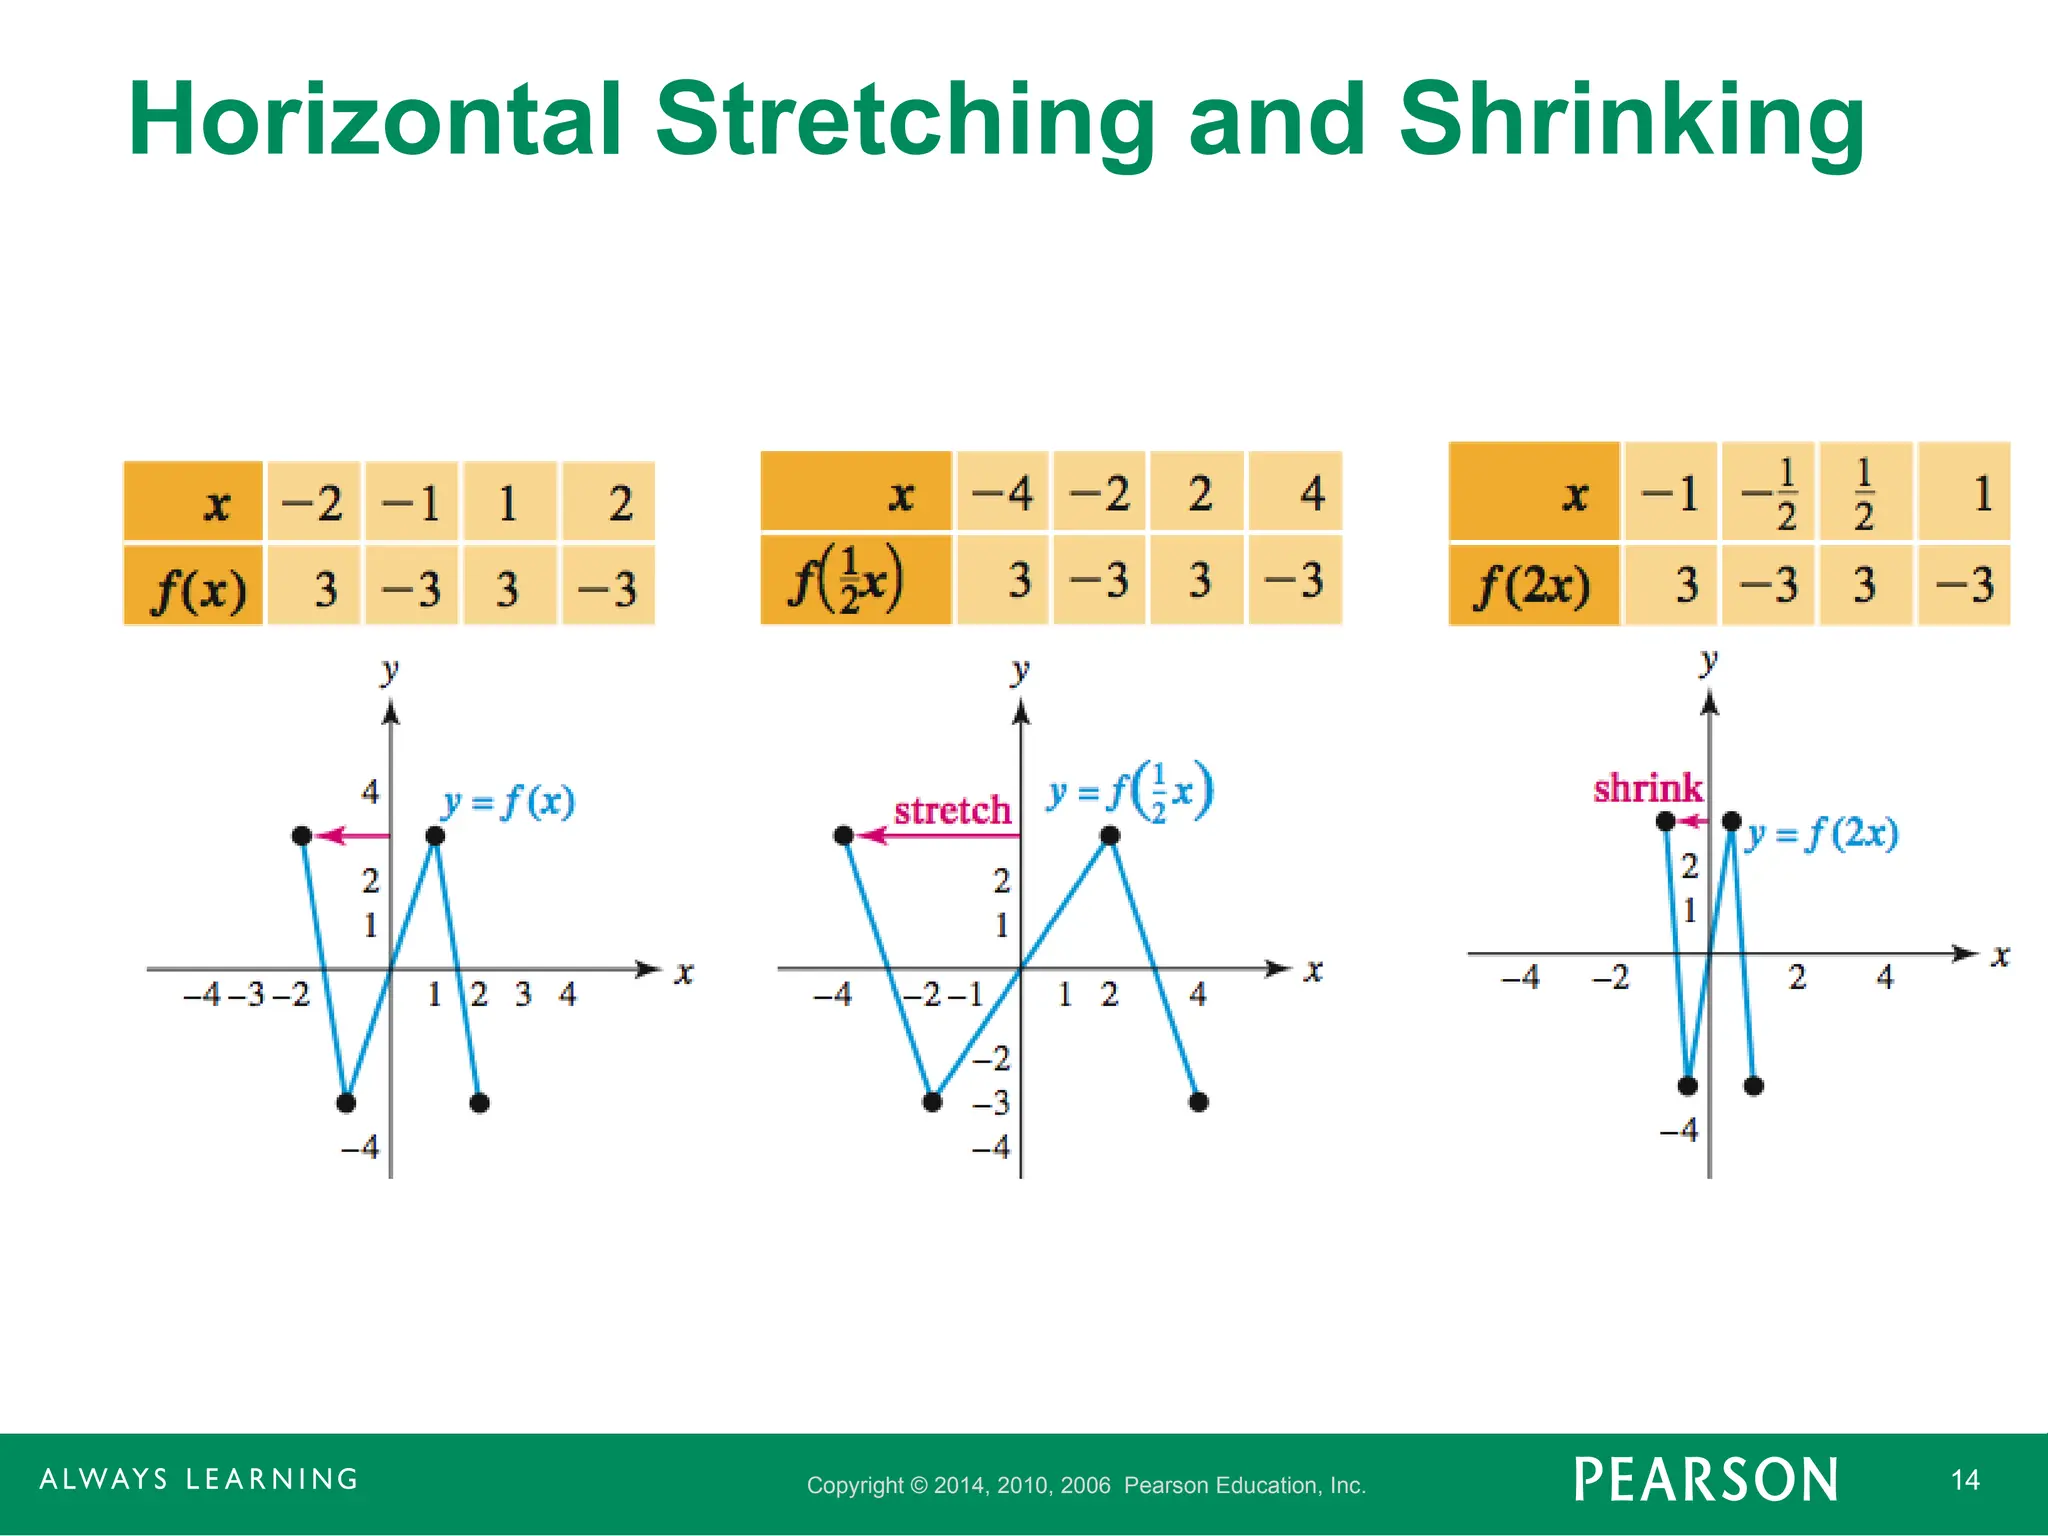
Horizontal Stretching and Shrinking
- 15.
Copyright © 2014,2010, 2006 Pearson Education, Inc. 15
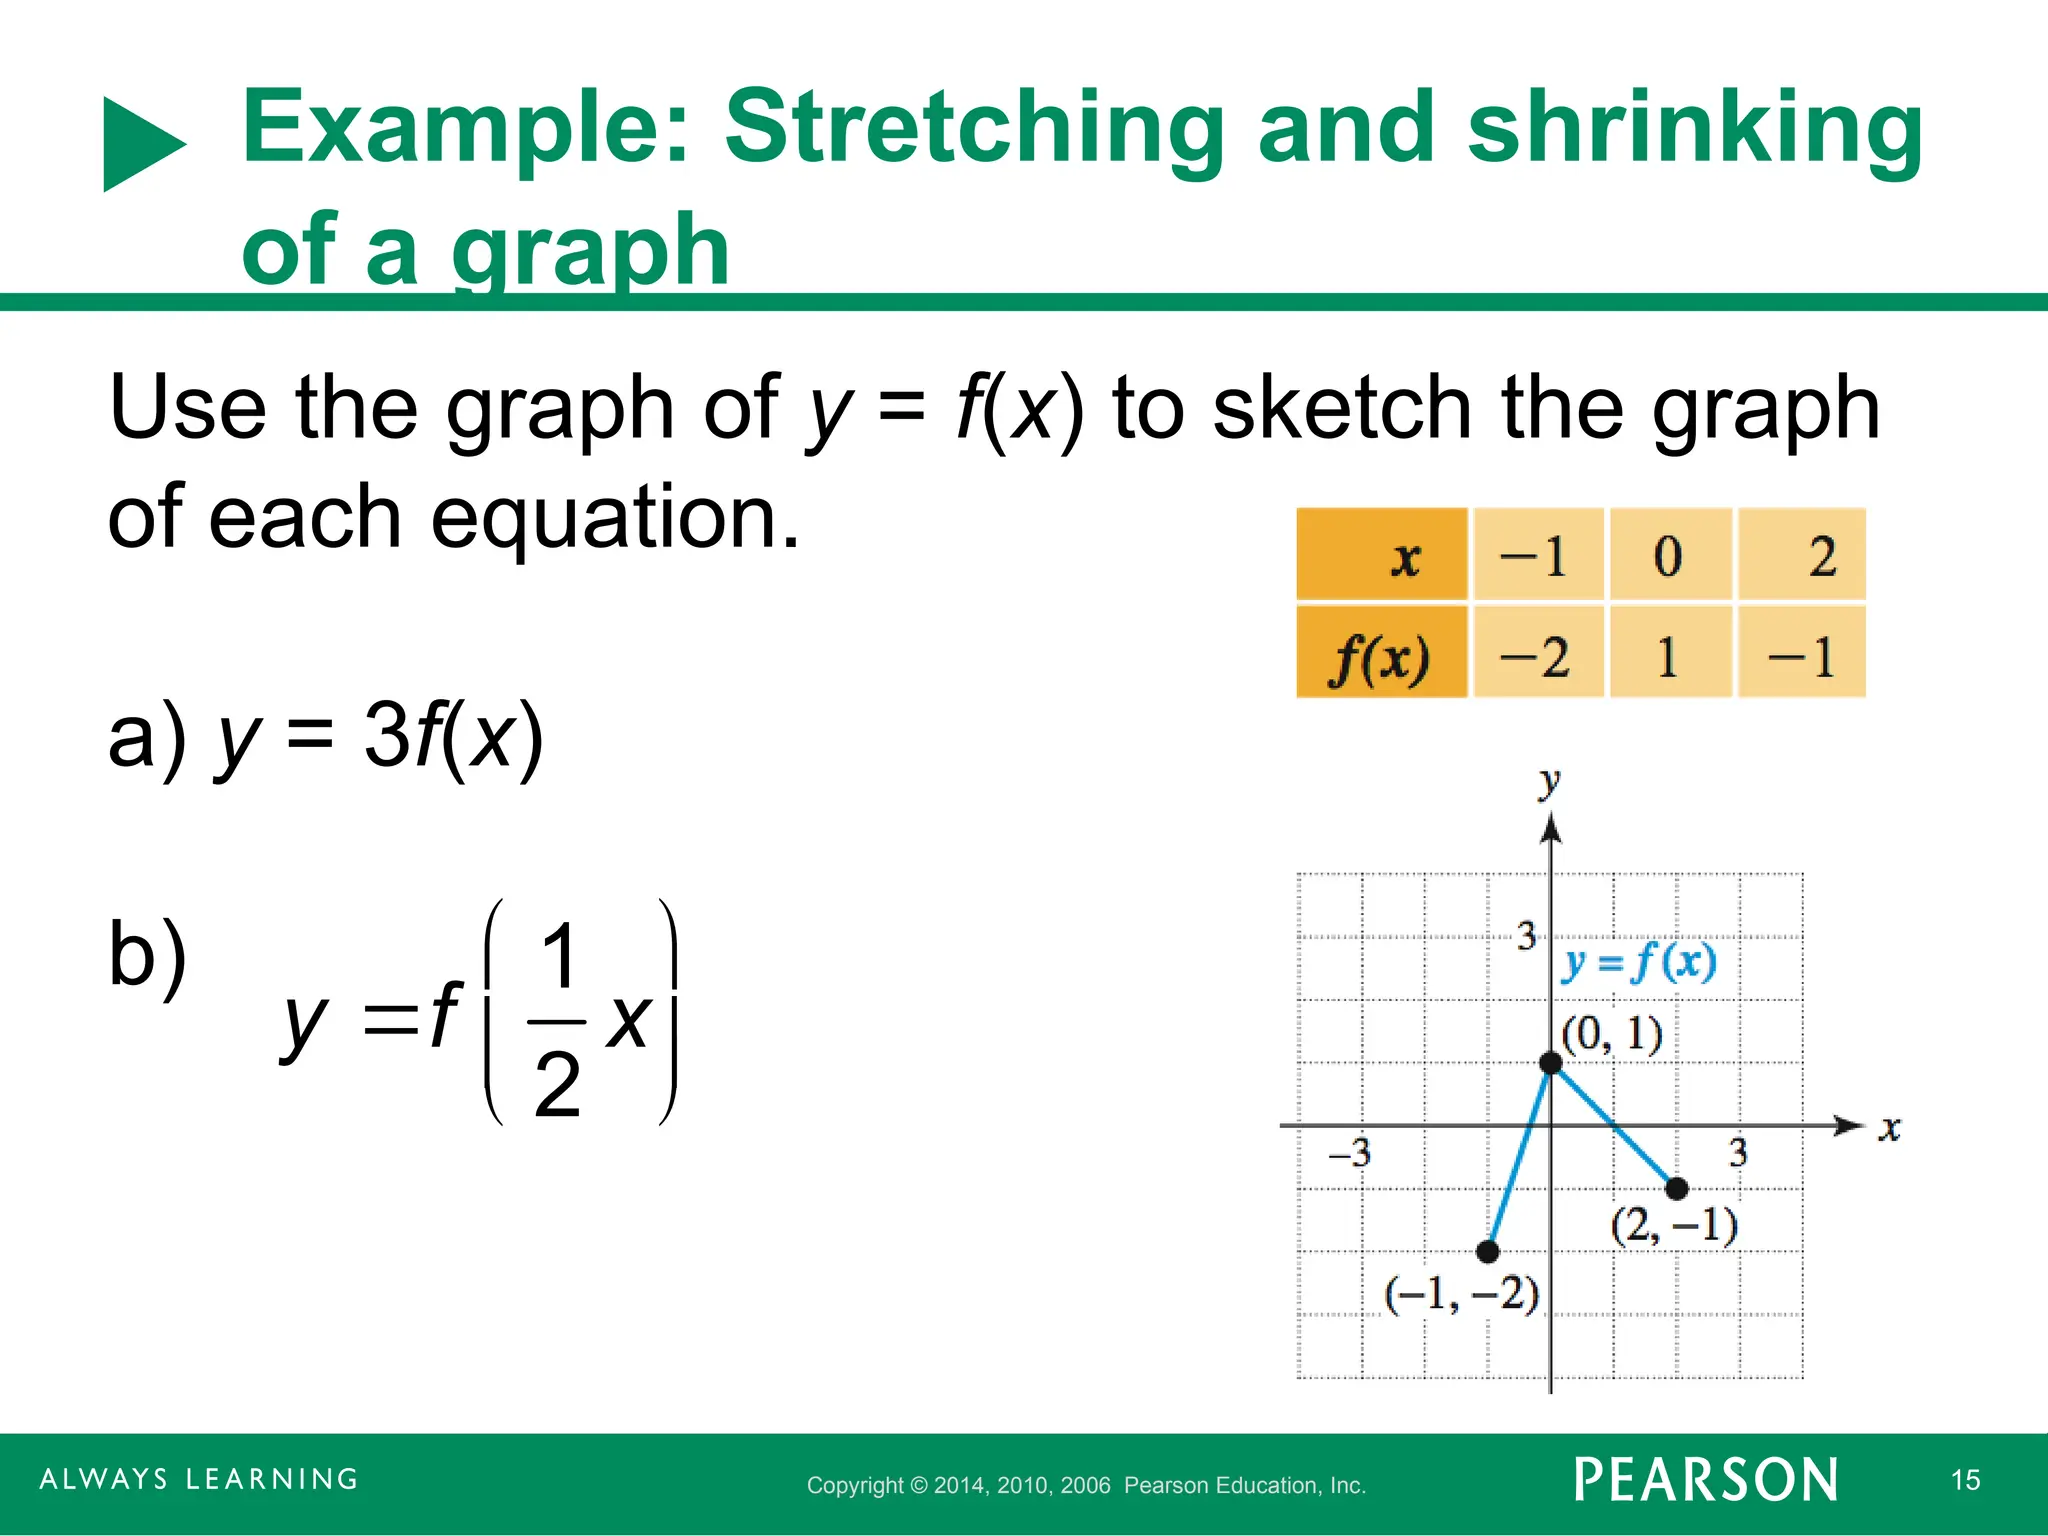
Example: Stretching and shrinking
of a graph
Use the graph of y = f(x) to sketch the graph
of each equation.
a) y = 3f(x)
b)
y f
1
2
x
- 16.
Copyright © 2014,2010, 2006 Pearson Education, Inc. 16
Example: Stretching and shrinking
of a graph
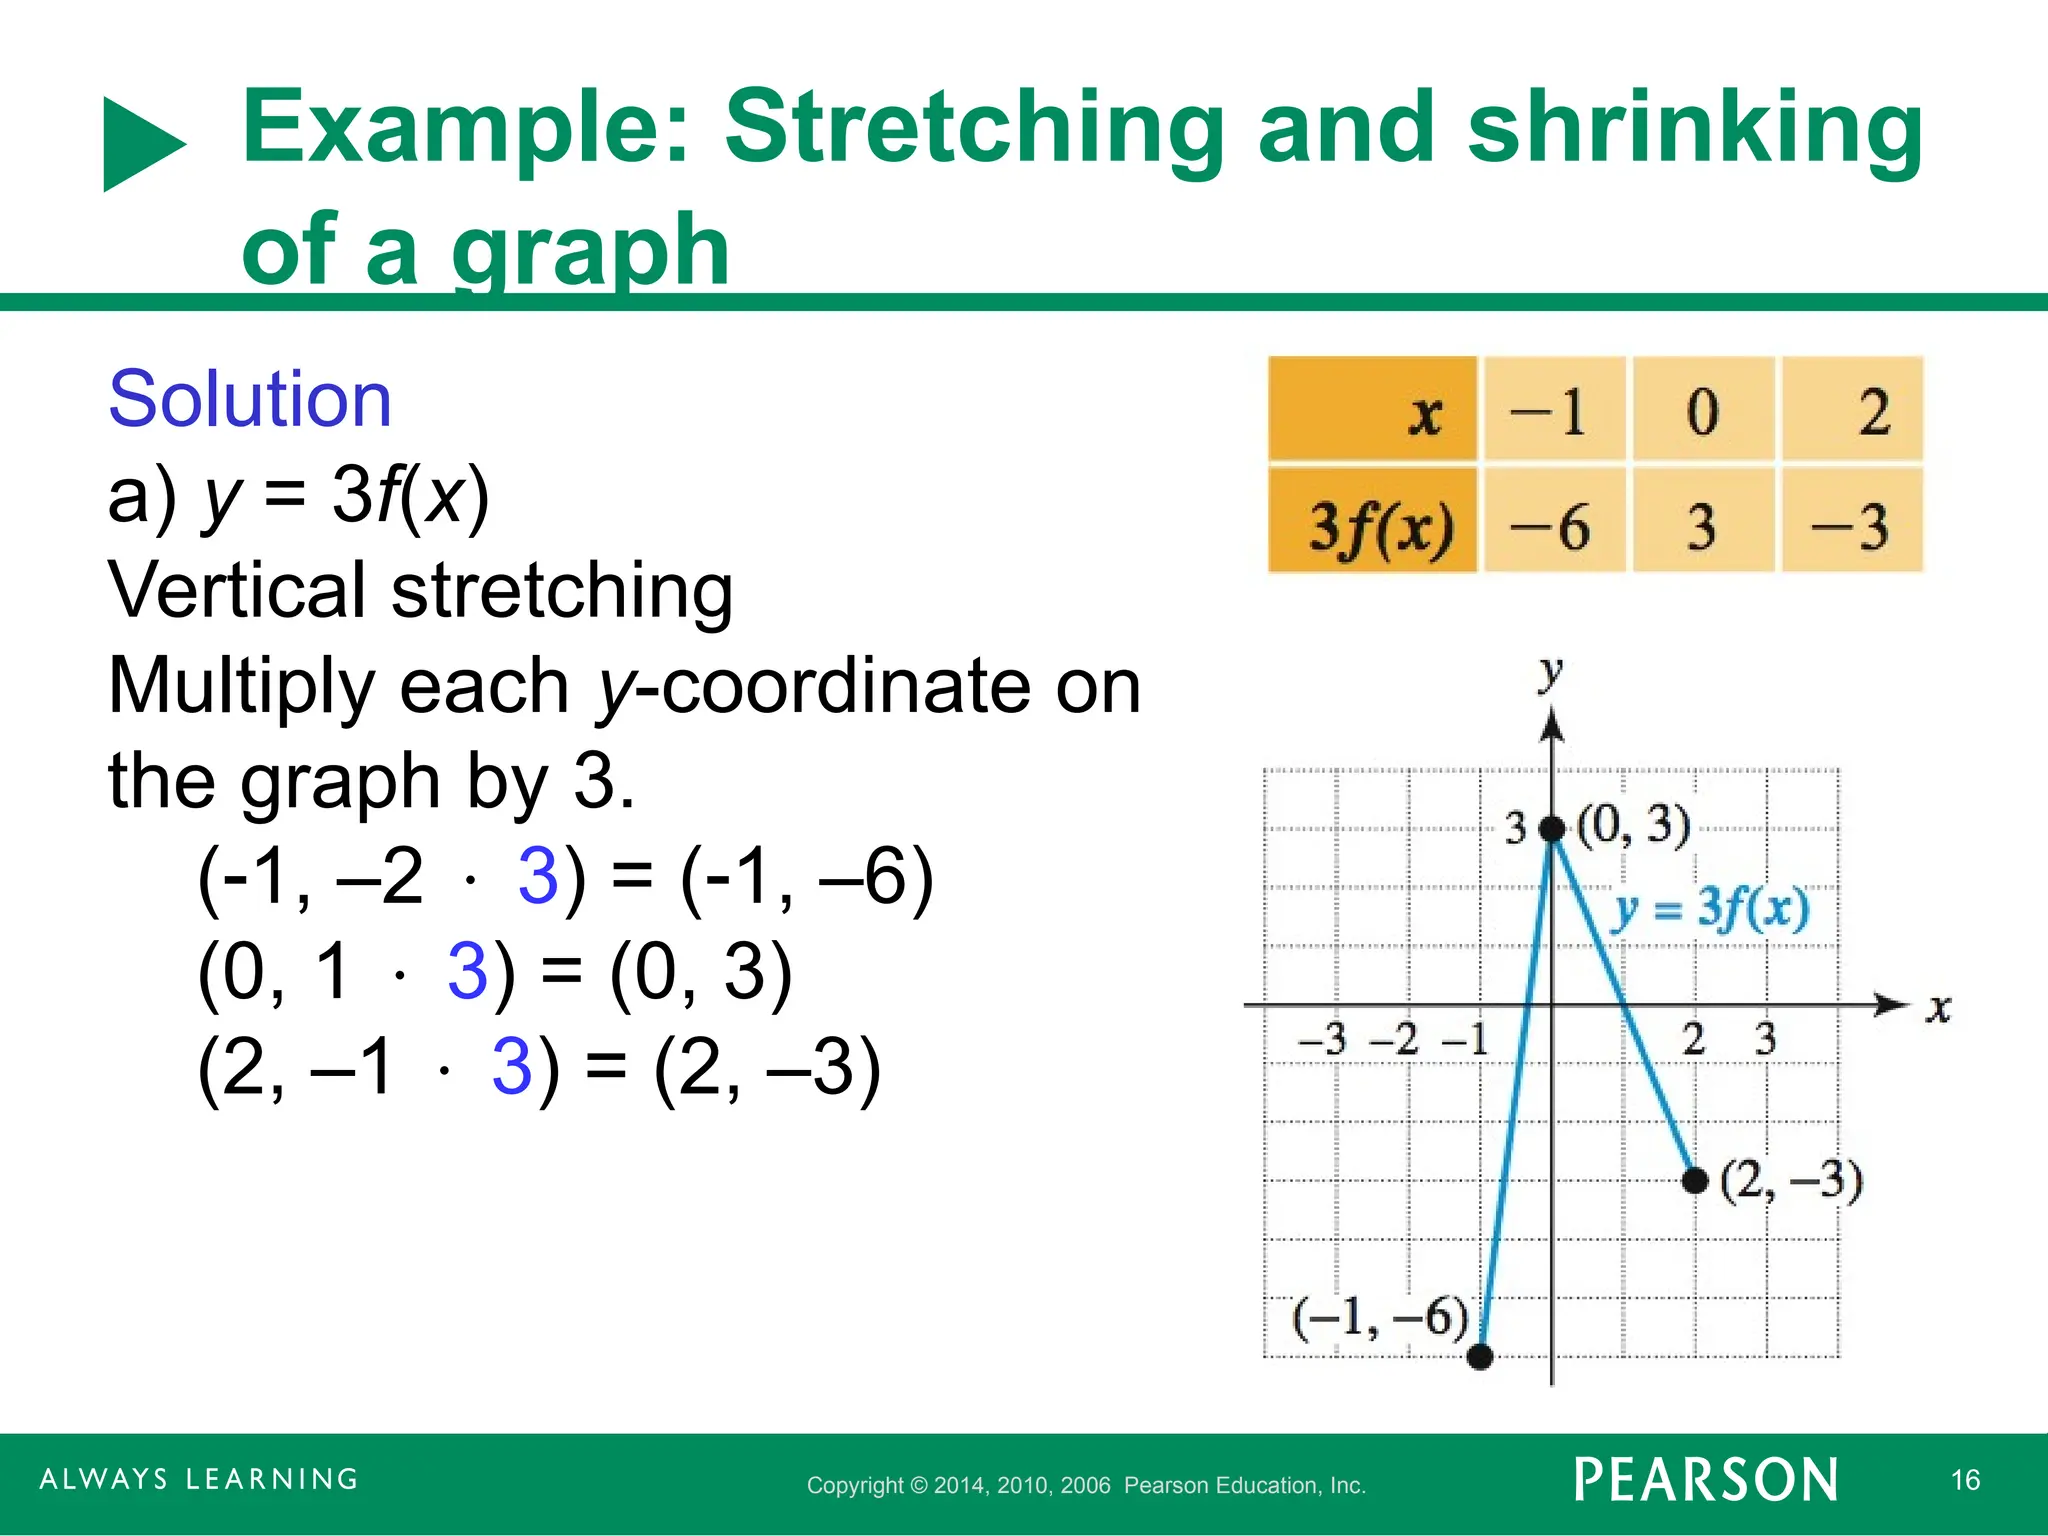
Solution
a) y = 3f(x)
Vertical stretching
Multiply each y-coordinate on
the graph by 3.
(1, –2 3) = (1, –6)
(0, 1 3) = (0, 3)
(2, –1 3) = (2, –3)
- 17.
Copyright © 2014,2010, 2006 Pearson Education, Inc. 17
Example: Stretching and shrinking
of a graph
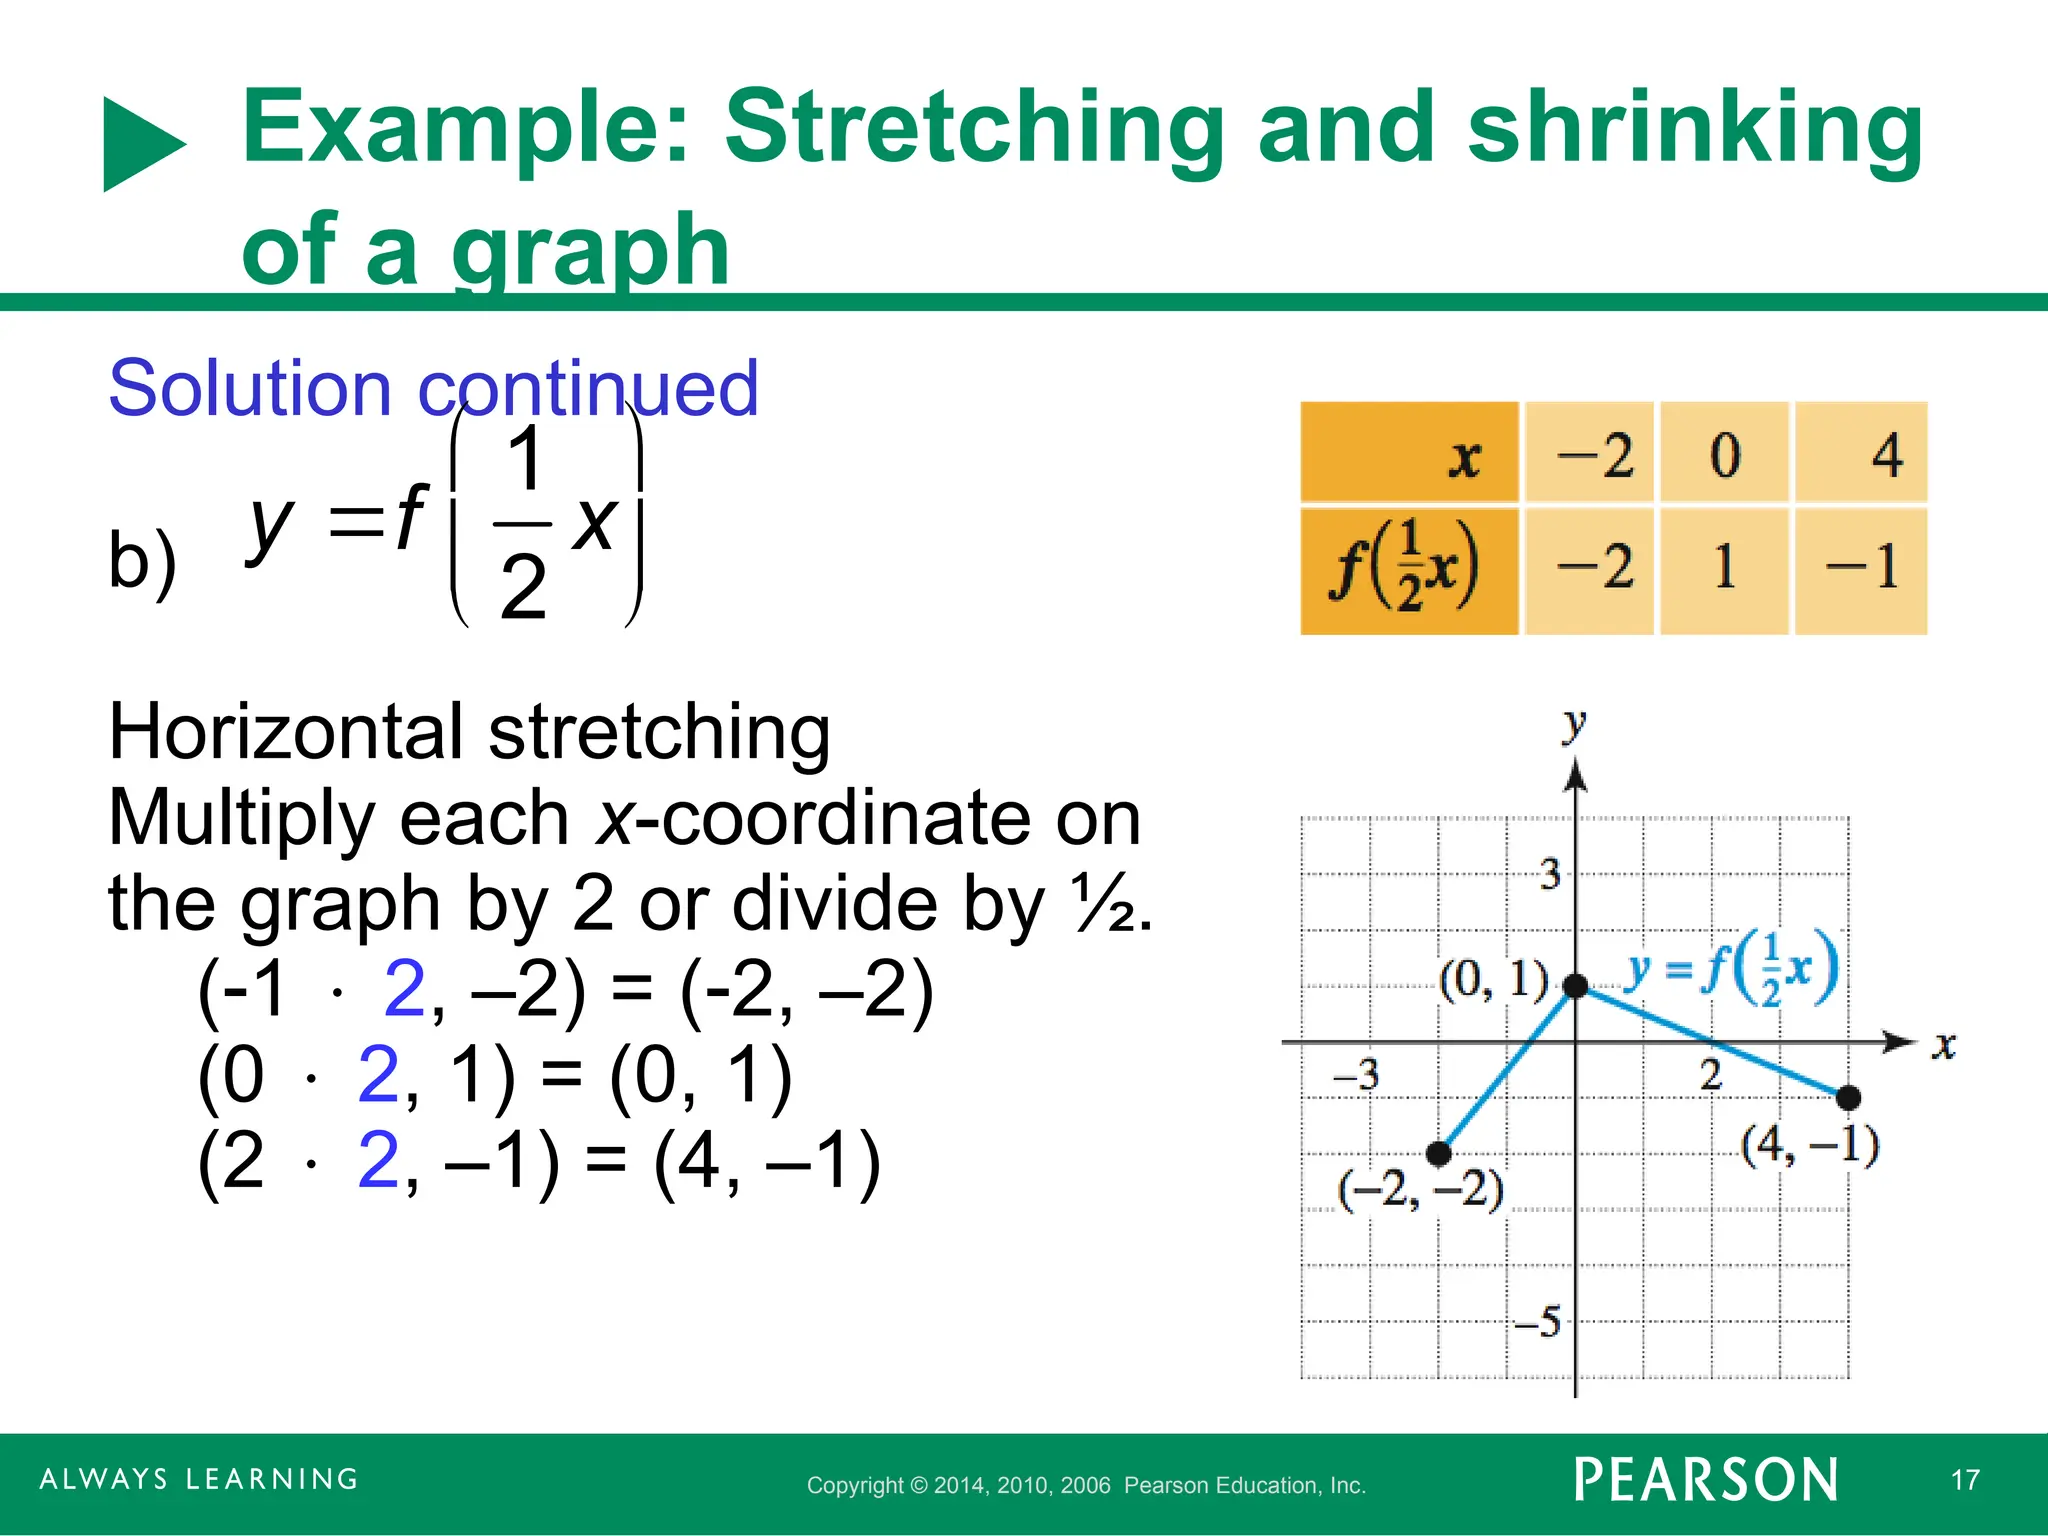
Solution continued
b)
Horizontal stretching
Multiply each x-coordinate on
the graph by 2 or divide by ½.
(1 2, –2) = (2, –2)
(0 2, 1) = (0, 1)
(2 2, –1) = (4, –1)
y f
1
2
x
- 18.
Copyright © 2014,2010, 2006 Pearson Education, Inc. 18
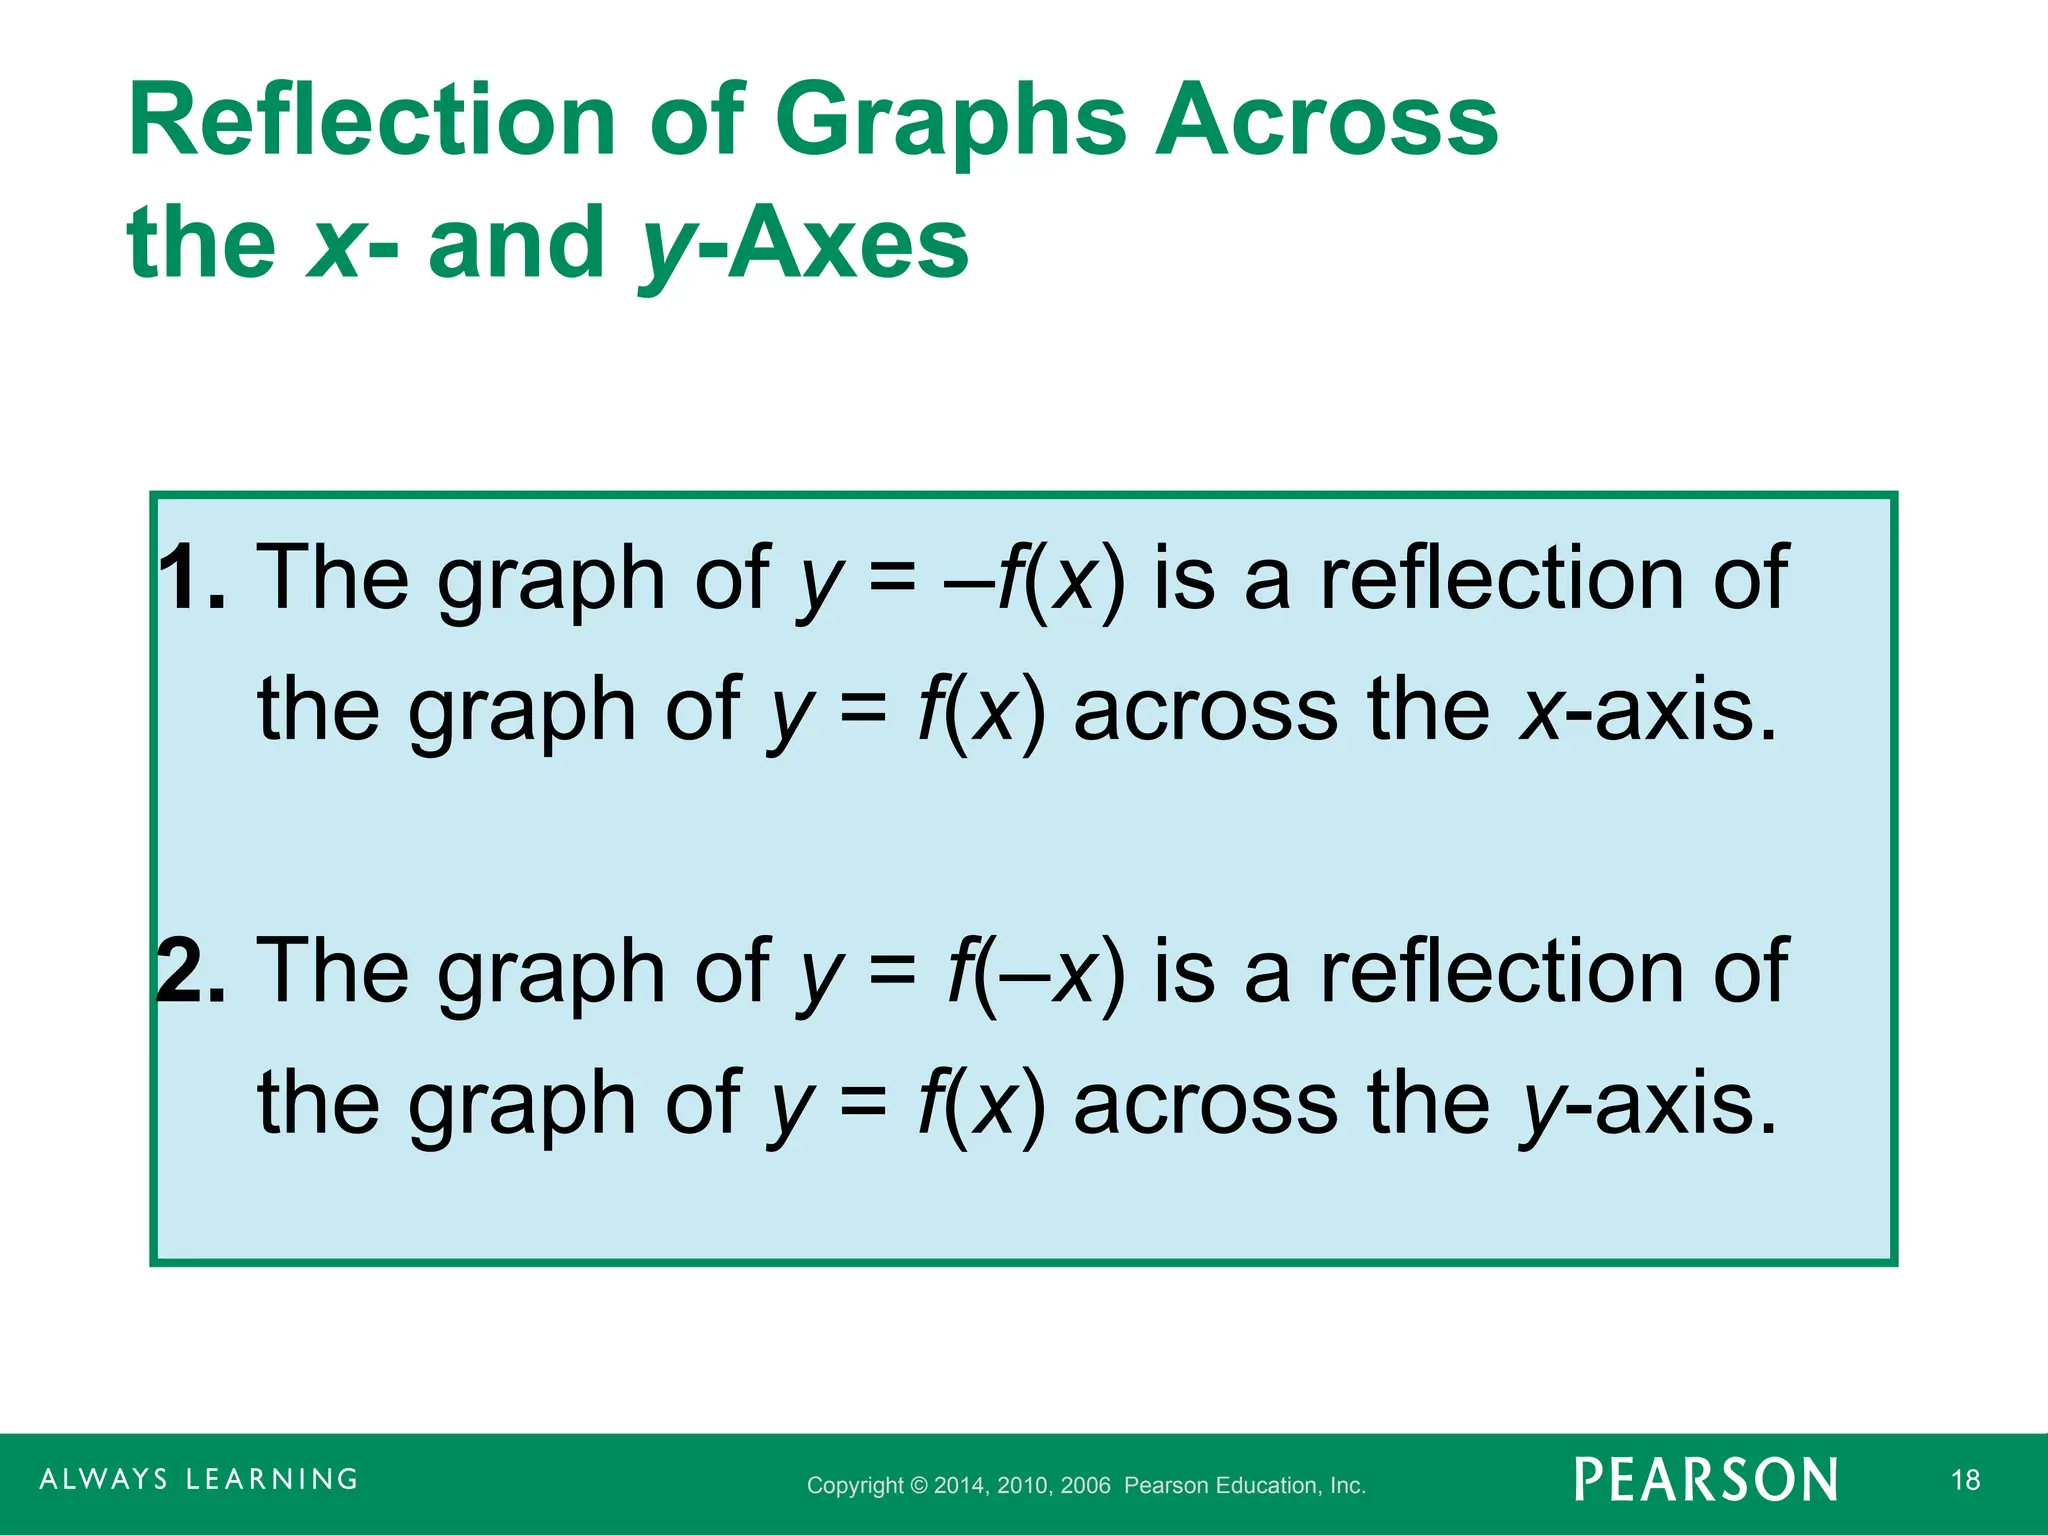
Reflection of Graphs Across
the x- and y-Axes
1. The graph of y = –f(x) is a reflection of
the graph of y = f(x) across the x-axis.
2. The graph of y = f(–x) is a reflection of
the graph of y = f(x) across the y-axis.
- 19.
Copyright © 2014,2010, 2006 Pearson Education, Inc. 19
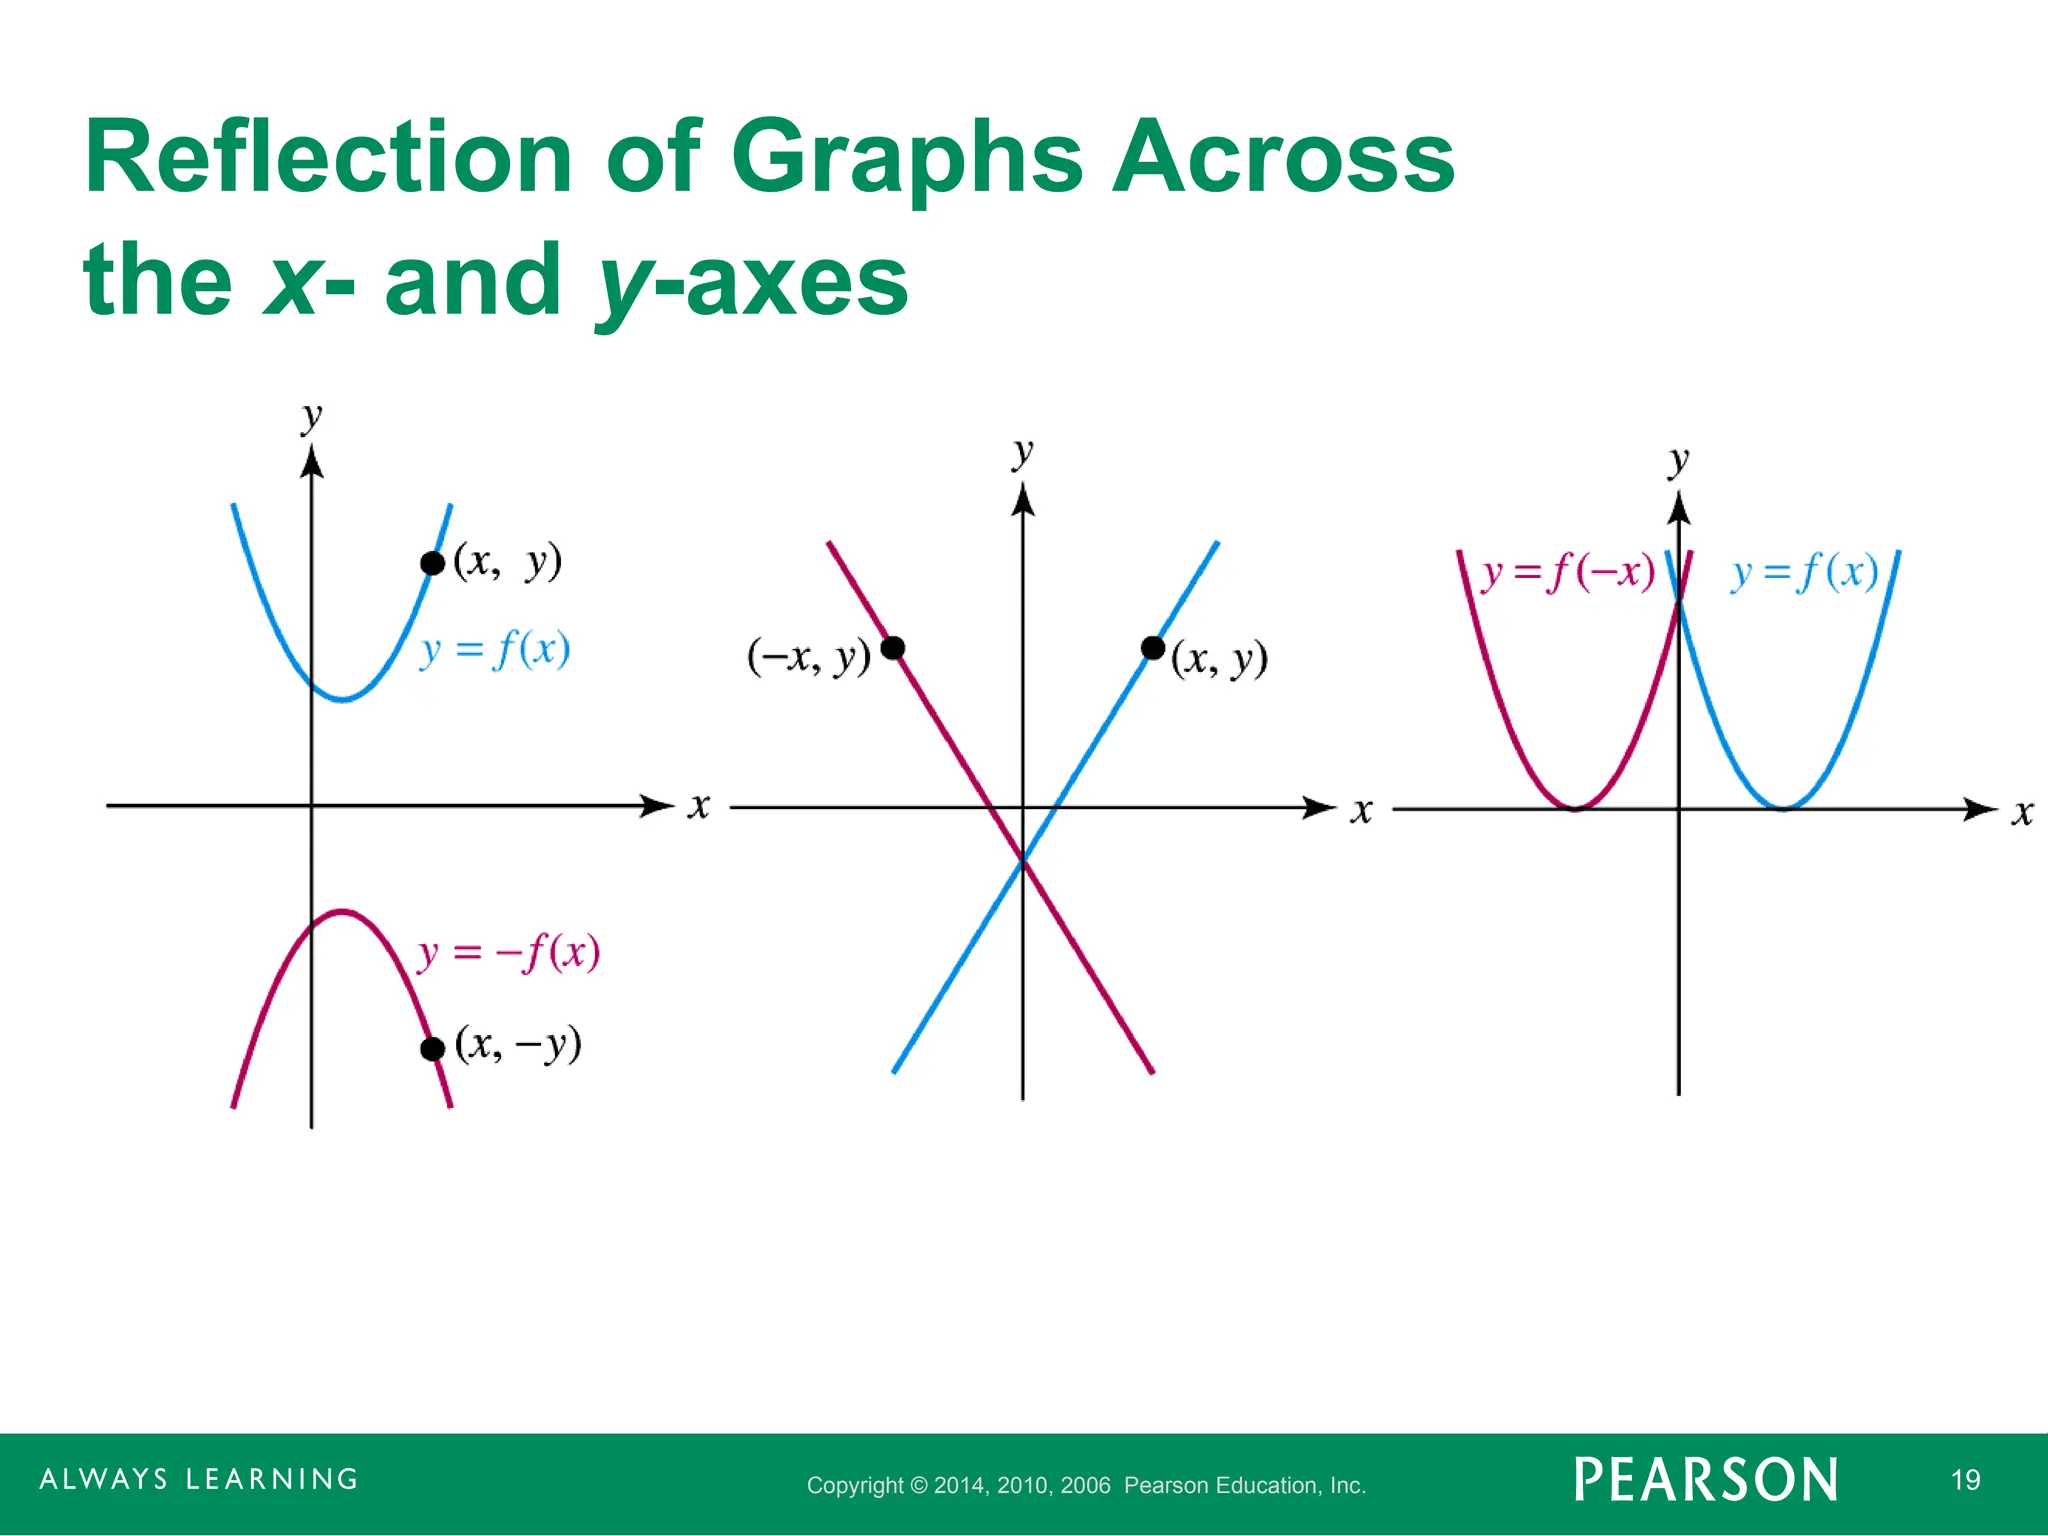
Reflection of Graphs Across
the x- and y-axes
- 20.
Copyright © 2014,2010, 2006 Pearson Education, Inc. 20
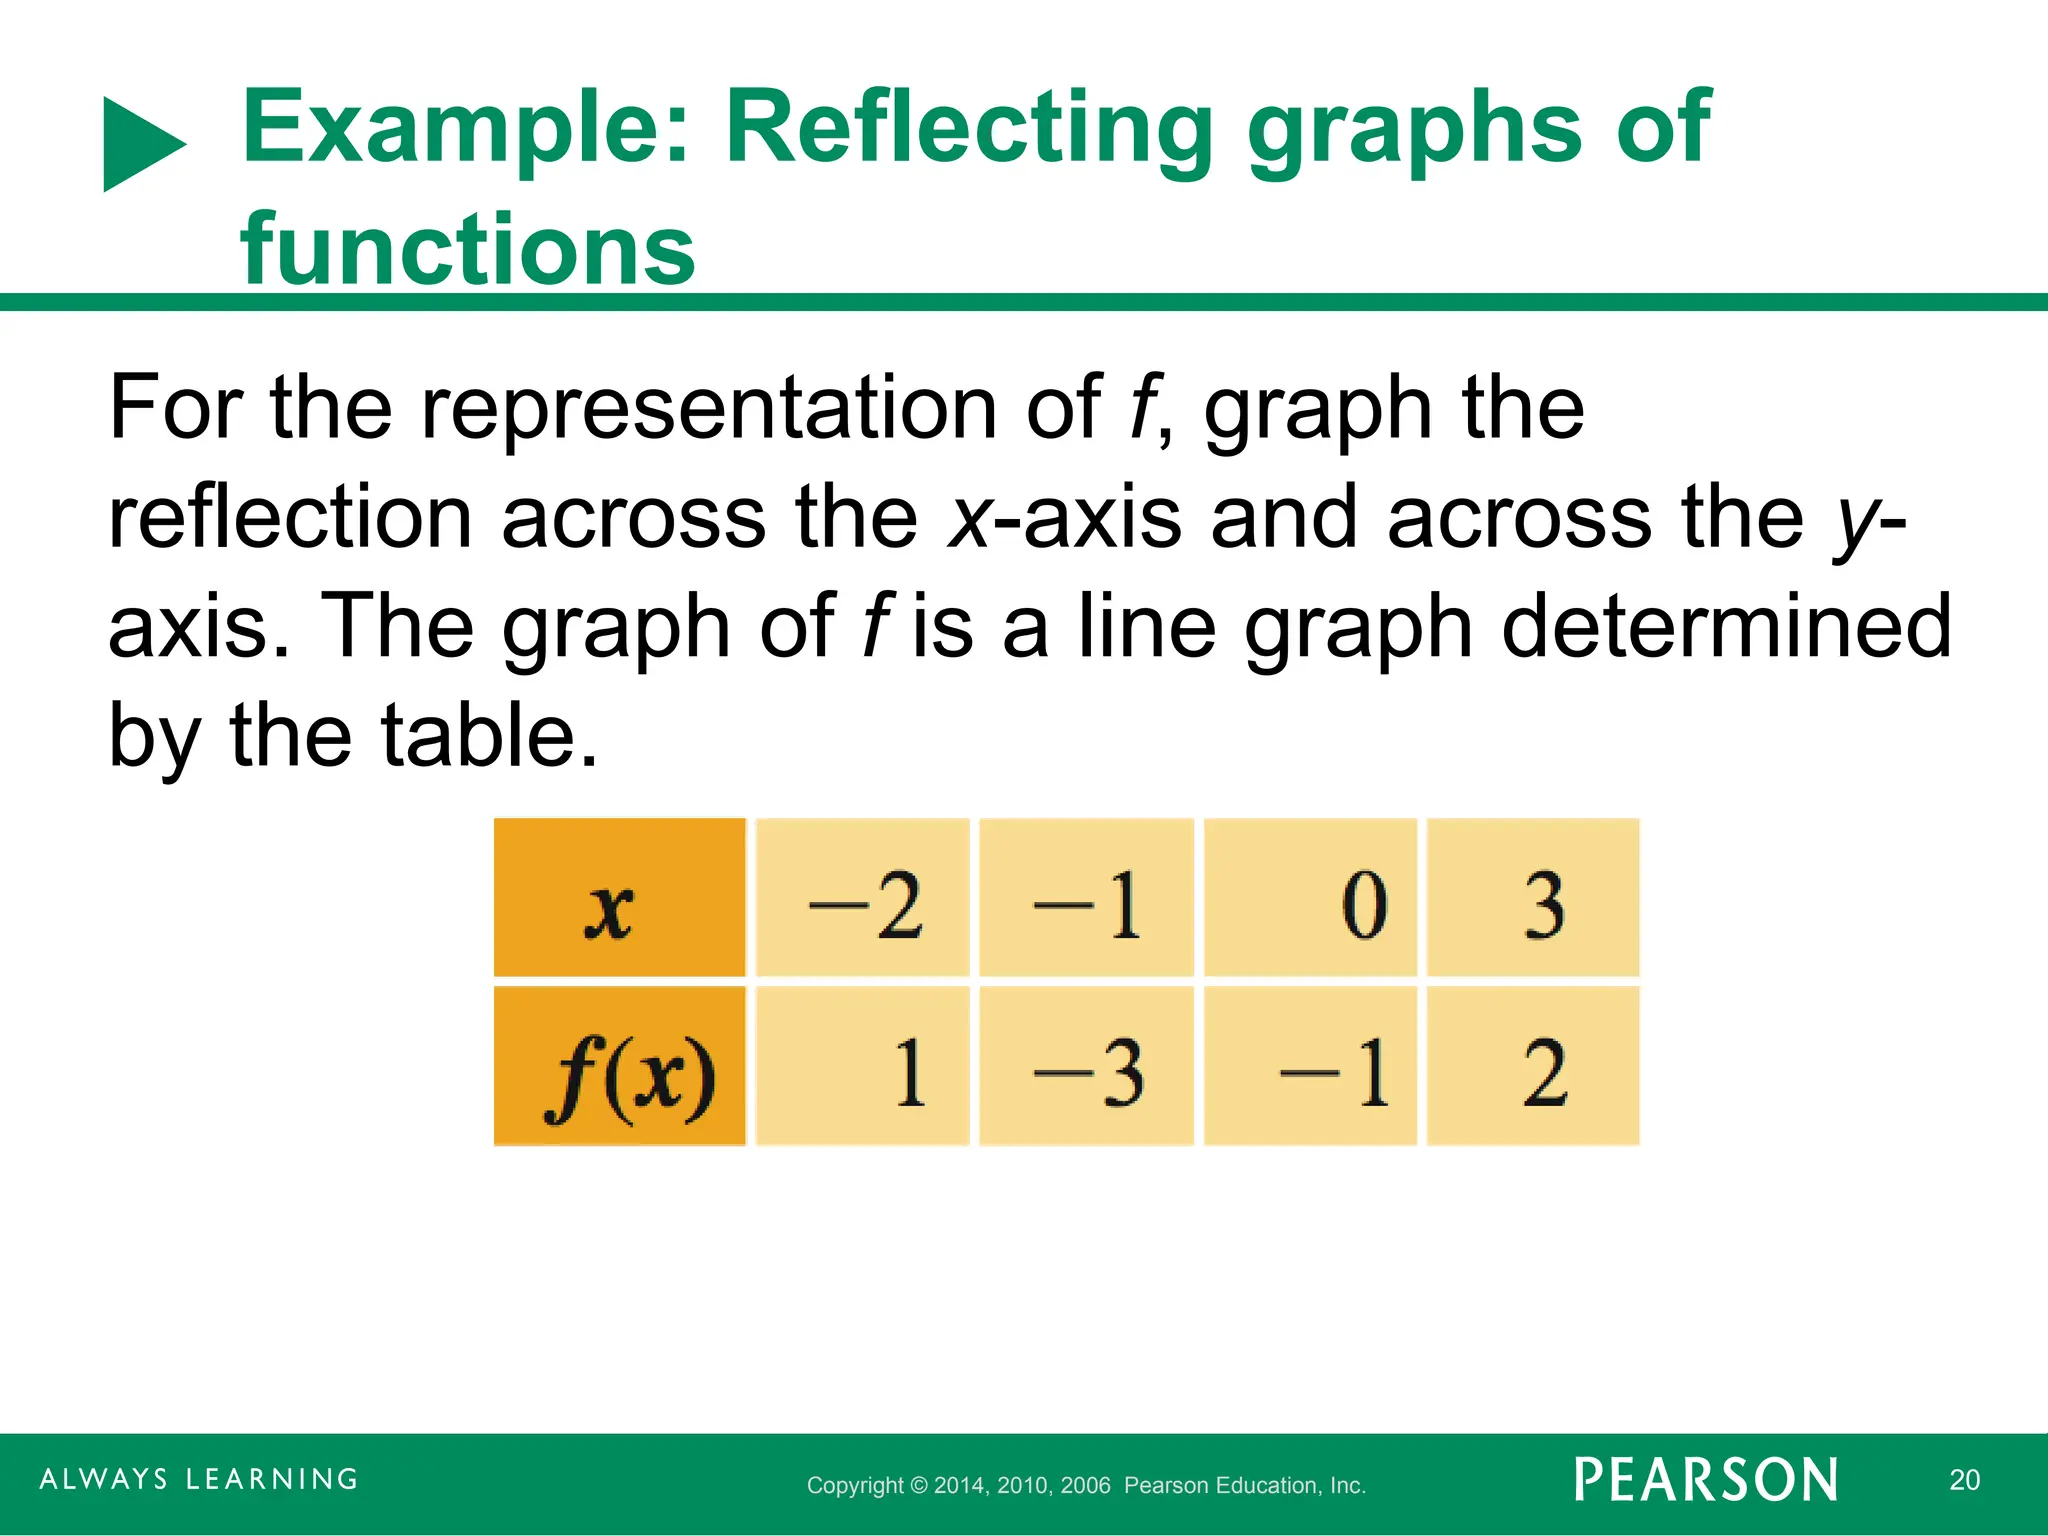
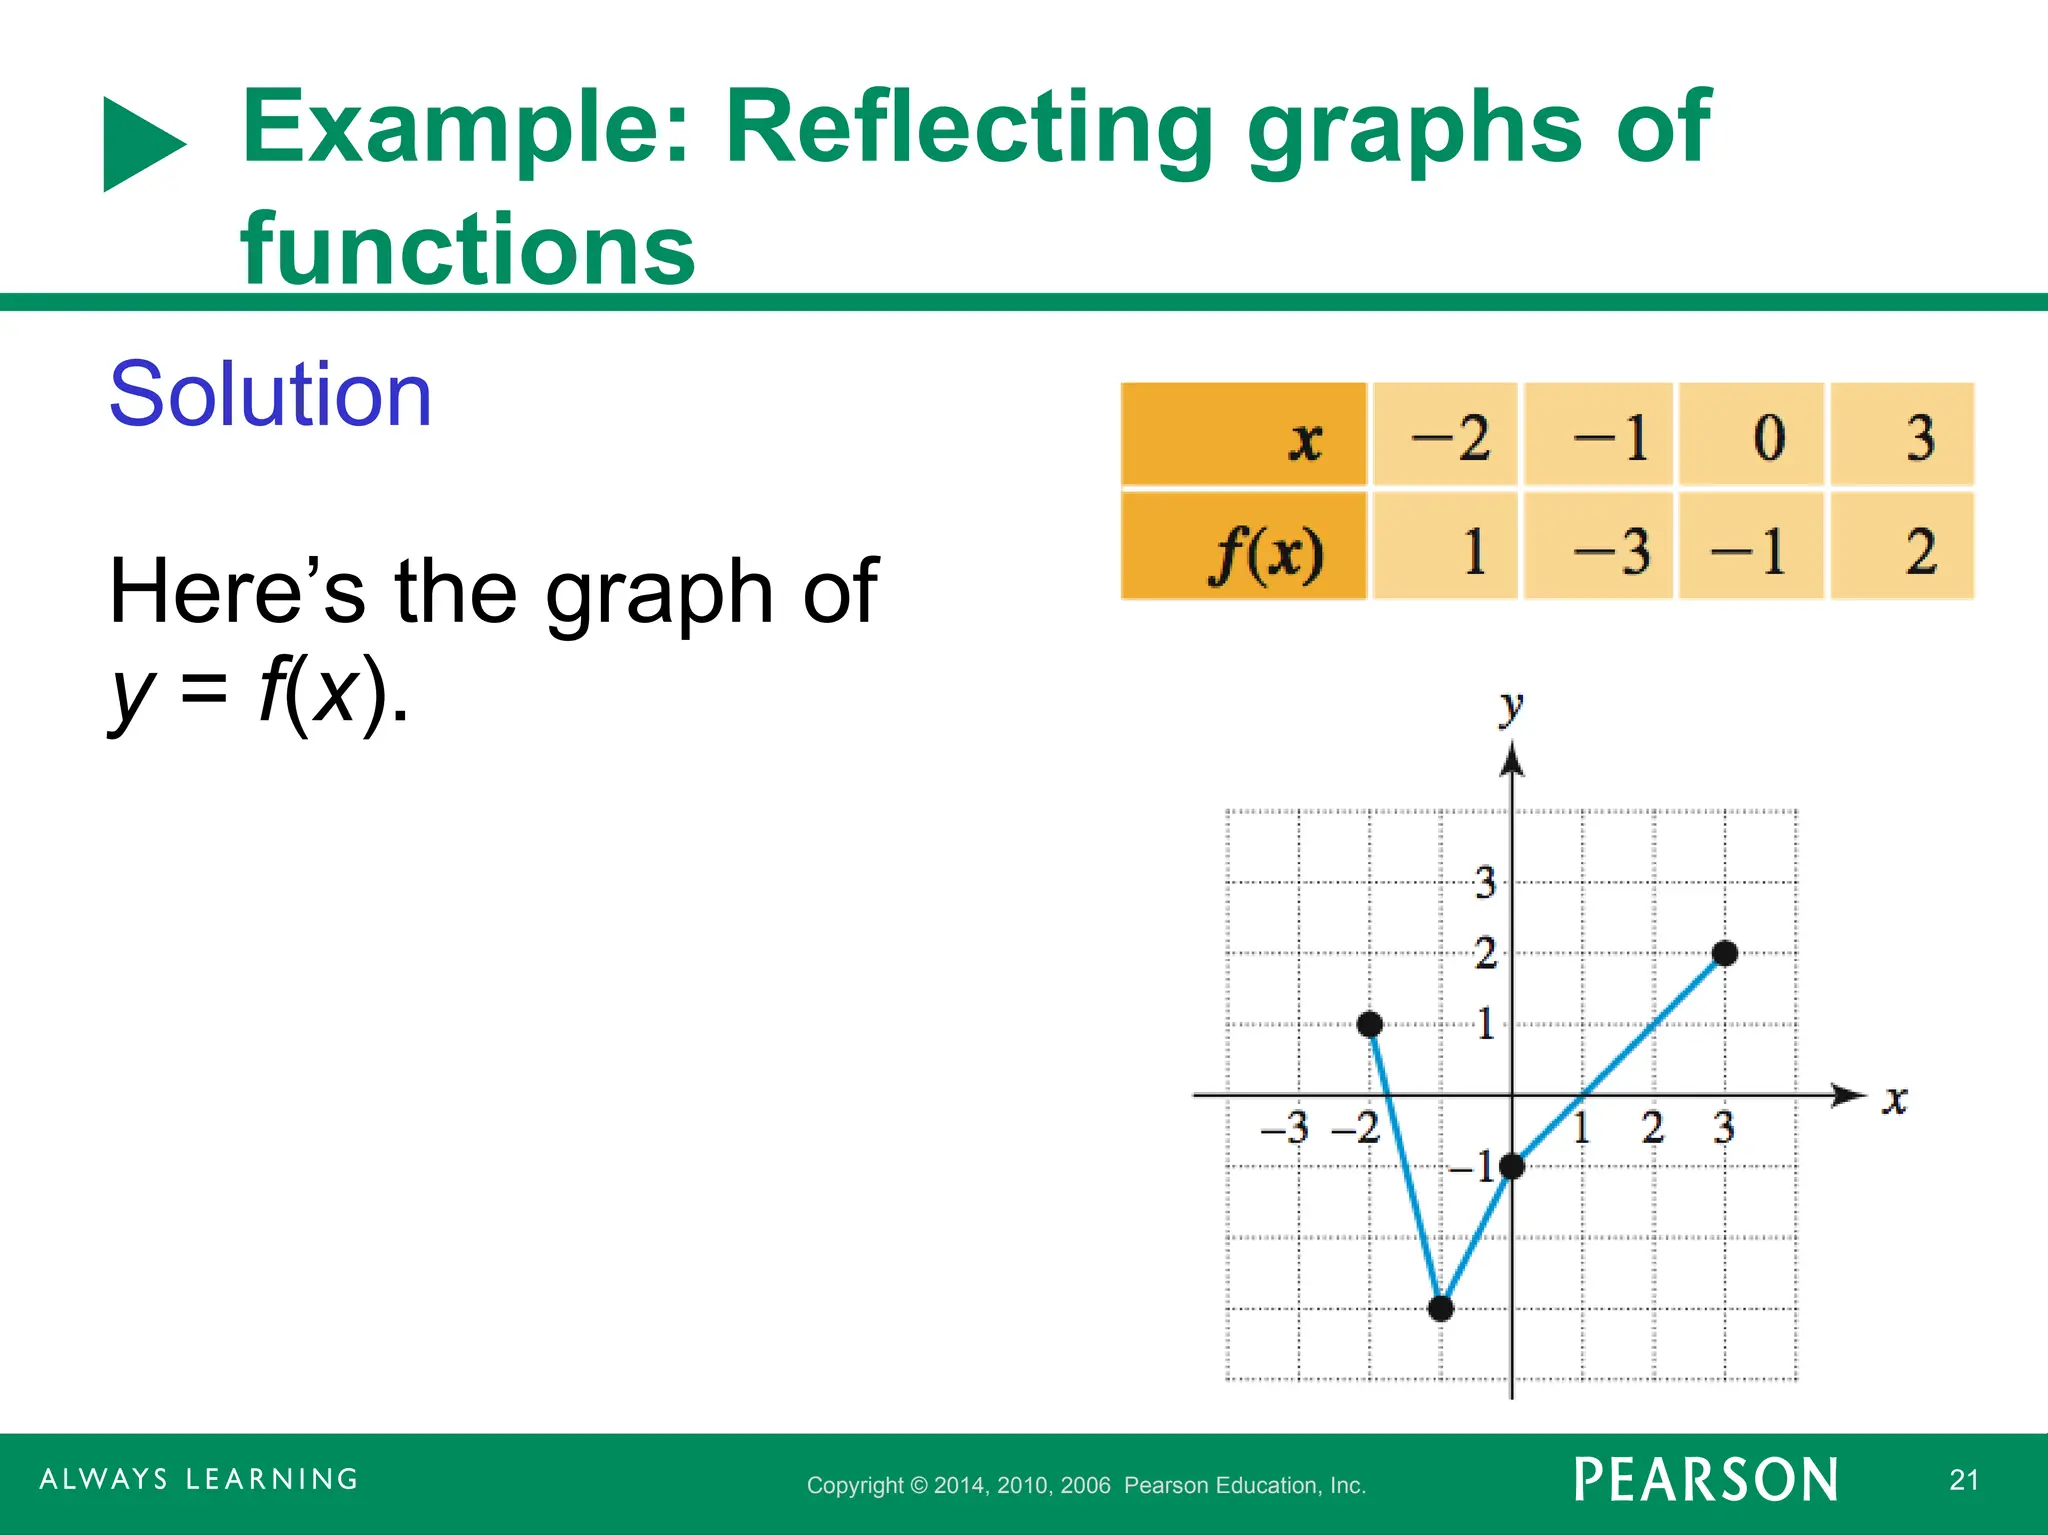
Example: Reflecting graphs of
functions
For the representation of f, graph the
reflection across the x-axis and across the y-
axis. The graph of f is a line graph determined
by the table.
- 21.
Copyright © 2014,2010, 2006 Pearson Education, Inc. 21
Example: Reflecting graphs of
functions
Solution
Here’s the graph of
y = f(x).
- 22.
Copyright © 2014,2010, 2006 Pearson Education, Inc. 22
Example: Reflecting graphs of
functions
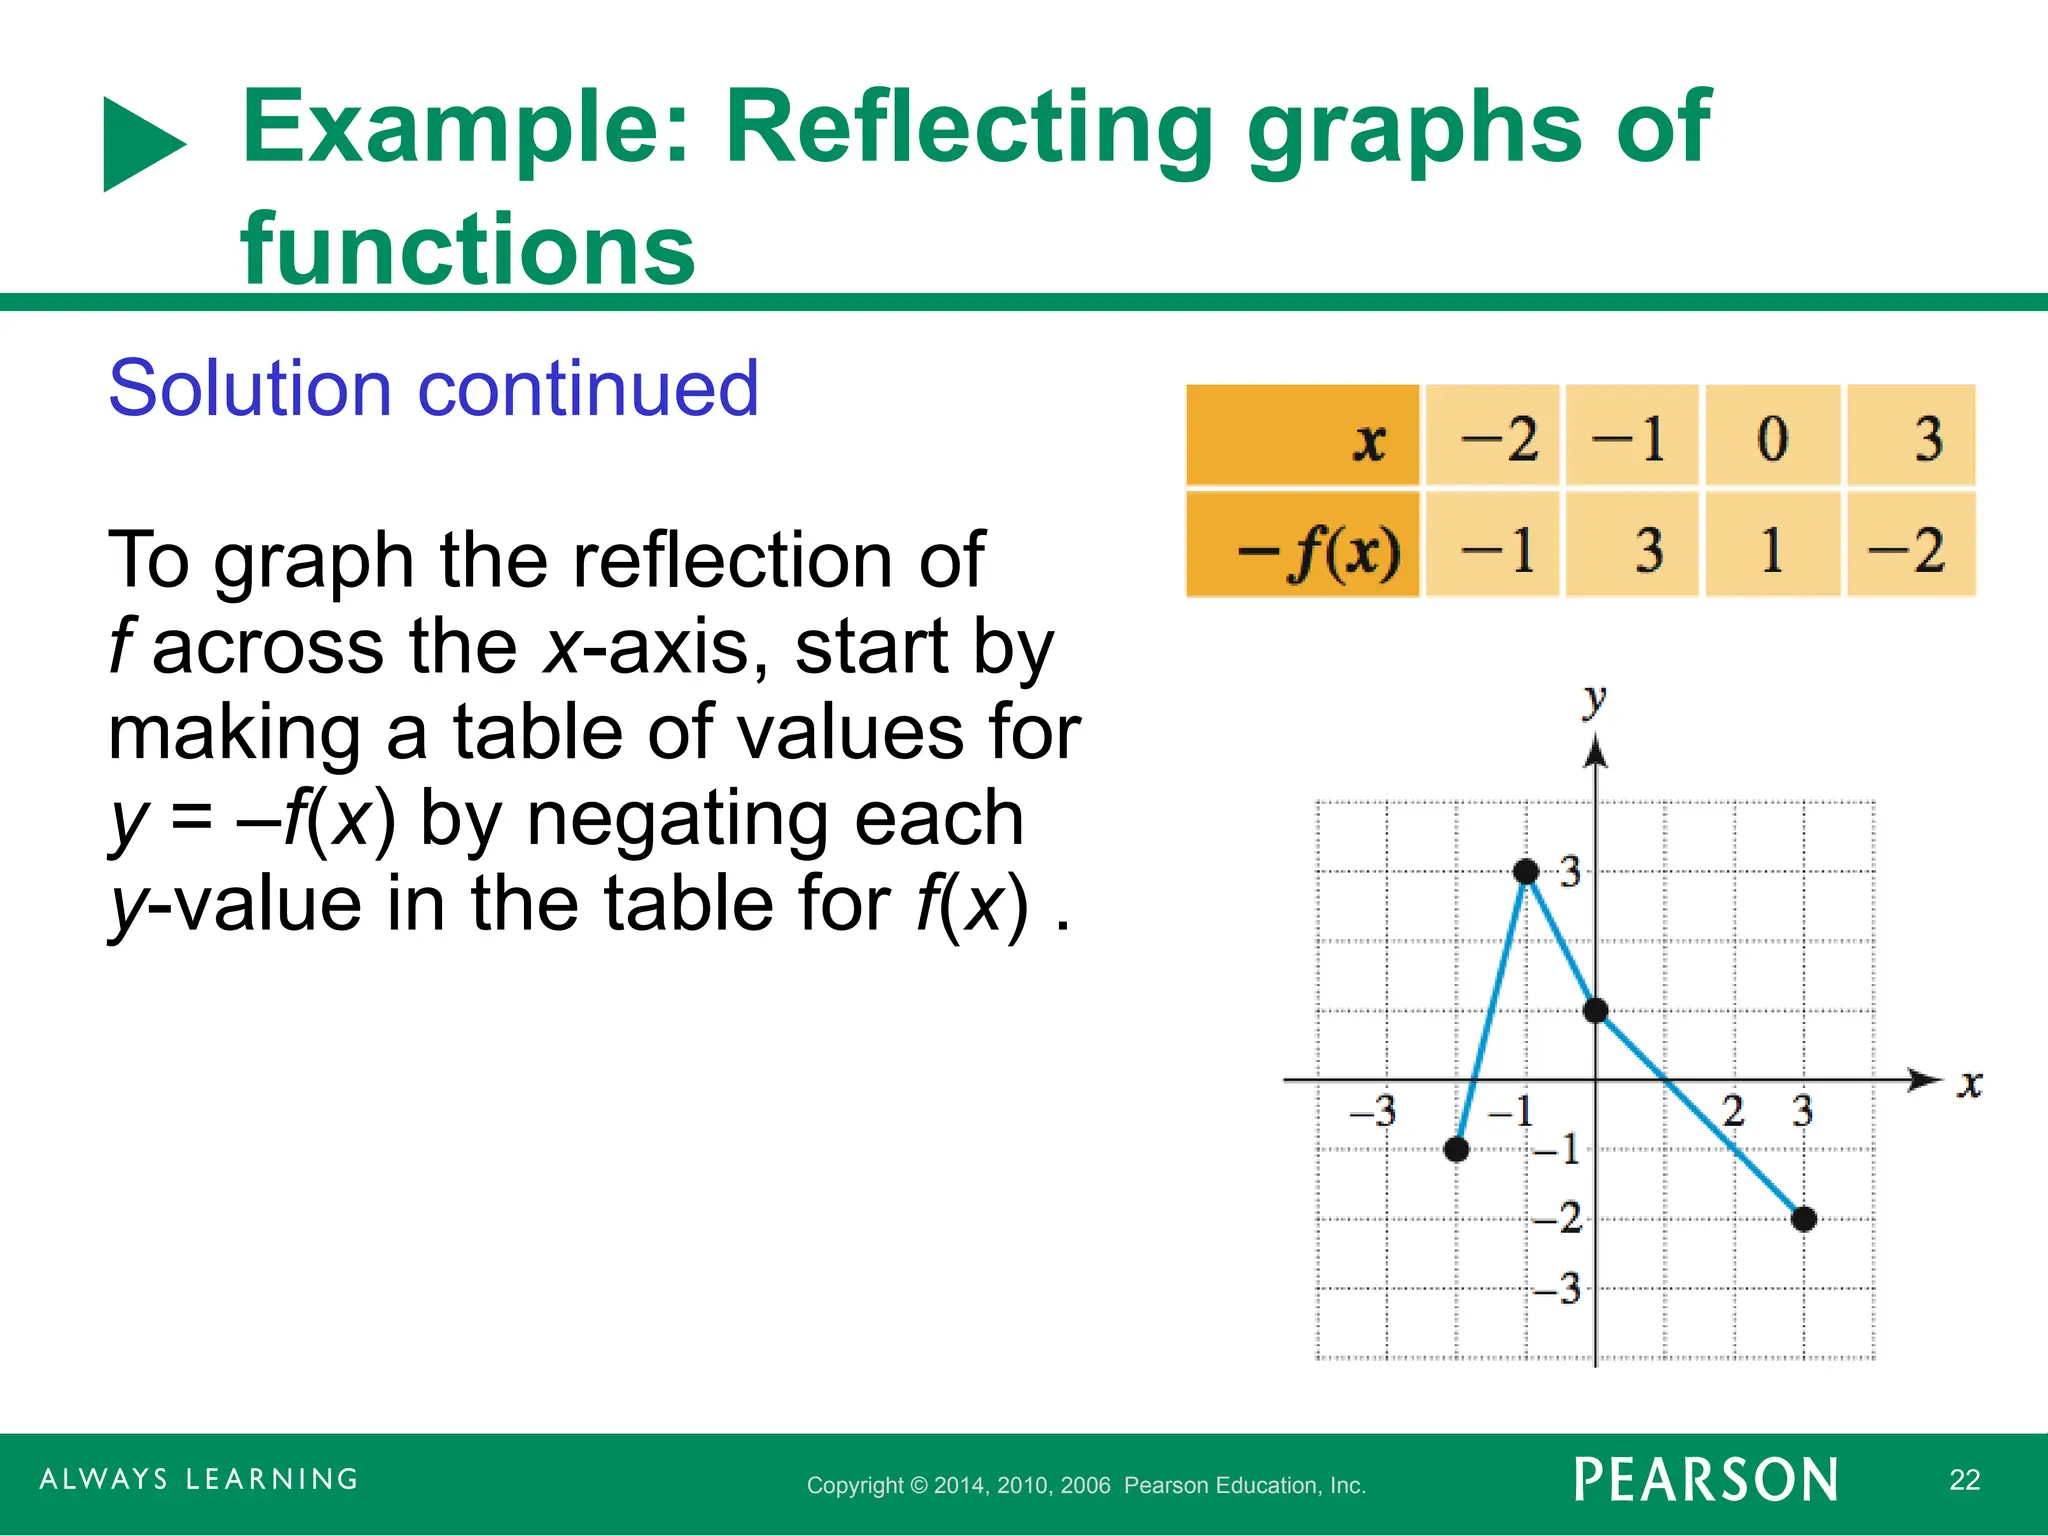
Solution continued
To graph the reflection of
f across the x-axis, start by
making a table of values for
y = –f(x) by negating each
y-value in the table for f(x) .
- 23.
Copyright © 2014,2010, 2006 Pearson Education, Inc. 23
Example: Reflecting graphs of
functions
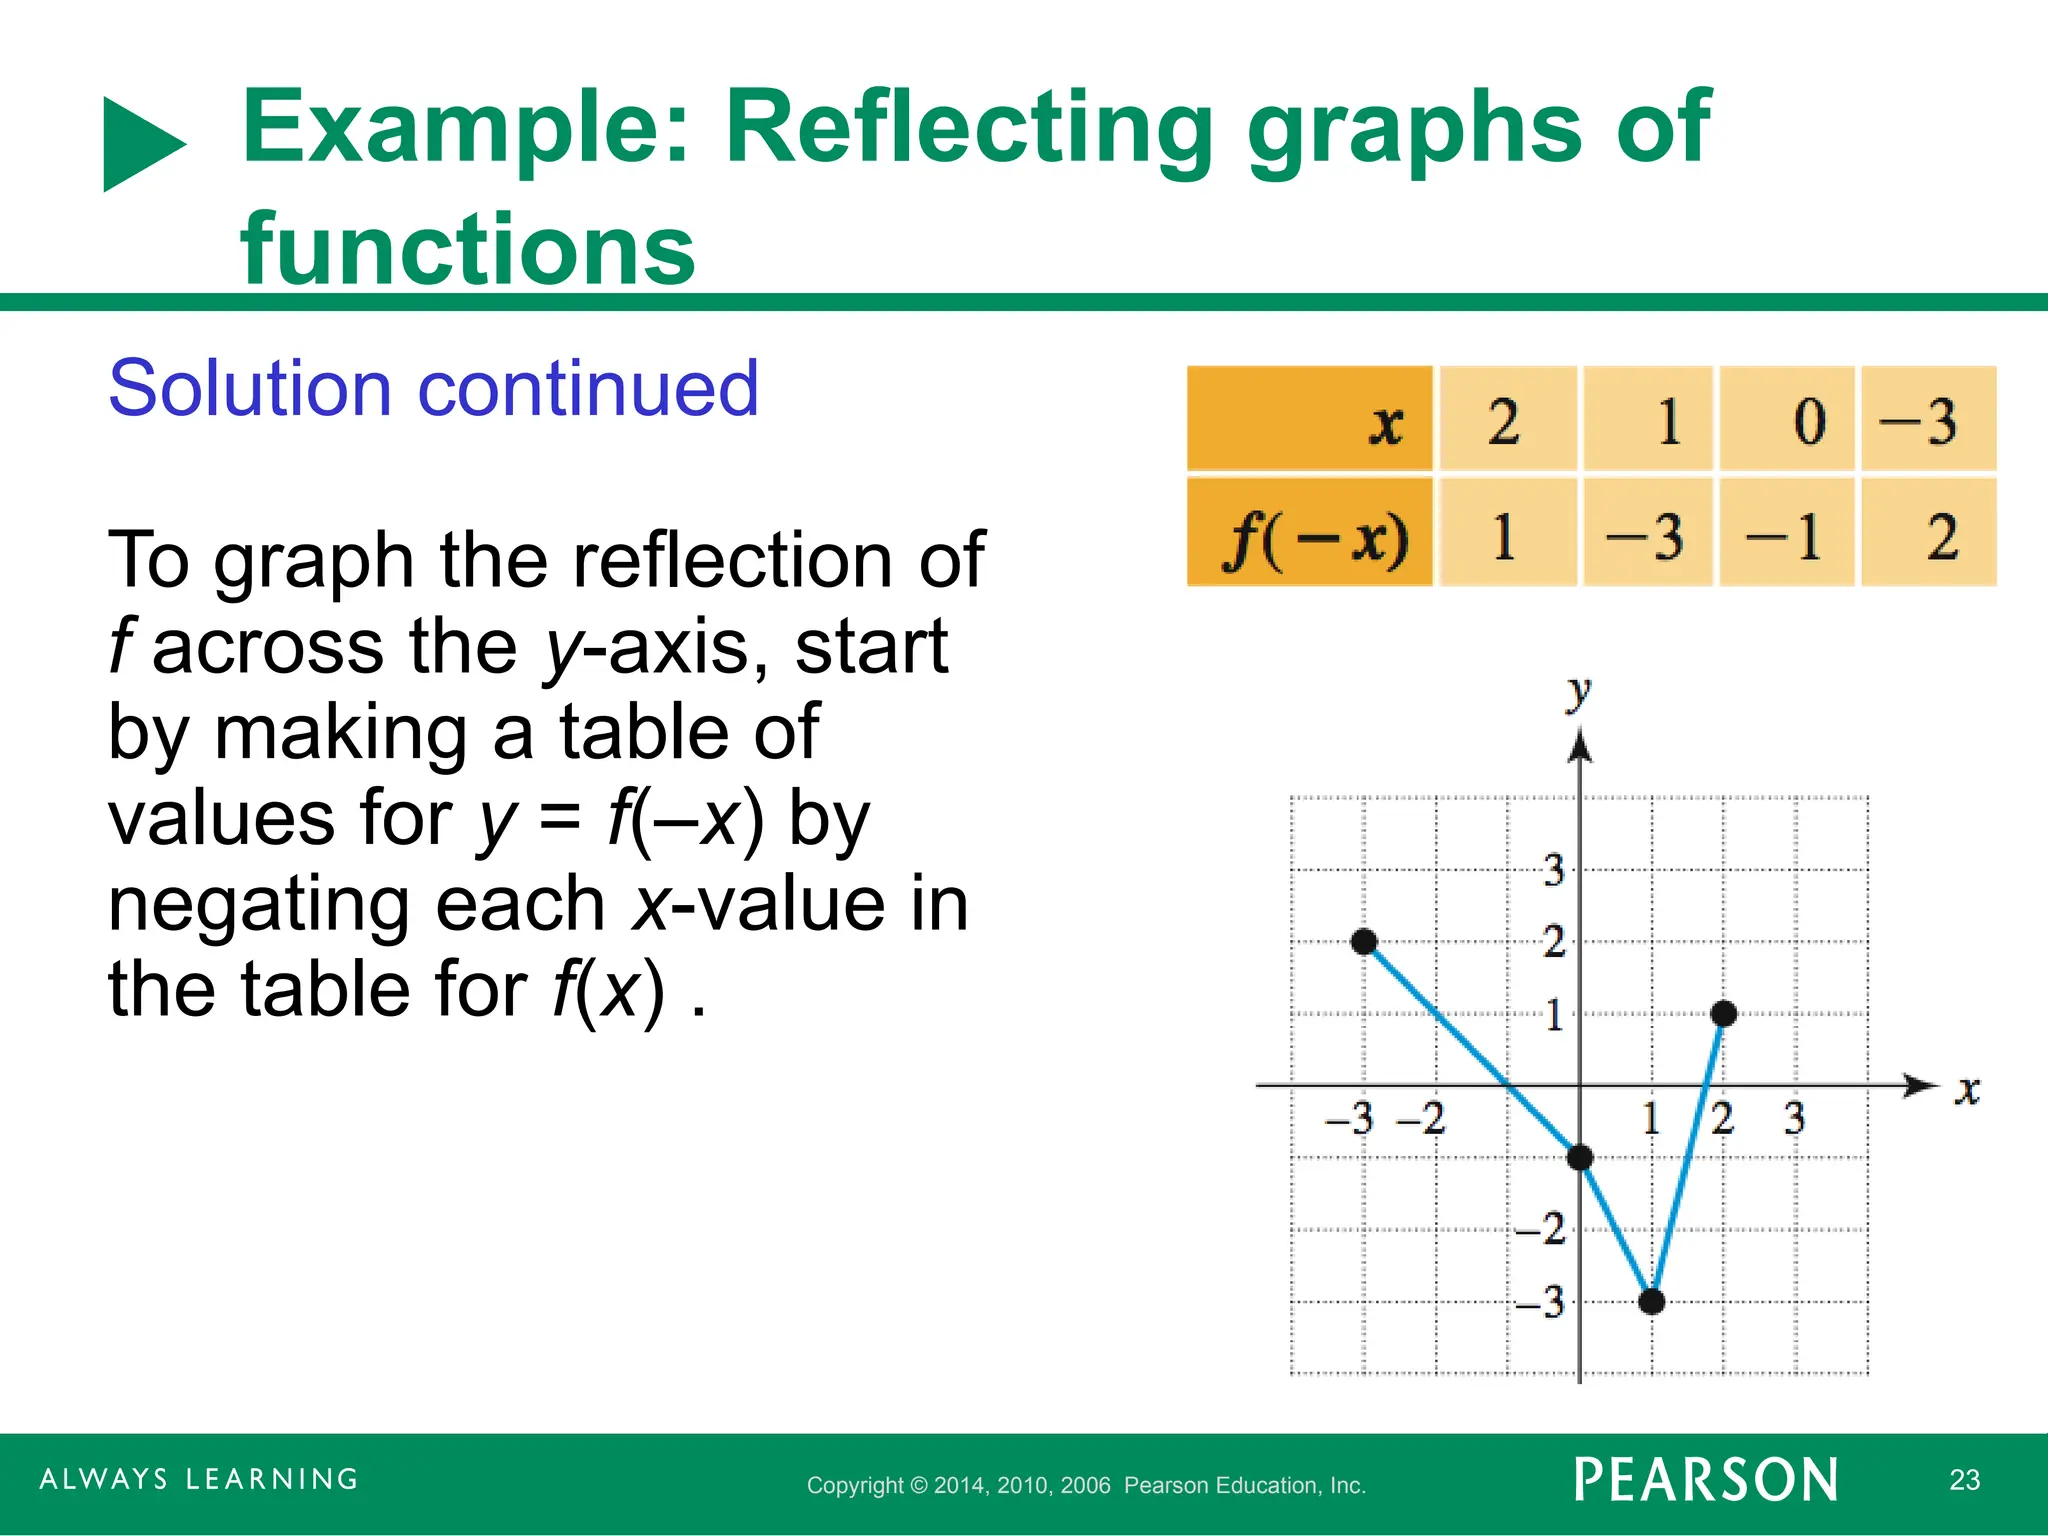
Solution continued
To graph the reflection of
f across the y-axis, start
by making a table of
values for y = f(–x) by
negating each x-value in
the table for f(x) .
- 24.
Copyright © 2014,2010, 2006 Pearson Education, Inc. 24
Combining Transformations
Transformations of graphs can be combined
to create new graphs. For example the graph
of y = 2(x – 1)2
+ 3 can be obtained by
performing four transformations on the graph
of y = x2
.
- 25.
Copyright © 2014,2010, 2006 Pearson Education, Inc. 25
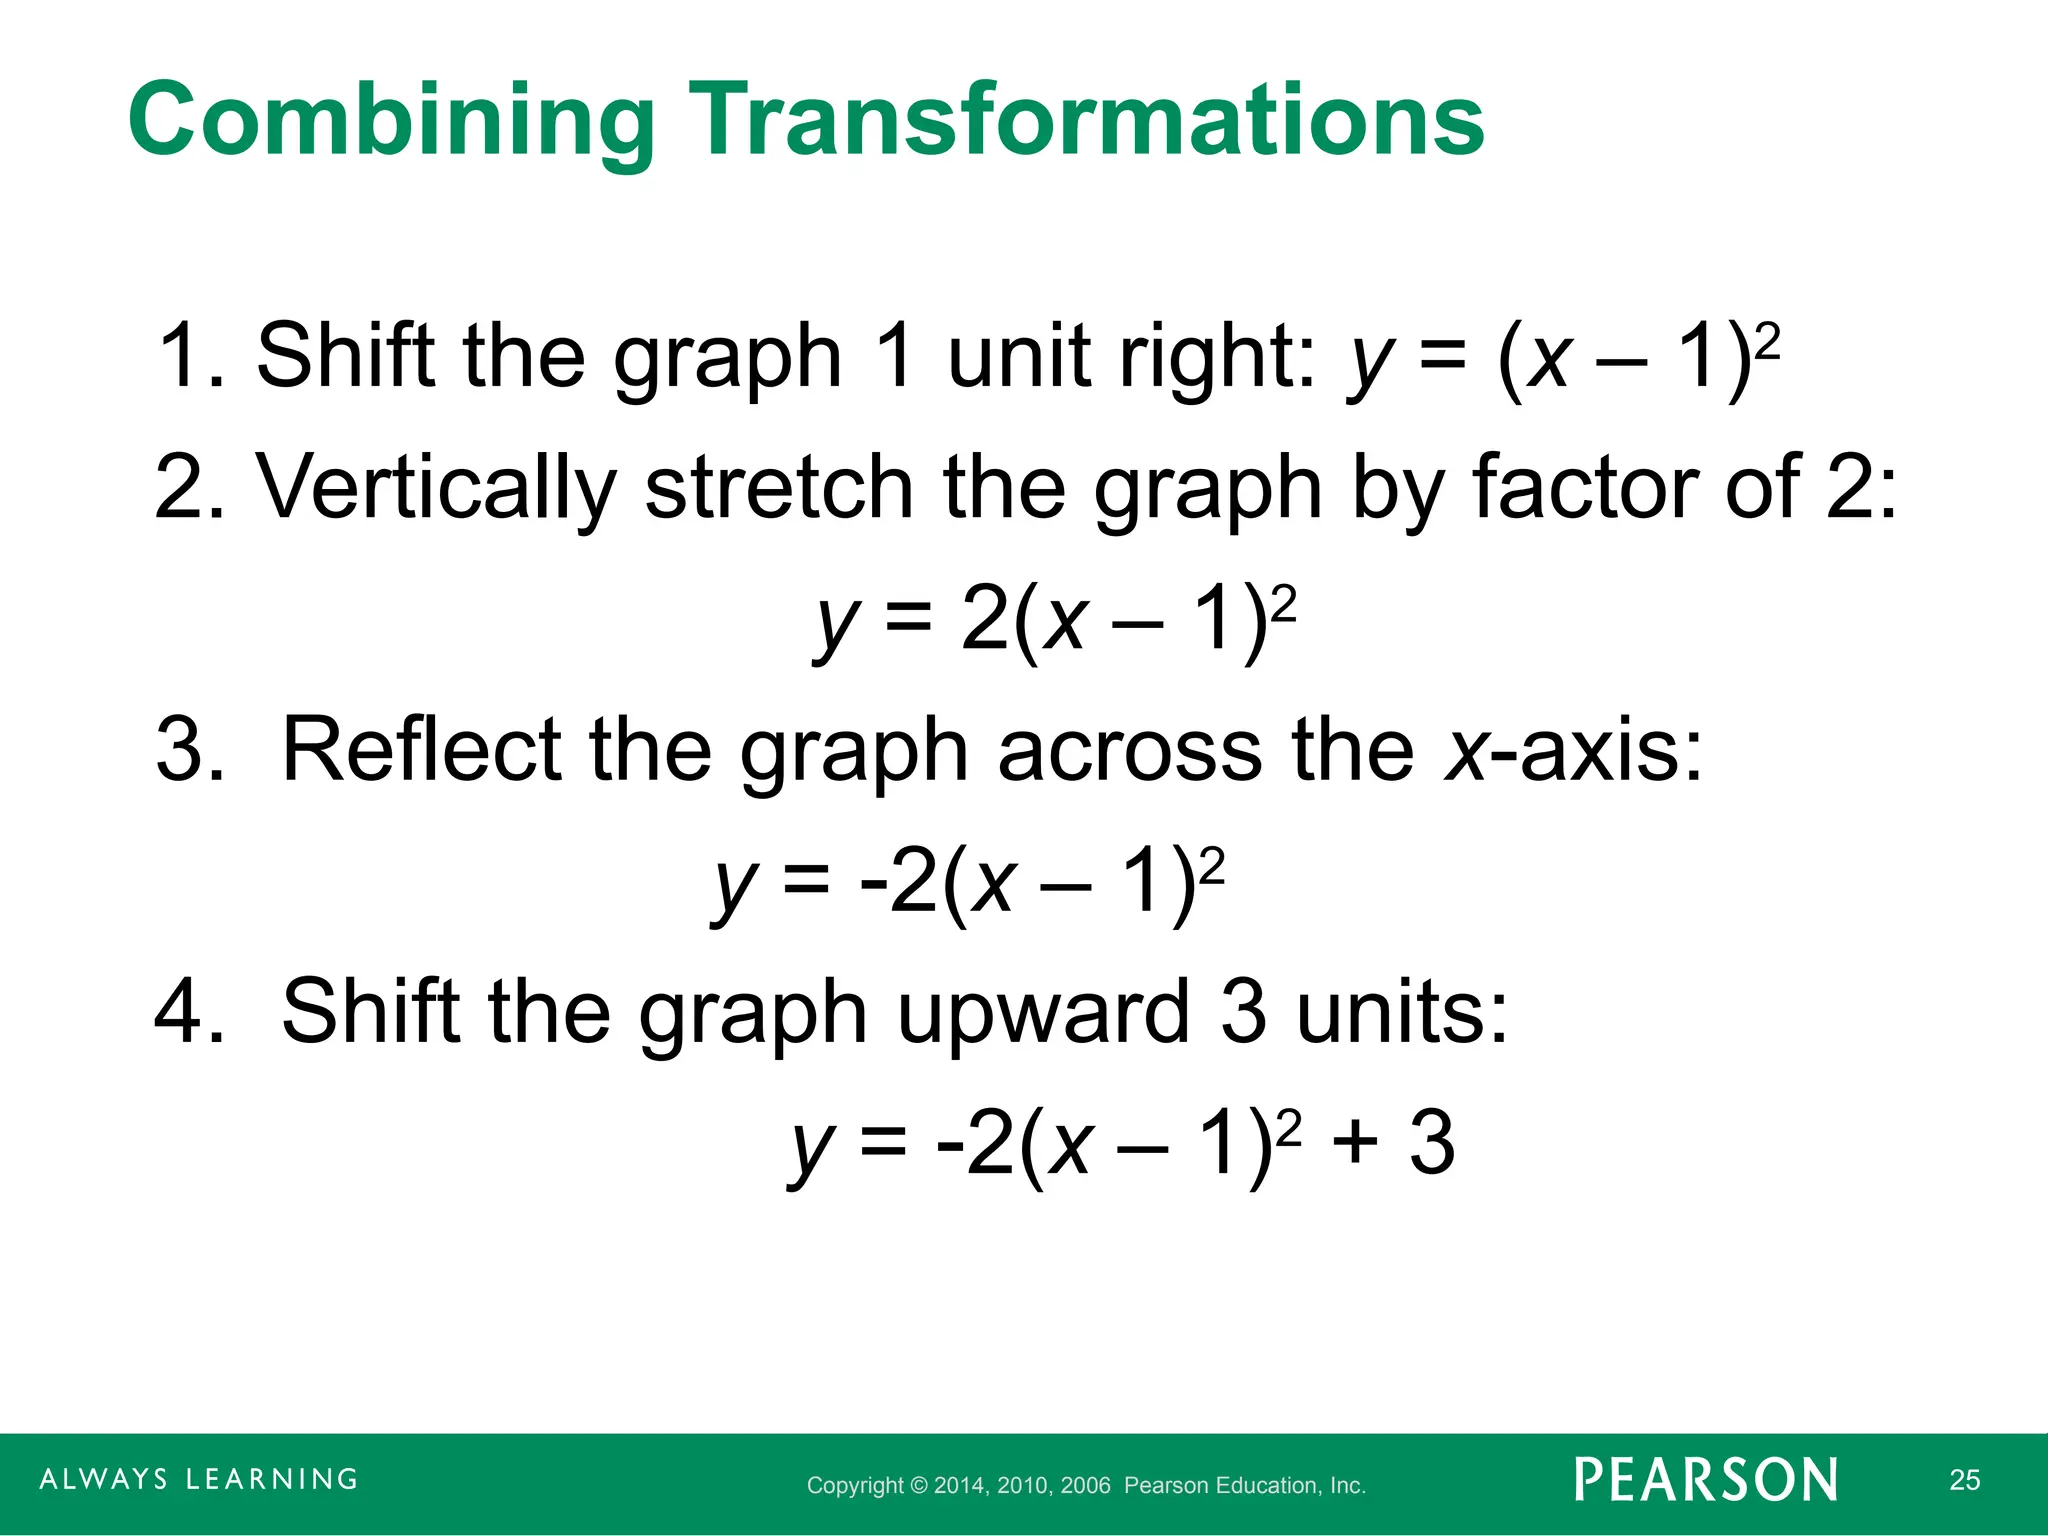
Combining Transformations
1. Shift the graph 1 unit right: y = (x – 1)2
2. Vertically stretch the graph by factor of 2:
y = 2(x – 1)2
3. Reflect the graph across the x-axis:
y = 2(x – 1)2
4. Shift the graph upward 3 units:
y = 2(x – 1)2
+ 3
- 26.
Copyright © 2014,2010, 2006 Pearson Education, Inc. 26
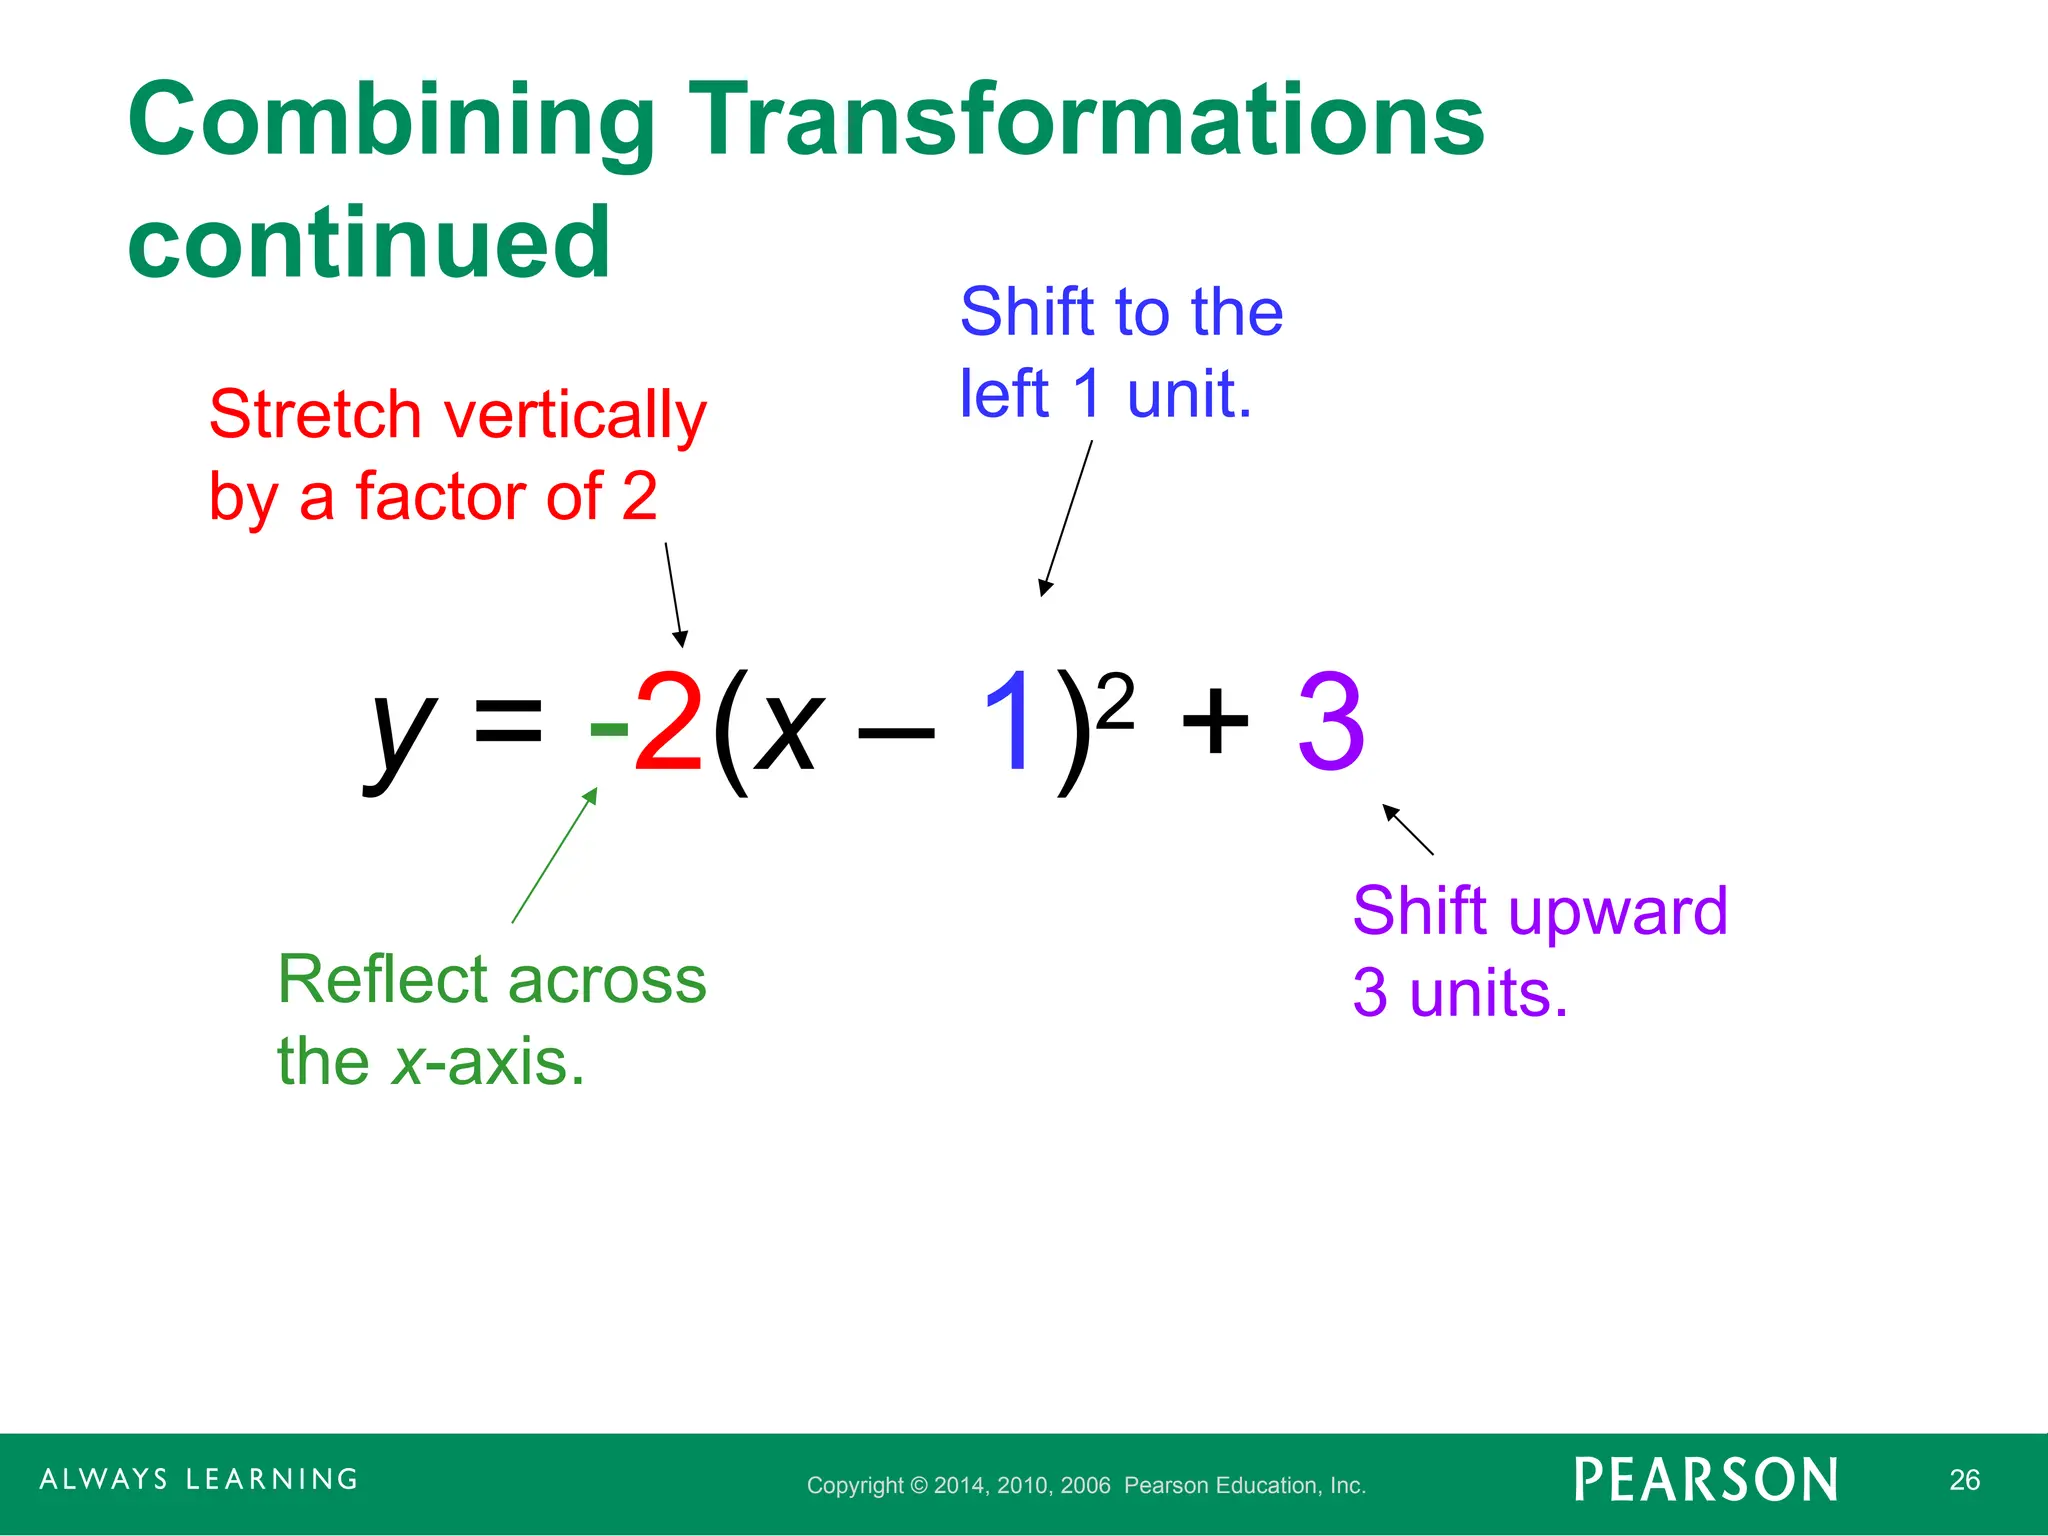
Combining Transformations
continued
y = 2(x – 1)2
+ 3
Shift to the
left 1 unit.
Shift upward
3 units.
Reflect across
the x-axis.
Stretch vertically
by a factor of 2
- 27.
Copyright © 2014,2010, 2006 Pearson Education, Inc. 27
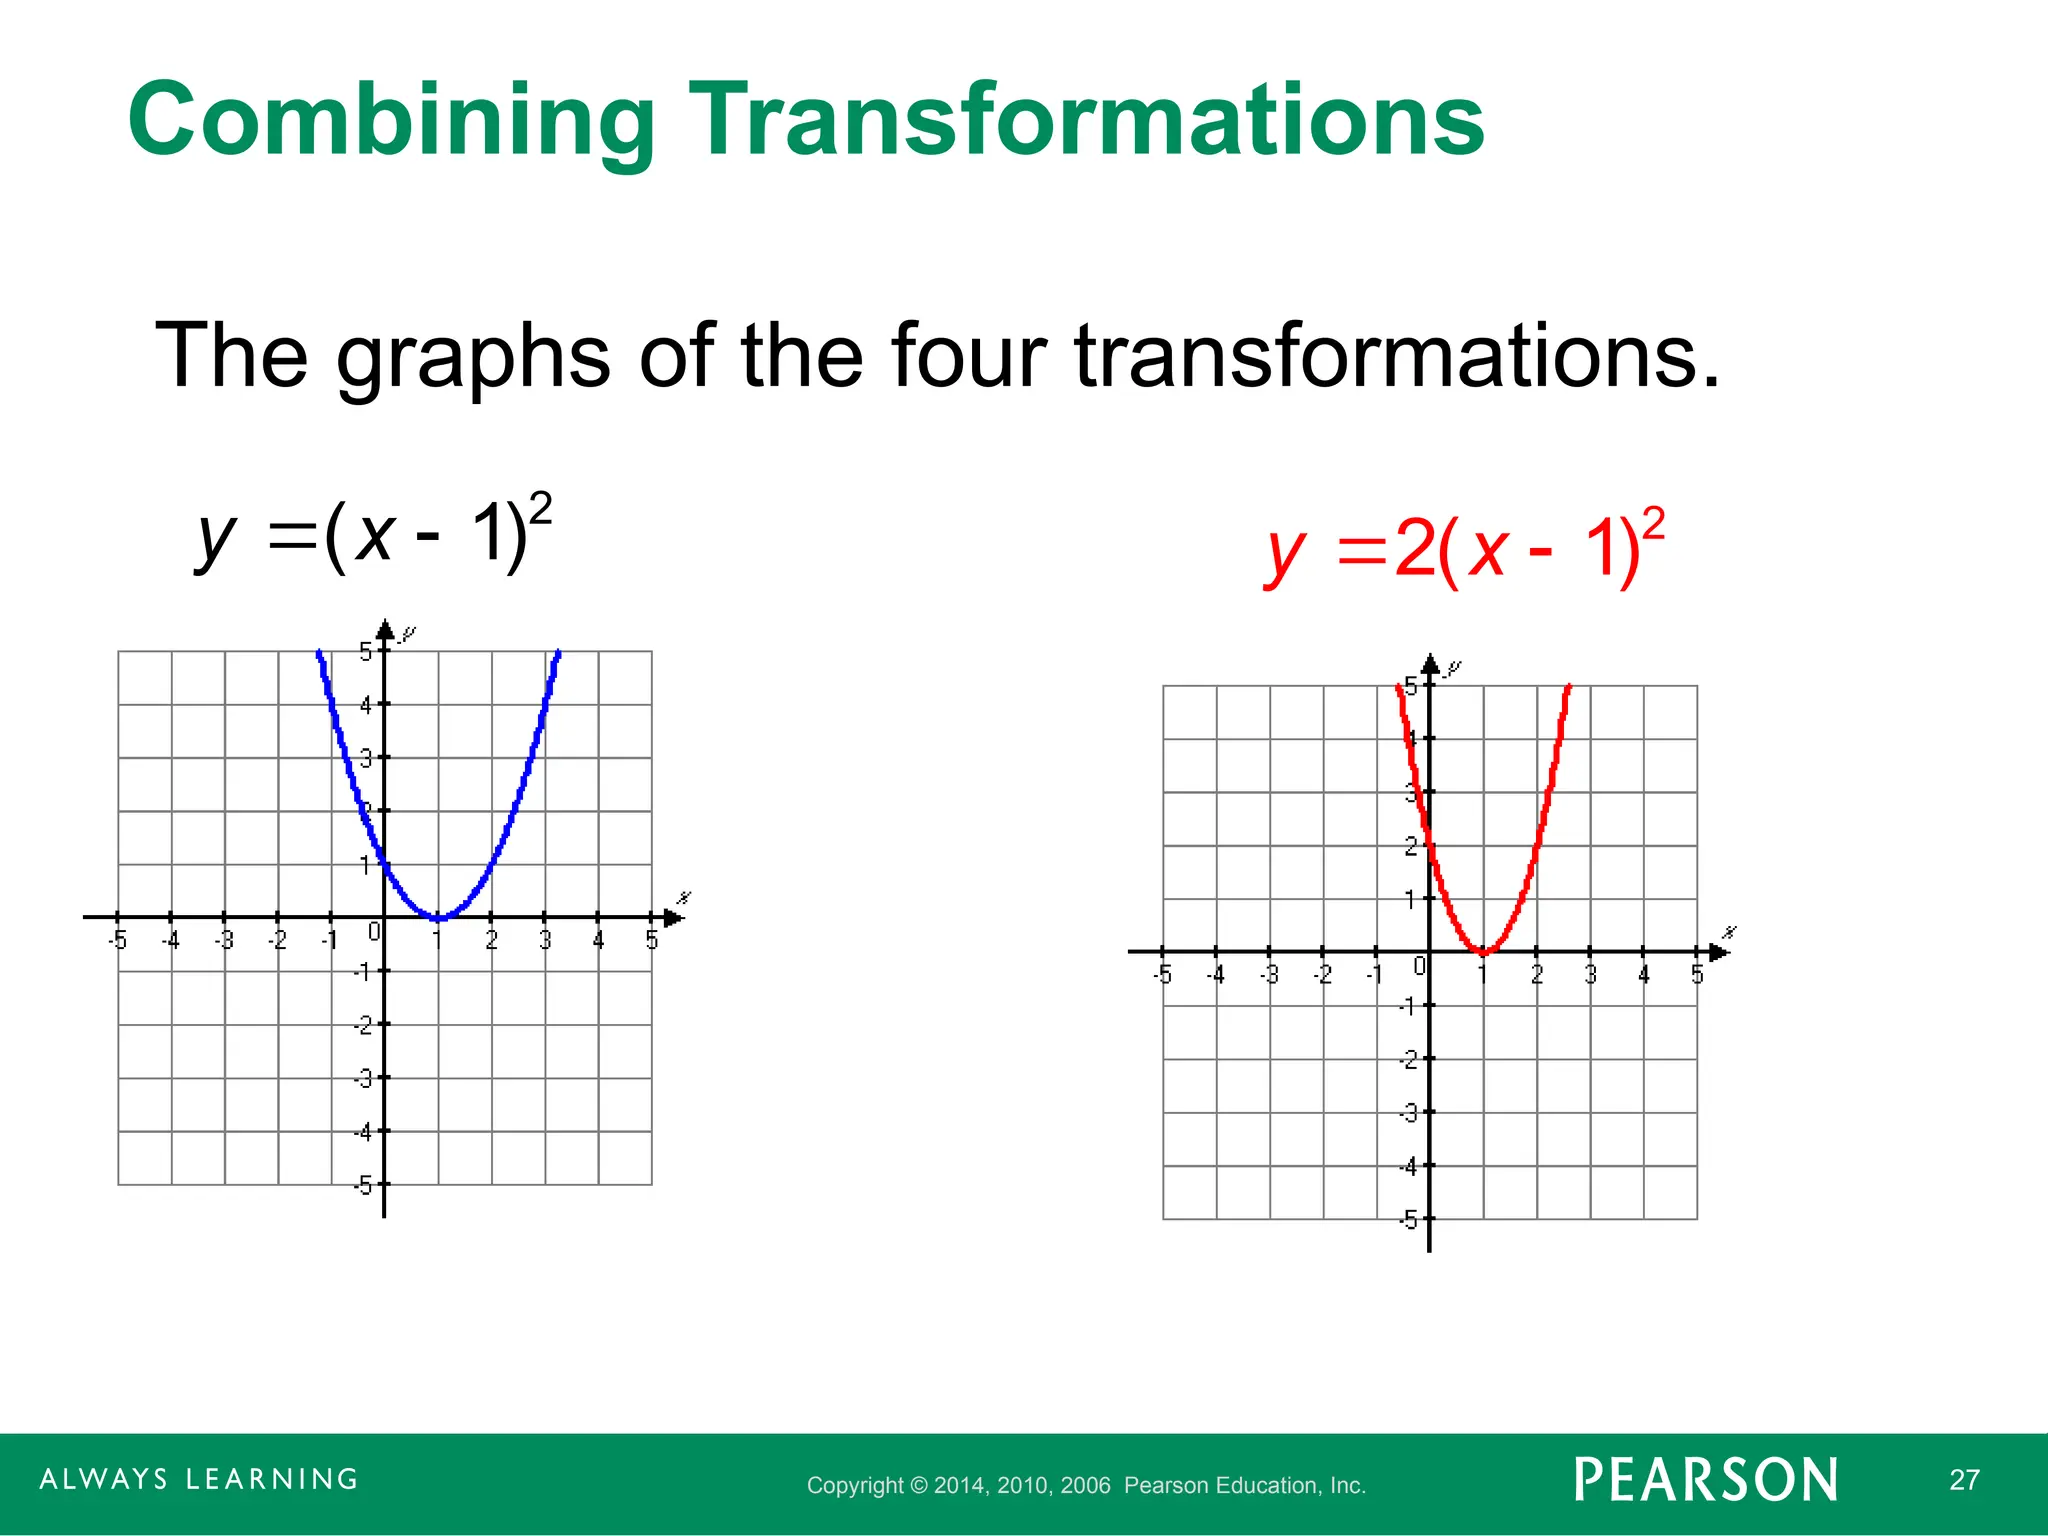
Combining Transformations
The graphs of the four transformations.
2
( 1)
y x
2
2( 1)
y x
- 28.
Copyright © 2014,2010, 2006 Pearson Education, Inc. 28
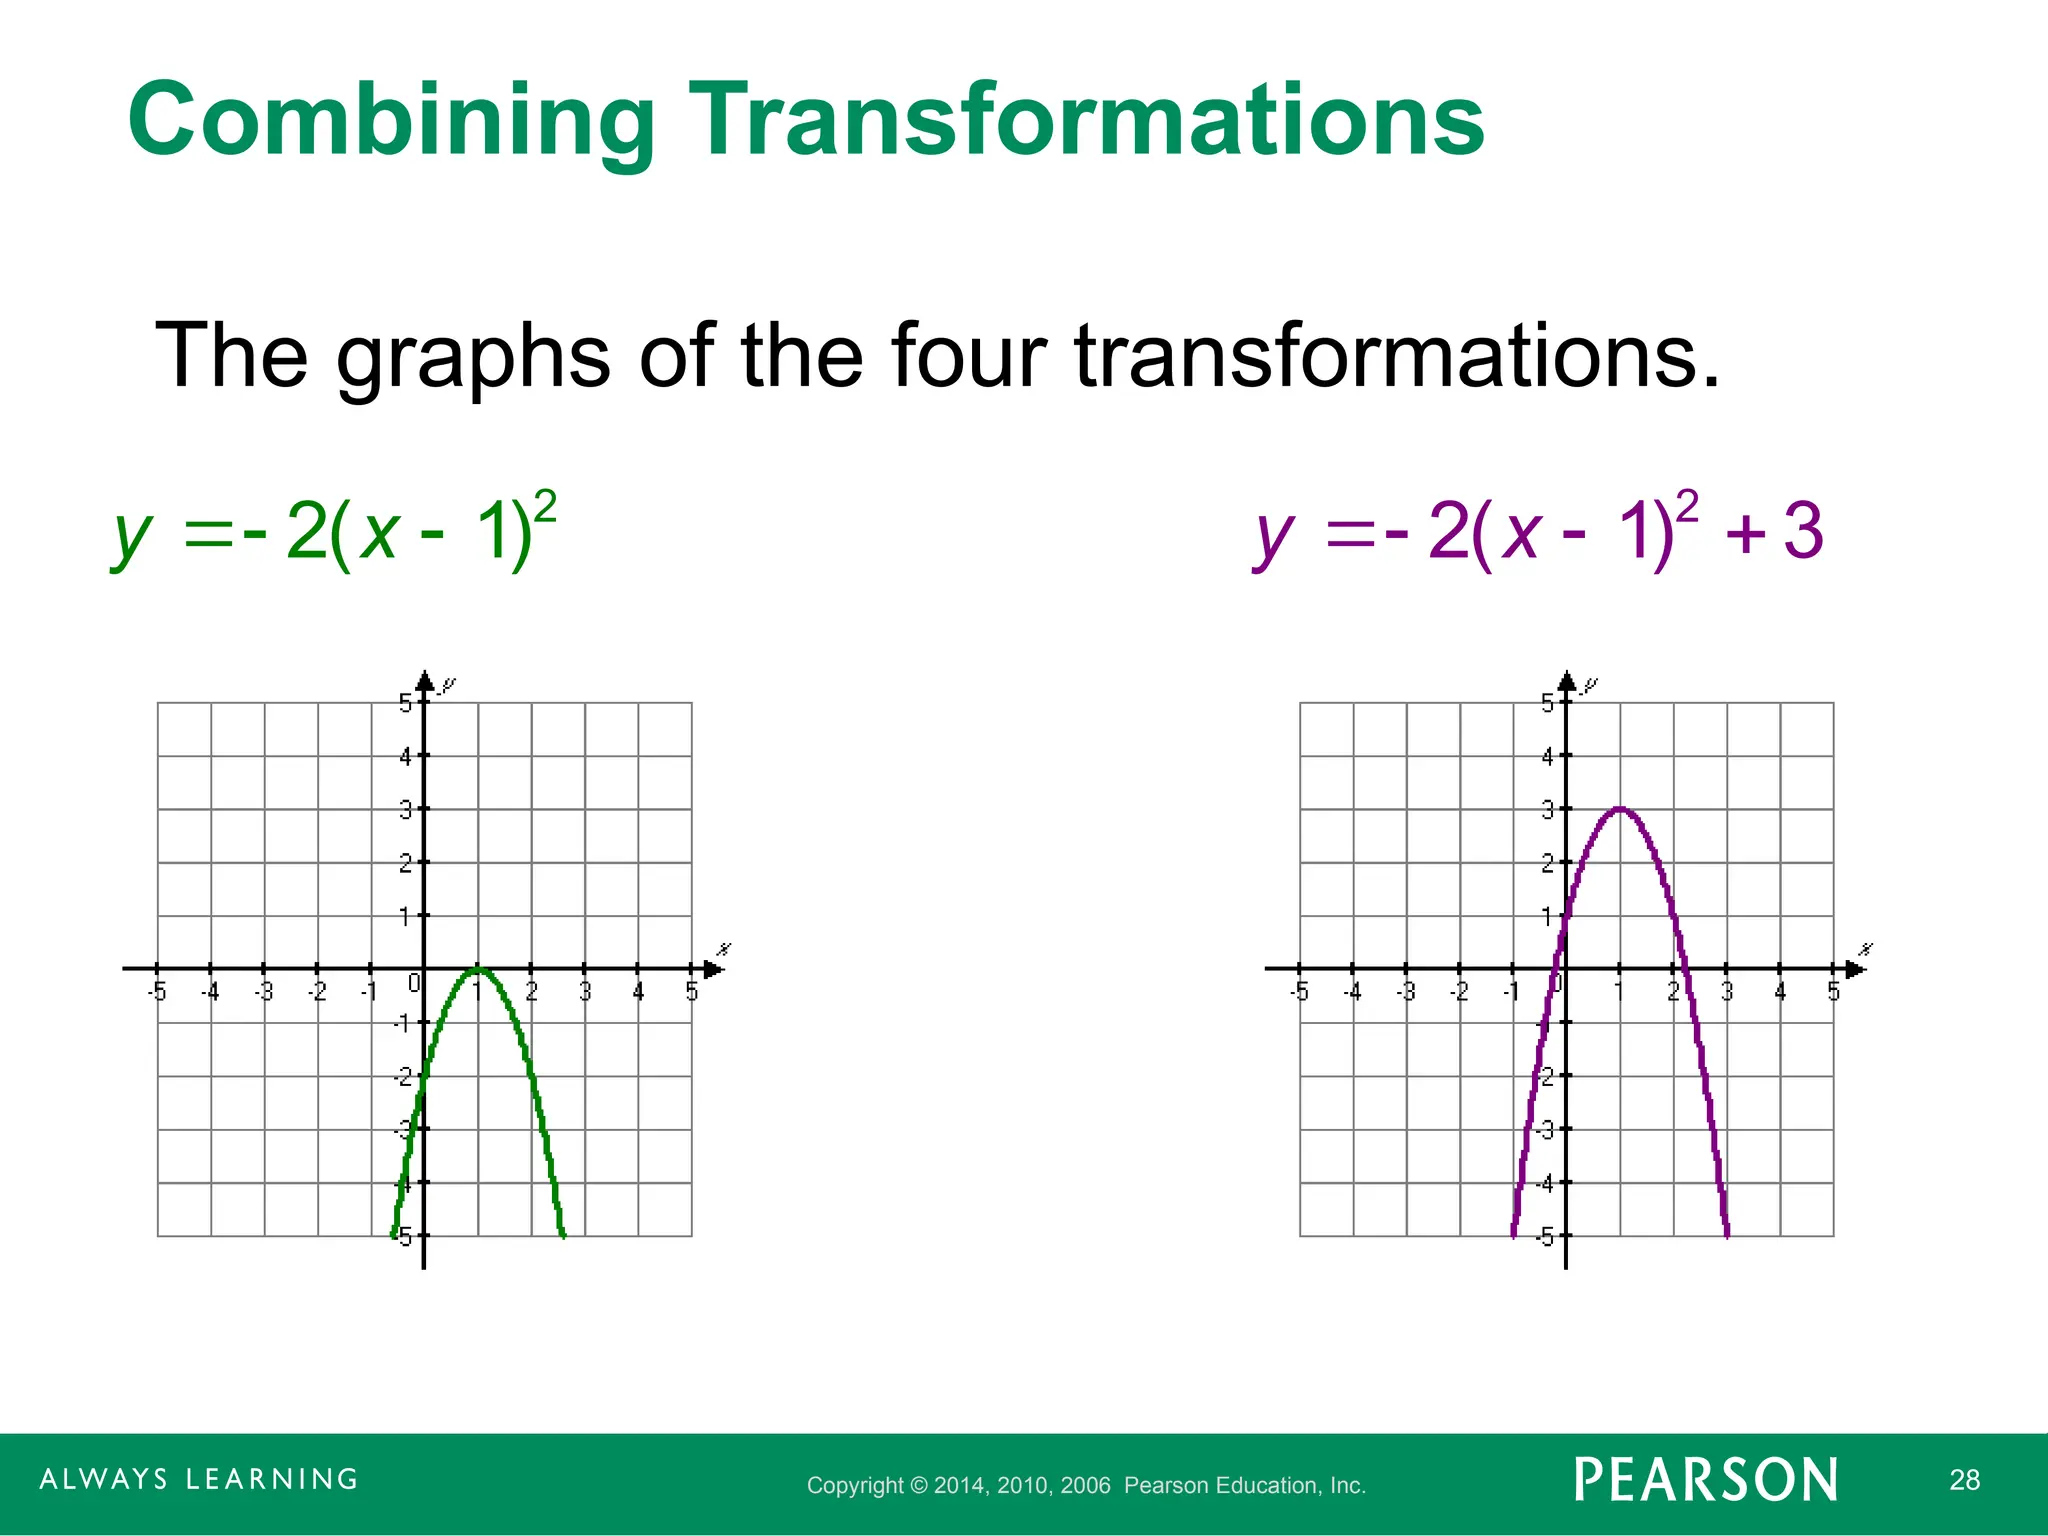
Combining Transformations
The graphs of the four transformations.
2
2( 1)
y x
2
2( 1) 3
y x
- 29.
Copyright © 2014,2010, 2006 Pearson Education, Inc. 29
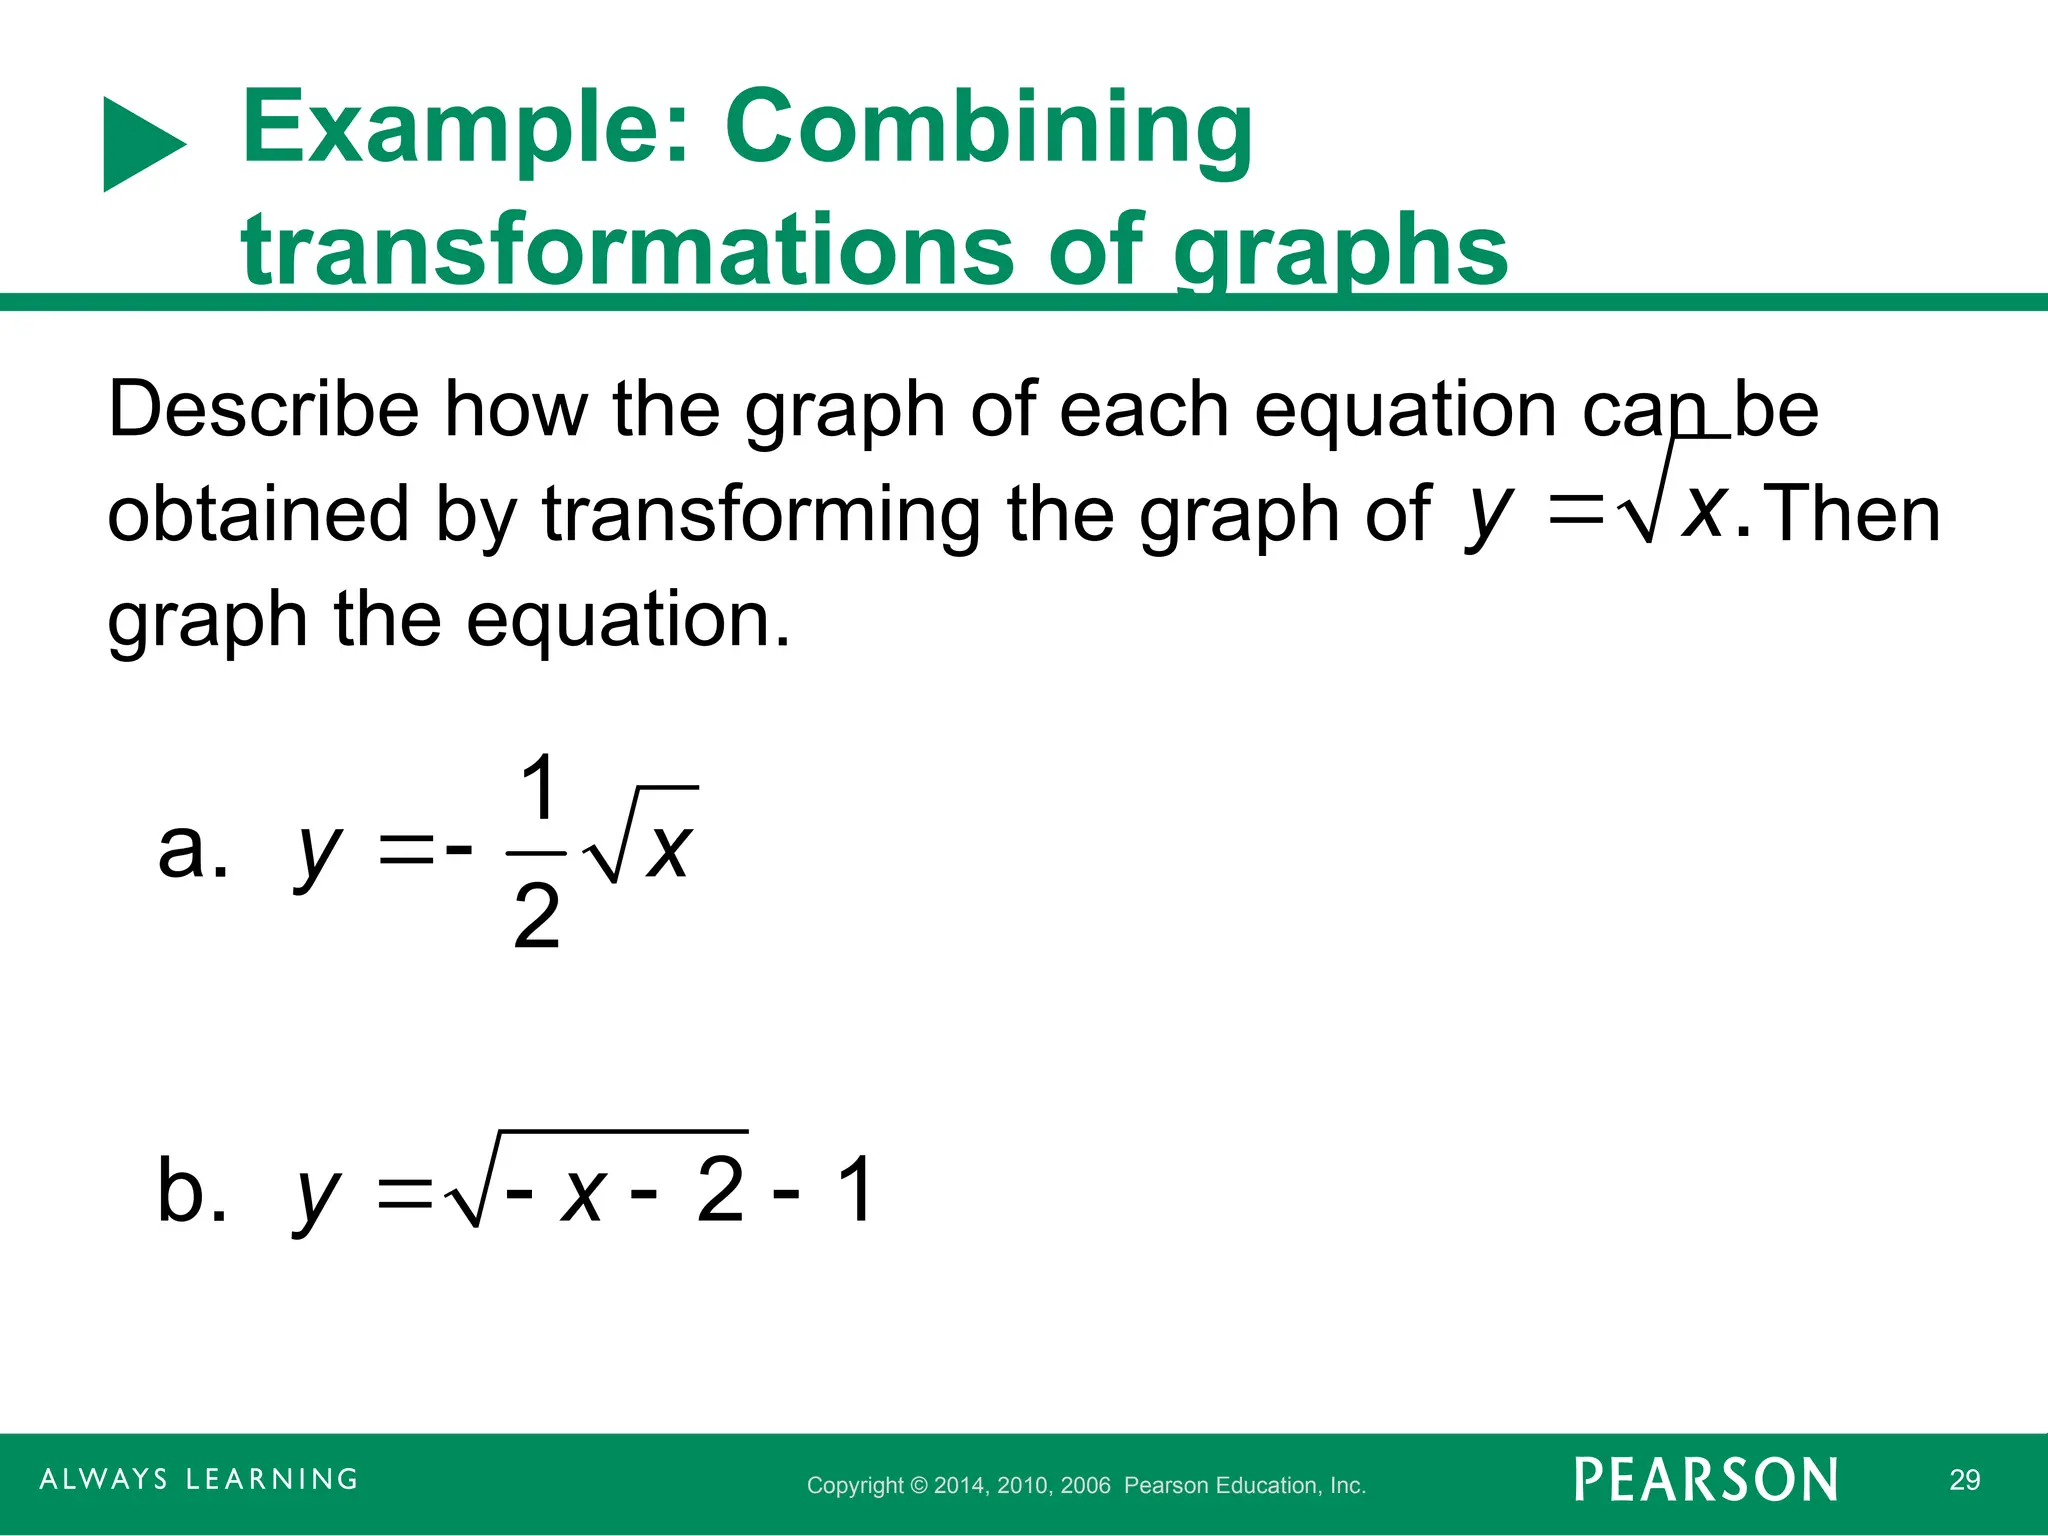
Example: Combining
transformations of graphs
Describe how the graph of each equation can be
obtained by transforming the graph of Then
graph the equation.
y x.
1
a.
2
b. 2 1
y x
y x
- 30.
Copyright © 2014,2010, 2006 Pearson Education, Inc. 30
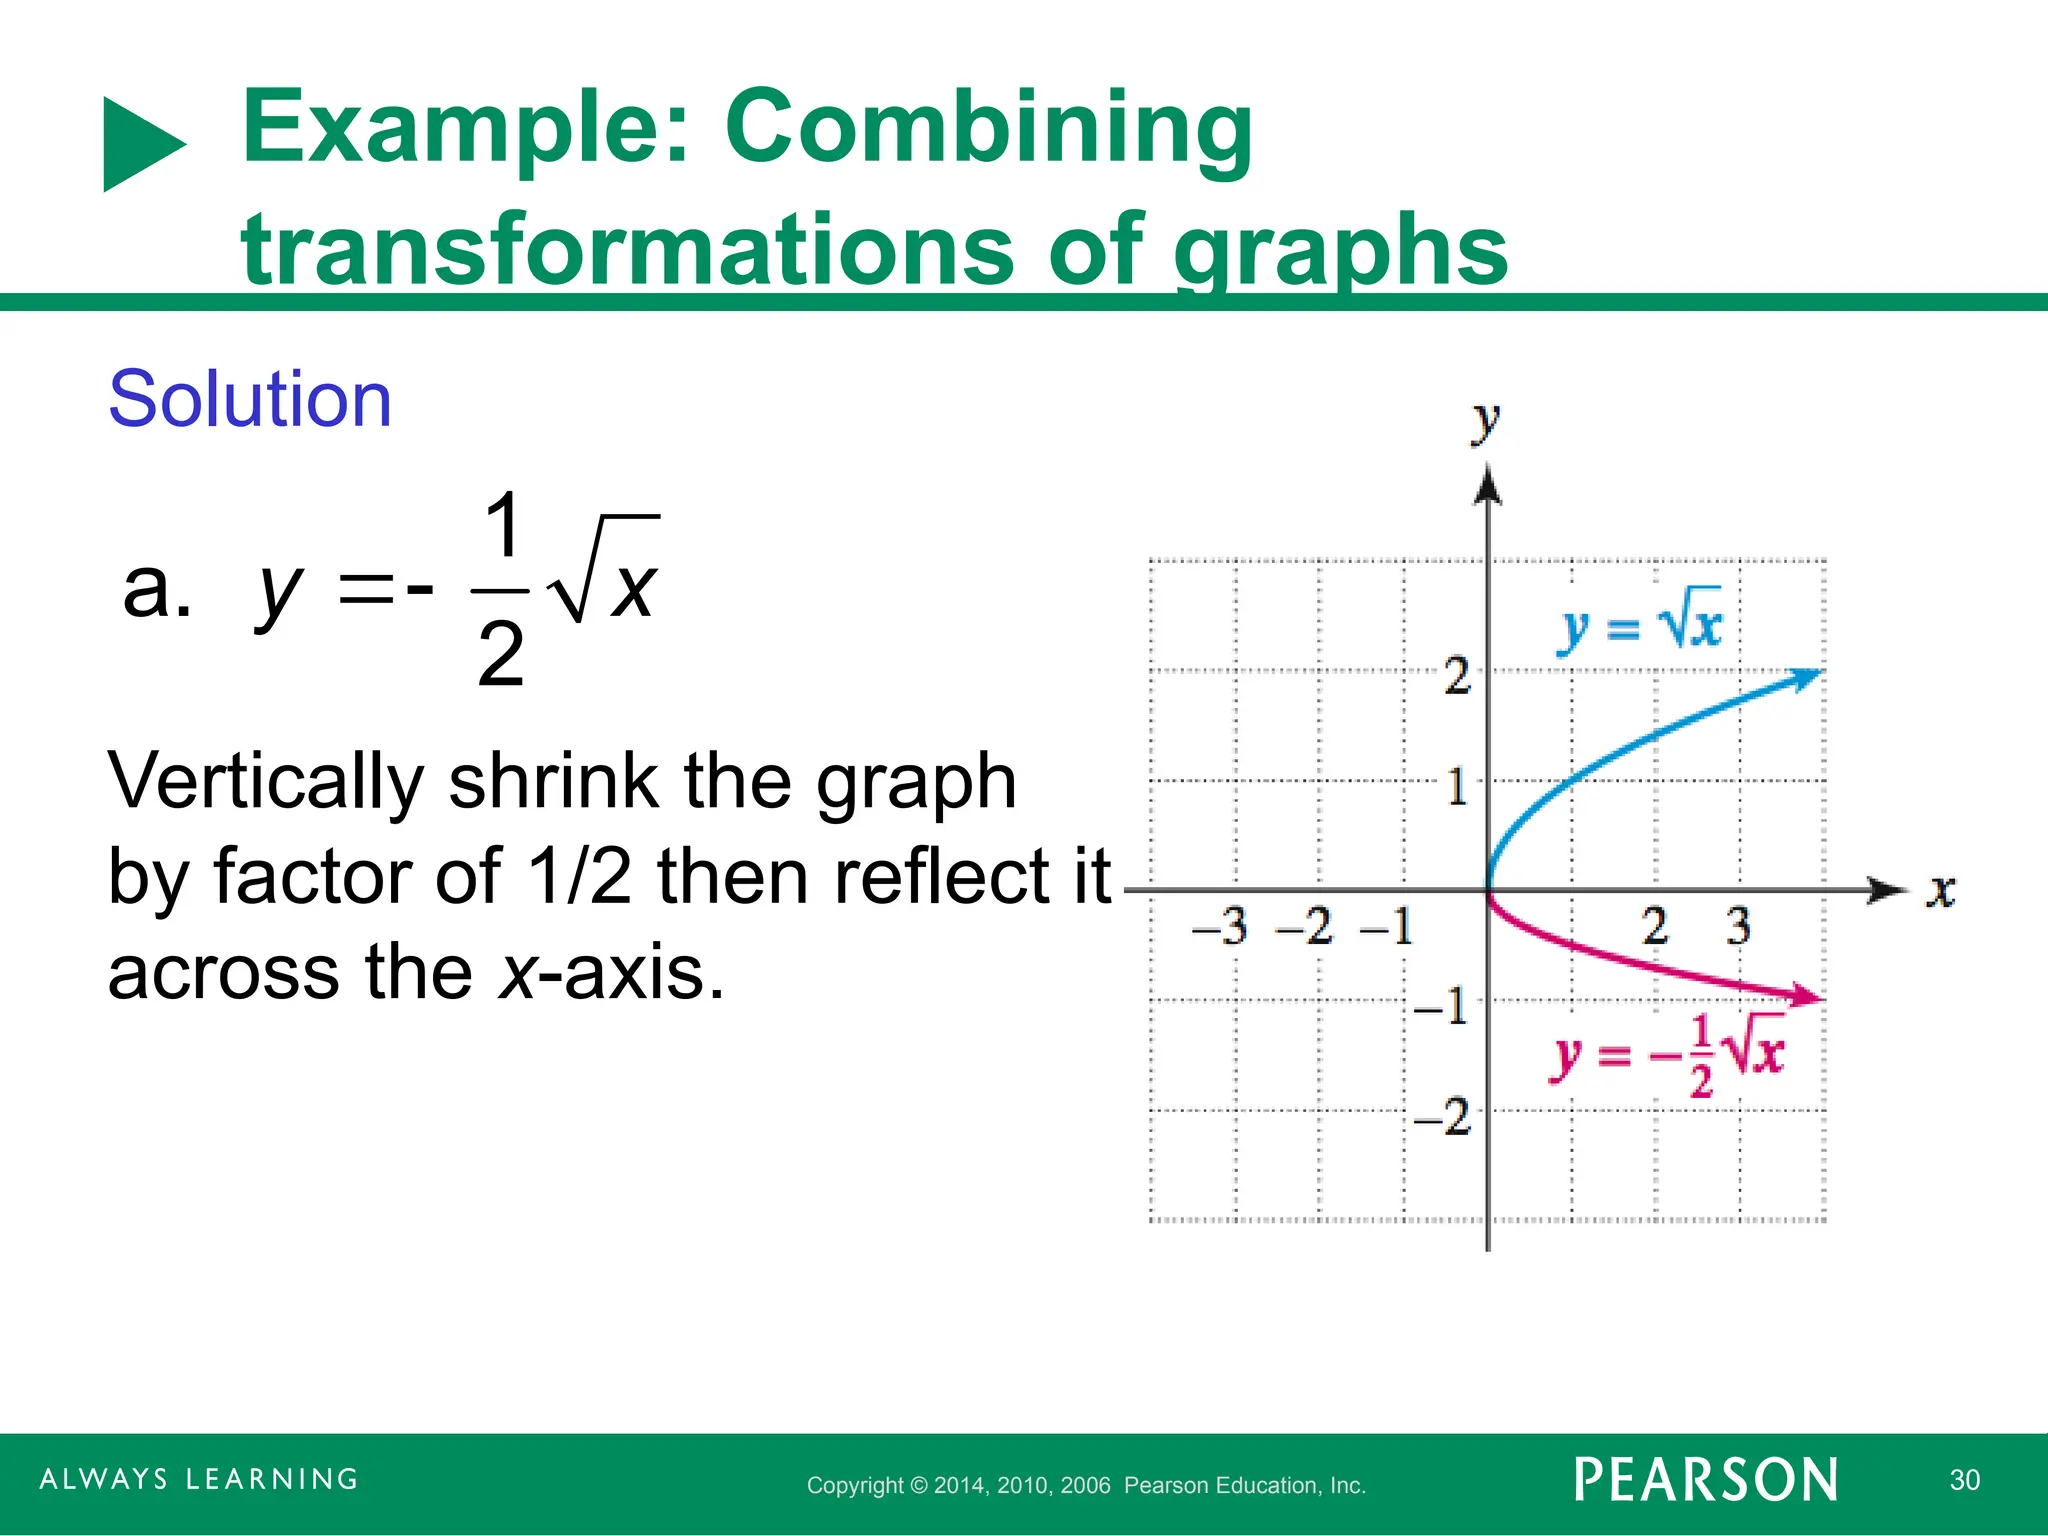
Example: Combining
transformations of graphs
Solution
Vertically shrink the graph
by factor of 1/2 then reflect it
across the x-axis.
a. y
1
2
x
- 31.
Copyright © 2014,2010, 2006 Pearson Education, Inc. 31
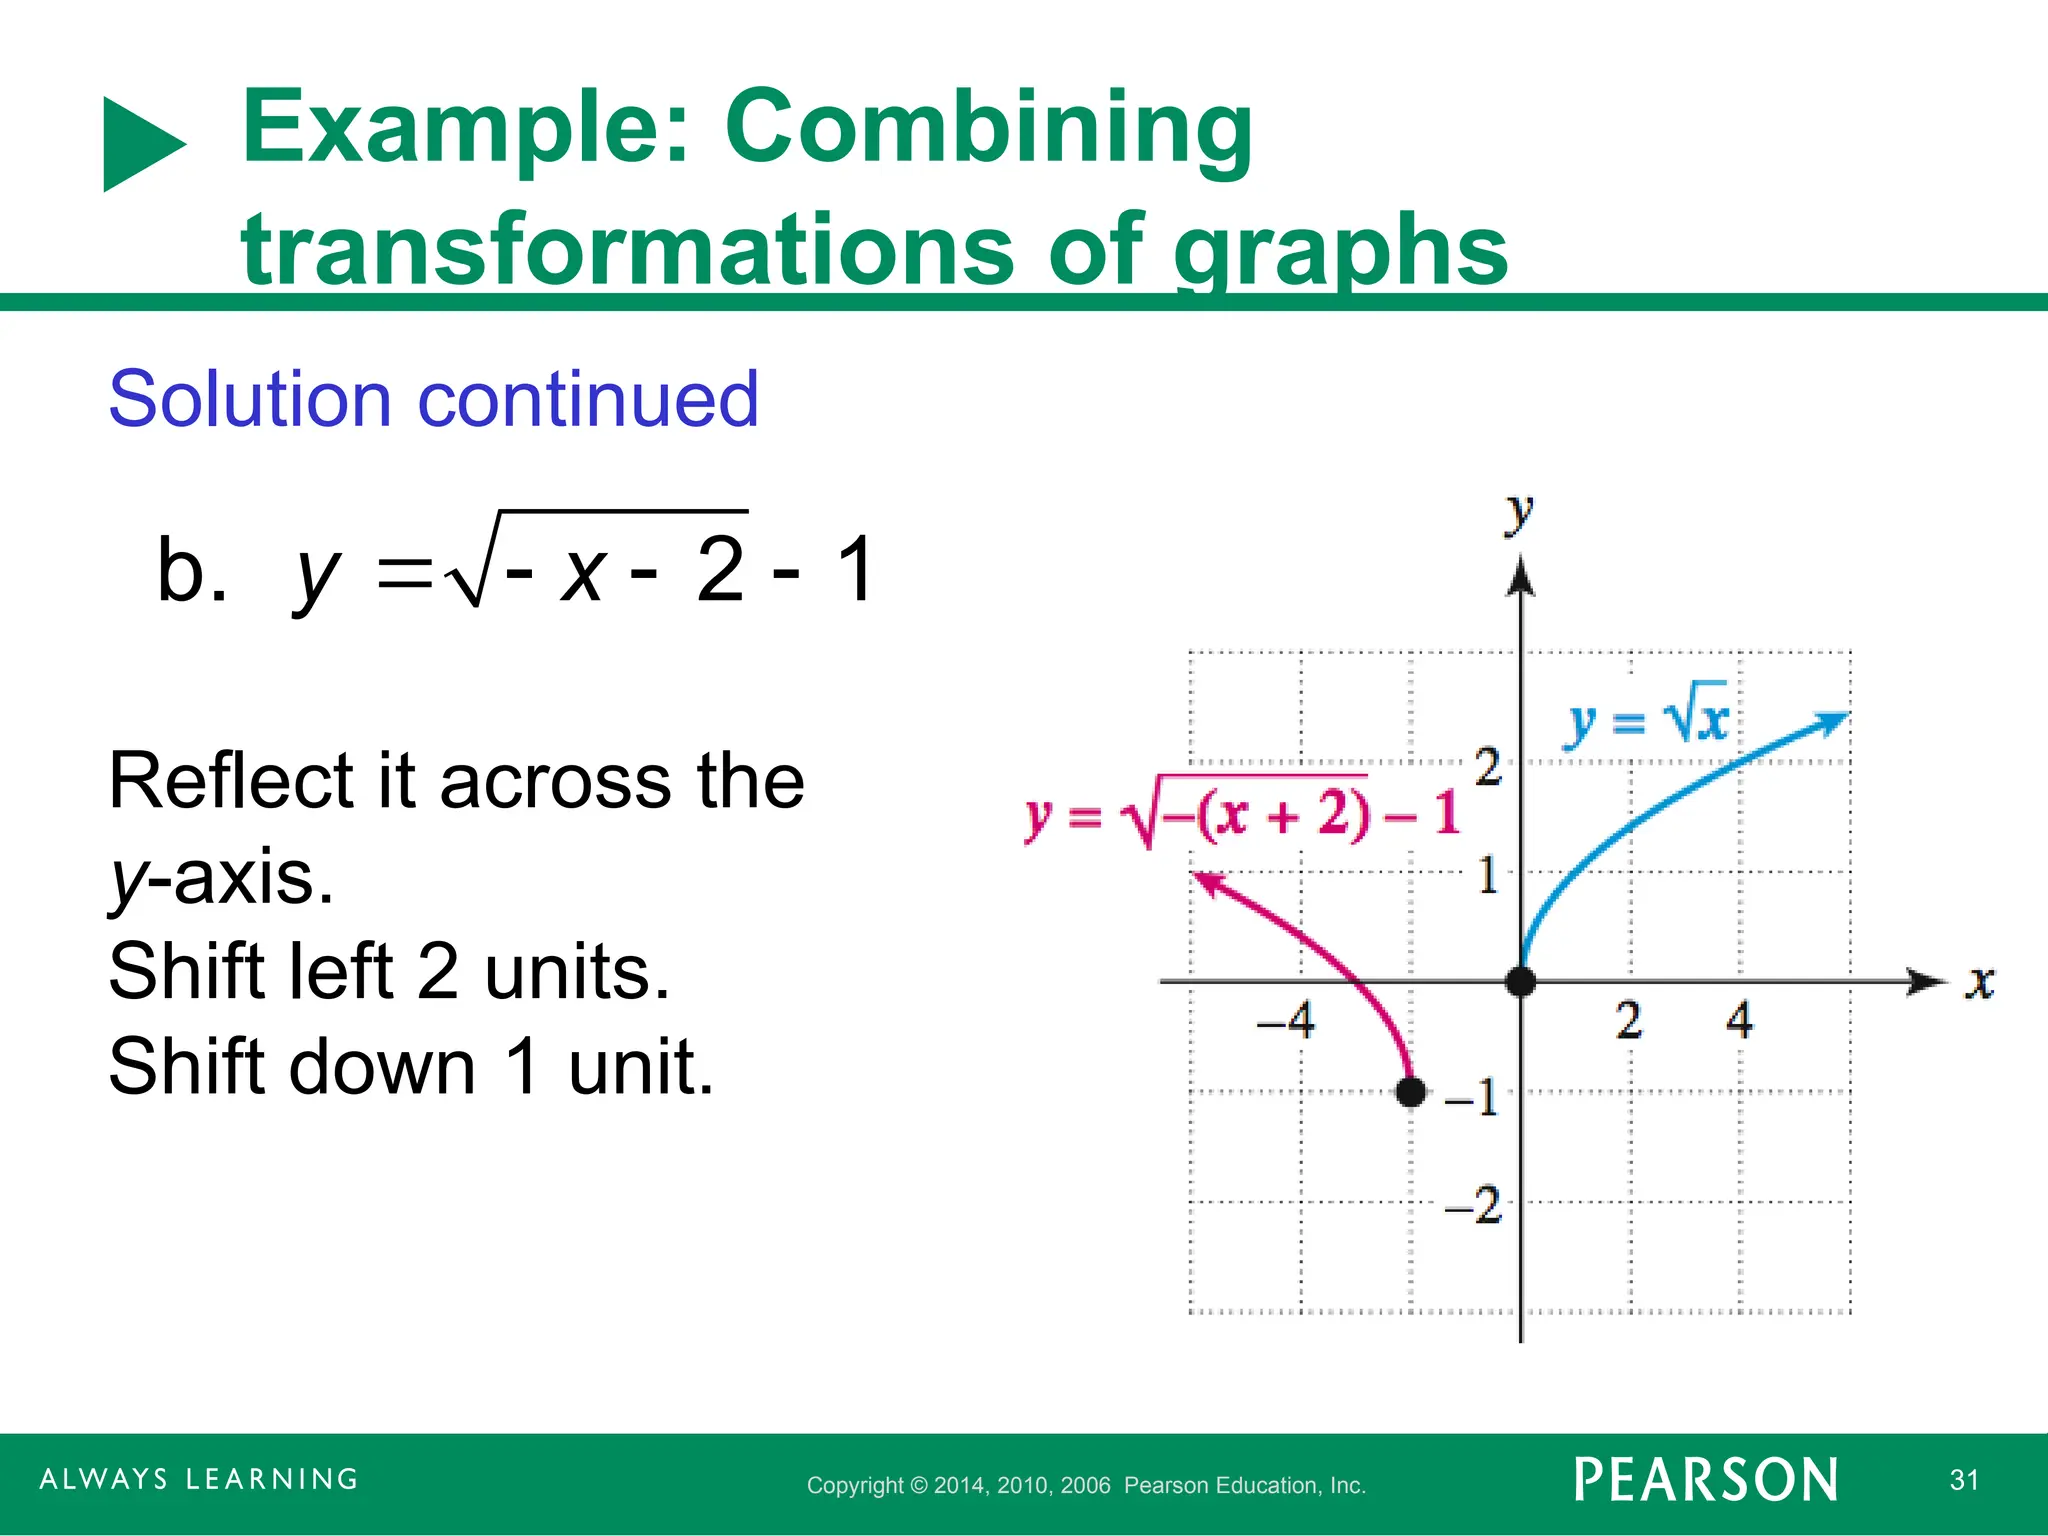
Example: Combining
transformations of graphs
Solution continued
Reflect it across the
y-axis.
Shift left 2 units.
Shift down 1 unit.
b. 2 1
y x
- 32.
Copyright © 2014,2010, 2006 Pearson Education, Inc. 32
Modeling Data with Transformations
Transformations of the graph of y = x2
can be
used to model some types of nonlinear data.
By shifting, stretching, and shrinking this
graph, we can transform it into a portion of a
parabola that has the desired shape and
location. In the next example we
demonstrate this technique by modeling
numbers of Wal-Mart employees.
- 33.
Copyright © 2014,2010, 2006 Pearson Education, Inc. 33
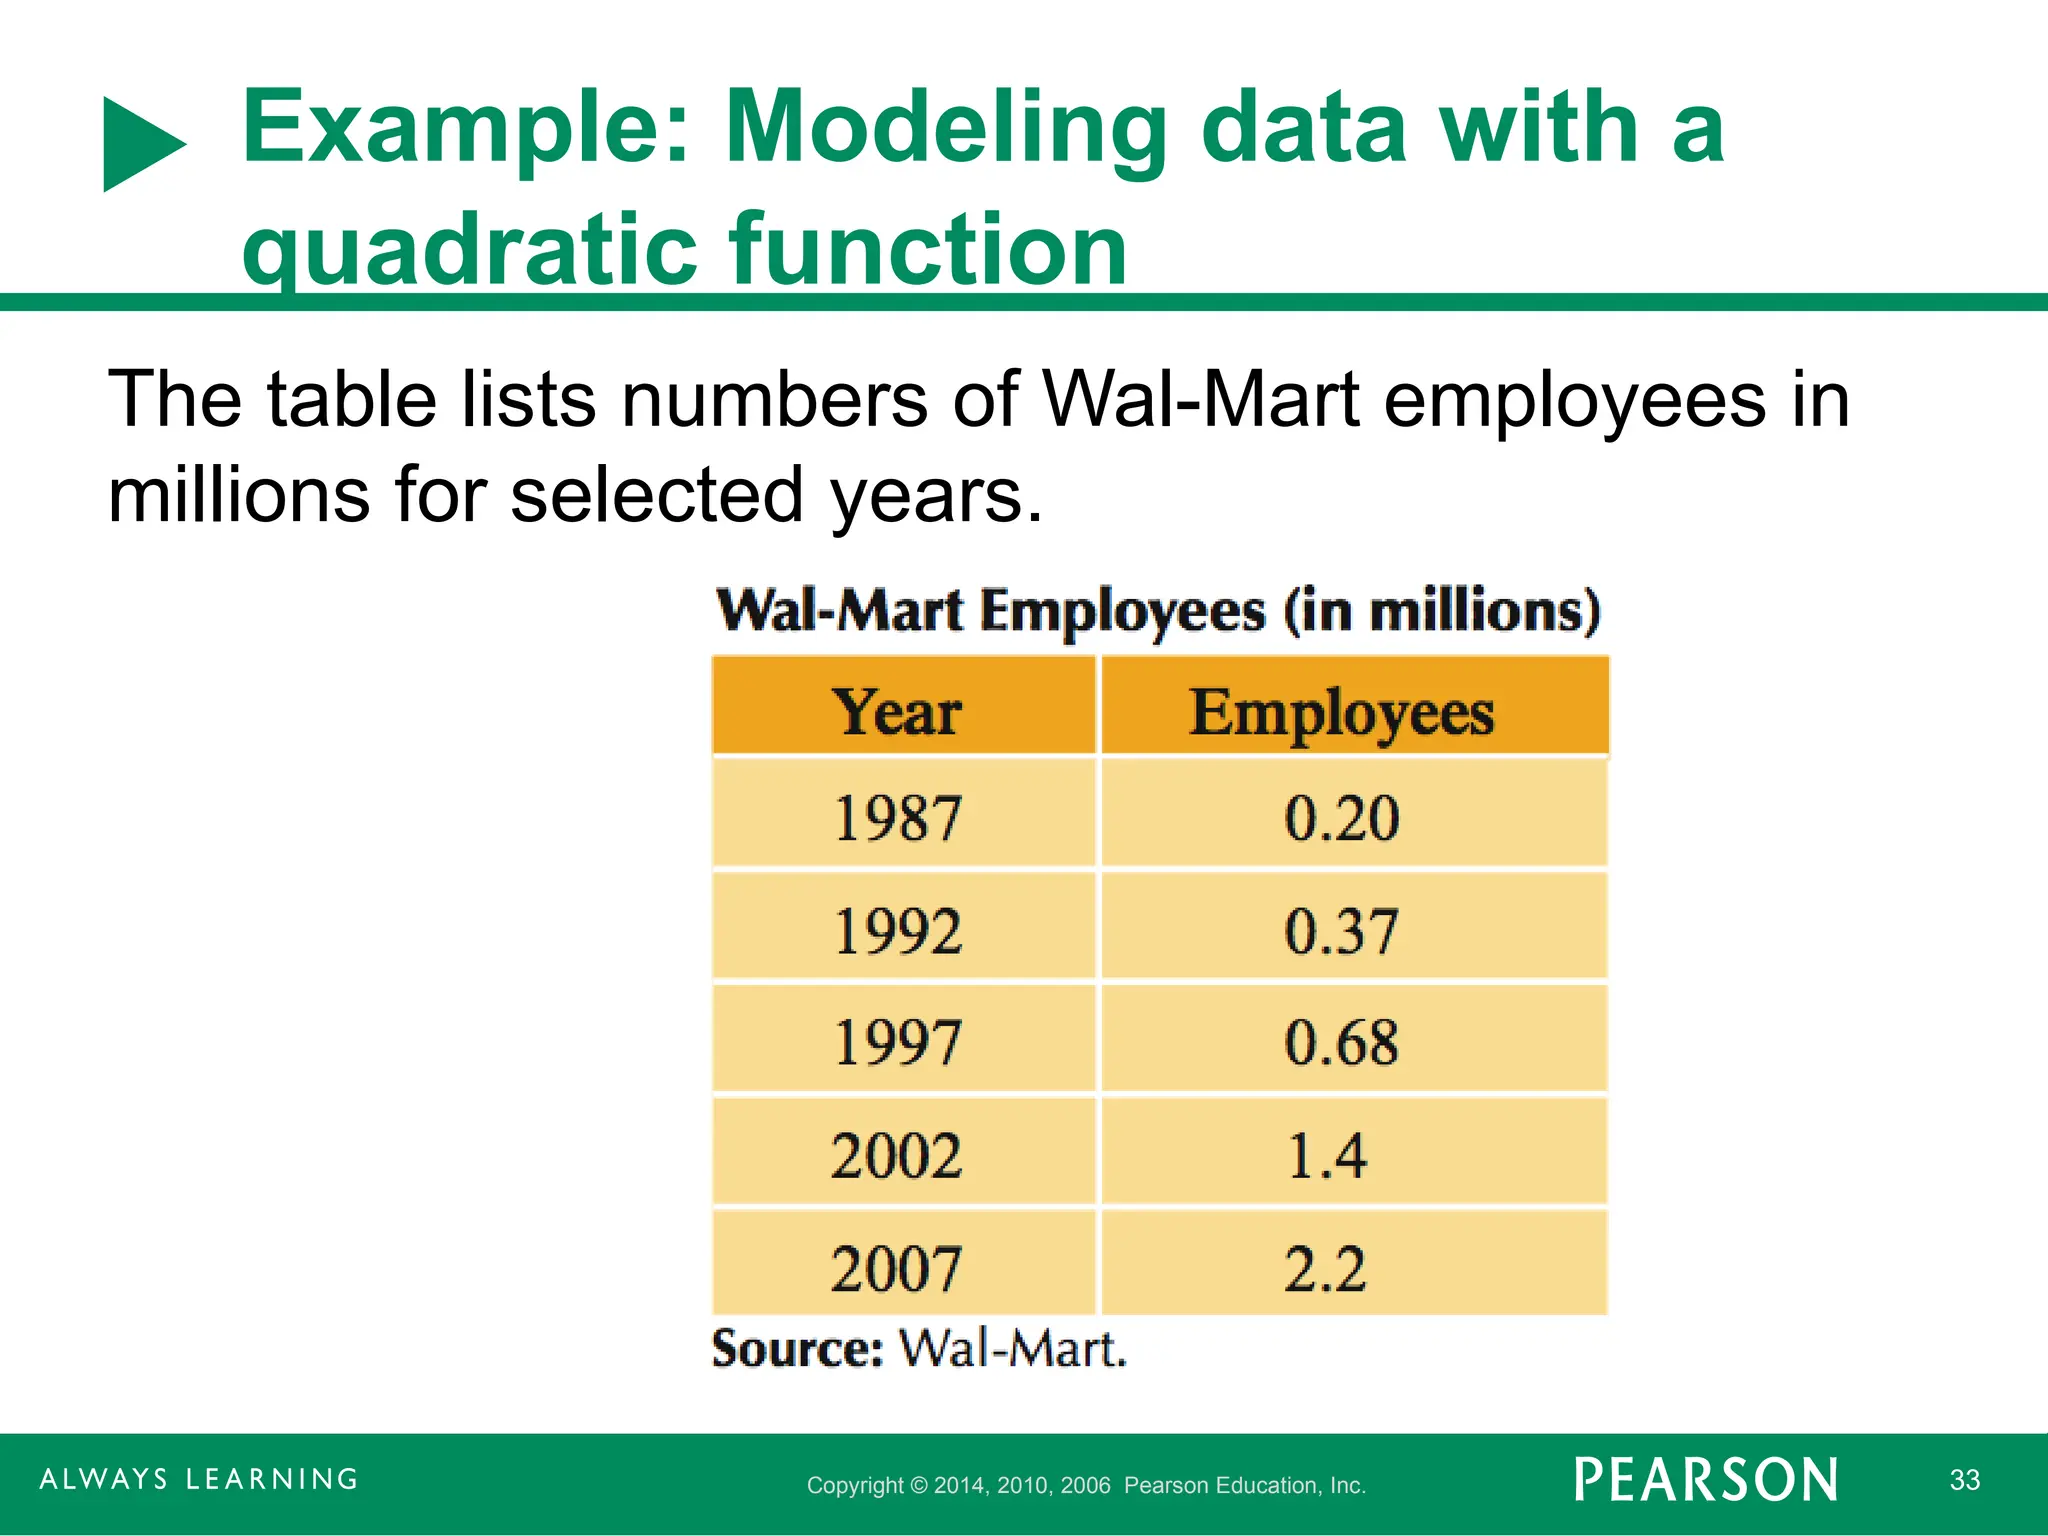
Example: Modeling data with a
quadratic function
The table lists numbers of Wal-Mart employees in
millions for selected years.
- 34.
Copyright © 2014,2010, 2006 Pearson Education, Inc. 34
Example: Modeling data with a
quadratic function
(a) Make a scatterplot of the data.
(b) Use transformations of graphs to determine
f(x) =a(x – h)2
+ k so that f(x) models the data.
Graph y = f(x) together with the data.
(c) Use f(x) to estimate the number of Wal-Mart
employees in 2010. Compare it with the actual
value of 2.1 million employees.
- 35.
Copyright © 2014,2010, 2006 Pearson Education, Inc. 35
Example: Modeling data with a
quadratic function
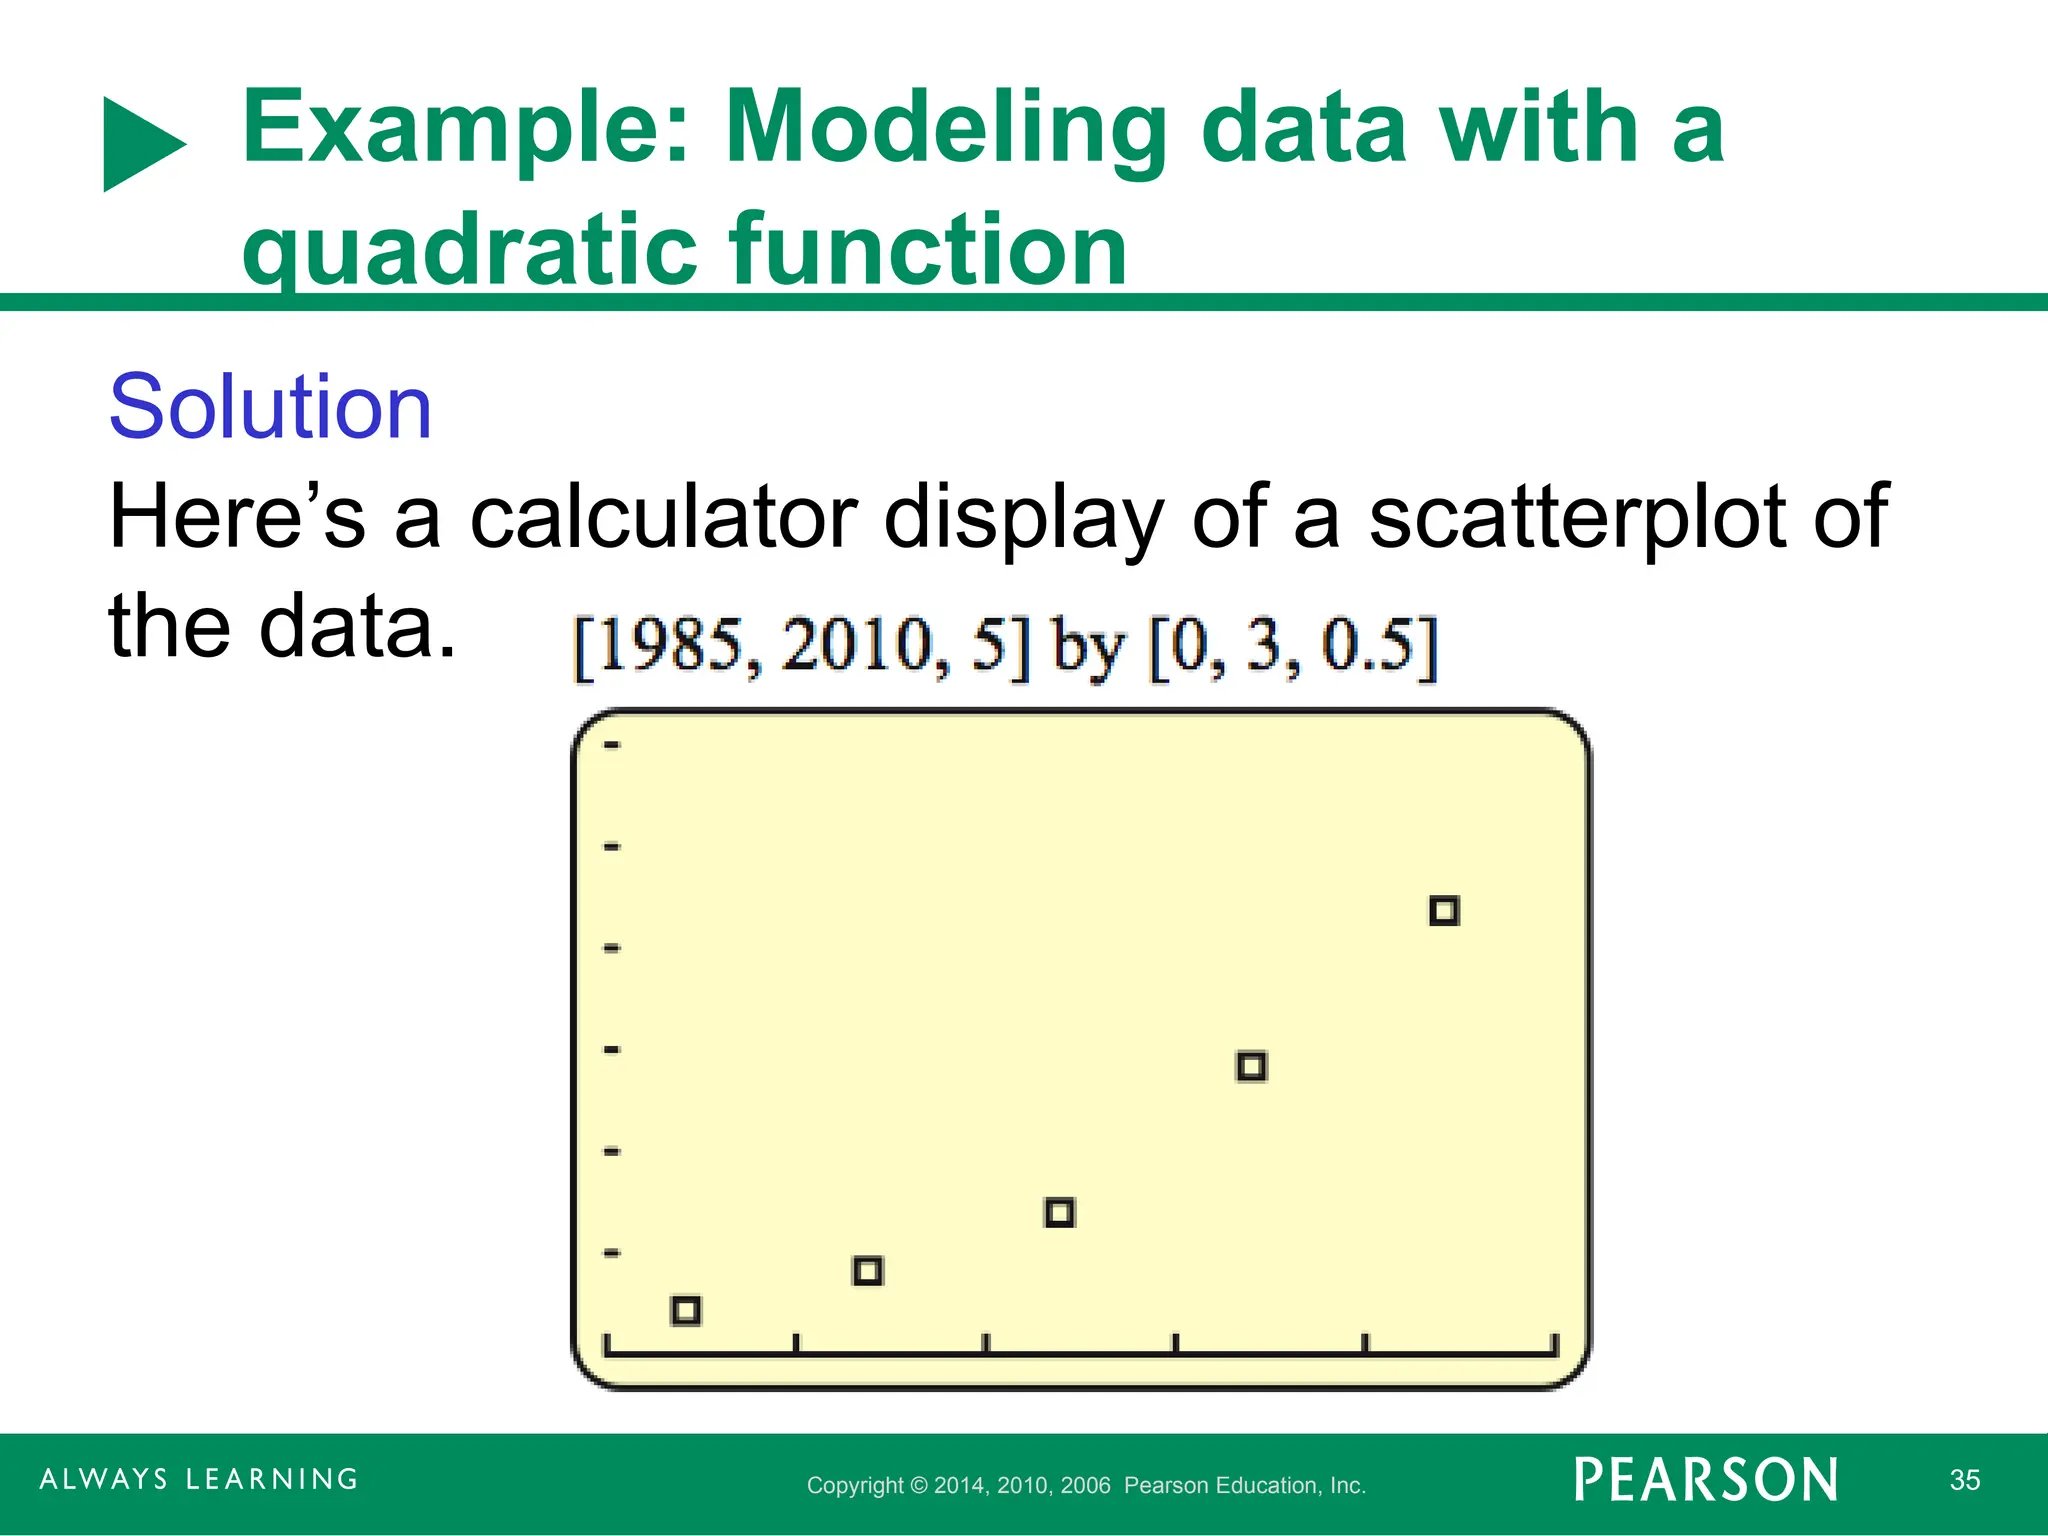
Solution
Here’s a calculator display of a scatterplot of
the data.
- 36.
Copyright © 2014,2010, 2006 Pearson Education, Inc. 36
Example: Modeling data with a
quadratic function
Solution continued
It’s a parabola opening up so a > 0.
Vertex (minimum number of employees) could
be (1987, 0.20): translate graph right 1987
units and up 0.20 unit.
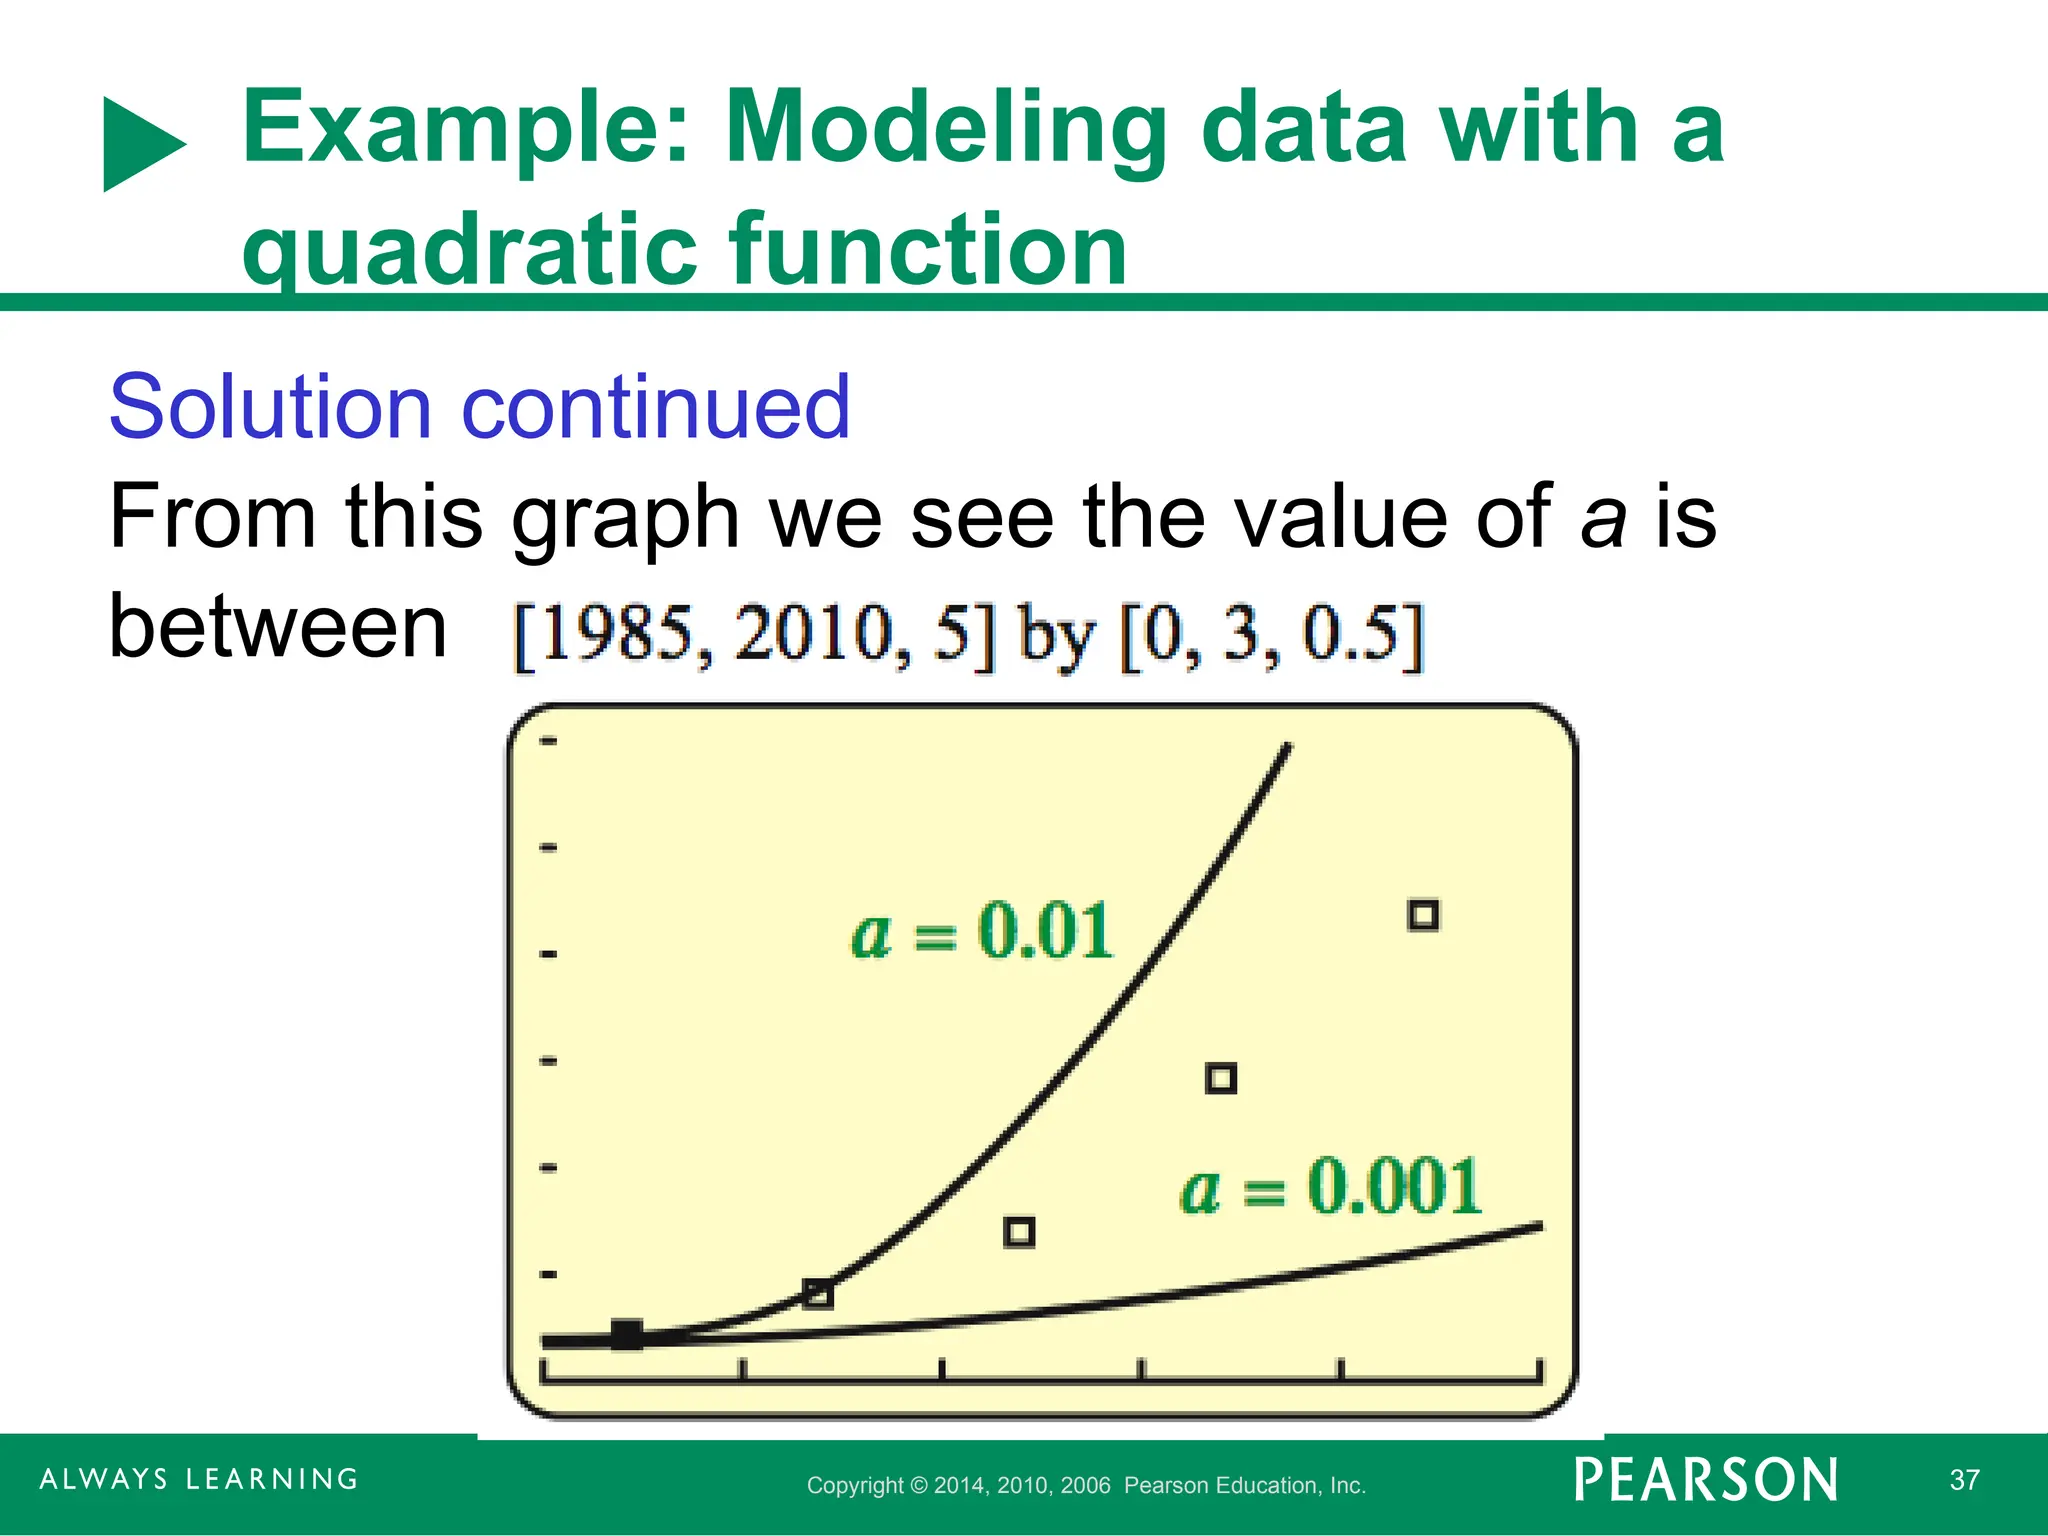
f(x) = a(x – 1987) + 0.20
To determine a, graph the data for different
values of a:
First graph a = 0.001 and a = 0.01.
- 37.
Copyright © 2014,2010, 2006 Pearson Education, Inc. 37
Example: Modeling data with a
quadratic function
Solution continued
From this graph we see the value of a is
between 0.001 and 0.01.
- 38.
Copyright © 2014,2010, 2006 Pearson Education, Inc. 38
Example: Modeling data with a
quadratic function
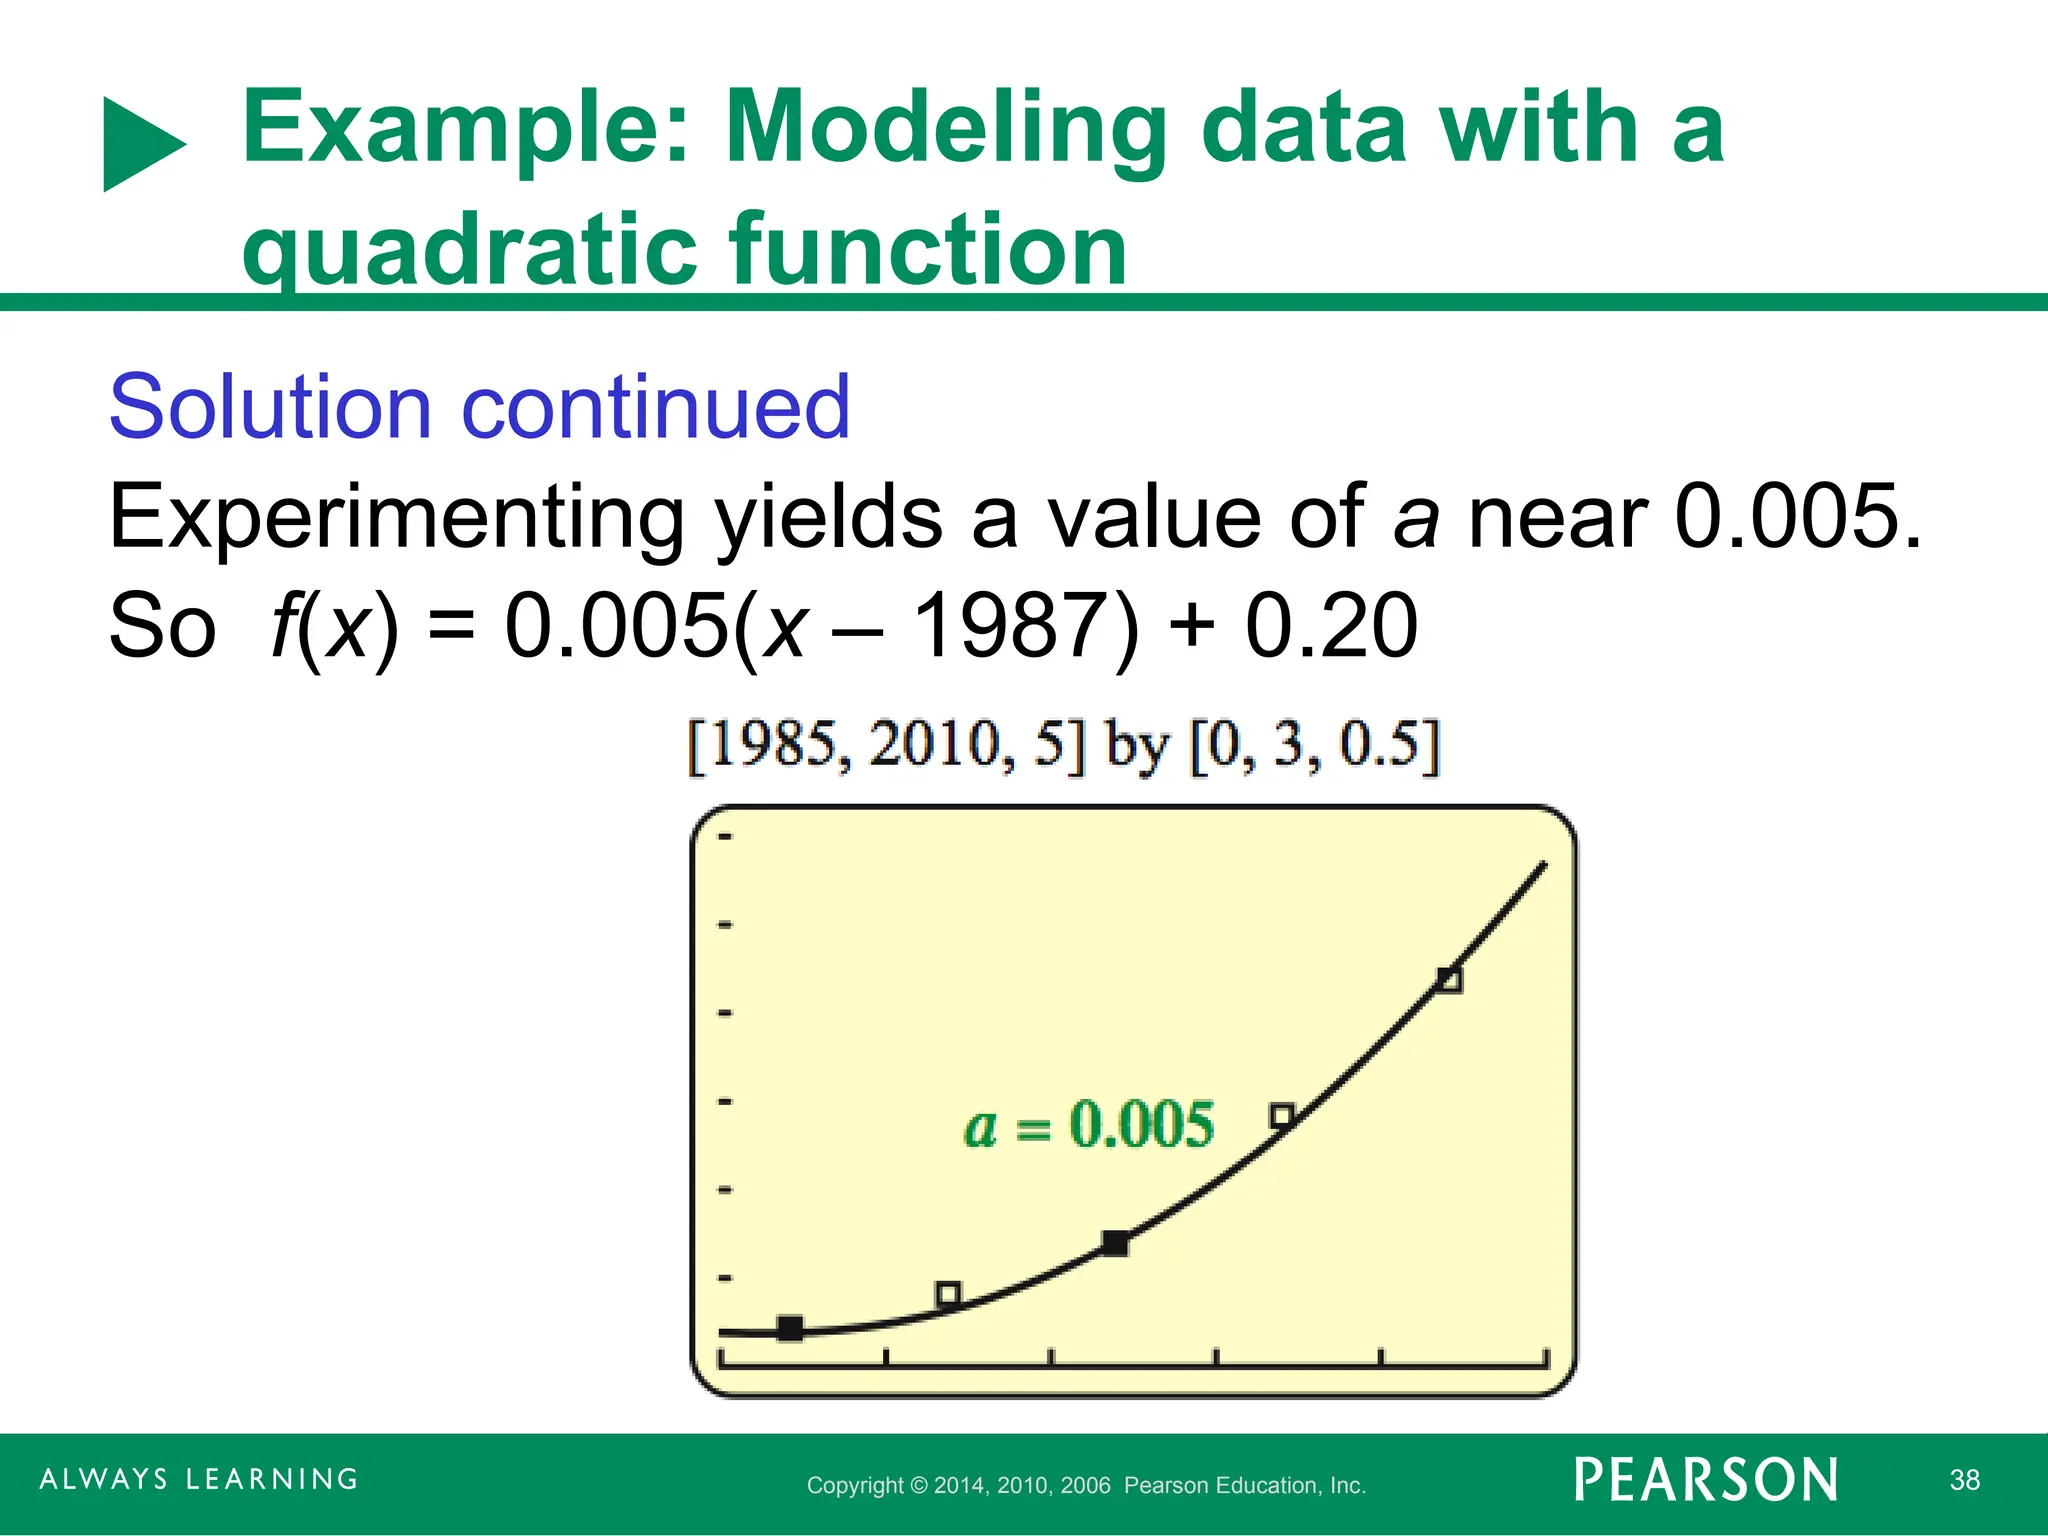
Solution continued
Experimenting yields a value of a near 0.005.
So f(x) = 0.005(x – 1987) + 0.20