Download as PDF, PPTX
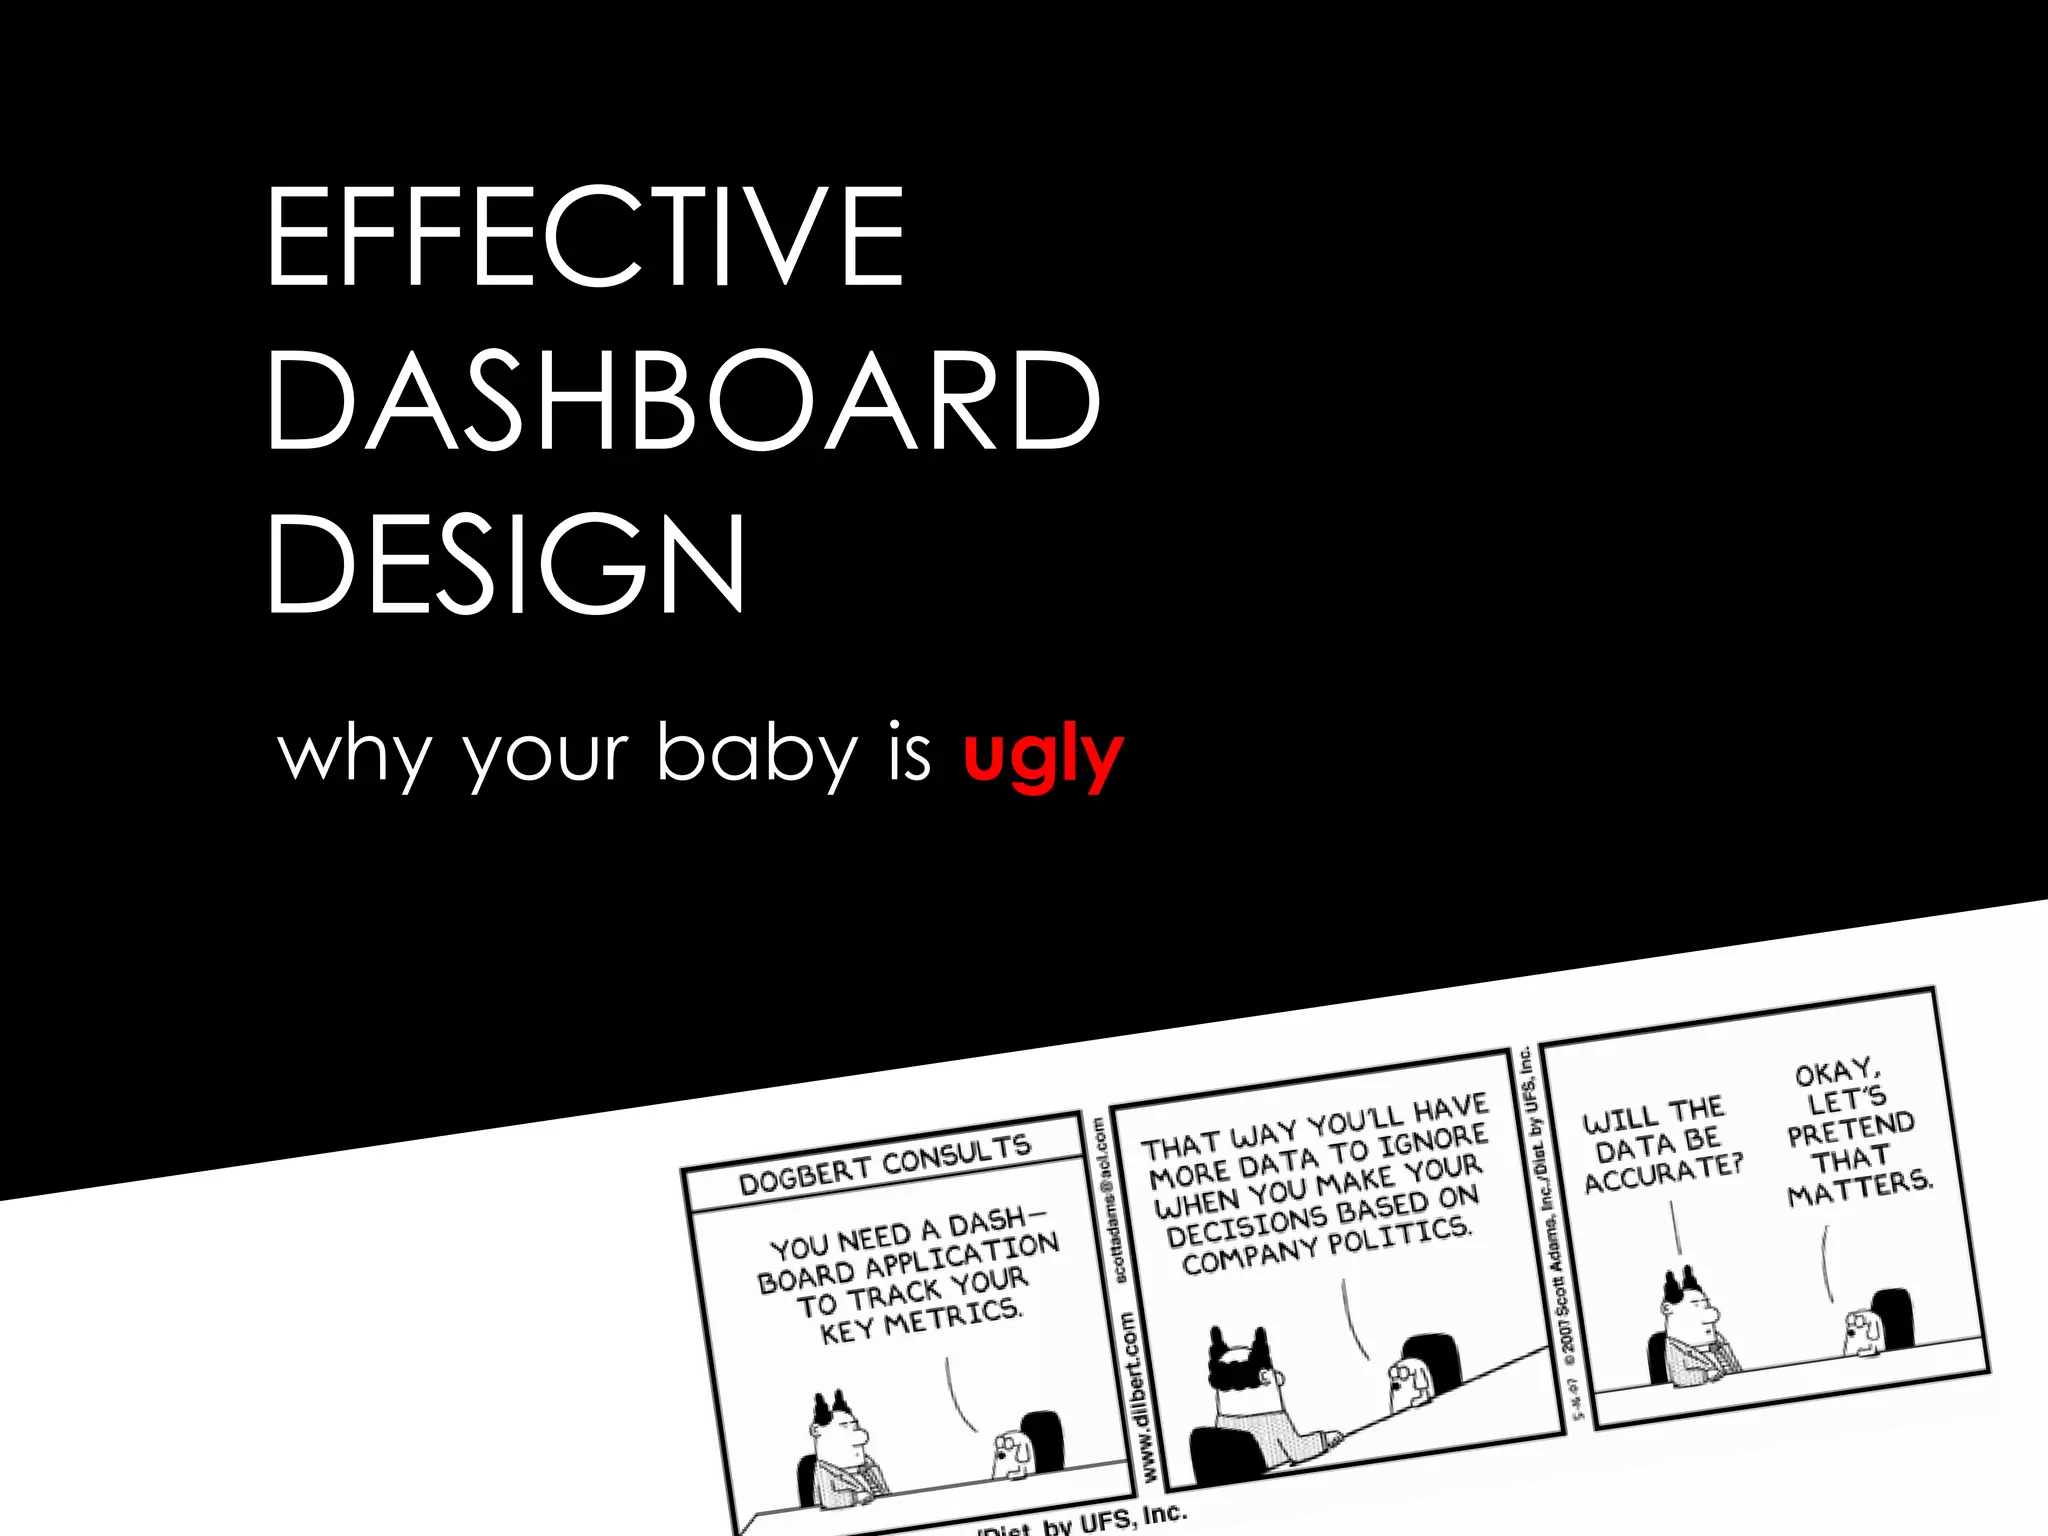


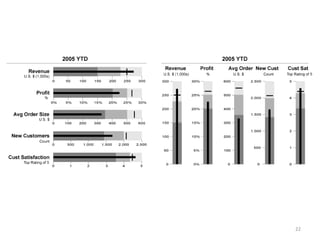
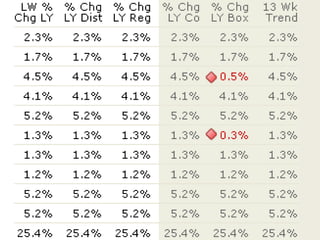


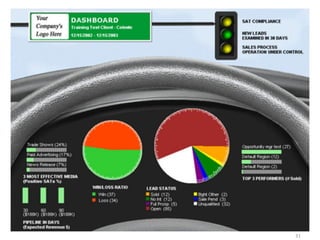
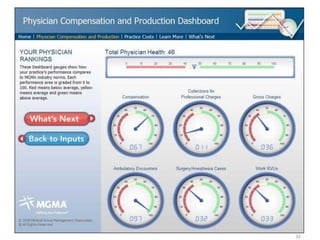
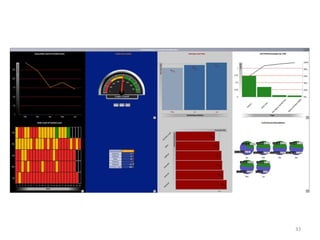
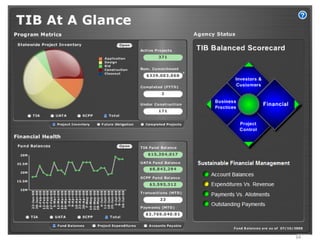


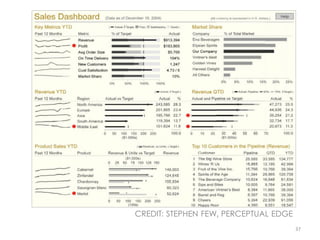
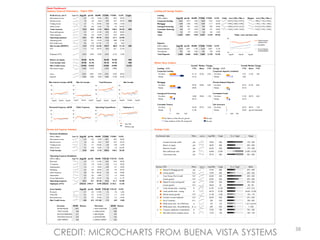
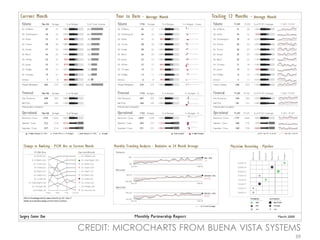
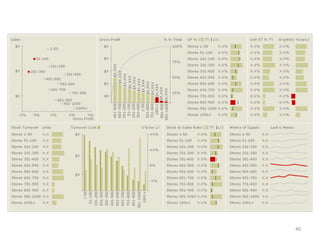
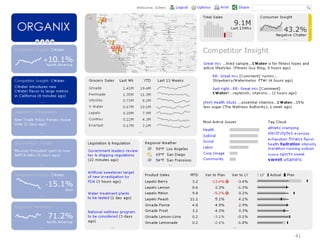


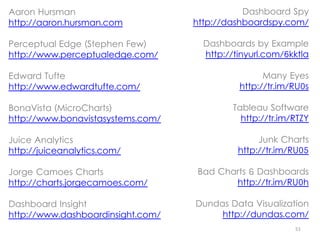

The document discusses the concept of effective dashboard design, defining a dashboard as a visual display that consolidates important information for easy monitoring. It emphasizes design techniques and presents various resources and examples related to dashboard creation. Additionally, it features contributions from notable figures in data visualization.


