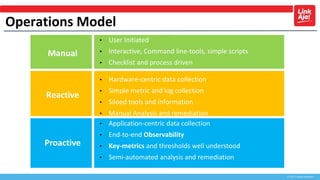
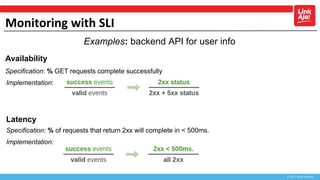
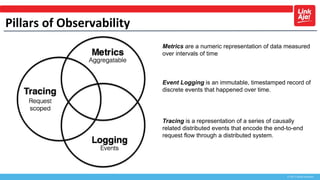
SlideShare a Scribd company logo
Operations, Monitoring and
Observability
©2021LinkAja Indonesia
Agenda
 Operations Overview
 Monitoring Overview
 Observability Overview
©2021LinkAja Indonesia
Operations Excellent
• Everything is Automated
• Reduce Costs
• No Support Calls
©2021LinkAja Indonesia
Operations Model
Manual
Reactive
Proactive
• User Initiated
• Interactive, Command line-tools, simple scripts
• Checklist and process driven
• Hardware-centric data collection
• Simple metric and log collection
• Siloed tools and information
• Manual Analysis and remediation
• Application-centric data collection
• End-to-end Observability
• Key-metrics and thresholds well understood
• Semi-automated analysis and remediation
©2021LinkAja Indonesia
User care about
• Availability : Is my system Online ? Yes/No
• Latency : Does it take a long time to access application ?
• Reliability : Can the user rely on using the application ?
©2021LinkAja Indonesia
Agenda
 Operations Overview
 Monitoring Overview
 Obervability Overvew
©2021LinkAja Indonesia
Outline
 Monitoring…...for what?
 What really want to monitor?
 How to design it ?
 What is not monitoring?
 We can do it better?
©2021LinkAja Indonesia
Monitoring… for what ??
Your monitoring system should address two question: What’s broken and
Why?
The “What’s broken” indicates the symptom
“In the event of a failure, monitoring data should immediately be able to provide visibility into impact of the
failure as well as the effect of any fix deployed” by Cindy Sridharan
The “Why” indicated a (possibly intermediate) cause
©2021LinkAja Indonesia
Examples
Symptom (What?) Cause (Why?)
I’m serving HTTP 500s DB are refusing connections
Responses are slow Web Server is queueing requests
Users can’t login Auth client is receiving HTTP 503
Blackbox Whitebox
Blackbox externally observed, what user sees.
Whitebox data exposed the system allow to act on imminent issues
©2021LinkAja Indonesia
Key Distinction
Blackbox Monitoring (what?)
 User/Business point of view
 SLI/SLO based control
 Mostly easy to know
 Detect active problem
 Reactive approach
 Tend to be the last to alert
 Usually On-Call resolution
 Preferably few metrics
Whitebox Monitoring (why?)
 Component point of view
 Threshold based control
 Mostly hard to know
 Detect imminent problem
 Proactive approach
 Tend to be the early alarm
 Usually automatic resolution
 Preferably not few metrics
©2021LinkAja Indonesia
Methodology
4 Golden Signal
1. Traffic
2. Latency
3. Errors
4. Saturation
R.E.D (Microservice Level)
• Request Rate: the number of requests, per second, you services are
serving
• (Request) Error: the number (error rate) of failed requests persecond
• (Request) Duration: distributions of the amount of time each request
takes.
U.S.E (Low Level/Infrastructure)
Every resource, check Utilization, Saturation, and Errors
• Utilization: % time that the resource was busy
• Saturation: amount of work resource has to do, often queue length
• Error: amount of work resource has to do, often queue length : the
count of error events
©2021LinkAja Indonesia
Monitoring with SLI
SLI = Service Level Indicator
Quantifies meeting user expectations:
is our service working as our users expect it to?
©2021LinkAja Indonesia
Monitoring with SLI
Examples: backend API for user info
Availability
Specification: % GET requests complete successfully
Implementation:
Latency
Specification: % of requests that return 2xx will complete in < 500ms.
Implementation:
©2021LinkAja Indonesia
Monitoring with SLI + SLO
SLO = Service Level Objective
Example:
- Measured across all the backend servers from the load balancer
- Taking the past 24 hours
Availability: 99.9% GET requests complete successfully
Latency: 95% of requests that return 2xx will complete in < 500ms.
©2021LinkAja Indonesia
Observability
 Operations Overview
 Monitoring Overview
 Obervability Overvew
©2021LinkAja Indonesia
Observability
Observability is how well you can understand a system’s and
measures all entire of the application.
Observability captures what "monitoring" doesn't (and shouldn’t),
based on evidences (not conjectures)
When you lost the power to know and predict the behaviors of the system and that's
where the observability tools come in...
©2021LinkAja Indonesia
Monitoring vs Observability
Monitoring tells you when something is wrong,
while Observability enables you to understand why.
©2021LinkAja Indonesia
Pillars of Observability
Metrics are a numeric representation of data measured
over intervals of time
Event Logging is an immutable, timestamped record of
discrete events that happened over time.
Tracing is a representation of a series of causally
related distributed events that encode the end-to-end
request flow through a distributed system.
©2021LinkAja Indonesia
Observability
Reliability and trending in use:
o What happens right now ?
o What will happen next ?
A few of the critical questions that Tracing can answer
quickly and easily:
o Which did a request pass through?
o Where are the bottlenecks?
o How much time is lost due to network lag during
communication between services?
o What occurred in each service for a given request?
1. Metrics 2. Tracing
Good practices for more effective logs:
o Logging with context (trace-id / uuid/ whatever) ?
o Standardized Logging Levels ?
o Use structured-logs for enable machine-readability
3. Logging
Terimakasih
#PakeLinkAja

More Related Content

What's hot

How to Move from Monitoring to Observability, On-Premises and in a Multi-Clou...
How to Move from Monitoring to Observability, On-Premises and in a Multi-Clou...How to Move from Monitoring to Observability, On-Premises and in a Multi-Clou...
How to Move from Monitoring to Observability, On-Premises and in a Multi-Clou...
Splunk
 
Observability & Datadog
Observability & DatadogObservability & Datadog
Observability & Datadog
JamesAnderson599331
 
Observability vs APM vs Monitoring Comparison
Observability vs APM vs  Monitoring ComparisonObservability vs APM vs  Monitoring Comparison
Observability vs APM vs Monitoring Comparison
jeetendra mandal
 
Observability
Observability Observability
Observability
Enes Altınok
 
Observability
ObservabilityObservability
Monitoring and observability
Monitoring and observabilityMonitoring and observability
Monitoring and observability
Danylenko Max
 
Observability – the good, the bad, and the ugly
Observability – the good, the bad, and the uglyObservability – the good, the bad, and the ugly
Observability – the good, the bad, and the ugly
Timetrix
 
Monitoring and observability
Monitoring and observabilityMonitoring and observability
Monitoring and observabilityTheo Schlossnagle
 
.conf Go 2022 - Observability Session
.conf Go 2022 - Observability Session.conf Go 2022 - Observability Session
.conf Go 2022 - Observability Session
Splunk
 
Observability
ObservabilityObservability
Observability
Ebru Cucen Çüçen
 
Observability
ObservabilityObservability
Observability
Diego Pacheco
 
Monitoring and observability
Monitoring and observabilityMonitoring and observability
Monitoring and observability
Theo Schlossnagle
 
Shift left Observability
Shift left ObservabilityShift left Observability
Shift left Observability
Eric D. Schabell
 
Combining logs, metrics, and traces for unified observability
Combining logs, metrics, and traces for unified observabilityCombining logs, metrics, and traces for unified observability
Combining logs, metrics, and traces for unified observability
Elasticsearch
 
Observability; a gentle introduction
Observability; a gentle introductionObservability; a gentle introduction
Observability; a gentle introduction
Bram Vogelaar
 
THE STATE OF OPENTELEMETRY, DOTAN HOROVITS, Logz.io
THE STATE OF OPENTELEMETRY, DOTAN HOROVITS, Logz.ioTHE STATE OF OPENTELEMETRY, DOTAN HOROVITS, Logz.io
THE STATE OF OPENTELEMETRY, DOTAN HOROVITS, Logz.io
DevOpsDays Tel Aviv
 
OpenTelemetry Introduction
OpenTelemetry Introduction OpenTelemetry Introduction
OpenTelemetry Introduction
DimitrisFinas1
 
Dynatrace
DynatraceDynatrace
Dynatrace
Purnima Kurella
 
Combining logs, metrics, and traces for unified observability
Combining logs, metrics, and traces for unified observabilityCombining logs, metrics, and traces for unified observability
Combining logs, metrics, and traces for unified observability
Elasticsearch
 
Demystifying observability
Demystifying observability Demystifying observability
Demystifying observability
Abigail Bangser
 

What's hot (20)

How to Move from Monitoring to Observability, On-Premises and in a Multi-Clou...
How to Move from Monitoring to Observability, On-Premises and in a Multi-Clou...How to Move from Monitoring to Observability, On-Premises and in a Multi-Clou...
How to Move from Monitoring to Observability, On-Premises and in a Multi-Clou...
 
Observability & Datadog
Observability & DatadogObservability & Datadog
Observability & Datadog
 
Observability vs APM vs Monitoring Comparison
Observability vs APM vs  Monitoring ComparisonObservability vs APM vs  Monitoring Comparison
Observability vs APM vs Monitoring Comparison
 
Observability
Observability Observability
Observability
 
Observability
ObservabilityObservability
Observability
 
Monitoring and observability
Monitoring and observabilityMonitoring and observability
Monitoring and observability
 
Observability – the good, the bad, and the ugly
Observability – the good, the bad, and the uglyObservability – the good, the bad, and the ugly
Observability – the good, the bad, and the ugly
 
Monitoring and observability
Monitoring and observabilityMonitoring and observability
Monitoring and observability
 
.conf Go 2022 - Observability Session
.conf Go 2022 - Observability Session.conf Go 2022 - Observability Session
.conf Go 2022 - Observability Session
 
Observability
ObservabilityObservability
Observability
 
Observability
ObservabilityObservability
Observability
 
Monitoring and observability
Monitoring and observabilityMonitoring and observability
Monitoring and observability
 
Shift left Observability
Shift left ObservabilityShift left Observability
Shift left Observability
 
Combining logs, metrics, and traces for unified observability
Combining logs, metrics, and traces for unified observabilityCombining logs, metrics, and traces for unified observability
Combining logs, metrics, and traces for unified observability
 
Observability; a gentle introduction
Observability; a gentle introductionObservability; a gentle introduction
Observability; a gentle introduction
 
THE STATE OF OPENTELEMETRY, DOTAN HOROVITS, Logz.io
THE STATE OF OPENTELEMETRY, DOTAN HOROVITS, Logz.ioTHE STATE OF OPENTELEMETRY, DOTAN HOROVITS, Logz.io
THE STATE OF OPENTELEMETRY, DOTAN HOROVITS, Logz.io
 
OpenTelemetry Introduction
OpenTelemetry Introduction OpenTelemetry Introduction
OpenTelemetry Introduction
 
Dynatrace
DynatraceDynatrace
Dynatrace
 
Combining logs, metrics, and traces for unified observability
Combining logs, metrics, and traces for unified observabilityCombining logs, metrics, and traces for unified observability
Combining logs, metrics, and traces for unified observability
 
Demystifying observability
Demystifying observability Demystifying observability
Demystifying observability
 

Similar to Monitoring & Observability

What is Platform Observability? An Overview
What is Platform Observability? An OverviewWhat is Platform Observability? An Overview
What is Platform Observability? An Overview
Kumar Kolaganti
 
NetIQ AppManager & NetIQ Operations Center. NCU Ltd
NetIQ AppManager & NetIQ Operations Center. NCU LtdNetIQ AppManager & NetIQ Operations Center. NCU Ltd
NetIQ AppManager & NetIQ Operations Center. NCU Ltd
NCU Ltd
 
Why Monitoring and Logging are Important in DevOps.pdf
Why Monitoring and Logging are Important in DevOps.pdfWhy Monitoring and Logging are Important in DevOps.pdf
Why Monitoring and Logging are Important in DevOps.pdf
Datacademy.ai
 
Devops Indonesia Presentation Monitoring Framework
Devops Indonesia Presentation Monitoring FrameworkDevops Indonesia Presentation Monitoring Framework
Devops Indonesia Presentation Monitoring Framework
Yusuf Hadiwinata Sutandar
 
ThousandEyes EMEA - Why 74% of IT Teams Are Not Ready for the Cloud
ThousandEyes EMEA - Why 74% of IT Teams Are Not Ready for the CloudThousandEyes EMEA - Why 74% of IT Teams Are Not Ready for the Cloud
ThousandEyes EMEA - Why 74% of IT Teams Are Not Ready for the Cloud
ThousandEyes
 
Spur Infrastructure Performance With Proactive IT Monitoring
Spur Infrastructure Performance With Proactive IT MonitoringSpur Infrastructure Performance With Proactive IT Monitoring
Spur Infrastructure Performance With Proactive IT Monitoring
CA Technologies
 
Unified Monitoring Webinar with Dustin Whittle
Unified Monitoring Webinar with Dustin WhittleUnified Monitoring Webinar with Dustin Whittle
Unified Monitoring Webinar with Dustin Whittle
AppDynamics
 
The Business Justification for APM
The Business Justification for APMThe Business Justification for APM
The Business Justification for APM
Jonah Kowall
 
DevOps Indonesia #14 - Building monitoring framework on container infrastructure
DevOps Indonesia #14 - Building monitoring framework on container infrastructureDevOps Indonesia #14 - Building monitoring framework on container infrastructure
DevOps Indonesia #14 - Building monitoring framework on container infrastructure
DevOps Indonesia
 
ADF Performance Monitor
ADF Performance MonitorADF Performance Monitor
Monitoring, automation and visualization as approaches to the principles of D...
Monitoring, automation and visualization as approaches to the principles of D...Monitoring, automation and visualization as approaches to the principles of D...
Monitoring, automation and visualization as approaches to the principles of D...
ALG Systems (АЛЖ Системс)
 
Raising the Bar on End User Monitoring
Raising the Bar on End User MonitoringRaising the Bar on End User Monitoring
Raising the Bar on End User Monitoring
ThousandEyes
 
How much does it cost to be Secure?
How much does it cost to be Secure?How much does it cost to be Secure?
How much does it cost to be Secure?mbmobile
 
How to Ensure High-Performing Microsoft .NET Applications
How to Ensure High-Performing Microsoft .NET ApplicationsHow to Ensure High-Performing Microsoft .NET Applications
How to Ensure High-Performing Microsoft .NET Applications
eG Innovations
 
Continuous Performance Testing and Monitoring in Agile Development
Continuous Performance Testing and Monitoring in Agile DevelopmentContinuous Performance Testing and Monitoring in Agile Development
Continuous Performance Testing and Monitoring in Agile Development
Neotys
 
DO5T17S_T5 Thur 430 GilesE_BR_20151114_012422
DO5T17S_T5 Thur 430 GilesE_BR_20151114_012422DO5T17S_T5 Thur 430 GilesE_BR_20151114_012422
DO5T17S_T5 Thur 430 GilesE_BR_20151114_012422Erik Giles
 
Encontrando la Aguja en el Rendimiento de Aplicaciones
Encontrando la Aguja en el Rendimiento de AplicacionesEncontrando la Aguja en el Rendimiento de Aplicaciones
Encontrando la Aguja en el Rendimiento de Aplicaciones
Software Guru
 
10 Ways to Better Application-Centric Service Management
10 Ways to Better Application-Centric Service Management10 Ways to Better Application-Centric Service Management
10 Ways to Better Application-Centric Service Management
Linh Nguyen
 
DockerCon SF 2019 - TDD is Dead
DockerCon SF 2019 - TDD is DeadDockerCon SF 2019 - TDD is Dead
DockerCon SF 2019 - TDD is Dead
Kevin Crawley
 
Building Active Directory Monitoring with Telegraf, InfluxDB, and Grafana
Building Active Directory Monitoring with Telegraf, InfluxDB, and GrafanaBuilding Active Directory Monitoring with Telegraf, InfluxDB, and Grafana
Building Active Directory Monitoring with Telegraf, InfluxDB, and Grafana
Boni Yeamin
 

Similar to Monitoring & Observability (20)

What is Platform Observability? An Overview
What is Platform Observability? An OverviewWhat is Platform Observability? An Overview
What is Platform Observability? An Overview
 
NetIQ AppManager & NetIQ Operations Center. NCU Ltd
NetIQ AppManager & NetIQ Operations Center. NCU LtdNetIQ AppManager & NetIQ Operations Center. NCU Ltd
NetIQ AppManager & NetIQ Operations Center. NCU Ltd
 
Why Monitoring and Logging are Important in DevOps.pdf
Why Monitoring and Logging are Important in DevOps.pdfWhy Monitoring and Logging are Important in DevOps.pdf
Why Monitoring and Logging are Important in DevOps.pdf
 
Devops Indonesia Presentation Monitoring Framework
Devops Indonesia Presentation Monitoring FrameworkDevops Indonesia Presentation Monitoring Framework
Devops Indonesia Presentation Monitoring Framework
 
ThousandEyes EMEA - Why 74% of IT Teams Are Not Ready for the Cloud
ThousandEyes EMEA - Why 74% of IT Teams Are Not Ready for the CloudThousandEyes EMEA - Why 74% of IT Teams Are Not Ready for the Cloud
ThousandEyes EMEA - Why 74% of IT Teams Are Not Ready for the Cloud
 
Spur Infrastructure Performance With Proactive IT Monitoring
Spur Infrastructure Performance With Proactive IT MonitoringSpur Infrastructure Performance With Proactive IT Monitoring
Spur Infrastructure Performance With Proactive IT Monitoring
 
Unified Monitoring Webinar with Dustin Whittle
Unified Monitoring Webinar with Dustin WhittleUnified Monitoring Webinar with Dustin Whittle
Unified Monitoring Webinar with Dustin Whittle
 
The Business Justification for APM
The Business Justification for APMThe Business Justification for APM
The Business Justification for APM
 
DevOps Indonesia #14 - Building monitoring framework on container infrastructure
DevOps Indonesia #14 - Building monitoring framework on container infrastructureDevOps Indonesia #14 - Building monitoring framework on container infrastructure
DevOps Indonesia #14 - Building monitoring framework on container infrastructure
 
ADF Performance Monitor
ADF Performance MonitorADF Performance Monitor
ADF Performance Monitor
 
Monitoring, automation and visualization as approaches to the principles of D...
Monitoring, automation and visualization as approaches to the principles of D...Monitoring, automation and visualization as approaches to the principles of D...
Monitoring, automation and visualization as approaches to the principles of D...
 
Raising the Bar on End User Monitoring
Raising the Bar on End User MonitoringRaising the Bar on End User Monitoring
Raising the Bar on End User Monitoring
 
How much does it cost to be Secure?
How much does it cost to be Secure?How much does it cost to be Secure?
How much does it cost to be Secure?
 
How to Ensure High-Performing Microsoft .NET Applications
How to Ensure High-Performing Microsoft .NET ApplicationsHow to Ensure High-Performing Microsoft .NET Applications
How to Ensure High-Performing Microsoft .NET Applications
 
Continuous Performance Testing and Monitoring in Agile Development
Continuous Performance Testing and Monitoring in Agile DevelopmentContinuous Performance Testing and Monitoring in Agile Development
Continuous Performance Testing and Monitoring in Agile Development
 
DO5T17S_T5 Thur 430 GilesE_BR_20151114_012422
DO5T17S_T5 Thur 430 GilesE_BR_20151114_012422DO5T17S_T5 Thur 430 GilesE_BR_20151114_012422
DO5T17S_T5 Thur 430 GilesE_BR_20151114_012422
 
Encontrando la Aguja en el Rendimiento de Aplicaciones
Encontrando la Aguja en el Rendimiento de AplicacionesEncontrando la Aguja en el Rendimiento de Aplicaciones
Encontrando la Aguja en el Rendimiento de Aplicaciones
 
10 Ways to Better Application-Centric Service Management
10 Ways to Better Application-Centric Service Management10 Ways to Better Application-Centric Service Management
10 Ways to Better Application-Centric Service Management
 
DockerCon SF 2019 - TDD is Dead
DockerCon SF 2019 - TDD is DeadDockerCon SF 2019 - TDD is Dead
DockerCon SF 2019 - TDD is Dead
 
Building Active Directory Monitoring with Telegraf, InfluxDB, and Grafana
Building Active Directory Monitoring with Telegraf, InfluxDB, and GrafanaBuilding Active Directory Monitoring with Telegraf, InfluxDB, and Grafana
Building Active Directory Monitoring with Telegraf, InfluxDB, and Grafana
 

Recently uploaded

To Graph or Not to Graph Knowledge Graph Architectures and LLMs
To Graph or Not to Graph Knowledge Graph Architectures and LLMsTo Graph or Not to Graph Knowledge Graph Architectures and LLMs
To Graph or Not to Graph Knowledge Graph Architectures and LLMs
Paul Groth
 
Search and Society: Reimagining Information Access for Radical Futures
Search and Society: Reimagining Information Access for Radical FuturesSearch and Society: Reimagining Information Access for Radical Futures
Search and Society: Reimagining Information Access for Radical Futures
Bhaskar Mitra
 
Software Delivery At the Speed of AI: Inflectra Invests In AI-Powered Quality
Software Delivery At the Speed of AI: Inflectra Invests In AI-Powered QualitySoftware Delivery At the Speed of AI: Inflectra Invests In AI-Powered Quality
Software Delivery At the Speed of AI: Inflectra Invests In AI-Powered Quality
Inflectra
 
Neuro-symbolic is not enough, we need neuro-*semantic*
Neuro-symbolic is not enough, we need neuro-*semantic*Neuro-symbolic is not enough, we need neuro-*semantic*
Neuro-symbolic is not enough, we need neuro-*semantic*
Frank van Harmelen
 
GraphRAG is All You need? LLM & Knowledge Graph
GraphRAG is All You need? LLM & Knowledge GraphGraphRAG is All You need? LLM & Knowledge Graph
GraphRAG is All You need? LLM & Knowledge Graph
Guy Korland
 
Mission to Decommission: Importance of Decommissioning Products to Increase E...
Mission to Decommission: Importance of Decommissioning Products to Increase E...Mission to Decommission: Importance of Decommissioning Products to Increase E...
Mission to Decommission: Importance of Decommissioning Products to Increase E...
Product School
 
IOS-PENTESTING-BEGINNERS-PRACTICAL-GUIDE-.pptx
IOS-PENTESTING-BEGINNERS-PRACTICAL-GUIDE-.pptxIOS-PENTESTING-BEGINNERS-PRACTICAL-GUIDE-.pptx
IOS-PENTESTING-BEGINNERS-PRACTICAL-GUIDE-.pptx
Abida Shariff
 
Transcript: Selling digital books in 2024: Insights from industry leaders - T...
Transcript: Selling digital books in 2024: Insights from industry leaders - T...Transcript: Selling digital books in 2024: Insights from industry leaders - T...
Transcript: Selling digital books in 2024: Insights from industry leaders - T...
BookNet Canada
 
The Future of Platform Engineering
The Future of Platform EngineeringThe Future of Platform Engineering
The Future of Platform Engineering
Jemma Hussein Allen
 
Leading Change strategies and insights for effective change management pdf 1.pdf
Leading Change strategies and insights for effective change management pdf 1.pdfLeading Change strategies and insights for effective change management pdf 1.pdf
Leading Change strategies and insights for effective change management pdf 1.pdf
OnBoard
 
DevOps and Testing slides at DASA Connect
DevOps and Testing slides at DASA ConnectDevOps and Testing slides at DASA Connect
DevOps and Testing slides at DASA Connect
Kari Kakkonen
 
Key Trends Shaping the Future of Infrastructure.pdf
Key Trends Shaping the Future of Infrastructure.pdfKey Trends Shaping the Future of Infrastructure.pdf
Key Trends Shaping the Future of Infrastructure.pdf
Cheryl Hung
 
UiPath Test Automation using UiPath Test Suite series, part 4
UiPath Test Automation using UiPath Test Suite series, part 4UiPath Test Automation using UiPath Test Suite series, part 4
UiPath Test Automation using UiPath Test Suite series, part 4
DianaGray10
 
Accelerate your Kubernetes clusters with Varnish Caching
Accelerate your Kubernetes clusters with Varnish CachingAccelerate your Kubernetes clusters with Varnish Caching
Accelerate your Kubernetes clusters with Varnish Caching
Thijs Feryn
 
FIDO Alliance Osaka Seminar: Passkeys at Amazon.pdf
FIDO Alliance Osaka Seminar: Passkeys at Amazon.pdfFIDO Alliance Osaka Seminar: Passkeys at Amazon.pdf
FIDO Alliance Osaka Seminar: Passkeys at Amazon.pdf
FIDO Alliance
 
FIDO Alliance Osaka Seminar: Passkeys and the Road Ahead.pdf
FIDO Alliance Osaka Seminar: Passkeys and the Road Ahead.pdfFIDO Alliance Osaka Seminar: Passkeys and the Road Ahead.pdf
FIDO Alliance Osaka Seminar: Passkeys and the Road Ahead.pdf
FIDO Alliance
 
FIDO Alliance Osaka Seminar: The WebAuthn API and Discoverable Credentials.pdf
FIDO Alliance Osaka Seminar: The WebAuthn API and Discoverable Credentials.pdfFIDO Alliance Osaka Seminar: The WebAuthn API and Discoverable Credentials.pdf
FIDO Alliance Osaka Seminar: The WebAuthn API and Discoverable Credentials.pdf
FIDO Alliance
 
Bits & Pixels using AI for Good.........
Bits & Pixels using AI for Good.........Bits & Pixels using AI for Good.........
Bits & Pixels using AI for Good.........
Alison B. Lowndes
 
GenAISummit 2024 May 28 Sri Ambati Keynote: AGI Belongs to The Community in O...
GenAISummit 2024 May 28 Sri Ambati Keynote: AGI Belongs to The Community in O...GenAISummit 2024 May 28 Sri Ambati Keynote: AGI Belongs to The Community in O...
GenAISummit 2024 May 28 Sri Ambati Keynote: AGI Belongs to The Community in O...
Sri Ambati
 
Slack (or Teams) Automation for Bonterra Impact Management (fka Social Soluti...
Slack (or Teams) Automation for Bonterra Impact Management (fka Social Soluti...Slack (or Teams) Automation for Bonterra Impact Management (fka Social Soluti...
Slack (or Teams) Automation for Bonterra Impact Management (fka Social Soluti...
Jeffrey Haguewood
 

Recently uploaded (20)

To Graph or Not to Graph Knowledge Graph Architectures and LLMs
To Graph or Not to Graph Knowledge Graph Architectures and LLMsTo Graph or Not to Graph Knowledge Graph Architectures and LLMs
To Graph or Not to Graph Knowledge Graph Architectures and LLMs
 
Search and Society: Reimagining Information Access for Radical Futures
Search and Society: Reimagining Information Access for Radical FuturesSearch and Society: Reimagining Information Access for Radical Futures
Search and Society: Reimagining Information Access for Radical Futures
 
Software Delivery At the Speed of AI: Inflectra Invests In AI-Powered Quality
Software Delivery At the Speed of AI: Inflectra Invests In AI-Powered QualitySoftware Delivery At the Speed of AI: Inflectra Invests In AI-Powered Quality
Software Delivery At the Speed of AI: Inflectra Invests In AI-Powered Quality
 
Neuro-symbolic is not enough, we need neuro-*semantic*
Neuro-symbolic is not enough, we need neuro-*semantic*Neuro-symbolic is not enough, we need neuro-*semantic*
Neuro-symbolic is not enough, we need neuro-*semantic*
 
GraphRAG is All You need? LLM & Knowledge Graph
GraphRAG is All You need? LLM & Knowledge GraphGraphRAG is All You need? LLM & Knowledge Graph
GraphRAG is All You need? LLM & Knowledge Graph
 
Mission to Decommission: Importance of Decommissioning Products to Increase E...
Mission to Decommission: Importance of Decommissioning Products to Increase E...Mission to Decommission: Importance of Decommissioning Products to Increase E...
Mission to Decommission: Importance of Decommissioning Products to Increase E...
 
IOS-PENTESTING-BEGINNERS-PRACTICAL-GUIDE-.pptx
IOS-PENTESTING-BEGINNERS-PRACTICAL-GUIDE-.pptxIOS-PENTESTING-BEGINNERS-PRACTICAL-GUIDE-.pptx
IOS-PENTESTING-BEGINNERS-PRACTICAL-GUIDE-.pptx
 
Transcript: Selling digital books in 2024: Insights from industry leaders - T...
Transcript: Selling digital books in 2024: Insights from industry leaders - T...Transcript: Selling digital books in 2024: Insights from industry leaders - T...
Transcript: Selling digital books in 2024: Insights from industry leaders - T...
 
The Future of Platform Engineering
The Future of Platform EngineeringThe Future of Platform Engineering
The Future of Platform Engineering
 
Leading Change strategies and insights for effective change management pdf 1.pdf
Leading Change strategies and insights for effective change management pdf 1.pdfLeading Change strategies and insights for effective change management pdf 1.pdf
Leading Change strategies and insights for effective change management pdf 1.pdf
 
DevOps and Testing slides at DASA Connect
DevOps and Testing slides at DASA ConnectDevOps and Testing slides at DASA Connect
DevOps and Testing slides at DASA Connect
 
Key Trends Shaping the Future of Infrastructure.pdf
Key Trends Shaping the Future of Infrastructure.pdfKey Trends Shaping the Future of Infrastructure.pdf
Key Trends Shaping the Future of Infrastructure.pdf
 
UiPath Test Automation using UiPath Test Suite series, part 4
UiPath Test Automation using UiPath Test Suite series, part 4UiPath Test Automation using UiPath Test Suite series, part 4
UiPath Test Automation using UiPath Test Suite series, part 4
 
Accelerate your Kubernetes clusters with Varnish Caching
Accelerate your Kubernetes clusters with Varnish CachingAccelerate your Kubernetes clusters with Varnish Caching
Accelerate your Kubernetes clusters with Varnish Caching
 
FIDO Alliance Osaka Seminar: Passkeys at Amazon.pdf
FIDO Alliance Osaka Seminar: Passkeys at Amazon.pdfFIDO Alliance Osaka Seminar: Passkeys at Amazon.pdf
FIDO Alliance Osaka Seminar: Passkeys at Amazon.pdf
 
FIDO Alliance Osaka Seminar: Passkeys and the Road Ahead.pdf
FIDO Alliance Osaka Seminar: Passkeys and the Road Ahead.pdfFIDO Alliance Osaka Seminar: Passkeys and the Road Ahead.pdf
FIDO Alliance Osaka Seminar: Passkeys and the Road Ahead.pdf
 
FIDO Alliance Osaka Seminar: The WebAuthn API and Discoverable Credentials.pdf
FIDO Alliance Osaka Seminar: The WebAuthn API and Discoverable Credentials.pdfFIDO Alliance Osaka Seminar: The WebAuthn API and Discoverable Credentials.pdf
FIDO Alliance Osaka Seminar: The WebAuthn API and Discoverable Credentials.pdf
 
Bits & Pixels using AI for Good.........
Bits & Pixels using AI for Good.........Bits & Pixels using AI for Good.........
Bits & Pixels using AI for Good.........
 
GenAISummit 2024 May 28 Sri Ambati Keynote: AGI Belongs to The Community in O...
GenAISummit 2024 May 28 Sri Ambati Keynote: AGI Belongs to The Community in O...GenAISummit 2024 May 28 Sri Ambati Keynote: AGI Belongs to The Community in O...
GenAISummit 2024 May 28 Sri Ambati Keynote: AGI Belongs to The Community in O...
 
Slack (or Teams) Automation for Bonterra Impact Management (fka Social Soluti...
Slack (or Teams) Automation for Bonterra Impact Management (fka Social Soluti...Slack (or Teams) Automation for Bonterra Impact Management (fka Social Soluti...
Slack (or Teams) Automation for Bonterra Impact Management (fka Social Soluti...
 

Monitoring & Observability

  • 2. ©2021LinkAja Indonesia Agenda  Operations Overview  Monitoring Overview  Observability Overview
  • 3. ©2021LinkAja Indonesia Operations Excellent • Everything is Automated • Reduce Costs • No Support Calls
  • 4. ©2021LinkAja Indonesia Operations Model Manual Reactive Proactive • User Initiated • Interactive, Command line-tools, simple scripts • Checklist and process driven • Hardware-centric data collection • Simple metric and log collection • Siloed tools and information • Manual Analysis and remediation • Application-centric data collection • End-to-end Observability • Key-metrics and thresholds well understood • Semi-automated analysis and remediation
  • 5. ©2021LinkAja Indonesia User care about • Availability : Is my system Online ? Yes/No • Latency : Does it take a long time to access application ? • Reliability : Can the user rely on using the application ?
  • 6. ©2021LinkAja Indonesia Agenda  Operations Overview  Monitoring Overview  Obervability Overvew
  • 7. ©2021LinkAja Indonesia Outline  Monitoring…...for what?  What really want to monitor?  How to design it ?  What is not monitoring?  We can do it better?
  • 8. ©2021LinkAja Indonesia Monitoring… for what ?? Your monitoring system should address two question: What’s broken and Why? The “What’s broken” indicates the symptom “In the event of a failure, monitoring data should immediately be able to provide visibility into impact of the failure as well as the effect of any fix deployed” by Cindy Sridharan The “Why” indicated a (possibly intermediate) cause
  • 9. ©2021LinkAja Indonesia Examples Symptom (What?) Cause (Why?) I’m serving HTTP 500s DB are refusing connections Responses are slow Web Server is queueing requests Users can’t login Auth client is receiving HTTP 503 Blackbox Whitebox Blackbox externally observed, what user sees. Whitebox data exposed the system allow to act on imminent issues
  • 10. ©2021LinkAja Indonesia Key Distinction Blackbox Monitoring (what?)  User/Business point of view  SLI/SLO based control  Mostly easy to know  Detect active problem  Reactive approach  Tend to be the last to alert  Usually On-Call resolution  Preferably few metrics Whitebox Monitoring (why?)  Component point of view  Threshold based control  Mostly hard to know  Detect imminent problem  Proactive approach  Tend to be the early alarm  Usually automatic resolution  Preferably not few metrics
  • 11. ©2021LinkAja Indonesia Methodology 4 Golden Signal 1. Traffic 2. Latency 3. Errors 4. Saturation R.E.D (Microservice Level) • Request Rate: the number of requests, per second, you services are serving • (Request) Error: the number (error rate) of failed requests persecond • (Request) Duration: distributions of the amount of time each request takes. U.S.E (Low Level/Infrastructure) Every resource, check Utilization, Saturation, and Errors • Utilization: % time that the resource was busy • Saturation: amount of work resource has to do, often queue length • Error: amount of work resource has to do, often queue length : the count of error events
  • 12. ©2021LinkAja Indonesia Monitoring with SLI SLI = Service Level Indicator Quantifies meeting user expectations: is our service working as our users expect it to?
  • 13. ©2021LinkAja Indonesia Monitoring with SLI Examples: backend API for user info Availability Specification: % GET requests complete successfully Implementation: Latency Specification: % of requests that return 2xx will complete in < 500ms. Implementation:
  • 14. ©2021LinkAja Indonesia Monitoring with SLI + SLO SLO = Service Level Objective Example: - Measured across all the backend servers from the load balancer - Taking the past 24 hours Availability: 99.9% GET requests complete successfully Latency: 95% of requests that return 2xx will complete in < 500ms.
  • 15. ©2021LinkAja Indonesia Observability  Operations Overview  Monitoring Overview  Obervability Overvew
  • 16. ©2021LinkAja Indonesia Observability Observability is how well you can understand a system’s and measures all entire of the application. Observability captures what "monitoring" doesn't (and shouldn’t), based on evidences (not conjectures) When you lost the power to know and predict the behaviors of the system and that's where the observability tools come in...
  • 17. ©2021LinkAja Indonesia Monitoring vs Observability Monitoring tells you when something is wrong, while Observability enables you to understand why.
  • 18. ©2021LinkAja Indonesia Pillars of Observability Metrics are a numeric representation of data measured over intervals of time Event Logging is an immutable, timestamped record of discrete events that happened over time. Tracing is a representation of a series of causally related distributed events that encode the end-to-end request flow through a distributed system.
  • 19. ©2021LinkAja Indonesia Observability Reliability and trending in use: o What happens right now ? o What will happen next ? A few of the critical questions that Tracing can answer quickly and easily: o Which did a request pass through? o Where are the bottlenecks? o How much time is lost due to network lag during communication between services? o What occurred in each service for a given request? 1. Metrics 2. Tracing Good practices for more effective logs: o Logging with context (trace-id / uuid/ whatever) ? o Standardized Logging Levels ? o Use structured-logs for enable machine-readability 3. Logging