The document discusses the importance of statistics in psychology and education, highlighting its role in data collection, organization, and inference. It outlines basic statistical concepts such as variables, scales of measurement, and statistical methods, including descriptive and inferential statistics. Additionally, it provides guidelines for constructing statistical tables and frequency distributions.

![NEED AND IMPORTANCE OF STATISTICS IN
EDUCATION AND PSYCHOLOGY
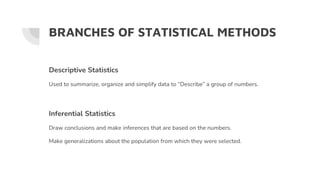
● Collection of evidences or facts
● Classification, organization and summarization of
numerical facts
● Drawing general conclusions and inferences [or] Making
predictions](https://image.slidesharecdn.com/introductiontostatistics-220622134948-19869b86/85/Introduction-to-Statistics-pptx-3-320.jpg)


![General Rules in Constructing Statistical table
● Title - Simple, concise and unambiguous [Appear on top of the table]
● Rows and columns - arranged in logical order
● Heading of each column should be brief. Similar headings grouped under common
topic / sub-headings.
● Subtotals for each classification and general total for all combined classes
● Units - mentioned, preferably in headings of rows/columns
● Footnotes - essential explanation - bottom of table
● Source/sources [primary/secondary] - end of the table
● Long columns - space after every five or ten rows
● Numbers - more than three significant figures - space btw every 3 numbers.
● Simple](https://image.slidesharecdn.com/introductiontostatistics-220622134948-19869b86/85/Introduction-to-Statistics-pptx-11-320.jpg)


![Principlles of statistics [amar mamusta amir]](https://cdn.slidesharecdn.com/ss_thumbnails/principllesofstatistics-190317152518-thumbnail.jpg?width=640&height=640&fit=bounds)