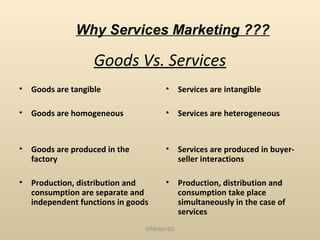
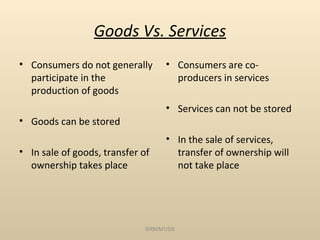
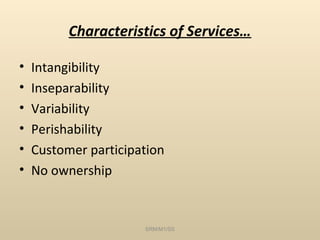
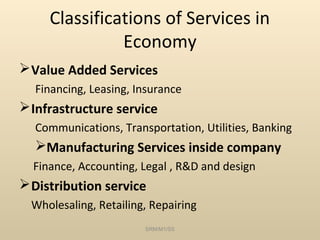
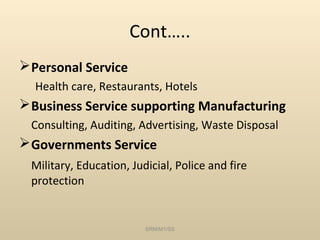
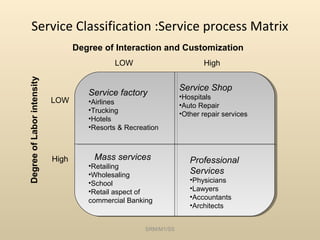
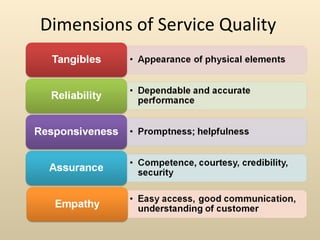
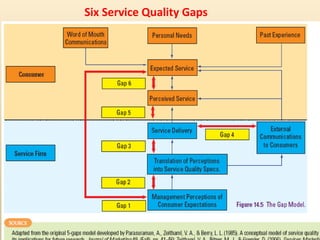
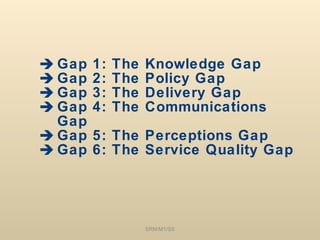
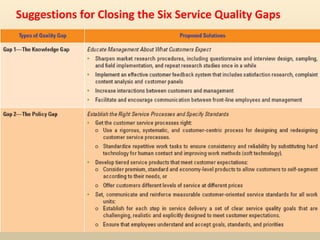
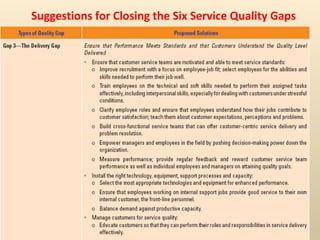
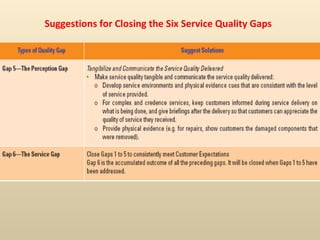
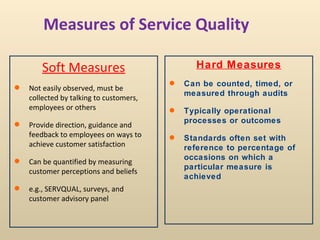
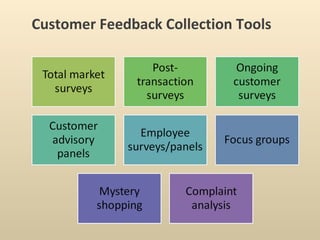
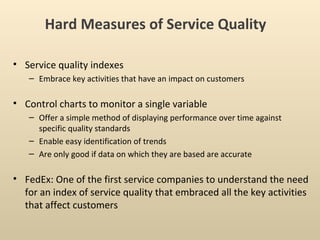
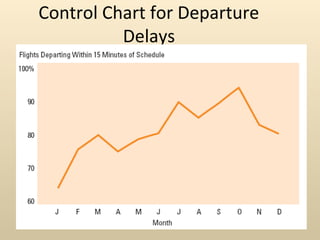
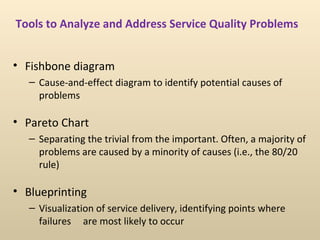
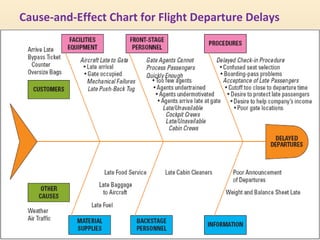
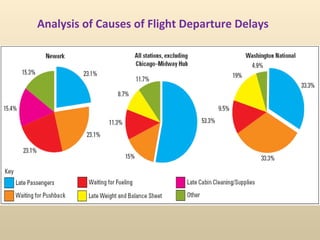
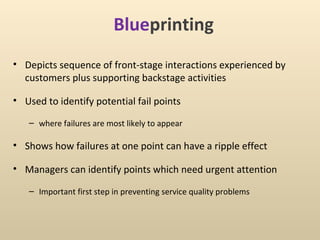
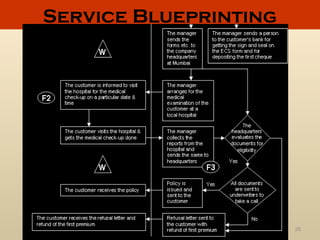
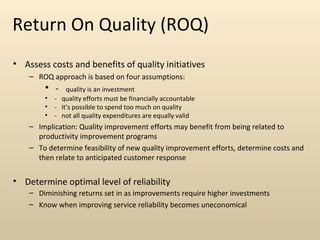
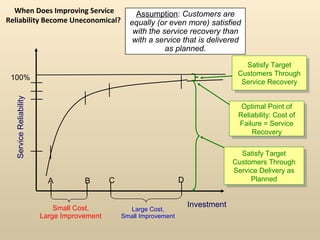
Chapter-8
Service Quality Management
• What are services?
     The word service originally associated with the work
 performed by servants for their masters.

 “ the action of serving, helping or benefiting; conduct tending
 to the welfare or advantage of another”

 Services are acts, deeds, performance or efforts.
 The aim of service is to provide solution to the customers
 problem.

                           SRM/M1/SS
Services is an activity or series of activities take place by
interaction between customer and service employees

It’s an economic activity which is consumed at a time it is
produced and provide added value in forms of Convenience,
amusement, timeliness , comfort or health


                            SRM/M1/SS
Services Defined…

      “Activities, Benefits or Satisfactions
          which are offered for sale
                      or
provided in connection with the sale of goods”

                                American Marketing Association


                    SRM/M1/SS
Services Defined…

  “Separately identifiable, intangible activities which
              provide want satisfaction
when marketed to consumers and/or industrial users
 and which are not necessarily tied to the sale of a
             product or another service”

                                          William J. Stanton


                        SRM/M1/SS
Services Defined…

  “Any activity or benefit that one party can offer to
  another that is essentially intangible and does not
         result in the ownership of anything.
Its production may or may not be tied to a physical
                        product”

                                     Philip Kotler and Bloom


                       SRM/M1/SS
Why Services Marketing ???

                    Goods Vs. Services
•   Goods are tangible                 •     Services are intangible

•   Goods are homogeneous              •     Services are heterogeneous


•   Goods are produced in the          •     Services are produced in buyer-
    factory                                  seller interactions

•   Production, distribution and       •     Production, distribution and
    consumption are separate and             consumption take place
    independent functions in goods           simultaneously in the case of
                                             services
                                 SRM/M1/SS
Goods Vs. Services
• Consumers do not generally        • Consumers are co-
  participate in the                  producers in services
  production of goods
                                    • Services can not be stored
• Goods can be stored
                                    • In the sale of services,
• In sale of goods, transfer of       transfer of ownership will
  ownership takes place               not take place


                              SRM/M1/SS
Characteristics of Services…

•   Intangibility
•   Inseparability
•   Variability
•   Perishability
•   Customer participation
•   No ownership


                      SRM/M1/SS
Perishability…
• Challenges :                 •     Strategic Options :
- Storage of service is not    -     Demand management
  possible                     -     Capacity management
- Sales volume                 -     Tactical approaches
  continuously in relation     -     Continuous study on
  to the capacity                    demand patterns and
- Time pressure in sales             competitive parameters


                         SRM/M1/SS
Customer Participation…
• Challenges :                   • Strategic Options:
- Customers are not              - Effective external marketing
  controllable                   - Customer education and
- Production quality also          training
  depends upon customer’s        - Effective interactive
  knowledge and ability to         marketing
  participate                    - Management of
- Customers are evaluating at      movements of truth
  every stage of service         - Effective internal marketing
  production


                           SRM/M1/SS
No ownership…
• Challenges:                  • Strategic Options:
- Nothing remains after        - Making communication
  consumption                    tangible
- Very less time to the        - Customer relationship
  consumer to evaluate the       marketing
  product                      - Managing high level of
- High consumer dissonance       company image


                         SRM/M1/SS
Classifications of Services in
               Economy
 Value Added Services
  Financing, Leasing, Insurance
 Infrastructure service
  Communications, Transportation, Utilities, Banking
  Manufacturing Services inside company
  Finance, Accounting, Legal , R&D and design
 Distribution service
  Wholesaling, Retailing, Repairing
                        SRM/M1/SS
Cont…..
 Personal Service
  Health care, Restaurants, Hotels
 Business Service supporting Manufacturing
 Consulting, Auditing, Advertising, Waste Disposal
 Governments Service
 Military, Education, Judicial, Police and fire
 protection


                         SRM/M1/SS
Service Classification :Service process Matrix
                                   Degree of Interaction and Customization
                                             LOW                          High
Degree of Labor intensity


                                                                   Service Shop
                                      Service factory              •Hospitals
                            LOW       •Airlines                    •Auto Repair
                                      •Trucking
                                                                   •Other repair services
                                      •Hotels
                                      •Resorts & Recreation


                            High       Mass services                  Professional
                                      •Retailing
                                      •Wholesaling                    Services
                                      •School                         •Physicians
                                      •Retail aspect of               •Lawyers
                                                                      •Accountants
                                      commercial Banking
                                                                      •Architects


                                                       SRM/M1/SS
Dimensions of Service Quality
The Gaps Model
Six Service Quality Gaps
 Gap   1:   The   Knowledge Gap
 Gap   2:   The   Policy Gap
 Gap   3:   The   Delivery Gap
 Gap   4:   The   Communications
  Gap
 Gap   5: The Perceptions Gap
 Gap   6: The Service Quality Gap


                   SRM/M1/SS
Suggestions for Closing the Six Service Quality Gaps
Measuring and Improving
    Service Quality
Measures of Service Quality

        Soft Measures                          Hard Measures
                                            Can be counted, timed, or
   Not easily observed, must be
                                             measured through audits
    collected by talking to customers,
    employees or others                     Typically operational
                                             processes or outcomes
   Provide direction, guidance and
    feedback to employees on ways to        Standards often set with
    achieve customer satisfaction            reference to percentage of
                                             occasions on which a
   Can be quantified by measuring
                                             particular measure is
    customer perceptions and beliefs
                                             achieved
   e.g., SERVQUAL, surveys, and
    customer advisory panel
Customer Feedback Collection Tools
Hard Measures of
 Service Quality
Hard Measures of Service Quality

• Service quality indexes
   – Embrace key activities that have an impact on customers

• Control charts to monitor a single variable
   – Offer a simple method of displaying performance over time against
     specific quality standards
   – Enable easy identification of trends
   – Are only good if data on which they are based are accurate

• FedEx: One of the first service companies to understand the need
  for an index of service quality that embraced all the key activities
  that affect customers
Control Chart for Departure
          Delays
Tools to Analyze and
Address Service Quality
       Problems
Tools to Analyze and Address Service Quality Problems


• Fishbone diagram
   – Cause-and-effect diagram to identify potential causes of
     problems

• Pareto Chart
   – Separating the trivial from the important. Often, a majority of
     problems are caused by a minority of causes (i.e., the 80/20
     rule)

• Blueprinting
   – Visualization of service delivery, identifying points where
     failures are most likely to occur
Cause-and-Effect Chart for Flight Departure Delays
Analysis of Causes of Flight Departure Delays
Blueprinting
• Depicts sequence of front-stage interactions experienced by
  customers plus supporting backstage activities

• Used to identify potential fail points

   – where failures are most likely to appear

• Shows how failures at one point can have a ripple effect

• Managers can identify points which need urgent attention

   – Important first step in preventing service quality problems
Service Blueprinting


      © Oxford University Press 2008.
                                        35
            All rights reserved.
Return On Quality (ROQ)
• Assess costs and benefits of quality initiatives
    – ROQ approach is based on four assumptions:
        • -     quality is an investment
        •   - quality efforts must be financially accountable
        •   - it’s possible to spend too much on quality
        •   - not all quality expenditures are equally valid
    – Implication: Quality improvement efforts may benefit from being related to
      productivity improvement programs
    – To determine feasibility of new quality improvement efforts, determine costs and
      then relate to anticipated customer response


• Determine optimal level of reliability
    – Diminishing returns set in as improvements require higher investments
    – Know when improving service reliability becomes uneconomical
When Does Improving Service                       Assumption: Customers are
Reliability Become Uneconomical?                  equally (or even more) satisfied
                                                   with the service recovery than
                                                   with a service that is delivered
                                                             as planned.

                                                                                         Satisfy Target
                                                                                          Satisfy Target
                                                                                      Customers Through
                                                                                       Customers Through
 100%
                                                                                       Service Recovery
                                                                                        Service Recovery
  Service Reliability


                                                                                       Optimal Point of
                                                                                        Optimal Point of
                                                                                      Reliability: Cost of
                                                                                       Reliability: Cost of
                                                                                      Failure = Service
                                                                                       Failure = Service
                                                                                          Recovery
                                                                                           Recovery

                                                                                       Satisfy Target
                                                                                        Satisfy Target
                                                                                     Customers Through
                                                                                      Customers Through
                                                                                     Service Delivery as
                                                                                      Service Delivery as
                          A         B       C                       D                     Planned
                                                                                           Planned


                            Small Cost,                                 Investment
                                                  Large Cost,
                        Large Improvement       Small Improvement
Productivity in a Service
       Context
• Productivity: amount of output produced relative to amount of inputs
   – Improvement in productivity means an improvement in the ratio of outputs to
     inputs.


• Intangible nature of service makes it hard to measure productivity of
  service firms, especially for information-based services
   – Both input and output are hard to define
   – Relatively simpler in possession-processing services, as compared to information-
     and people-processing services
Service Efficiency, Productivity, and Effectiveness

• Efficiency: involves comparison to a standard, usually time-based (e.g.,
  how long employee takes to perform specific task)
    – Focus on inputs rather than outcomes and may ignore variations in service
      quality/value

• Productivity: involves financial valuation of outputs to inputs
    – Consistent delivery of outcomes desired by customers should command higher
      prices

• Effectiveness: degree to which firm meets goals
    – Cannot divorce productivity from quality and customer satisfaction
Stopwatch Time Study
• Standard time duration means the time taken by an
  average worker to perform a task at a sustainable
  rate under the given facility arrangements.

• A performance rating (P) is multiplied with the
  observed time of the job to arrive at the normal time
  (N) of the job.

• Standard time (S) is normal time plus allowances.
  Allowances have to be made for time consumed in
  adjusting or repairing the machines, workers drinking
  water, or taking rest breaks.


                                                     40

FQM-Ch 8-service quality management

  • 1.
  • 2.
    • What areservices? The word service originally associated with the work performed by servants for their masters. “ the action of serving, helping or benefiting; conduct tending to the welfare or advantage of another” Services are acts, deeds, performance or efforts. The aim of service is to provide solution to the customers problem. SRM/M1/SS
  • 3.
    Services is anactivity or series of activities take place by interaction between customer and service employees It’s an economic activity which is consumed at a time it is produced and provide added value in forms of Convenience, amusement, timeliness , comfort or health SRM/M1/SS
  • 4.
    Services Defined… “Activities, Benefits or Satisfactions which are offered for sale or provided in connection with the sale of goods” American Marketing Association SRM/M1/SS
  • 5.
    Services Defined… “Separately identifiable, intangible activities which provide want satisfaction when marketed to consumers and/or industrial users and which are not necessarily tied to the sale of a product or another service” William J. Stanton SRM/M1/SS
  • 6.
    Services Defined… “Any activity or benefit that one party can offer to another that is essentially intangible and does not result in the ownership of anything. Its production may or may not be tied to a physical product” Philip Kotler and Bloom SRM/M1/SS
  • 7.
    Why Services Marketing??? Goods Vs. Services • Goods are tangible • Services are intangible • Goods are homogeneous • Services are heterogeneous • Goods are produced in the • Services are produced in buyer- factory seller interactions • Production, distribution and • Production, distribution and consumption are separate and consumption take place independent functions in goods simultaneously in the case of services SRM/M1/SS
  • 8.
    Goods Vs. Services •Consumers do not generally • Consumers are co- participate in the producers in services production of goods • Services can not be stored • Goods can be stored • In the sale of services, • In sale of goods, transfer of transfer of ownership will ownership takes place not take place SRM/M1/SS
  • 9.
    Characteristics of Services… • Intangibility • Inseparability • Variability • Perishability • Customer participation • No ownership SRM/M1/SS
  • 10.
    Perishability… • Challenges : • Strategic Options : - Storage of service is not - Demand management possible - Capacity management - Sales volume - Tactical approaches continuously in relation - Continuous study on to the capacity demand patterns and - Time pressure in sales competitive parameters SRM/M1/SS
  • 11.
    Customer Participation… • Challenges: • Strategic Options: - Customers are not - Effective external marketing controllable - Customer education and - Production quality also training depends upon customer’s - Effective interactive knowledge and ability to marketing participate - Management of - Customers are evaluating at movements of truth every stage of service - Effective internal marketing production SRM/M1/SS
  • 12.
    No ownership… • Challenges: • Strategic Options: - Nothing remains after - Making communication consumption tangible - Very less time to the - Customer relationship consumer to evaluate the marketing product - Managing high level of - High consumer dissonance company image SRM/M1/SS
  • 13.
    Classifications of Servicesin Economy  Value Added Services Financing, Leasing, Insurance  Infrastructure service Communications, Transportation, Utilities, Banking Manufacturing Services inside company Finance, Accounting, Legal , R&D and design  Distribution service Wholesaling, Retailing, Repairing SRM/M1/SS
  • 14.
    Cont…..  Personal Service Health care, Restaurants, Hotels  Business Service supporting Manufacturing Consulting, Auditing, Advertising, Waste Disposal  Governments Service Military, Education, Judicial, Police and fire protection SRM/M1/SS
  • 15.
    Service Classification :Serviceprocess Matrix Degree of Interaction and Customization LOW High Degree of Labor intensity Service Shop Service factory •Hospitals LOW •Airlines •Auto Repair •Trucking •Other repair services •Hotels •Resorts & Recreation High Mass services Professional •Retailing •Wholesaling Services •School •Physicians •Retail aspect of •Lawyers •Accountants commercial Banking •Architects SRM/M1/SS
  • 16.
  • 17.
  • 18.
  • 19.
     Gap 1: The Knowledge Gap  Gap 2: The Policy Gap  Gap 3: The Delivery Gap  Gap 4: The Communications Gap  Gap 5: The Perceptions Gap  Gap 6: The Service Quality Gap SRM/M1/SS
  • 20.
    Suggestions for Closingthe Six Service Quality Gaps
  • 21.
    Suggestions for Closingthe Six Service Quality Gaps
  • 22.
    Suggestions for Closingthe Six Service Quality Gaps
  • 23.
    Suggestions for Closingthe Six Service Quality Gaps
  • 24.
    Measuring and Improving Service Quality
  • 25.
    Measures of ServiceQuality Soft Measures Hard Measures  Can be counted, timed, or  Not easily observed, must be measured through audits collected by talking to customers, employees or others  Typically operational processes or outcomes  Provide direction, guidance and feedback to employees on ways to  Standards often set with achieve customer satisfaction reference to percentage of occasions on which a  Can be quantified by measuring particular measure is customer perceptions and beliefs achieved  e.g., SERVQUAL, surveys, and customer advisory panel
  • 26.
  • 27.
    Hard Measures of Service Quality
  • 28.
    Hard Measures ofService Quality • Service quality indexes – Embrace key activities that have an impact on customers • Control charts to monitor a single variable – Offer a simple method of displaying performance over time against specific quality standards – Enable easy identification of trends – Are only good if data on which they are based are accurate • FedEx: One of the first service companies to understand the need for an index of service quality that embraced all the key activities that affect customers
  • 29.
    Control Chart forDeparture Delays
  • 30.
    Tools to Analyzeand Address Service Quality Problems
  • 31.
    Tools to Analyzeand Address Service Quality Problems • Fishbone diagram – Cause-and-effect diagram to identify potential causes of problems • Pareto Chart – Separating the trivial from the important. Often, a majority of problems are caused by a minority of causes (i.e., the 80/20 rule) • Blueprinting – Visualization of service delivery, identifying points where failures are most likely to occur
  • 32.
    Cause-and-Effect Chart forFlight Departure Delays
  • 33.
    Analysis of Causesof Flight Departure Delays
  • 34.
    Blueprinting • Depicts sequenceof front-stage interactions experienced by customers plus supporting backstage activities • Used to identify potential fail points – where failures are most likely to appear • Shows how failures at one point can have a ripple effect • Managers can identify points which need urgent attention – Important first step in preventing service quality problems
  • 35.
    Service Blueprinting © Oxford University Press 2008. 35 All rights reserved.
  • 36.
    Return On Quality(ROQ) • Assess costs and benefits of quality initiatives – ROQ approach is based on four assumptions: • - quality is an investment • - quality efforts must be financially accountable • - it’s possible to spend too much on quality • - not all quality expenditures are equally valid – Implication: Quality improvement efforts may benefit from being related to productivity improvement programs – To determine feasibility of new quality improvement efforts, determine costs and then relate to anticipated customer response • Determine optimal level of reliability – Diminishing returns set in as improvements require higher investments – Know when improving service reliability becomes uneconomical
  • 37.
    When Does ImprovingService Assumption: Customers are Reliability Become Uneconomical? equally (or even more) satisfied with the service recovery than with a service that is delivered as planned. Satisfy Target Satisfy Target Customers Through Customers Through 100% Service Recovery Service Recovery Service Reliability Optimal Point of Optimal Point of Reliability: Cost of Reliability: Cost of Failure = Service Failure = Service Recovery Recovery Satisfy Target Satisfy Target Customers Through Customers Through Service Delivery as Service Delivery as A B C D Planned Planned Small Cost, Investment Large Cost, Large Improvement Small Improvement
  • 38.
    Productivity in aService Context • Productivity: amount of output produced relative to amount of inputs – Improvement in productivity means an improvement in the ratio of outputs to inputs. • Intangible nature of service makes it hard to measure productivity of service firms, especially for information-based services – Both input and output are hard to define – Relatively simpler in possession-processing services, as compared to information- and people-processing services
  • 39.
    Service Efficiency, Productivity,and Effectiveness • Efficiency: involves comparison to a standard, usually time-based (e.g., how long employee takes to perform specific task) – Focus on inputs rather than outcomes and may ignore variations in service quality/value • Productivity: involves financial valuation of outputs to inputs – Consistent delivery of outcomes desired by customers should command higher prices • Effectiveness: degree to which firm meets goals – Cannot divorce productivity from quality and customer satisfaction
  • 40.
    Stopwatch Time Study •Standard time duration means the time taken by an average worker to perform a task at a sustainable rate under the given facility arrangements. • A performance rating (P) is multiplied with the observed time of the job to arrive at the normal time (N) of the job. • Standard time (S) is normal time plus allowances. Allowances have to be made for time consumed in adjusting or repairing the machines, workers drinking water, or taking rest breaks. 40

Editor's Notes

  • #5 Service and Relationship Marketing