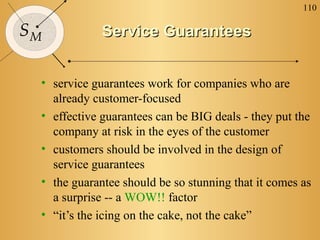
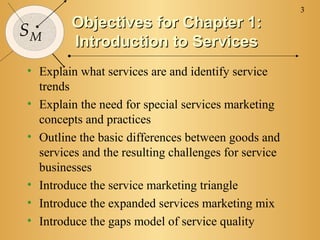
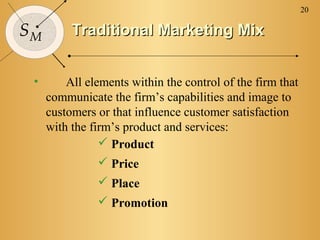
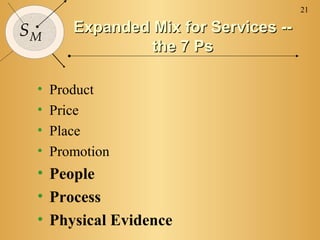
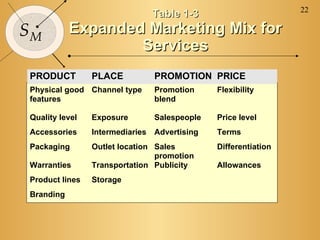
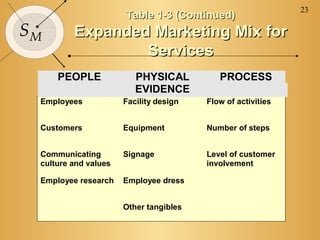
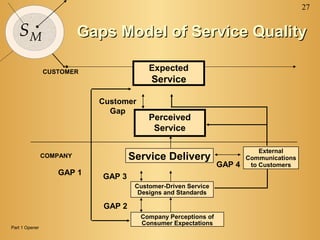
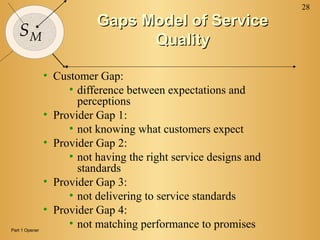
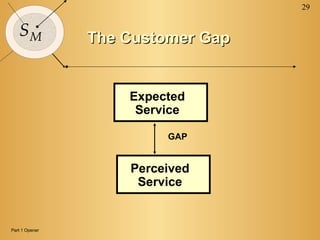
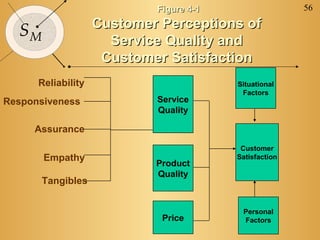
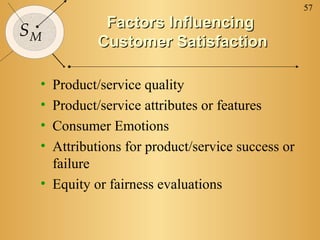
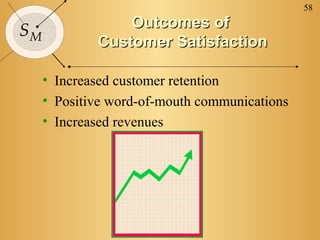
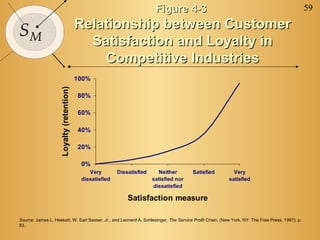
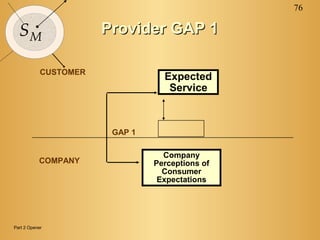
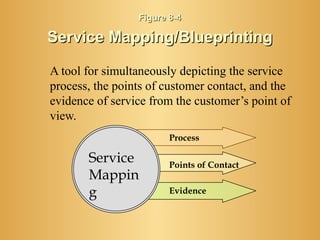
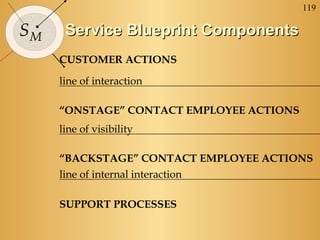
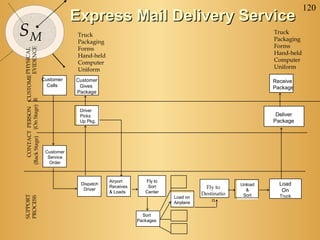
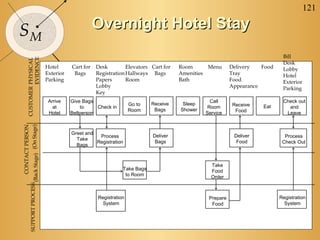
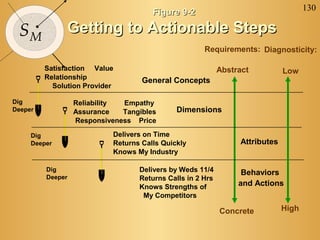
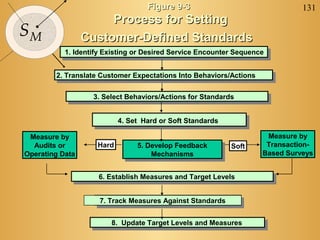
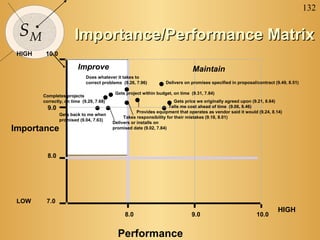
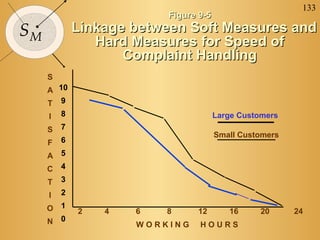
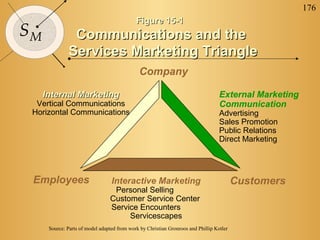
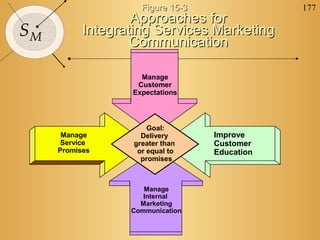
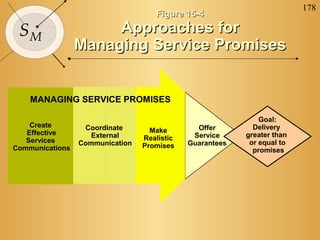
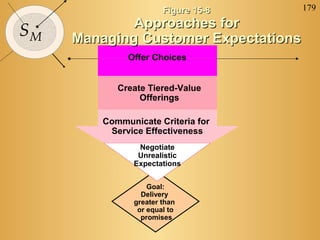
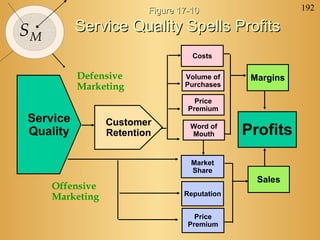
1

SM


     Services Marketing
2

SM
     Chapter 1


     INTRODUCTION
             TO
                 SERVICES
3
        Objectives for Chapter 1:
SM
        Introduction to Services
• Explain what services are and identify service
  trends
• Explain the need for special services marketing
  concepts and practices
• Outline the basic differences between goods and
  services and the resulting challenges for service
  businesses
• Introduce the service marketing triangle
• Introduce the expanded services marketing mix
• Introduce the gaps model of service quality
4

SM              Introduction

• Services are deeds,processes and
  performance
• Intangible, but may have a tangible
  component
• Generally produced and consumed at the
  same time
• Need to distinguish between SERVICE and
  CUSTOMER SERVICE
5

SM      Challenges for Services

 • Defining and improving quality
 • Communicating and testing new services
 • Communicating and maintaining a consistent
   image
 • Motivating and sustaining employee commitment
 • Coordinating marketing, operations and human
   resource efforts
 • Setting prices
 • Standardization versus personalization
6
              Examples of Service
SM
                  Industries
 • Health Care
     – hospital, medical practice, dentistry, eye care
 • Professional Services
     – accounting, legal, architectural
 • Financial Services
     – banking, investment advising, insurance
 • Hospitality
     – restaurant, hotel/motel, bed & breakfast,
     – ski resort, rafting
 • Travel
     – airlines, travel agencies, theme park
 • Others:
     – hair styling, pest control, plumbing, lawn
       maintenance, counseling services, health club
7
                                 Figure 1-1
  SM               Tangibility Spectrum
 Salt
  Soft Drinks
      Detergents
            Automobiles
                Cosmetics Fast-food
                      Outlets
                                                                       Intangible
                                                                        Dominant

Tangible
                              
Dominant                     Fast-food
                              Outlets      
                                         Advertising
                                          Agencies
                                                       
                                                     Airlines  
                                                            Investment
                                                           Management  
                                                                   Consulting   
                                                                                Teaching
Figure 1-2                                                          8

SM                        Percent of
                  U.S. Labor Force by Industry
                  80
                  70
 Percent of GDP


                  60
                  50
                  40
                  30
                  20
                  10
                  0                                                                                           Services
                        1929 1948 1969 1977 1984 1996                                                         Manufacturing
                                                                                                              Mining & Agriculture
                                                            Yea
                                                            r
                  Source: Survey of Current Business, April 1998, Table B.8, July 1988, Table 6.6B, and
                  July 1992, Table 6.4C; Eli Ginzberg and George J. Vojta, “The Service Sector of the U.S.
                  Economy,” Scientific American, 244,3 (1981): 31-39.
Figure 1-3                                        9

SM                      Percent of U.S. Gross Domestic
                             Product by Industry
                      80
 Percent of GDP


                      70
                      60
                      50
                      40
                      30
                      20
                      10
                        0
                                                                                                  Services
                             1948 1959 1967 1977 1987 1996
                                                                                                  Manufacturing
                                           Year                                                   Mining & Agriculture
                  Source: Survey of Current Business, August 1996, Table 11, April 1998, Table
                  B.3; Eli Ginzberg and George J. Vojta, “The Service Sector of the U.S.
                  Economy,” Scientific American, 244,3 (1981): 31-39.
10
        Differences Between
SM
        Goods and Services


     Intangibility   Heterogeneity


     Simultaneous
      Production     Perishability
         and
     Consumption
11

SM     Implications of Intangibility


 Services cannot be inventoried
 Services cannot be patented
 Services cannot be readily displayed
  or communicated
 Pricing is difficult
12

SM     Implications of Heterogeneity

Service delivery and customer satisfaction
 depend on employee actions
Service quality depends on many
 uncontrollable factors
There is no sure knowledge that the service
 delivered matches what was planned and
 promoted
13
        Implications of Simultaneous
SM
        Production and Consumption

     Customers participate in and affect the
      transaction
     Customers affect each other
     Employees affect the service outcome
     Decentralization may be essential
     Mass production is difficult
14

SM     Implications of Perishability


  It is difficult to synchronize supply and
   demand with services
  Services cannot be returned or resold
15

SM                                                  Table 1-2
                       Services are Different
     Goods                 Services                Resulting Implications
     Tangible              Intangible              Services cannot be inventoried.
                                                   Services cannot be patented.
                                                   Services cannot be readily displayed or communicated.
                                                   Pricing is difficult.
     Standardized          Heterogeneous Service delivery and customer satisfaction depend on
                                         employee actions.
                                         Service quality depends on many uncontrollable factors.
                                         There is no sure knowledge that the service delivered
                                         matches what was planned and promoted.
     Production            Simultaneous            Customers participate in and affect the transaction.
     separate from         production and          Customers affect each other.
     consumption           consumption             Employees affect the service outcome.
                                                   Decentralization may be essential.
                                                   Mass production is difficult.
     Nonperishable Perishable                      It is difficult to synchronize supply and demand with
                                                   services.
                                                   Services cannot be returned or resold.


Source: Adapted from Valarie A. Zeithaml, A. Parasuraman, and Leonard L. Berry, “Problems and Strategies in Services Marketing,”
Journal of Marketing 49 (Spring 1985): 33-46.
16
                                               Figure 1-5
SM           The Services Marketing Triangle
                                      Company
                                    (Management)

           Internal                                                     External
          Marketing                                                     Marketing
 “enabling the                                                                    “setting the
 promise”                                                                         promise”


 Employees                   Interactive Marketing                         Customers
                              “delivering the promise”
     Source: Adapted from Mary Jo Bitner, Christian Gronroos, and Philip Kotler
17
               Ways to Use the
SM
          Services Marketing Triangle
Overall Strategic              Specific Service
 Assessment                      Implementation
     • How is the service        • What is being promoted
       organization doing          and by whom?
       on all three sides of     • How will it be delivered
       the triangle?               and by whom?
     • Where are the             • Are the supporting
       weaknesses?                 systems in place to
                                   deliver the promised
     • What are the                service?
       strengths?
18
                                       Figure 1-6

SM                   The Services Triangle
                       and Technology
                                 Company


                               Technology


               Providers                            Customers

 Source: Adapted from A. Parasuraman
19

SM     Services Marketing Mix:
          7 Ps for Services

 • Traditional Marketing Mix
 • Expanded Mix for Services: 7 Ps
 • Building Customer Relationships Through
   People, Processes, and Physical Evidence
 • Ways to Use the 7 Ps
20

SM        Traditional Marketing Mix


 •       All elements within the control of the firm that
     communicate the firm’s capabilities and image to
     customers or that influence customer satisfaction
     with the firm’s product and services:
                 Product
                 Price
                Place
                Promotion
21

SM      Expanded Mix for Services --
                 the 7 Ps

 •   Product
 •   Price
 •   Place
 •   Promotion
 • People
 • Process
 • Physical Evidence
22
                              Table 1-3
SM         Expanded Marketing Mix for
                   Services
PRODUCT         PLACE          PROMOTION PRICE
Physical good Channel type     Promotion     Flexibility
features                       blend

Quality level   Exposure       Salespeople   Price level
Accessories     Intermediaries Advertising   Terms
Packaging       Outlet location Sales        Differentiation
                                promotion
Warranties      Transportation Publicity     Allowances
Product lines   Storage
Branding
23
                      Table 1-3 (Continued)
SM       Expanded Marketing Mix for
                 Services
     PEOPLE              PHYSICAL          PROCESS
                         EVIDENCE
 Employees            Facility design   Flow of activities


 Customers            Equipment         Number of steps


 Communicating        Signage           Level of customer
 culture and values                     involvement

 Employee research    Employee dress


                      Other tangibles
24

SM        Ways to Use the 7 Ps

Overall Strategic              Specific Service
 Assessment                      Implementation
• How effective is a firm’s    • Who is the customer?
  services marketing mix?      • What is the service?
• Is the mix well-aligned      • How effectively does the
                                 services marketing mix for a
  with overall vision and
                                 service communicate its
  strategy?                      benefits and quality?
• What are the strengths and   • What
  weaknesses in terms of the     changes/improvements are
  7 Ps?                          needed?
25
         Services Marketing Triangle
SM
            Applications Exercise
 • Focus on a service organization. In the context
   you are focusing on, who occupies each of the
   three points of the triangle?
 • How is each type of marketing being carried out
   currently?
 • Are the three sides of the triangle well aligned?
 • Are there specific challenges or barriers in any of
   the three areas?
26


SM
     Part 1


FOCUS ON THE CUSTOMER
27


   SM                     Gaps Model of Service Quality

                CUSTOMER                  Expected
                                           Service

                            Customer
                              Gap
                                          Perceived
                                           Service

                                                                            External
                COMPANY              Service Delivery                   Communications
                                                                GAP 4    to Customers
                   GAP 1     GAP 3
                                      Customer-Driven Service
                                       Designs and Standards

                             GAP 2
                                       Company Perceptions of
                                       Consumer Expectations
Part 1 Opener
28
                           Gaps Model of Service
   SM
                                 Quality

                • Customer Gap:
                     • difference between expectations and
                       perceptions
                • Provider Gap 1:
                     • not knowing what customers expect
                • Provider Gap 2:
                     • not having the right service designs and
                       standards
                • Provider Gap 3:
                     • not delivering to service standards
                • Provider Gap 4:
Part 1 Opener
                     • not matching performance to promises
29


   SM           The Customer Gap


                    Expected
                     Service

                         GAP


                    Perceived
                     Service


Part 1 Opener
30


SM
       Chapter 2


     CONSUMER BEHAVIOR
     IN SERVICES
31
          Objectives for Chapter 2:
SM         Consumer Behavior in
                  Services
• Overview the generic differences in consumer behavior
  between services and goods
• Introduce the aspects of consumer behavior that a
  marketer must understand in five categories of consumer
  behavior:
   • Information search
   • Evaluation of service alternatives
   • Service purchase and consumption
   • Postpurchase evaluation
   • Role of culture
32


SM            Consumer Evaluation
              Processes for Services
     • Search Qualities
        – attributes a consumer can determine prior to
          purchase of a product
     • Experience Qualities
        – attributes a consumer can determine after purchase
          (or during consumption) of a product
     • Credence Qualities
        – characteristics that may be impossible to evaluate
          even after purchase and consumption
33
                                                                                                                 Figure 2-1
     SM                                 Continuum of Evaluation for
                                        Different Types of Products


                                          Most                                                                        Most
                                         Goods                                                                       Services

Easy to evaluate
                                                                                                                                                                                                                       Difficult to evaluate
                   Clothing

                              Jewelry

                                        Furniture

                                                    Houses

                                                             Automobiles

                                                                           Restaurant meals

                                                                                              Vacations

                                                                                                          Haircuts

                                                                                                                     Child care

                                                                                                                                  Television repair

                                                                                                                                                      Legal services

                                                                                                                                                                       Root canals

                                                                                                                                                                                     Auto repair

                                                                                                                                                                                                   Medical diagnosis
                      {
                                                                                      {
                      High in search
                         qualities
                                                                           High in experience High in credence
                                                                                qualities         qualities
                                                                                                                                                               {
Figure 2-2                              34
                  Categories in Consumer
SM            Decision-Making and Evaluation of
                          Services
       Information                            Evaluation of
       Search                                 Alternatives
      Use of personal sources            Evoked set
      Perceived risk                     Emotion and mood


          Purchase and                     Post-Purchase
          Consumption                        Evaluation
      Service provision as              Attribution of dissatisfaction
     drama
      Service roles and scripts         Innovation diffusion
      Compatibility of                  Brand loyalty
     customers
35
                                       Figure 2-3
SM        Categories in Consumer Decision-
          Making and Evaluation of Services

       Information                                       Evaluation of
       Search                                            Alternatives
      Use of personal sources                         Evoked set
      Perceived risk                                  Emotion and mood


                                       Culture
                            Values and attitudes
                            Manners and customs
                            Material culture
                            Aesthetics
                            Educational and social
                                 institutions


         Purchase and                                  Post-Purchase
         Consumption                                     Evaluation
      Service provision as                          Attribution of dissatisfaction
     drama
      Service roles and scripts                     Innovation diffusion
      Compatibility of                              Brand loyalty
     customers
36


SM          Information search

• In buying services consumers rely more on
  personal sources. WHY? Refer p32
• Personal influence becomes pivotal as
  product complexity increases
• Word of mouth important in delivery of
  services
• With service most evaluation follows
  purchase
37


SM              Perceived Risk

• More risk would appear to be involved with
  purchase of services (no guarantees)
• Many services so specialised and difficult to
  evaluate (How do you know whether the
  plumber has done a good job?)
• Therefore a firm needs to develop strategies
  to reduce this risk, e.g, training of
  employees, standardisation of offerings
38


SM                   Evoked Set

• The evoked set of alternatives likely to be smaller
  with services than goods
• If you would go to a shopping centre you may
  only find one dry cleaner or “single brand”
• It is also difficult to obtain adequate prepurchase
  information about service
• The Internet may widen this potential
• Consumer may choose to do it themselves, e.g.
  garden services
39


SM          Emotion and Mood

• Emotion and mood are feeling states that
  influence people’s perception and
  evaluation of their experiences
• Moods are transient
• Emotions more intense, stable and
  pervasive
• May have a negative or positive influence
40


SM          Service Provision as
                   Drama

• Need to maintain a desirable impression
• Service “actors” need to perform certain
  routines
• Physical setting important, smell, music,
  use of space, temperature, cleanliness, etc.
41
              Global Feature:
SM      Differences in the Service
     Experience in the U.S. and Japan

             Authenticity
             Caring
             Control Courtesy
             Formality
             Friendliness
             Personalization
             Promptness
42


SM
      Chapter 3


     CUSTOMER
     EXPECTATIONS OF
     SERVICES
43
             Objectives for Chapter 3:
SM           Customer Expectations of
                     Service
• Recognize that customers hold different types of
  expectations for service performance
• Discuss controllable and uncontrollable sources of
  customer expectations
• Distinguish between customers’ global expectations of
  their relationships and their expectations of the service
  encounter
• Acknowledge that expectations are similar for many
  different types of customers
• Delineate the most important current issues surrounding
  customer expectations
44


SM               DEFINITIONS

• Customers have different expectations re
  services – or expected service
• Desired service – customer hopes to receive
• Adequate service – the level of service the
  customer may accept

• DO YOUR EXPECTATIONS DIFFER RE
  SPUR and CAPTAIN DOREGO?
45
                 Figure 3-1
SM     Dual Customer
      Expectation Levels
     (Two levels of expectations)
          Desired Service


             Zone of
            Tolerance


         Adequate Service
46


SM           Figure 3-2

     The Zone of Tolerance


           Desired Service


            Zone of
           Tolerance

           Adequate Service
Figure 3-3                               47


    SM         Zones of Tolerance VARY for
               Different Service Dimensions
                   Desired Service

  Level
    of
                      Zone of                                Desired
Expectation                                               Desired Service
                     Tolerance                               Service
                  Adequate Service
                                                               Zone
                                                                of
                                                             Tolerance

                                                            Adequate
                                                         Adequate Service
                                                             Service


              Most Important Factors                      Least Important Factors
              Source: Berry, Parasuraman, and Zeithaml (1993)
Figure 3-4            48

                  Zones of Tolerance VARY for
SM
               First-Time and Recovery Service

   First-Time Service

       Outcome

       Process


   Recovery Service

       Outcome

       Process

                      LOW                                       HIGH
                                                 Expectations
Source: Parasuraman, Berry and Zeithaml (1991)
Figure 3-5               49


SM            Factors that Influence
                Desired Service

     Enduring Service
       Intensifiers

                                      Desired
                                      Service
     Personal Needs
                                       Zone
                                        of
                                     Tolerance

                                     Adequate
                                      Service
50


SM

• Personal needs include physical, social,
  psychological categories

• Enduring service intensifiers are individual, stable
  factors that lead to heightened sensitivity to
  service
  This can further divided into Derived Service
  Expectations and Personal service Philosophies
51
                          Figure 3-6

SM           Factors that Influence
              Adequate Service
     Transitory Service
        Intensifiers


                                        Desired
     Perceived Service                  Service
        Alternatives
                                         Zone
                                          of
                                       Tolerance
      Self-Perceived
       Service Role                    Adequate
                                        Service


        Situational
          Factors
52


SM

• Transitory service intensifiers – temporary –
  a computer breakdown will be less tolerated
  at financial year-ends
• Perceived service alternatives
• Perceived service role of customer
• Situational factors
Figure 3-7                       53

         Factors that Influence
SM
     Desired and Predicted Service
                                Explicit Service
                                  Promises


                                Implicit Service
                                  Promises


       Desired                  Word-of-Mouth
       Service

        Zone
                                Past Experience
         of
      Tolerance

      Adequate      Predicted
       Service       Service
54

SM
     Chapter 4


     CUSTOMER
     PERCEPTIONS OF
     SERVICE
55
          Objectives for Chapter 4:
SM        Customer Perceptions of
                  Service
• Provide you with definitions and
  understanding of customer satisfaction and
  service quality
• Show that service encounters or the
  “moments of truth” are the building blocks of
  customer perceptions
• Highlight strategies for managing customer
  perceptions of service
Figure 4-1                  56
                    Customer Perceptions of
  SM
                      Service Quality and
                     Customer Satisfaction
      Reliability                        Situational
                                          Factors
Responsiveness              Service
                            Quality

     Assurance
                                          Customer
       Empathy                           Satisfaction
                            Product
                            Quality
       Tangibles


                                          Personal
                             Price        Factors
57
            Factors Influencing
SM
           Customer Satisfaction

 • Product/service quality
 • Product/service attributes or features
 • Consumer Emotions
 • Attributions for product/service success or
   failure
 • Equity or fairness evaluations
58
                 Outcomes of
SM
             Customer Satisfaction

     • Increased customer retention
     • Positive word-of-mouth communications
     • Increased revenues
Figure 4-3                                                            59

                                          Relationship between Customer
SM
                                            Satisfaction and Loyalty in
                                              Competitive Industries
                                          100%
                    Loyalty (retention)


                                          80%

                                          60%

                                          40%

                                          20%

                                           0%
                                              Very        Dissatisfied     Neither       Satisfied        Very
                                           dissatisfied                  satisfied nor                  satisfied
                                                                         dissatisfied

                                                              Satisfaction measure

Source: James L. Heskett, W. Earl Sasser, Jr., and Leonard A. Schlesinger, The Service Profit Chain, (New York, NY: The Free Press, 1997), p.
83.
60

SM             Service Quality


 • The customer’s judgment of overall
   excellence of the service provided in
   relation to the quality that was expected.
 • Process and outcome quality are both
   important.
61

SM            The Five Dimensions of
                  Service Quality

Reliability    Ability to perform the promised
               service dependably and accurately.
               Knowledge and courtesy of
Assurance      employees and their ability to
               convey trust and confidence.
Tangibles      Physical facilities, equipment, and
               appearance of personnel.
Empathy        Caring, individualized attention the
               firm provides its customers.
Responsiveness Willingness to help customers and
               provide prompt service.
62

SM                     Exercise to
               Identify Service Attributes
In groups of five, choose a services industry and spend 10 minutes
brainstorming specific requirements of customers in each of the five
service quality dimensions. Be certain the requirements reflect the
customer’s point of view.
Reliability:

Assurance:

Tangibles:

Empathy:

Responsiveness:
63
                 SERVQUAL Attributes
SM                                            ASSURANCE
                                               Employees who instill confidence in
                                               customers
                                               Making customers feel safe in their
                                               transactions
RELIABILITY                                    Employees who are consistently courteous
                                               Employees who have the knowledge to
  Providing service as promised                answer customer questions
  Dependability in handling customers’
  service problems                           EMPATHY
  Performing services right the first time     Giving customers individual attention
  Providing services at the promised time      Employees who deal with customers in a
  Maintaining error-free records               caring fashion
                                               Having the customer’s best interest at heart
RESPONSIVENESS                                 Employees who understand the needs of
                                               their customers
  Keeping customers informed as to             Convenient business hours
  when services will be performed            TANGIBLES
  Prompt service to customers                  Modern equipment
  Willingness to help customers                Visually appealing facilities
  Readiness to respond to customers’           Employees who have a
  requests                                     neat, professional
                                               appearance
                                               Visually appealing materials
                                               associated with the service
64

SM              The Service Encounter

 • is the “moment of truth”
 • occurs any time the customer interacts with the firm
 • can potentially be critical in determining customer satisfaction and
   loyalty
 • types of encounters:
    – remote encounters
    – phone encounters
    – face-to-face encounters
 • is an opportunity to:
    – build trust
    – reinforce quality
    – build brand identity
    – increase loyalty
65
                    Figure 4-4

SM           A Service Encounter
           Cascade for a Hotel Visit

Check-In
Check-In
   Bellboy Takes to
   Bellboy Takes to
   Room
   Room
                 Restaurant
                  Restaurant
                    Meal
                    Meal
                       Request Wake-Up
                        Request Wake-Up
                             Call
                              Call
                                      Checkout
                                      Checkout
Figure 4-5                  66
               A Service Encounter
SM
             Cascade for an Industrial
                    Purchase

Sales Call
Sales Call
  Delivery and Installation
  Delivery and Installation

                        Servicing
                        Servicing

                          Ordering Supplies
                          Ordering Supplies
                                         Billing
                                         Billing
67
        Critical Service Encounters
SM
                  Research

 • GOAL - understanding actual events and
   behaviors that cause customer dis/satisfaction
   in service encounters
 • METHOD - Critical Incident Technique
 • DATA - stories from customers and employees
 • OUTPUT - identification of themes underlying
   satisfaction and dissatisfaction with service
   encounters
68
       Sample Questions for Critical
SM
        Incidents Technique Study

 • Think of a time when, as a customer, you had a
   particularly satisfying (dissatisfying) interaction
   with an employee of              .
 • When did the incident happen?
 • What specific circumstances led up to this
   situation?
 • Exactly what was said and done?
 • What resulted that made you feel the interaction
   was satisfying (dissatisfying)?
69

SM    Common Themes in Critical
         Service Encounters
              Research

        Recovery:            Adaptability:
     Employee Response      Employee Response
      to Service Delivery   to Customer Needs
        System Failure         and Requests


          Coping:            Spontaneity:
      Employee Response       Unprompted and
     to Problem Customers   Unsolicited Employee
                            Actions and Attitudes
70

SM               Recovery

  DO                     DON’T
• Acknowledge           • Ignore customer
  problem               • Blame customer
• Explain causes        • Leave customer to
• Apologize               fend for him/herself
• Compensate/upgrade    • Downgrade
• Lay out options       • Act as if nothing is
• Take responsibility     wrong
71

SM                Adaptability

     DO                       DON’T
• Recognize the             • Promise, then fail to
  seriousness of the need     follow through
• Acknowledge               • Ignore
• Anticipate                • Show unwillingness to
• Attempt to                  try
  accommodate               • Embarrass the customer
• Explain rules/policies    • Laugh at the customer
• Take responsibility       • Avoid responsibility
• Exert effort to
  accommodate
72

SM               Spontaneity

     DO                        DON’T
• Take time                • Exhibit impatience
• Be attentive             • Ignore
• Anticipate needs
                           • Yell/laugh/swear
• Listen
• Provide information
                           • Steal from or cheat a
  (even if not asked)        customer
• Treat customers fairly   • Discriminate
• Show empathy             • Treat impersonally
• Acknowledge by name
73

SM                   Coping


    DO                         DON’T
•   Listen                   • Take customer’s
•   Try to accommodate         dissatisfaction
•                              personally
    Explain
                             • Let customer’s
•   Let go of the customer
                               dissatisfaction affect
                               others
74
                                  Figure 4-6
  SM                Evidence of Service from the
                     Customer’s Point of View
                                                Contact employees
                                                Customer
 Operational flow of                          him/herself
activities                                      Other customers
                                  People
 Steps in process
 Flexibility vs.
standard
 Technology vs.                     Physical           Tangible
human                   Process
                                     Evidence          communication
                                                        Servicescape
                                                        Guarantees
                                                        Technology
75

SM
      Part 2


     LISTENING TO
     CUSTOMER
     REQUIREMENTS
76

  SM                   Provider GAP 1

            CUSTOMER
                                  Expected
                                   Service


                        GAP 1

                                  Company
           COMPANY              Perceptions of
                                  Consumer
                                 Expectations


Part 2 Opener
77

SM
      Chapter 5


     UNDERSTANDING
     CUSTOMER
     EXPECTATIONS AND
     PERCEPTIONS THROUGH
     MARKETING RESEARCH
78
              Objectives for Chapter 5:
SM      Understanding Customer Expectations
              and Perceptions through
                 Marketing Research
• Present the types of and guidelines for marketing
  research in services
• Show the ways that marketing research information
  can and should be used for services
• Describe the strategies by which companies can
  facilitate interaction and communication between
  management and customers
• Present ways that companies can and do facilitate
  interaction between contact people and management
79

SM         Common Research Objectives
                for Services
•   To identify dissatisfied customers
•   To discover customer requirements or expectations
•   To monitor and track service performance
•   To assess overall company performance compared to
    competition
•   To assess gaps between customer expectations and
    perceptions
•   To gauge effectiveness of changes in service
•   To appraise service performance of individuals and teams
    for rewards
•   To determine expectations for a new service
•   To monitor changing expectations in an industry
•   To forecast future expectations
80
                                  Figure 5-1
SM     Criteria for An Effective
     Services Research Program
                                     Includes
                           es      Quantitative
                       lud ive
                    Inc litat h     Research       Includes
                       a      c
                    Qu esear                      Perceptions
                       R                              and
                                                    Expectations
        Occurs                                             of
                                                     Customers
         with
      Appropriate          Research                    Includes
      Frequency                                       Measures
                           Objectives                     of
                                                      Loyalty or
                                                      Behavioral
        Measures                                      Intentions
        Priorities                                 st
           or                                 s Co
         Importance
                                         lance ue of
                            Includes   Ba Val ion
                           Statistical  and ormat
                            Validity      Inf
                         When Necessary
81

SM                 Portfolio of Services Research
 Research Objective                                           Type of Research
Identify dissatisfied customers to attempt recovery;
identify most common categories of service failure            Customer Complaint
for remedial action
                                                              Solicitation
Assess company’s service performance compared to
competitors; identify service-improvement priorities; track
service improvement over time                                 “Relationship” Surveys
Obtain customer feedback while service experience is still
fresh; act on feedback quickly if negative patterns develop
                                                              Post-Transaction Surveys
Use as input for quantitative surveys; provide a
forum for customers to suggest service-improvement
ideas                                                         Customer Focus Groups
Measure individual employee service behaviors for use in
coaching, training, performance evaluation, recognition and
rewards; identify systemic strengths and weaknesses in        “Mystery Shopping” of
service
                                                              Service Providers
Measure internal service quality; identify employee-
perceived obstacles to improve service; track
employee morale and attitudes                                 Employee Surveys
Determine the reasons why customers defect

To forecast future expectations of customers                  Lost Customer Research
To develop and test new service ideas
                                                              Future Expectations Research
82
                Stages in the Research
SM
                       Process

•   Stage 1 :   Define Problem
•   Stage 2 :   Develop Measurement Strategy
•   Stage 3 :   Implement Research Program
•   Stage 4 :   Collect and Tabulate Data
•   Stage 5 :   Interpret and Analyze Findings
•   Stage 6 :   Report Findings
83
                                    Figure 5-5

SM           Service Quality Perceptions
            Relative to Zones of Tolerance
                    by Dimensions
 9
 8
 7                                                           O
        O                              O
                         O                         O
 6
 5
 4
 3
 2
 1
 0   Reliability   Responsiveness   Assurance    Empathy   Tangibles

 Retail Chain                  Zone of Tolerance O S.Q. Perception
84
                Service Quality Perceptions
SM            Relative to Zones of Tolerance by
                         Dimensions
 10

  8
            O             O              O                                O
                                                             O
  6

  4

  2

  0
      Reliability   Responsiveness    Assurance          Empathy         Tangibles

 Computer                            Zone of Tolerance   O   S.Q. Perception
 Manufacturer
85
                                      Figure 5-6
SM            Importance/Performance Matrix
HIGH
             High                                            
             Leverage
             Attributes to Improve         Attributes to Maintain
                                              
Importance


                                                        
                          


                                           Low
                                                    
                                          Leverage
                           
             Attributes to Maintain        Attributes to De-emphasize


LOW
                                                                        HIGH
                           Performance
86

SM
      Chapter 6


     BUILDING
      CUSTOMER
          RELATIONSHIPS
87
              Objectives for Chapter 6:
SM              Building Customer
                   Relationships

• Explain relationship marketing, its goals, and the benefits
  of long-term relationships for firms and customers
• Explain why and how to estimate customer lifetime value
• Specify the foundations for successful relationship
  marketing--quality core services and careful market
  segmentation
• Provide you with examples of successful customer
  retention strategies
• Introduce the idea that “the customer isn’t always right”
88

SM           Relationship Marketing

 • is a philosophy of doing business that focuses on keeping
   and improving current customers
 • does not necessarily emphasize acquiring new customers
 • is usually cheaper (for the firm)--to keep a current
   customer costs less than to attract a new one
 • goal = to build and maintain a base of committed
   customers who are profitable for the organization
 • thus, the focus is on the attraction, retention, and
   enhancement of customer relationships
89

SM       Lifetime Value of a Customer

     • Assumptions
     • Income
        – Expected Customer Lifetime
        – Average Revenue (month/year)
        – Other Customers convinced via WOM
        – Employee Loyalty??
     • Expenses
        – Costs of Serving Customer Increase??
90

SM
      A Loyal Customer is One Who...
 • Shows Behavioral Commitment
     – buys from only one supplier, even though other options
       exist
     – increasingly buys more and more from a particular
       supplier
     – provides constructive feedback/suggestions
 • Exhibits Psychological Commitment
     – wouldn’t consider terminating the relationship--
       psychological commitment
     – has a positive attitude about the supplier
     – says good things about the supplier
91

SM       Customer Loyalty Exercise


 • Think of a service provider you are loyal to.
 • What do you do (your behaviors, actions, feelings)
   that indicates you are loyal?
 • Why are you loyal to this provider?
92
        Benefits to the Organization
SM
           of Customer Loyalty

 • loyal customers tend to spend more with the
   organization over time
 • on average costs of relationship maintenance are
   lower than new customer costs
 • employee retention is more likely with a stable
   customer base
 • lifetime value of a customer can be very high
93

SM           Benefits to the Customer


     • inherent benefits in getting good value
     • economic, social, and continuity benefits
        – contribution to sense of well-being and quality
          of life and other psychological benefits
        – avoidance of change
        – simplified decision making
        – social support and friendships
        – special deals
94
         “The Customer Isn’t Always
SM
                   Right”

     • Not all customers are good relationship
       customers:
       – wrong segment

       – not profitable in the long term

       – difficult customers
95
            Strategies for Building
SM
                Relationships
     • Foundations:
        – Excellent Quality/Value
        – Careful Segmentation
     • Bonding Strategies:
        – Financial Bonds
        – Social & Psychological Bonds
        – Structural Bonds
        – Customization Bonds
     • Relationship Strategies Wheel
96
             Figure 6-1

SM     Customer Goals of
     Relationship Marketing


             Enhancing


             Retaining


             Satisfying


              Getting
Figure 6-3             97

SM      Underlying Logic of Customer
          Retention Benefits to the
                Organization
                 Customer Satisfaction


Customer Retention &                      Quality
  Increased Profits                       Service


                   Employee Loyalty
98
                               Figure 6-5
  SM         Steps in Market Segmentation
                         and
                Targeting for Services


 STEP 1:     STEP 2:        STEP 3:          STEP4:       STEP 5:
Identify     Develop       Develop          Select the   Ensure that
Bases for    Profiles of   Measures         Target       Segments
Segmenting   Resulting     of Segment       Segments     Are
the Market   Segments      Attractive-                   Compatible
                           ness
Figure 6-6                                    99

SM    Levels of Retention Strategies
                                       Stable
                     Volume and        Pricing
                     Frequency                      Bundling and
                     Rewards                        Cross Selling


       Integrated                   I. Financial              Continuous
       Information                       Bonds                Relationships
       Systems

                     IV.
                                     Excellent
                                      Quality          II.
     Joint       Structural                                         Personal
     Investments                       and           Social         Relationships
                    Bonds
                                      Value          Bonds

         Shared                                                Social Bonds
         Processes             III. Customization              Among
         and                          Bonds                    Customers
         Equipment

                     Anticipation                    Customer
                     / Innovation                    Intimacy
                                        Mass
                                    Customization
100

SM
     Chapter 7


     SERVICE RECOVERY
101
          Objectives for Chapter 7:
SM           Service Recovery

 • Illustrate the importance of recovery from service
   failures in building loyalty
 • Discuss the nature of consumer complaints and
   why people do and do not complain
 • Provide evidence of what customers expect and
   the kind of responses they want when they
   complain
 • Provide strategies for effective service recovery
 • Discuss service guarantees
102
                                                    Figure 7-1

     SM                    Unhappy Customers’
                           Repurchase Intentions
Unhappy Customers Who Don’t Complain
                                              9%
 Unhappy Customers Who Do Complain                                  37%


                                                      19%
        Complaints Not Resolved
                                                                           46%


                                                                                 54%
           Complaints Resolved
                                                                                              70%


    Complaints Resolved Quickly
                                                                                                       82%
                                                                                                             95%

                                       Percent of Customers Who Will Buy Again

                       Minor complaints ($1-$5 losses)        Major complaints (over $100 losses)
                        Source: Adapted from data reported by the Technical Assistance Research Program.
Figure 7-3                                  103

SM                   Customer Response
                  Following Service Failure
                                    Service Failure


                  Take Action                                  Do Nothing


                                                  Switch Providers      Stay with Provider

Complain to        Complain to         Complain to
 Provider        Family & Friends      Third Party


     Switch Providers        Stay with Provider
104
                                                       Figure 7-5

SM   Service Recovery Strategies
                                                               We
                                                              En lcom
                                                e               co
                                           ic                     ura e an
                                         rv                          ge d
                                       Se                               Co
                                   e                                       m
                                 th                                                 pla
                            fe                                                         i   n ts
                         Sa
                    il
                  Fa


                                                                                                          Act Quickly
                                                     Service
     Learn from
     Lost Custom


                                                    Recovery
                                                    Strategies
                 ers


                                                                                                          rl   y
                                                                                                      Fai
                            Le                                                                    s
                                                                                               er
                           Re arn f                                                       om
                             co rom                                                   t
                               ve                                                C us
                                  ry
                                     Ex                                 e   at
                                       pe                            Tr
                                          ri         en
                                                        ce
                                                          s
Pricing
                                                          105
•
•
    High Price
    Price Increases
                                           Figure 7-6

        SM                    Causes Behind Service
•   Unfair Pricing
•   Deceptive Pricing

Inconvenience
• Location/Hours
• Wait for Appointment
• Wait for Service
                                   Switching
Core Service Failure
• Service Mistakes
• Billing Errors
• Service Catastrophe

Service Encounter Failures
                                    Service
•   Uncaring
•   Impolite
•   Unresponsive
•   Unknowledgeable                Switching
Response to Service Failure
• Negative Response
                                   Behavior
• No Response
• Reluctant Response


Competition
• Found Better Service


Ethical Problems
•   Cheat
•   Hard Sell
•   Unsafe
•   Conflict of Interest


Involuntary Switching
• Customer Moved                   Source: Sue Keaveney
• Provider Closed
106

SM            Service Guarantees

• guarantee = an assurance of the fulfillment of a
  condition (Webster’s Dictionary)

• for products, guarantee often done in the form of a
  warranty

• services are often not guaranteed
   – cannot return the service
   – service experience is intangible
        –(so what do you guarantee?)
107
                                                              Table 7-7
SM                         Characteristics of an
                       Effective Service Guarantee
   Unconditional
           • The guarantee should make its promise unconditionally -
             no strings attached.
   Meaningful
           • It should guarantee elements of the service that are
             important to the customer.
           • The payout should cover fully the customer's
             dissatisfaction.
   Easy to Understand and Communicate
           • For customers - they need to understand what to expect.
           • For employees - they need to understand what to do.
   Easy to Invoke and Collect
           • There should not be a lot of hoops or red tape in the way
             of accessing or collecting on the guarantee.
Source: Christopher W.L. Hart, “The Power of Unconditional Guarantees,” Harvard Business Review, July-August, 1988, pp. 54-62.
108
             Why a Good Guarantee
SM
                    Works

     • forces company to focus on customers

     • sets clear standards

     • generates feedback

     • forces company to understand why it failed

     • builds “marketing muscle”
109

SM             Service Guarantees


 • Does everyone need a guarantee?

 • Reasons companies do NOT offer guarantees:
     – guarantee would be at odds with company’s
       image
     – too many uncontrollable external variables
     – fears of cheating by customers
     – costs of the guarantee are too high
110

SM           Service Guarantees


 • service guarantees work for companies who are
   already customer-focused
 • effective guarantees can be BIG deals - they put the
   company at risk in the eyes of the customer
 • customers should be involved in the design of
   service guarantees
 • the guarantee should be so stunning that it comes as
   a surprise -- a WOW!! factor
 • “it’s the icing on the cake, not the cake”
111

SM
      Part 3


     ALIGNING STRATEGY,
       SERVICE DESIGN
          AND STANDARDS
112

       SM
                           Provider GAP 2
                CUSTOMER


                COMPANY              Customer-Driven
                                    Service Designs and
                                         Standards
                            GAP 2
                                        Company
                                      Perceptions of
                                        Consumer
                                       Expectations

Part 3 Opener
113

SM
      Chapter 8


     SERVICE DEVELOPMENT
     AND DESIGN
Objectives for Chapter 8:                   114

SM         Service Development and
                    Design
• Describe the challenges inherent in service design
• Present steps in the new service development
  process
• Show the value of service blueprinting and quality
  function deployment (QFD) in new service design
  and service improvement
• Present lessons learned in choosing and
  implementing high-performance service
  innovations
Figure 8-1   115

SM      Risks of Relying on Words
                 Alone to
            Describe Services

 Oversimplification
 Incompleteness
 Subjectivity
 Biased Interpretation
Figure 8-2                               116
           New Service Development Process
SM                                Business Strategy Development or Review


                                  New Service Strategy Development

 Front End
                                  Idea Generation
 Planning
                                               Screen ideas against new service strategy
                                  Concept Development and Evaluation
                                               Test concept with customers and employees
                                  Business Analysis

                                               Test for profitability and feasibility

                                  Service Development and Testing

                                               Conduct service prototype test
                                  Market Testing
 Implementation
                                               Test service and other marketing-mix elements
                                  Commercialization

                                  Postintroduction Evaluation
      Source: Booz-Allen & Hamilton, 1982; Bowers, 1985; Cooper, 1993; Khurana & Rosenthal 1997.
Figure 8-3                     117

SM        New Service Strategy Matrix
            for Identifying Growth
                 Opportunities
                             Markets
     Offerings   Current Customers     New Customers


     Existing
                 SHARE BUILDING        MARKET
     Services
                                       DEVELOPMENT


     New
     Services    SERVICE               DIVERSIFICATION
                 DEVELOPMENT
Figure 8-4

Service Mapping/Blueprinting

A tool for simultaneously depicting the service
process, the points of customer contact, and the
evidence of service from the customer’s point of
view.
                        Process

       Service          Points of Contact
       Mappin
       g                Evidence
119

SM    Service Blueprint Components
     CUSTOMER ACTIONS

     line of interaction

     “ONSTAGE” CONTACT EMPLOYEE ACTIONS
     line of visibility

     “BACKSTAGE” CONTACT EMPLOYEE ACTIONS
     line of internal interaction

     SUPPORT PROCESSES
120
                                                 Express Mail Delivery Service
SM                                                Truck
                                                  Packaging
                                                                                                                      Truck
                                                                                                                      Packaging
                                                  Forms                                                               Forms
                          EVIDENCE
   CONTACT PERSON CUSTOME PHYSICAL


                                                  Hand-held                                                           Hand-held
                                                  Computer                                                            Computer
                                                  Uniform                                                             Uniform

                                     Customer    Customer                                                             Receive
                                       Calls      Gives                                                               Package
                                                 Package
(Back Stage) (On Stage) R


                                                  Driver
                                                  Picks                                                                Deliver
                                                  Up Pkg.                                                             Package


                                      Customer
                                       Service
                                        Order


                                                              Airport       Fly to
                                                   Dispatch                                                  Unload     Load
                                                    Driver
                                                              Receives       Sort                Fly to
                                                              & Loads       Center                             &         On
                                                                                                Destinatio    Sort      Truck
SUPPORT


                                                                                     Load on
PROCESS


                                                                                     Airplane
                                                                                                    n

                                                                           Sort
                                                                         Packages
121

SM                                                              Overnight Hotel Stay
                                                                                                                                         Bill
                   EVIDENCE
          CUSTOMER PHYSICAL


                                                                                                                                         Desk
                                          Hotel      Cart for   Desk         Elevators Cart for   Room      Menu      Delivery   Food    Lobby
                                          Exterior    Bags      Registration Hallways Bags        Amenities           Tray               Hotel
                                          Parking               Papers       Room                 Bath                Food               Exterior
                                                                Lobby                                                 Appearance         Parking
                                                                Key
                                           Arrive    Give Bags                                              Call                         Check out
                                                                               Go to   Receive     Sleep              Receive
                                             at           to    Check in                                   Room                  Eat       and
                                                                               Room     Bags      Shower               Food
                                           Hotel     Bellperson                                            Service                        Leave
SUPPORT PROCESS (Back Stage) (On Stage)
                   CONTACT PERSON


                                                     Greet and
                                                                Process                Deliver                         Deliver            Process
                                                       Take
                                                               Registration             Bags                            Food             Check Out
                                                       Bags


                                                                                                             Take
                                                                           Take Bags                         Food
                                                                            to Room                          Order


                                                                Registration                                Prepare                     Registration
                                                                  System                                     Food                         System
122

SM                                                Figure 8-8

                    Building a Service Blueprint

Step 11
 Step           Step 22
                 Step           Step 33
                                 Step             Step 44
                                                   Step          Step 55
                                                                  Step            Step 66
                                                                                   Step
Identify the    Identify the    Map the           Map contact
                                                   Map contact   Link customer    Add
                                                                                   Add
 Identify the    Identify the    Map the                          Link customer
process to      customer or     process from      employee
                                                   employee      and contact      evidence of
                                                                                   evidence of
 process to      customer or     process from                     and contact
be blue-        customer        the               actions,
                                                   actions,      person           service at
                                                                                   service at
 be blue-        customer        the                              person
printed.        segment.        customer’s        onstage and
                                                   onstage and   activities to    each
                                                                                   each
 printed.        segment.        customer’s                       activities to
                                point of view.    back-stage.
                                                   back-stage.   needed           customer
                                                                                   customer
                                 point of view.                   needed
                                                                 support          action step.
                                                                                   action step.
                                                                  support
                                                                 functions.
                                                                  functions.
123
             Application of Service
SM
                   Blueprints

     • New Service Development
          • concept development
          • market testing
     • Supporting a “Zero Defects” Culture
          • managing reliability
          • identifying empowerment issues
     • Service Recovery Strategies
          • identifying service problems
          • conducting root cause analysis
          • modifying processes
124
            Blueprints Can Be Used By:
SM

• Service Marketers               • Human Resources
  – creating realistic customer     – empowering the human
    expectations                      element
     • service system design           • job descriptions
     • promotion                       • selection criteria
                                       • appraisal systems

• Operations Management
  – rendering the service as
                                  • System Technology
    promised
     • managing fail points         – providing necessary tools:
     • training systems                • system specifications
     • quality control                 • personal preference databases
125

SM
     Chapter 9


     CUSTOMER-DEFINED
     SERVICE STANDARDS
Objectives for Chapter 9:                   126

SM         Customer-defined Service
                  Standards
• Differentiate between company-defined and
  customer-defined service standards
• Distinguish among one-time service fixes and
  “hard” and “soft” customer-defined standards
• Explain the critical role of the service encounter
  sequence in developing customer-defined
  standards
• Illustrate how to translate customer expectations
  into behaviors and actions that are definable,
  repeatable, and actionable
Figure 9-1                                            127
                 AT&T’s Process Map for Measurements
SM
       Business Process                        Customer Need                      Internal Metric
                                        Reliability                  (40%)    % Repair Call
            30% Product
                                        Easy To Use                  (20%)    % Calls for Help
                                        Features / Functions         (40%)    Functional Performance Test


                                        Knowledge                    (30%)    Supervisor Observations
            30% Sales                   Responsive                   (25%)    % Proposal Made on Time
                                        Follow-Up                    (10%)    % Follow Up Made
 Total
                                        Delivery Interval Meets Needs (30%)   Average Order Interval
Quality 10% Installation
                                        Does Not Break               (25%)    % Repair Reports
                                        Installed When Promised      (10%)    % Installed On Due Date


                                        No Repeat Trouble            (30%)    % Repeat Reports
            15% Repair                  Fixed Fast                   (25%)    Average Speed Of Repair
                                        Kept Informed                (10%)    % Customers Informed


                                        Accuracy, No Surprise        (45%)    % Billing Inquiries
            15% Billing                 Resolve On First Call        (35%)    % Resolved First Call
                                        Easy To Understand           (10%)    % Billing Inquiries


Source: AT&T General Business Systems
128
             Exercise for Creating
SM         Customer-Defined Service
                  Standards
• Form a group of four people
• Use your school’s undergraduate or graduate
  program, or an approved alternative
• Complete the customer-driven service standards
  importance chart
• Establish standards for the most important and
  lowest-performed behaviors and actions
• Be prepared to present your findings to the class
129
            Customer-Driven Standards and
SM            Measurements Exercise
     Service Encounter   Customer Requirements   Measurements


Service
Quality
Figure 9-2                                    130

 SM            Getting to Actionable Steps
                                                      Requirements: Diagnosticity:

         Satisfaction Value                                 Abstract          Low
         Relationship               General Concepts
           Solution Provider

Dig               Reliability Empathy
Deeper            Assurance   Tangibles       Dimensions
                  Responsiveness Price

     Dig                    Delivers on Time
     Deeper                 Returns Calls Quickly                Attributes
                            Knows My Industry

         Dig                       Delivers by Weds 11/4          Behaviors
         Deeper                    Returns Calls in 2 Hrs
                                   Knows Strengths of            and Actions
                                    My Competitors

                                                            Concrete          High
Figure 9-3                                  131
                      Process for Setting
SM               Customer-Defined Standards
           1. Identify Existing or Desired Service Encounter Sequence


        2. Translate Customer Expectations Into Behaviors/Actions
         2. Translate Customer Expectations Into Behaviors/Actions

                   3. Select Behaviors/Actions for Standards
                    3. Select Behaviors/Actions for Standards

                           4. Set Hard or Soft Standards

 Measure by                                                           Measure by
  Audits or         Hard        5. Develop Feedback        Soft       Transaction-
                                 5. Develop Feedback
Operating Data                       Mechanisms                      Based Surveys
                                     Mechanisms

                    6. Establish Measures and Target Levels
                     6. Establish Measures and Target Levels

                     7. Track Measures Against Standards


                        8. Update Target Levels and Measures
                         8. Update Target Levels and Measures
132

 SM                    Importance/Performance Matrix
 HIGH    10.0

                         Improve                                                 Maintain
                             Does whatever it takes to
                             correct problems (9.26, 7.96)
                                                                Delivers on promises specified in proposal/contract (9.49, 8.51)
                                        
        Completes projects
                                  Gets project within budget, on time (9.31, 7.84)
        correctly, on time (9.29, 7.68)
                                                          Gets price we originally agreed upon (9.21, 8.64)
          9.0                                           Tells me cost ahead of time (9.06, 8.46)
                                              Provides equipment that operates as vendor said it would (9.24, 8.14)
                Gets back to me when
                                               Takes responsibility for their mistakes (9.18, 8.01)
                promised (9.04, 7.63)
                                          Delivers or installs on
Importance                                promised date (9.02, 7.84)


          8.0


 LOW     7.0
                                                                                                                       HIGH
                                                8.0                              9.0                         10.0


                                            Performance
133
                          Figure 9-5

SM           Linkage between Soft Measures and
                Hard Measures for Speed of
                    Complaint Handling
     S
     A 10
     T 9
     I   8                             Large Customers
     S   7
                                       Small Customers
     F   6
     A   5
     C   4
     T   3
     I   2
     O 1     2   4   6   8      12        16      20     24
     N 0             WORKING     HOURS
Figure 9-6                                                   134
                   Aligning Company
S M Processes with Customer Expectations
                      Customer Expectations

                               48 Hours
 Customer
 Process
 Blueprint       Report Lost           Receive New
                    Card                  Card
 Company
 Process        Company Sequential Processes
 Blueprint

 A
 A      B
        B       C
                C        D
                         D         E
                                   E      F
                                          F          G
                                                     G      H
                                                            H
  Lost Card                                          New Card
  Reported               40 Days                      Mailed
135

SM
      Chapter 10


     PHYSICAL EVIDENCE
     AND THE SERVICESCAPE
136
          Objectives for Chapter 10:
SM        Physical Evidence and the
                Servicescape

 • Explain the impact on customer perceptions of physical
   evidence, particularly the servicescape
 • Illustrate differences in types and roles of servicescapes
   and their implications for strategy
 • Explain why the servicescape affects employee and
   customer behavior
 • Analyze four different approaches for understanding the
   effects of physical environment
 • Present elements of an effective physical evidence
   strategy
137
                                Table 10-1

SM               Elements of Physical
                      Evidence
     Servicescape                Other tangibles

     Facility exterior           Business cards
      Exterior design            Stationery
      Signage                    Billing statements
      Parking                    Reports
      Landscape                  Employee dress
      Surrounding environment    Uniforms
                                 Brochures
     Facility interior           Internet/Web pages
      Interior design
      Equipment
      Signage
      Layout
      Air quality/temperature
Table 10-2                           138
        Examples of Physical Evidence from the
SM            Customer’s Point of View
     Service                   Physical evidence
                    Servicescape             Other tangibles
     Insurance      Not applicable                         Policy itself
                                                           Billing statements
                                                           Periodic updates
                                                           Company brochure
                                                           Letters/cards
     Hospital       Building exterior                      Uniforms
                    Parking                                Reports/stationery
                    Signs                                  Billing statements
                    Waiting areas
                    Admissions office
                    Patient care room
                    Medical equipment
                    Recovery room
     Airline        Airline gate area                      Tickets
                    Airplane exterior                      Food
                    Airplane interior (décor, seats, air   Uniforms
                    quality)
     Express mail   Not applicable                         Packaging
                                                           Trucks
                                                           Uniforms
                                                           Computers
     Sporting       Parking, Seating, Restrooms            Signs
     event          Stadium exterior                       Tickets
                    Ticketing area, Concession Areas       Program
                    Entrance, Playiing Field               Uniforms
Table 10-3                                    139
           Typology of Service Organizations
SM            Based on Variations in Form
              and Use of the Servicescape
                            Complexity of the servicescape evidence
     Servicescape         Elaborate                    Lean
     usage
     Self-service         Golf Land                    ATM
     (customer only)      Surf 'n' Splash              Ticketron
                                                       Post office kiosk
                                                       Internet services
                                                       Express mail drop-off
     Interpersonal        Hotel                        Dry cleaner
     services             Restaurants                  Hot dog stand
     (both customer and   Health clinic                Hair salon
     employeee)           Hospital
                          Bank
                          Airline
                          School
     Remote service       Telephone company            Telephone mail-order desk
     (employee only)      Insurance company            Automated voice-messaging-
                          Utility                      based services
                          Many professional services
Figure 10-3                             140
                         A Framework for Understanding
     SM                  Environment-user Relationships
                             in Service Organizations
        PHYSICAL                HOLISTIC                 INTERNAL       BEHAVIOR
     ENVIRONMENTAL            ENVIRONMENT               RESPONSES
       DIMENSIONS                                        Cognitive
                                                         Emotional
                                                        Physiological
                                                                         Individual
                                                                         Behaviors
                                                         Employee
                                                         Responses
         Ambient                                                            Social
        Conditions                                                       Interactions
      Space/Function             Perceived                              between and
                                Servicescape                                among
                                                                        customer and
     Signs, Symbols,                                                      employees
       and Artifacts
                                                         Customer
                                                         Responses
                                                                         Individual
                                                                         Behaviors
                                                         Cognitive
                                                         Emotional
Source: Adapted from Mary Jo Bitner, “Servicescapes.”
                                                        Physiological
141

SM
      Part 4


     DELIVERING AND
     PERFORMING SERVICE
142

       SM                  Provider GAP 3

                CUSTOMER


                                   Service Delivery
                COMPANY
                           GAP 3
                                    Customer-Driven
                                   Service Designs and
                                        Standards


Part 4 Opener
143

SM
      Chapter 11


     EMPLOYEES’ ROLES IN
     SERVICE DELIVERY
144
         Objectives for Chapter 11:
SM         Employees’ Roles in
             Service Delivery
 • Illustrate the critical importance of service
   employees in creating customer satisfaction and
   service quality
 • Demonstrate the challenges inherent in boundary-
   spanning roles
 • Provide examples of strategies for creating
   customer-oriented service delivery
 • Show how the strategies can support a service
   culture where providing excellent service is a way
   of life
145

SM               Service Employees

•   They are the service
•   They are the firm in the customer’s eyes
•   They are marketers
•   Importance is evident in
     – The Services Marketing Mix (People)
     – The Service-Profit Chain
     – The Services Triangle
146

SM            Service Employees

     • Who are they?
       – “boundary spanners”
     • What are these jobs like?
       – emotional labor
       – many sources of potential conflict
          •   person/role
          •   organization/client
          •   interclient
          •   quality/productivity
Figure 11-3         147
     Boundary Spanners Interact
SM       with Both Internal
      and External Constituents
            External Environment


            Internal Environment
148
                         Figure 11-4
SM       Sources of Conflict for
       Boundary-Spanning Workers

     • Person vs. Role

     • Organization vs. Client

     • Client vs. Client

     • Quality vs. Productivity
Figure 11-5                                 149
     Human Resource Strategies for Closing GAP 3
SM
                                          Hire for
                              r           Service
                           fo         Competencies         B
                                                        Pr e t
                        te t
                      pe es            and Service    E m e f e he
                    m B le                               pl rred
                  Co the op             Inclination        oy
                        Pe                                     er

         Str ard nd


                                                                     Te Inte kills
                                                                      Tr nica tive
          Re ure a


                                                                       ch rac
                                        Hire the


                                                                        ai n l
     Pr ervic g


                                                                            fo and
         ide e
                                      Right People
            on

             rs
             w
            as


                                                                             S


                                                                              r
         Me


       ov
       S


                                                       Develop
                                        Customer-


                                                                            Employees
                                                                             Empower
     Employees

     Customers


                    Retain the                         People to
                                         oriented
       Treat


                                                        Deliver
                      Best
         as


                                         Service        Service
                     People              Delivery       Quality
     Em th any’


                                                                          wo e
                                                                             rk
      Inc


                                                                        am ot
                                     Provide
        plo e


                                                                      Te rom
         Co Visio


          lud es in
            ye


                                  Needed Support
            mp n


                                                                        P
             e


                            De       Systems
                         Se v e l o
                    s


                                                                e
                                                             ur
                       or rvic p                          as nal
                          i
                      Int ente -
                                e
                                         Provide        Me ter e
                   Pr ern d                              In rvic y
                     oc                Supportive          Se alit
                        es al
                            se
                              s        Technology            Qu
                                           and
                                       Equipment
151

SM                  Service Culture


     “A culture where an appreciation for good service
     exists, and where giving good service to internal
     as well as ultimate, external customers, is
     considered a natural way of life and one of the
     most important norms by everyone in the
     organization.”
152

SM
      Chapter 12


     CUSTOMERS’ ROLES IN
     SERVICE DELIVERY
153
        Objectives for Chapter 12:
SM     Customers’ Roles in Service
                 Delivery
 • Illustrate the importance of customers in
   successful service delivery
 • Enumerate the variety of roles that service
   customers play
    • Productive resources
    • Contributors to quality and satisfaction
    • Competitors
 • Explain strategies for involving service customers
   effectively to increase both quality and
   productivity
154
               Importance of Other
SM             Customers in Service
                    Delivery

     • Other customers can detract from
       satisfaction
          • disruptive behaviors
          • excessive crowding
          • incompatible needs
     • Other customers can enhance satisfaction
          • mere presence
          • socialization/friendships
          • roles: assistants, teachers, supporters
155

SM        How Customers Widen Gap 3

•   Lack of understanding of their roles
•   Not being willing or able to perform their roles
•   No rewards for “good performance”
•   Interfering with other customers
•   Incompatible market segments
Figure 12-2   156

SM   Customer Roles in Service
            Delivery

     Productive Resources


     Contributors to
     Quality and
     Satisfaction


     Competitors
157

SM       Customers as Productive
               Resources

     • “partial employees”
       – contributing effort, time, or other resources to
         the production process
     • customer inputs can affect organization’s
       productivity
     • key issue:
       – should customers’ roles be expanded?
         reduced?
158
          Customers as Contributors
SM          to Service Quality and
                 Satisfaction
     • Customers can contribute to
       – their own satisfaction with the service
          • by performing their role effectively
          • by working with the service provider
       – the quality of the service they receive
          • by asking questions
          • by taking responsibility for their own satisfaction
          • by complaining when there is a service failure
159

SM        Customers as Competitors


     • customers may “compete” with the service provider
     • “internal exchange” vs. “external exchange”
     • internal/external decision often based on:
        – expertise
        – resources
        – time
        – economic rewards
        – psychic rewards
        – trust
        – control
160
                     Technology Spotlight:
 SM             Services Production Continuum


Customer Production              Joint Production              Firm Production


     1             2            3             4           5            6
         Gas Station Illustration
         1. Customer pumps gas and pays at the pump with automation
         2. Customer pumps gas and goes inside to pay attendant
         3. Customer pumps gas and attendant takes payment at the pump
         4. Attendant pumps gas and customer pays at the pump with automation
         5. Attendant pumps gas and customer goes inside to pay attendant
         6. Attendant pumps gas and attendant takes payment at the pump
Figure 12-3                   161

SM           Strategies for Enhancing
              Customer Participation


                    Effective
Define Customer
                   Customer         Recruit, Educate,
                  Participation       and Reward
      Jobs
                                       Customers


                    Manage the
                     Customer
                       Mix
162
           Strategies for Enhancing
SM
            Customer Participation

 1. Define customers’ jobs
      - helping himself
      - helping others
      - promoting the company

 2. Individual differences: not everyone wants
    to participate
163
          Strategies for Recruiting,
SM        Educating and Rewarding
                 Customers
1. Recruit the right customers
2. Educate and train customers to perform
   effectively
3. Reward customers for their contribution
4. Avoid negative outcomes of inappropriate
   customer participation


         Manage the Customer Mix
164

SM
     Chapter 14


     MANAGING DEMAND
     AND CAPACITY
165
              Objectives for Chapter 14:
SM             Managing Demand and
                      Capacity
     • Explain:
        • the underlying issue for capacity-constrained services
        • the implications of capacity constraints
        • the implications of different types of demand patterns
           on matching supply and demand
     • Lay out strategies for matching supply and demand
       through:
        • shifting demand to match capacity or
        • flexing capacity to meet demand
     • Demonstrate the benefits and risks of yield management
       strategies
     • Provide strategies for managing waiting lines
166
         Understanding Capacity
SM       Constraints and Demand
                Patterns
Capacity Constraints   Demand Patterns

 • Time, labor,         • Charting demand
   equipment and          patterns
   facilities           • Predictable cycles
 • Optimal versus       • Random demand
   maximal use of         fluctuations
   capacity             • Demand patterns by
                          market segment
167
                                   Figure 14-3

SM        Strategies for Shifting Demand
                 to Match Capacity

Demand Too High            Shift Demand      Demand Too Low
• Use signage to communicate         •   Use sales and advertising to
  busy days and times                    increase business from current
• Offer incentives to customers          market segments
  for usage during non-peak          •   Modify the service offering to
  times                                  appeal to new market segments
• Take care of loyal or regular      •   Offer discounts or price
  customers first                        reductions
• Advertise peak usage times and     •   Modify hours of operation
  benefits of non-peak use           •   Bring the service to the
• Charge full price for the              customer
  service--no discounts
Figure 14-4                       168
             Strategies for Flexing Capacity
SM
                        to Match Demand
Demand Too High             Flex Capacity    Demand Too Low
• Stretch time, labor, facilities
  and equipment
                                     •   Perform maintenance
                                         renovations
• Cross-train employees
                                     •   Schedule vacations
• Hire part-time employees
                                     •   Schedule employee training
• Request overtime work from
  employees
                                     •   Lay off employees

• Rent or share facilities
• Rent or share equipment
• Subcontract or outsource
  activities
Table 14-1                                                      169

      SM                        What is the Nature of Demand
                                    Relative to Supply?
                                                       Extent of demand fluctuations over time
                   Extent to which
                   supply is                                      Wide                                       Narrow
                   constrained
                   Peak demand can              1                                                                  2
                   usually be met  Electricity                                                Insurance
                   without a major Natural gas                                                Legal services
                   delay           Telephone                                                  Banking
                                   Hospital maternity unit                                    Laundry and dry cleaning
                                   Police and fire
                                   emergencies
                   Peak demand                                4                                              3
                   regularly exceeds              Accounting and tax                          Services similar to those in
                   capacity                       preparation                                 2 but which have
                                                  Passenger transportation                    insufficient capacity for
                                                  Hotels and motels                           their base level of business
                                                  Restaurants
                                                  Theaters

Source: Christopher H. Lovelock, “Classifying Services to Gain Strategic Marketing Insights,” Journal of Marketing, 47, 3 (Summer 1983): 17.
Table 14-2         170
                   What is the Constraint on
SM                        Capacity?
     Nature of the constraint   Type of service
     Time                       Legal
                                Consulting
                                Accounting
                                Medical
     Labor                      Law firm
                                Accounting firm
                                Consulting firm
                                Health clinic
     Equipment                  Delivery services
                                Telecommunication
                                Utilities
                                Health club
     Facilities                 Hotels
                                Restaurants
                                Hospitals
                                Airlines
                                Schools
                                Theaters
                                Churches
171

SM               Waiting Line Issues
                   and Strategies
     • unoccupied time feels longer
     • preprocess waits feel longer
     • anxiety makes waits seem longer
     • uncertain waits seem longer than finite waits
     • unexplained waits seem longer
     • unfair waits feel longer
     • longer waits are more acceptable for
       “valuable” services
     • solo waits feel longer
172

SM
     Part 5


     MANAGING SERVICE
     PROMISES
173

       SM
                           Provider GAP 4
                CUSTOMER


                COMPANY
                             Service Delivery               External
                                                        Communications
                                                GAP 4    to Customers


Part 5 Opener
174

SM
     Chapter 15

     INTEGRATED
     MARKETING
     COMMUNICATION
175
             Objectives for Chapter 15:
SM              Integrated Services
             Marketing Communications
 • Introduce the concept of Integrated Services
   Marketing Communication
 • Discuss the key reasons for service communication
   problems
 • Present four key ways to integrate marketing
   communication in service organizations
 • Present specific strategies for managing promises,
   managing customer expectations, educating
   customers, and managing internal communications
 • Provide perspective on the popular service objective
   of exceeding customer expectations
176
                                             Figure 15-1
SM             Communications and the
              Services Marketing Triangle
                                              Company

     Internal Marketing                                                            External Marketing
  Vertical Communications                                                          Communication
 Horizontal Communications                                                         Advertising
                                                                                   Sales Promotion
                                                                                   Public Relations
                                                                                   Direct Marketing


 Employees                        Interactive Marketing                                   Customers
                                  Personal Selling
                                 Customer Service Center
                                 Service Encounters
                                      Servicescapes
      Source: Parts of model adapted from work by Christian Gronroos and Phillip Kotler
Figure 15-3               177
                   Approaches for
SM         Integrating Services Marketing
                   Communication

                    Manage
                   Customer
                  Expectations


                       Goal:
      Manage         Delivery      Improve
      Service      greater than    Customer
     Promises       or equal to    Education
                     promises


                     Manage
                     Internal
                    Marketing
                  Communication
178
                                    Figure 15-4

 SM                   Approaches for
                 Managing Service Promises


    MANAGING SERVICE PROMISES

                                                              Goal:
    Create        Coordinate                   Offer        Delivery
   Effective                       Make
                    External     Realistic    Service     greater than
   Services      Communication               Guarantees    or equal to
Communications                   Promises
                                                            promises
Figure 15-8   179
             Approaches for
SM   Managing Customer Expectations
              Offer Choices


            Create Tiered-Value
                 Offerings

         Communicate Criteria for
          Service Effectiveness
                Negotiate
                Unrealistic
               Expectations


                    Goal:
                  Delivery
                greater than
                 or equal to
                  promises
180
                                  Figure 15-9

SM                     Approaches for
                Improving Customer Education


                                                                 Teach
                                                              Customers
                   Prepare       Confirm        Clarify        to Avoid
     Goal:                    Performance    Expectations
   Delivery       Customers                                      Peak
                    for the   to Standards   after the Sale    Demand
 greater than      Service
  or equal to                                                   Periods
                   Process                                        and
   promises
                                                              Seek Slow
                                                                Periods
181
                   Figure 15-10
SM        Approaches for Managing
     Internal Marketing Communications
                     Goal:
                   Delivery
                 greater than
                  or equal to
                   promises


                Create Effective
                    Vertical
                Communications

              Create Effective
                Horizontal
              Communications

                 Align Back
               Office Personnel
            w/ External Customers

                  Create
              Cross-Functional
                  Teams
182

SM
      Chapter 17


     THE FINANCIAL AND
     ECONOMIC IMPACT OF
     SERVICE QUALITY
183
           Objectives for Chapter 17:
SM        The Financial and Economic
               Impact of Service
 • Examine the direct effects of service on profits
 • Consider the impact of service on getting new
   customers
 • Evaluate the role of service in keeping customers
 • Examine the link between perceptions of service and
   purchase intentions
 • Emphasize the importance of selecting profitable
   customers
 • Discuss what is know about the key service drivers of
   overall service quality, customer retention and
   profitability
 • Discuss the balanced performance scorecard to focus
   on strategic measurement other than financials
184
                 Figure 17-1
SM   The Direct Relationship between
            Service and Profits


      Service
      Quality
                  ?            Profits
185
                   Figure 17-2
SM      Offensive Marketing Effects of
              Service on Profits


     Service
     Quality
                                           Profits
                                 Market
                                 Share

                             Reputation      Sales

                                   Price
                                 Premium
186
                          Figure 17-3

SM        Defensive Marketing Effects of
                Service on Profit


                                        Costs

                                   Volume of     Margins
Service       Customer
                                   Purchases

Quality       Retention               Price
                                    Premium

                                    Word of
                                    Mouth       Profits
187
                             Figure 17-5

SM               Perceptions of Service,
                       Behavioral
                  Intentions and Profits

                                           Costs

                                       Volume of    Margins
                                       Purchases
                       Customer
                       Retention         Price
          Behavioral                   Premium
Service   Intentions
                                       Word of
                                       Mouth       Profits

                                                    Sales
Figure 17-6                                   188

SM            The “80/20” Customer Pyramid

 Most Profitable
                                    What segment spends more with
  Customers                         us over time, costs less to maintain,
                       Best
                     Customers      spreads positive word of mouth?


                     Other
                   Customers               What segment costs us in
                                           time, effort and money yet
                                           does not provide the return
Least Profitable                           we want? What segment is
  Customers                                difficult to do business with?
189
                               Figure 17-7
SM         The Expanded Customer Pyramid

  Most Profitable
                                     What segment spends more with
   Customers        Platinum         us over time, costs less to maintain,
                                     spreads positive word of mouth?
                     Gold


                      Iron

                                             What segment costs us in
                     Lead                    time, effort and money yet
                                             does not provide the return
 Least Profitable                            we want? What segment is
                                             difficult to do business with?
   Customers
190
                                   Figure 17-8

 SM           The Key Drivers of Service Quality,
               Customer Retention, and Profits

Key Drivers   Service Encounters
               Service
              Encounter


               Service
              Encounter
                             Service   Behavioral   Customer
                             Quality   Intentions   Retention   Profits
               Service
              Encounter


               Service
              Encounter
Figure 17-9                               191
                         Sample Measurements for the
SM                          Balanced Scorecard
                                 Financial Measures

                                 Price Premium
                                 Volume Increases
                                 Value of Customer
                                    Referrals
      Customer
     Perspective
                                 Value of Cross Sales                 Operational
                                 Long-term Value of                   Perspective:
                                  Customer
Service Perceptions
                                                                Right first time (% hits)
Service Expectations
                                                                Right on time (% hits)
Perceived Value
                                                                Responsiveness (% on
Behavioral Intentions:               Innovation and                time)
 % Loyalty                        Learning Perspective          Transaction time (hours,
 % Intent to Switch                                                days)
 # Customer                      Number of new products         Throughput time
   Referrals                     Return on innovation           Reduction in waste
 # Cross Sales                   Employee skills                Process quality
 # of Defections                 Time to market
                                 Time spent talking to
                                  customers


                 Adapted from Kaplan and Norton
Figure 17-10                    192

SM        Service Quality Spells Profits
                                   Costs

          Defensive              Volume of     Margins
          Marketing              Purchases

                                    Price
                                  Premium
Service          Customer
Quality          Retention
                                  Word of
                                  Mouth       Profits
                                   Market
                                   Share
                                                Sales
     Offensive
     Marketing                   Reputation


                                    Price
                                  Premium
193

SM

Services marketing

  • 1.
    1 SM Services Marketing
  • 2.
    2 SM Chapter 1 INTRODUCTION TO SERVICES
  • 3.
    3 Objectives for Chapter 1: SM Introduction to Services • Explain what services are and identify service trends • Explain the need for special services marketing concepts and practices • Outline the basic differences between goods and services and the resulting challenges for service businesses • Introduce the service marketing triangle • Introduce the expanded services marketing mix • Introduce the gaps model of service quality
  • 4.
    4 SM Introduction • Services are deeds,processes and performance • Intangible, but may have a tangible component • Generally produced and consumed at the same time • Need to distinguish between SERVICE and CUSTOMER SERVICE
  • 5.
    5 SM Challenges for Services • Defining and improving quality • Communicating and testing new services • Communicating and maintaining a consistent image • Motivating and sustaining employee commitment • Coordinating marketing, operations and human resource efforts • Setting prices • Standardization versus personalization
  • 6.
    6 Examples of Service SM Industries • Health Care – hospital, medical practice, dentistry, eye care • Professional Services – accounting, legal, architectural • Financial Services – banking, investment advising, insurance • Hospitality – restaurant, hotel/motel, bed & breakfast, – ski resort, rafting • Travel – airlines, travel agencies, theme park • Others: – hair styling, pest control, plumbing, lawn maintenance, counseling services, health club
  • 7.
    7 Figure 1-1 SM Tangibility Spectrum Salt  Soft Drinks  Detergents  Automobiles  Cosmetics Fast-food  Outlets  Intangible Dominant Tangible  Dominant Fast-food Outlets  Advertising Agencies  Airlines  Investment Management  Consulting  Teaching
  • 8.
    Figure 1-2 8 SM Percent of U.S. Labor Force by Industry 80 70 Percent of GDP 60 50 40 30 20 10 0  Services 1929 1948 1969 1977 1984 1996  Manufacturing  Mining & Agriculture Yea r Source: Survey of Current Business, April 1998, Table B.8, July 1988, Table 6.6B, and July 1992, Table 6.4C; Eli Ginzberg and George J. Vojta, “The Service Sector of the U.S. Economy,” Scientific American, 244,3 (1981): 31-39.
  • 9.
    Figure 1-3 9 SM Percent of U.S. Gross Domestic Product by Industry 80 Percent of GDP 70 60 50 40 30 20 10 0  Services 1948 1959 1967 1977 1987 1996  Manufacturing Year  Mining & Agriculture Source: Survey of Current Business, August 1996, Table 11, April 1998, Table B.3; Eli Ginzberg and George J. Vojta, “The Service Sector of the U.S. Economy,” Scientific American, 244,3 (1981): 31-39.
  • 10.
    10 Differences Between SM Goods and Services Intangibility Heterogeneity Simultaneous Production Perishability and Consumption
  • 11.
    11 SM Implications of Intangibility  Services cannot be inventoried  Services cannot be patented  Services cannot be readily displayed or communicated  Pricing is difficult
  • 12.
    12 SM Implications of Heterogeneity Service delivery and customer satisfaction depend on employee actions Service quality depends on many uncontrollable factors There is no sure knowledge that the service delivered matches what was planned and promoted
  • 13.
    13 Implications of Simultaneous SM Production and Consumption Customers participate in and affect the transaction Customers affect each other Employees affect the service outcome Decentralization may be essential Mass production is difficult
  • 14.
    14 SM Implications of Perishability  It is difficult to synchronize supply and demand with services  Services cannot be returned or resold
  • 15.
    15 SM Table 1-2 Services are Different Goods Services Resulting Implications Tangible Intangible Services cannot be inventoried. Services cannot be patented. Services cannot be readily displayed or communicated. Pricing is difficult. Standardized Heterogeneous Service delivery and customer satisfaction depend on employee actions. Service quality depends on many uncontrollable factors. There is no sure knowledge that the service delivered matches what was planned and promoted. Production Simultaneous Customers participate in and affect the transaction. separate from production and Customers affect each other. consumption consumption Employees affect the service outcome. Decentralization may be essential. Mass production is difficult. Nonperishable Perishable It is difficult to synchronize supply and demand with services. Services cannot be returned or resold. Source: Adapted from Valarie A. Zeithaml, A. Parasuraman, and Leonard L. Berry, “Problems and Strategies in Services Marketing,” Journal of Marketing 49 (Spring 1985): 33-46.
  • 16.
    16 Figure 1-5 SM The Services Marketing Triangle Company (Management) Internal External Marketing Marketing “enabling the “setting the promise” promise” Employees Interactive Marketing Customers “delivering the promise” Source: Adapted from Mary Jo Bitner, Christian Gronroos, and Philip Kotler
  • 17.
    17 Ways to Use the SM Services Marketing Triangle Overall Strategic Specific Service Assessment Implementation • How is the service • What is being promoted organization doing and by whom? on all three sides of • How will it be delivered the triangle? and by whom? • Where are the • Are the supporting weaknesses? systems in place to deliver the promised • What are the service? strengths?
  • 18.
    18 Figure 1-6 SM The Services Triangle and Technology Company Technology Providers Customers Source: Adapted from A. Parasuraman
  • 19.
    19 SM Services Marketing Mix: 7 Ps for Services • Traditional Marketing Mix • Expanded Mix for Services: 7 Ps • Building Customer Relationships Through People, Processes, and Physical Evidence • Ways to Use the 7 Ps
  • 20.
    20 SM Traditional Marketing Mix • All elements within the control of the firm that communicate the firm’s capabilities and image to customers or that influence customer satisfaction with the firm’s product and services:  Product  Price  Place  Promotion
  • 21.
    21 SM Expanded Mix for Services -- the 7 Ps • Product • Price • Place • Promotion • People • Process • Physical Evidence
  • 22.
    22 Table 1-3 SM Expanded Marketing Mix for Services PRODUCT PLACE PROMOTION PRICE Physical good Channel type Promotion Flexibility features blend Quality level Exposure Salespeople Price level Accessories Intermediaries Advertising Terms Packaging Outlet location Sales Differentiation promotion Warranties Transportation Publicity Allowances Product lines Storage Branding
  • 23.
    23 Table 1-3 (Continued) SM Expanded Marketing Mix for Services PEOPLE PHYSICAL PROCESS EVIDENCE Employees Facility design Flow of activities Customers Equipment Number of steps Communicating Signage Level of customer culture and values involvement Employee research Employee dress Other tangibles
  • 24.
    24 SM Ways to Use the 7 Ps Overall Strategic Specific Service Assessment Implementation • How effective is a firm’s • Who is the customer? services marketing mix? • What is the service? • Is the mix well-aligned • How effectively does the services marketing mix for a with overall vision and service communicate its strategy? benefits and quality? • What are the strengths and • What weaknesses in terms of the changes/improvements are 7 Ps? needed?
  • 25.
    25 Services Marketing Triangle SM Applications Exercise • Focus on a service organization. In the context you are focusing on, who occupies each of the three points of the triangle? • How is each type of marketing being carried out currently? • Are the three sides of the triangle well aligned? • Are there specific challenges or barriers in any of the three areas?
  • 26.
    26 SM Part 1 FOCUS ON THE CUSTOMER
  • 27.
    27 SM Gaps Model of Service Quality CUSTOMER Expected Service Customer Gap Perceived Service External COMPANY Service Delivery Communications GAP 4 to Customers GAP 1 GAP 3 Customer-Driven Service Designs and Standards GAP 2 Company Perceptions of Consumer Expectations Part 1 Opener
  • 28.
    28 Gaps Model of Service SM Quality • Customer Gap: • difference between expectations and perceptions • Provider Gap 1: • not knowing what customers expect • Provider Gap 2: • not having the right service designs and standards • Provider Gap 3: • not delivering to service standards • Provider Gap 4: Part 1 Opener • not matching performance to promises
  • 29.
    29 SM The Customer Gap Expected Service GAP Perceived Service Part 1 Opener
  • 30.
    30 SM Chapter 2 CONSUMER BEHAVIOR IN SERVICES
  • 31.
    31 Objectives for Chapter 2: SM Consumer Behavior in Services • Overview the generic differences in consumer behavior between services and goods • Introduce the aspects of consumer behavior that a marketer must understand in five categories of consumer behavior: • Information search • Evaluation of service alternatives • Service purchase and consumption • Postpurchase evaluation • Role of culture
  • 32.
    32 SM Consumer Evaluation Processes for Services • Search Qualities – attributes a consumer can determine prior to purchase of a product • Experience Qualities – attributes a consumer can determine after purchase (or during consumption) of a product • Credence Qualities – characteristics that may be impossible to evaluate even after purchase and consumption
  • 33.
    33 Figure 2-1 SM Continuum of Evaluation for Different Types of Products Most Most Goods Services Easy to evaluate Difficult to evaluate Clothing Jewelry Furniture Houses Automobiles Restaurant meals Vacations Haircuts Child care Television repair Legal services Root canals Auto repair Medical diagnosis { { High in search qualities High in experience High in credence qualities qualities {
  • 34.
    Figure 2-2 34 Categories in Consumer SM Decision-Making and Evaluation of Services Information Evaluation of Search Alternatives  Use of personal sources  Evoked set  Perceived risk  Emotion and mood Purchase and Post-Purchase Consumption Evaluation  Service provision as  Attribution of dissatisfaction drama  Service roles and scripts  Innovation diffusion  Compatibility of  Brand loyalty customers
  • 35.
    35 Figure 2-3 SM Categories in Consumer Decision- Making and Evaluation of Services Information Evaluation of Search Alternatives  Use of personal sources  Evoked set  Perceived risk  Emotion and mood Culture  Values and attitudes  Manners and customs  Material culture  Aesthetics  Educational and social institutions Purchase and Post-Purchase Consumption Evaluation  Service provision as  Attribution of dissatisfaction drama  Service roles and scripts  Innovation diffusion  Compatibility of  Brand loyalty customers
  • 36.
    36 SM Information search • In buying services consumers rely more on personal sources. WHY? Refer p32 • Personal influence becomes pivotal as product complexity increases • Word of mouth important in delivery of services • With service most evaluation follows purchase
  • 37.
    37 SM Perceived Risk • More risk would appear to be involved with purchase of services (no guarantees) • Many services so specialised and difficult to evaluate (How do you know whether the plumber has done a good job?) • Therefore a firm needs to develop strategies to reduce this risk, e.g, training of employees, standardisation of offerings
  • 38.
    38 SM Evoked Set • The evoked set of alternatives likely to be smaller with services than goods • If you would go to a shopping centre you may only find one dry cleaner or “single brand” • It is also difficult to obtain adequate prepurchase information about service • The Internet may widen this potential • Consumer may choose to do it themselves, e.g. garden services
  • 39.
    39 SM Emotion and Mood • Emotion and mood are feeling states that influence people’s perception and evaluation of their experiences • Moods are transient • Emotions more intense, stable and pervasive • May have a negative or positive influence
  • 40.
    40 SM Service Provision as Drama • Need to maintain a desirable impression • Service “actors” need to perform certain routines • Physical setting important, smell, music, use of space, temperature, cleanliness, etc.
  • 41.
    41 Global Feature: SM Differences in the Service Experience in the U.S. and Japan  Authenticity  Caring  Control Courtesy  Formality  Friendliness  Personalization  Promptness
  • 42.
    42 SM Chapter 3 CUSTOMER EXPECTATIONS OF SERVICES
  • 43.
    43 Objectives for Chapter 3: SM Customer Expectations of Service • Recognize that customers hold different types of expectations for service performance • Discuss controllable and uncontrollable sources of customer expectations • Distinguish between customers’ global expectations of their relationships and their expectations of the service encounter • Acknowledge that expectations are similar for many different types of customers • Delineate the most important current issues surrounding customer expectations
  • 44.
    44 SM DEFINITIONS • Customers have different expectations re services – or expected service • Desired service – customer hopes to receive • Adequate service – the level of service the customer may accept • DO YOUR EXPECTATIONS DIFFER RE SPUR and CAPTAIN DOREGO?
  • 45.
    45 Figure 3-1 SM Dual Customer Expectation Levels (Two levels of expectations) Desired Service Zone of Tolerance Adequate Service
  • 46.
    46 SM Figure 3-2 The Zone of Tolerance Desired Service Zone of Tolerance Adequate Service
  • 47.
    Figure 3-3 47 SM Zones of Tolerance VARY for Different Service Dimensions Desired Service Level of Zone of Desired Expectation Desired Service Tolerance Service Adequate Service Zone of Tolerance Adequate Adequate Service Service Most Important Factors Least Important Factors Source: Berry, Parasuraman, and Zeithaml (1993)
  • 48.
    Figure 3-4 48 Zones of Tolerance VARY for SM First-Time and Recovery Service First-Time Service Outcome Process Recovery Service Outcome Process LOW HIGH Expectations Source: Parasuraman, Berry and Zeithaml (1991)
  • 49.
    Figure 3-5 49 SM Factors that Influence Desired Service Enduring Service Intensifiers Desired Service Personal Needs Zone of Tolerance Adequate Service
  • 50.
    50 SM • Personal needsinclude physical, social, psychological categories • Enduring service intensifiers are individual, stable factors that lead to heightened sensitivity to service This can further divided into Derived Service Expectations and Personal service Philosophies
  • 51.
    51 Figure 3-6 SM Factors that Influence Adequate Service Transitory Service Intensifiers Desired Perceived Service Service Alternatives Zone of Tolerance Self-Perceived Service Role Adequate Service Situational Factors
  • 52.
    52 SM • Transitory serviceintensifiers – temporary – a computer breakdown will be less tolerated at financial year-ends • Perceived service alternatives • Perceived service role of customer • Situational factors
  • 53.
    Figure 3-7 53 Factors that Influence SM Desired and Predicted Service Explicit Service Promises Implicit Service Promises Desired Word-of-Mouth Service Zone Past Experience of Tolerance Adequate Predicted Service Service
  • 54.
    54 SM Chapter 4 CUSTOMER PERCEPTIONS OF SERVICE
  • 55.
    55 Objectives for Chapter 4: SM Customer Perceptions of Service • Provide you with definitions and understanding of customer satisfaction and service quality • Show that service encounters or the “moments of truth” are the building blocks of customer perceptions • Highlight strategies for managing customer perceptions of service
  • 56.
    Figure 4-1 56 Customer Perceptions of SM Service Quality and Customer Satisfaction Reliability Situational Factors Responsiveness Service Quality Assurance Customer Empathy Satisfaction Product Quality Tangibles Personal Price Factors
  • 57.
    57 Factors Influencing SM Customer Satisfaction • Product/service quality • Product/service attributes or features • Consumer Emotions • Attributions for product/service success or failure • Equity or fairness evaluations
  • 58.
    58 Outcomes of SM Customer Satisfaction • Increased customer retention • Positive word-of-mouth communications • Increased revenues
  • 59.
    Figure 4-3 59 Relationship between Customer SM Satisfaction and Loyalty in Competitive Industries 100% Loyalty (retention) 80% 60% 40% 20% 0% Very Dissatisfied Neither Satisfied Very dissatisfied satisfied nor satisfied dissatisfied Satisfaction measure Source: James L. Heskett, W. Earl Sasser, Jr., and Leonard A. Schlesinger, The Service Profit Chain, (New York, NY: The Free Press, 1997), p. 83.
  • 60.
    60 SM Service Quality • The customer’s judgment of overall excellence of the service provided in relation to the quality that was expected. • Process and outcome quality are both important.
  • 61.
    61 SM The Five Dimensions of Service Quality Reliability Ability to perform the promised service dependably and accurately. Knowledge and courtesy of Assurance employees and their ability to convey trust and confidence. Tangibles Physical facilities, equipment, and appearance of personnel. Empathy Caring, individualized attention the firm provides its customers. Responsiveness Willingness to help customers and provide prompt service.
  • 62.
    62 SM Exercise to Identify Service Attributes In groups of five, choose a services industry and spend 10 minutes brainstorming specific requirements of customers in each of the five service quality dimensions. Be certain the requirements reflect the customer’s point of view. Reliability: Assurance: Tangibles: Empathy: Responsiveness:
  • 63.
    63 SERVQUAL Attributes SM ASSURANCE Employees who instill confidence in customers Making customers feel safe in their transactions RELIABILITY Employees who are consistently courteous Employees who have the knowledge to Providing service as promised answer customer questions Dependability in handling customers’ service problems EMPATHY Performing services right the first time Giving customers individual attention Providing services at the promised time Employees who deal with customers in a Maintaining error-free records caring fashion Having the customer’s best interest at heart RESPONSIVENESS Employees who understand the needs of their customers Keeping customers informed as to Convenient business hours when services will be performed TANGIBLES Prompt service to customers Modern equipment Willingness to help customers Visually appealing facilities Readiness to respond to customers’ Employees who have a requests neat, professional appearance Visually appealing materials associated with the service
  • 64.
    64 SM The Service Encounter • is the “moment of truth” • occurs any time the customer interacts with the firm • can potentially be critical in determining customer satisfaction and loyalty • types of encounters: – remote encounters – phone encounters – face-to-face encounters • is an opportunity to: – build trust – reinforce quality – build brand identity – increase loyalty
  • 65.
    65 Figure 4-4 SM A Service Encounter Cascade for a Hotel Visit Check-In Check-In Bellboy Takes to Bellboy Takes to Room Room Restaurant Restaurant Meal Meal Request Wake-Up Request Wake-Up Call Call Checkout Checkout
  • 66.
    Figure 4-5 66 A Service Encounter SM Cascade for an Industrial Purchase Sales Call Sales Call Delivery and Installation Delivery and Installation Servicing Servicing Ordering Supplies Ordering Supplies Billing Billing
  • 67.
    67 Critical Service Encounters SM Research • GOAL - understanding actual events and behaviors that cause customer dis/satisfaction in service encounters • METHOD - Critical Incident Technique • DATA - stories from customers and employees • OUTPUT - identification of themes underlying satisfaction and dissatisfaction with service encounters
  • 68.
    68 Sample Questions for Critical SM Incidents Technique Study • Think of a time when, as a customer, you had a particularly satisfying (dissatisfying) interaction with an employee of . • When did the incident happen? • What specific circumstances led up to this situation? • Exactly what was said and done? • What resulted that made you feel the interaction was satisfying (dissatisfying)?
  • 69.
    69 SM Common Themes in Critical Service Encounters Research Recovery: Adaptability: Employee Response Employee Response to Service Delivery to Customer Needs System Failure and Requests Coping: Spontaneity: Employee Response Unprompted and to Problem Customers Unsolicited Employee Actions and Attitudes
  • 70.
    70 SM Recovery DO DON’T • Acknowledge • Ignore customer problem • Blame customer • Explain causes • Leave customer to • Apologize fend for him/herself • Compensate/upgrade • Downgrade • Lay out options • Act as if nothing is • Take responsibility wrong
  • 71.
    71 SM Adaptability DO DON’T • Recognize the • Promise, then fail to seriousness of the need follow through • Acknowledge • Ignore • Anticipate • Show unwillingness to • Attempt to try accommodate • Embarrass the customer • Explain rules/policies • Laugh at the customer • Take responsibility • Avoid responsibility • Exert effort to accommodate
  • 72.
    72 SM Spontaneity DO DON’T • Take time • Exhibit impatience • Be attentive • Ignore • Anticipate needs • Yell/laugh/swear • Listen • Provide information • Steal from or cheat a (even if not asked) customer • Treat customers fairly • Discriminate • Show empathy • Treat impersonally • Acknowledge by name
  • 73.
    73 SM Coping DO DON’T • Listen • Take customer’s • Try to accommodate dissatisfaction • personally Explain • Let customer’s • Let go of the customer dissatisfaction affect others
  • 74.
    74 Figure 4-6 SM Evidence of Service from the Customer’s Point of View  Contact employees  Customer  Operational flow of him/herself activities  Other customers People  Steps in process  Flexibility vs. standard  Technology vs. Physical  Tangible human Process Evidence communication  Servicescape  Guarantees  Technology
  • 75.
    75 SM Part 2 LISTENING TO CUSTOMER REQUIREMENTS
  • 76.
    76 SM Provider GAP 1 CUSTOMER Expected Service GAP 1 Company COMPANY Perceptions of Consumer Expectations Part 2 Opener
  • 77.
    77 SM Chapter 5 UNDERSTANDING CUSTOMER EXPECTATIONS AND PERCEPTIONS THROUGH MARKETING RESEARCH
  • 78.
    78 Objectives for Chapter 5: SM Understanding Customer Expectations and Perceptions through Marketing Research • Present the types of and guidelines for marketing research in services • Show the ways that marketing research information can and should be used for services • Describe the strategies by which companies can facilitate interaction and communication between management and customers • Present ways that companies can and do facilitate interaction between contact people and management
  • 79.
    79 SM Common Research Objectives for Services • To identify dissatisfied customers • To discover customer requirements or expectations • To monitor and track service performance • To assess overall company performance compared to competition • To assess gaps between customer expectations and perceptions • To gauge effectiveness of changes in service • To appraise service performance of individuals and teams for rewards • To determine expectations for a new service • To monitor changing expectations in an industry • To forecast future expectations
  • 80.
    80 Figure 5-1 SM Criteria for An Effective Services Research Program Includes es Quantitative lud ive Inc litat h Research Includes a c Qu esear Perceptions R and Expectations Occurs of Customers with Appropriate Research Includes Frequency Measures Objectives of Loyalty or Behavioral Measures Intentions Priorities st or s Co Importance lance ue of Includes Ba Val ion Statistical and ormat Validity Inf When Necessary
  • 81.
    81 SM Portfolio of Services Research Research Objective Type of Research Identify dissatisfied customers to attempt recovery; identify most common categories of service failure Customer Complaint for remedial action Solicitation Assess company’s service performance compared to competitors; identify service-improvement priorities; track service improvement over time “Relationship” Surveys Obtain customer feedback while service experience is still fresh; act on feedback quickly if negative patterns develop Post-Transaction Surveys Use as input for quantitative surveys; provide a forum for customers to suggest service-improvement ideas Customer Focus Groups Measure individual employee service behaviors for use in coaching, training, performance evaluation, recognition and rewards; identify systemic strengths and weaknesses in “Mystery Shopping” of service Service Providers Measure internal service quality; identify employee- perceived obstacles to improve service; track employee morale and attitudes Employee Surveys Determine the reasons why customers defect To forecast future expectations of customers Lost Customer Research To develop and test new service ideas Future Expectations Research
  • 82.
    82 Stages in the Research SM Process • Stage 1 : Define Problem • Stage 2 : Develop Measurement Strategy • Stage 3 : Implement Research Program • Stage 4 : Collect and Tabulate Data • Stage 5 : Interpret and Analyze Findings • Stage 6 : Report Findings
  • 83.
    83 Figure 5-5 SM Service Quality Perceptions Relative to Zones of Tolerance by Dimensions 9 8 7 O O O O O 6 5 4 3 2 1 0 Reliability Responsiveness Assurance Empathy Tangibles Retail Chain Zone of Tolerance O S.Q. Perception
  • 84.
    84 Service Quality Perceptions SM Relative to Zones of Tolerance by Dimensions 10 8 O O O O O 6 4 2 0 Reliability Responsiveness Assurance Empathy Tangibles Computer Zone of Tolerance O S.Q. Perception Manufacturer
  • 85.
    85 Figure 5-6 SM Importance/Performance Matrix HIGH High   Leverage Attributes to Improve Attributes to Maintain  Importance     Low   Leverage  Attributes to Maintain Attributes to De-emphasize LOW HIGH Performance
  • 86.
    86 SM Chapter 6 BUILDING CUSTOMER RELATIONSHIPS
  • 87.
    87 Objectives for Chapter 6: SM Building Customer Relationships • Explain relationship marketing, its goals, and the benefits of long-term relationships for firms and customers • Explain why and how to estimate customer lifetime value • Specify the foundations for successful relationship marketing--quality core services and careful market segmentation • Provide you with examples of successful customer retention strategies • Introduce the idea that “the customer isn’t always right”
  • 88.
    88 SM Relationship Marketing • is a philosophy of doing business that focuses on keeping and improving current customers • does not necessarily emphasize acquiring new customers • is usually cheaper (for the firm)--to keep a current customer costs less than to attract a new one • goal = to build and maintain a base of committed customers who are profitable for the organization • thus, the focus is on the attraction, retention, and enhancement of customer relationships
  • 89.
    89 SM Lifetime Value of a Customer • Assumptions • Income – Expected Customer Lifetime – Average Revenue (month/year) – Other Customers convinced via WOM – Employee Loyalty?? • Expenses – Costs of Serving Customer Increase??
  • 90.
    90 SM A Loyal Customer is One Who... • Shows Behavioral Commitment – buys from only one supplier, even though other options exist – increasingly buys more and more from a particular supplier – provides constructive feedback/suggestions • Exhibits Psychological Commitment – wouldn’t consider terminating the relationship-- psychological commitment – has a positive attitude about the supplier – says good things about the supplier
  • 91.
    91 SM Customer Loyalty Exercise • Think of a service provider you are loyal to. • What do you do (your behaviors, actions, feelings) that indicates you are loyal? • Why are you loyal to this provider?
  • 92.
    92 Benefits to the Organization SM of Customer Loyalty • loyal customers tend to spend more with the organization over time • on average costs of relationship maintenance are lower than new customer costs • employee retention is more likely with a stable customer base • lifetime value of a customer can be very high
  • 93.
    93 SM Benefits to the Customer • inherent benefits in getting good value • economic, social, and continuity benefits – contribution to sense of well-being and quality of life and other psychological benefits – avoidance of change – simplified decision making – social support and friendships – special deals
  • 94.
    94 “The Customer Isn’t Always SM Right” • Not all customers are good relationship customers: – wrong segment – not profitable in the long term – difficult customers
  • 95.
    95 Strategies for Building SM Relationships • Foundations: – Excellent Quality/Value – Careful Segmentation • Bonding Strategies: – Financial Bonds – Social & Psychological Bonds – Structural Bonds – Customization Bonds • Relationship Strategies Wheel
  • 96.
    96 Figure 6-1 SM Customer Goals of Relationship Marketing Enhancing Retaining Satisfying Getting
  • 97.
    Figure 6-3 97 SM Underlying Logic of Customer Retention Benefits to the Organization Customer Satisfaction Customer Retention & Quality Increased Profits Service Employee Loyalty
  • 98.
    98 Figure 6-5 SM Steps in Market Segmentation and Targeting for Services STEP 1: STEP 2: STEP 3: STEP4: STEP 5: Identify Develop Develop Select the Ensure that Bases for Profiles of Measures Target Segments Segmenting Resulting of Segment Segments Are the Market Segments Attractive- Compatible ness
  • 99.
    Figure 6-6 99 SM Levels of Retention Strategies Stable Volume and Pricing Frequency Bundling and Rewards Cross Selling Integrated I. Financial Continuous Information Bonds Relationships Systems IV. Excellent Quality II. Joint Structural Personal Investments and Social Relationships Bonds Value Bonds Shared Social Bonds Processes III. Customization Among and Bonds Customers Equipment Anticipation Customer / Innovation Intimacy Mass Customization
  • 100.
    100 SM Chapter 7 SERVICE RECOVERY
  • 101.
    101 Objectives for Chapter 7: SM Service Recovery • Illustrate the importance of recovery from service failures in building loyalty • Discuss the nature of consumer complaints and why people do and do not complain • Provide evidence of what customers expect and the kind of responses they want when they complain • Provide strategies for effective service recovery • Discuss service guarantees
  • 102.
    102 Figure 7-1 SM Unhappy Customers’ Repurchase Intentions Unhappy Customers Who Don’t Complain 9% Unhappy Customers Who Do Complain 37% 19% Complaints Not Resolved 46% 54% Complaints Resolved 70% Complaints Resolved Quickly 82% 95% Percent of Customers Who Will Buy Again Minor complaints ($1-$5 losses) Major complaints (over $100 losses) Source: Adapted from data reported by the Technical Assistance Research Program.
  • 103.
    Figure 7-3 103 SM Customer Response Following Service Failure Service Failure Take Action Do Nothing Switch Providers Stay with Provider Complain to Complain to Complain to Provider Family & Friends Third Party Switch Providers Stay with Provider
  • 104.
    104 Figure 7-5 SM Service Recovery Strategies We En lcom e co ic ura e an rv ge d Se Co e m th pla fe i n ts Sa il Fa Act Quickly Service Learn from Lost Custom Recovery Strategies ers rl y Fai Le s er Re arn f om co rom t ve C us ry Ex e at pe Tr ri en ce s
  • 105.
    Pricing 105 • • High Price Price Increases Figure 7-6 SM Causes Behind Service • Unfair Pricing • Deceptive Pricing Inconvenience • Location/Hours • Wait for Appointment • Wait for Service Switching Core Service Failure • Service Mistakes • Billing Errors • Service Catastrophe Service Encounter Failures Service • Uncaring • Impolite • Unresponsive • Unknowledgeable Switching Response to Service Failure • Negative Response Behavior • No Response • Reluctant Response Competition • Found Better Service Ethical Problems • Cheat • Hard Sell • Unsafe • Conflict of Interest Involuntary Switching • Customer Moved Source: Sue Keaveney • Provider Closed
  • 106.
    106 SM Service Guarantees • guarantee = an assurance of the fulfillment of a condition (Webster’s Dictionary) • for products, guarantee often done in the form of a warranty • services are often not guaranteed – cannot return the service – service experience is intangible –(so what do you guarantee?)
  • 107.
    107 Table 7-7 SM Characteristics of an Effective Service Guarantee Unconditional • The guarantee should make its promise unconditionally - no strings attached. Meaningful • It should guarantee elements of the service that are important to the customer. • The payout should cover fully the customer's dissatisfaction. Easy to Understand and Communicate • For customers - they need to understand what to expect. • For employees - they need to understand what to do. Easy to Invoke and Collect • There should not be a lot of hoops or red tape in the way of accessing or collecting on the guarantee. Source: Christopher W.L. Hart, “The Power of Unconditional Guarantees,” Harvard Business Review, July-August, 1988, pp. 54-62.
  • 108.
    108 Why a Good Guarantee SM Works • forces company to focus on customers • sets clear standards • generates feedback • forces company to understand why it failed • builds “marketing muscle”
  • 109.
    109 SM Service Guarantees • Does everyone need a guarantee? • Reasons companies do NOT offer guarantees: – guarantee would be at odds with company’s image – too many uncontrollable external variables – fears of cheating by customers – costs of the guarantee are too high
  • 110.
    110 SM Service Guarantees • service guarantees work for companies who are already customer-focused • effective guarantees can be BIG deals - they put the company at risk in the eyes of the customer • customers should be involved in the design of service guarantees • the guarantee should be so stunning that it comes as a surprise -- a WOW!! factor • “it’s the icing on the cake, not the cake”
  • 111.
    111 SM Part 3 ALIGNING STRATEGY, SERVICE DESIGN AND STANDARDS
  • 112.
    112 SM Provider GAP 2 CUSTOMER COMPANY Customer-Driven Service Designs and Standards GAP 2 Company Perceptions of Consumer Expectations Part 3 Opener
  • 113.
    113 SM Chapter 8 SERVICE DEVELOPMENT AND DESIGN
  • 114.
    Objectives for Chapter8: 114 SM Service Development and Design • Describe the challenges inherent in service design • Present steps in the new service development process • Show the value of service blueprinting and quality function deployment (QFD) in new service design and service improvement • Present lessons learned in choosing and implementing high-performance service innovations
  • 115.
    Figure 8-1 115 SM Risks of Relying on Words Alone to Describe Services  Oversimplification  Incompleteness  Subjectivity  Biased Interpretation
  • 116.
    Figure 8-2 116 New Service Development Process SM  Business Strategy Development or Review  New Service Strategy Development Front End  Idea Generation Planning Screen ideas against new service strategy  Concept Development and Evaluation Test concept with customers and employees  Business Analysis Test for profitability and feasibility  Service Development and Testing Conduct service prototype test  Market Testing Implementation Test service and other marketing-mix elements  Commercialization  Postintroduction Evaluation Source: Booz-Allen & Hamilton, 1982; Bowers, 1985; Cooper, 1993; Khurana & Rosenthal 1997.
  • 117.
    Figure 8-3 117 SM New Service Strategy Matrix for Identifying Growth Opportunities Markets Offerings Current Customers New Customers Existing SHARE BUILDING MARKET Services DEVELOPMENT New Services SERVICE DIVERSIFICATION DEVELOPMENT
  • 118.
    Figure 8-4 Service Mapping/Blueprinting Atool for simultaneously depicting the service process, the points of customer contact, and the evidence of service from the customer’s point of view. Process Service Points of Contact Mappin g Evidence
  • 119.
    119 SM Service Blueprint Components CUSTOMER ACTIONS line of interaction “ONSTAGE” CONTACT EMPLOYEE ACTIONS line of visibility “BACKSTAGE” CONTACT EMPLOYEE ACTIONS line of internal interaction SUPPORT PROCESSES
  • 120.
    120 Express Mail Delivery Service SM Truck Packaging Truck Packaging Forms Forms EVIDENCE CONTACT PERSON CUSTOME PHYSICAL Hand-held Hand-held Computer Computer Uniform Uniform Customer Customer Receive Calls Gives Package Package (Back Stage) (On Stage) R Driver Picks Deliver Up Pkg. Package Customer Service Order Airport Fly to Dispatch Unload Load Driver Receives Sort Fly to & Loads Center & On Destinatio Sort Truck SUPPORT Load on PROCESS Airplane n Sort Packages
  • 121.
    121 SM Overnight Hotel Stay Bill EVIDENCE CUSTOMER PHYSICAL Desk Hotel Cart for Desk Elevators Cart for Room Menu Delivery Food Lobby Exterior Bags Registration Hallways Bags Amenities Tray Hotel Parking Papers Room Bath Food Exterior Lobby Appearance Parking Key Arrive Give Bags Call Check out Go to Receive Sleep Receive at to Check in Room Eat and Room Bags Shower Food Hotel Bellperson Service Leave SUPPORT PROCESS (Back Stage) (On Stage) CONTACT PERSON Greet and Process Deliver Deliver Process Take Registration Bags Food Check Out Bags Take Take Bags Food to Room Order Registration Prepare Registration System Food System
  • 122.
    122 SM Figure 8-8 Building a Service Blueprint Step 11 Step Step 22 Step Step 33 Step Step 44 Step Step 55 Step Step 66 Step Identify the Identify the Map the Map contact Map contact Link customer Add Add Identify the Identify the Map the Link customer process to customer or process from employee employee and contact evidence of evidence of process to customer or process from and contact be blue- customer the actions, actions, person service at service at be blue- customer the person printed. segment. customer’s onstage and onstage and activities to each each printed. segment. customer’s activities to point of view. back-stage. back-stage. needed customer customer point of view. needed support action step. action step. support functions. functions.
  • 123.
    123 Application of Service SM Blueprints • New Service Development • concept development • market testing • Supporting a “Zero Defects” Culture • managing reliability • identifying empowerment issues • Service Recovery Strategies • identifying service problems • conducting root cause analysis • modifying processes
  • 124.
    124 Blueprints Can Be Used By: SM • Service Marketers • Human Resources – creating realistic customer – empowering the human expectations element • service system design • job descriptions • promotion • selection criteria • appraisal systems • Operations Management – rendering the service as • System Technology promised • managing fail points – providing necessary tools: • training systems • system specifications • quality control • personal preference databases
  • 125.
    125 SM Chapter 9 CUSTOMER-DEFINED SERVICE STANDARDS
  • 126.
    Objectives for Chapter9: 126 SM Customer-defined Service Standards • Differentiate between company-defined and customer-defined service standards • Distinguish among one-time service fixes and “hard” and “soft” customer-defined standards • Explain the critical role of the service encounter sequence in developing customer-defined standards • Illustrate how to translate customer expectations into behaviors and actions that are definable, repeatable, and actionable
  • 127.
    Figure 9-1 127 AT&T’s Process Map for Measurements SM Business Process Customer Need Internal Metric Reliability (40%) % Repair Call 30% Product Easy To Use (20%) % Calls for Help Features / Functions (40%) Functional Performance Test Knowledge (30%) Supervisor Observations 30% Sales Responsive (25%) % Proposal Made on Time Follow-Up (10%) % Follow Up Made Total Delivery Interval Meets Needs (30%) Average Order Interval Quality 10% Installation Does Not Break (25%) % Repair Reports Installed When Promised (10%) % Installed On Due Date No Repeat Trouble (30%) % Repeat Reports 15% Repair Fixed Fast (25%) Average Speed Of Repair Kept Informed (10%) % Customers Informed Accuracy, No Surprise (45%) % Billing Inquiries 15% Billing Resolve On First Call (35%) % Resolved First Call Easy To Understand (10%) % Billing Inquiries Source: AT&T General Business Systems
  • 128.
    128 Exercise for Creating SM Customer-Defined Service Standards • Form a group of four people • Use your school’s undergraduate or graduate program, or an approved alternative • Complete the customer-driven service standards importance chart • Establish standards for the most important and lowest-performed behaviors and actions • Be prepared to present your findings to the class
  • 129.
    129 Customer-Driven Standards and SM Measurements Exercise Service Encounter Customer Requirements Measurements Service Quality
  • 130.
    Figure 9-2 130 SM Getting to Actionable Steps Requirements: Diagnosticity: Satisfaction Value Abstract Low Relationship General Concepts Solution Provider Dig Reliability Empathy Deeper Assurance Tangibles Dimensions Responsiveness Price Dig Delivers on Time Deeper Returns Calls Quickly Attributes Knows My Industry Dig Delivers by Weds 11/4 Behaviors Deeper Returns Calls in 2 Hrs Knows Strengths of and Actions My Competitors Concrete High
  • 131.
    Figure 9-3 131 Process for Setting SM Customer-Defined Standards 1. Identify Existing or Desired Service Encounter Sequence 2. Translate Customer Expectations Into Behaviors/Actions 2. Translate Customer Expectations Into Behaviors/Actions 3. Select Behaviors/Actions for Standards 3. Select Behaviors/Actions for Standards 4. Set Hard or Soft Standards Measure by Measure by Audits or Hard 5. Develop Feedback Soft Transaction- 5. Develop Feedback Operating Data Mechanisms Based Surveys Mechanisms 6. Establish Measures and Target Levels 6. Establish Measures and Target Levels 7. Track Measures Against Standards 8. Update Target Levels and Measures 8. Update Target Levels and Measures
  • 132.
    132 SM Importance/Performance Matrix HIGH 10.0 Improve Maintain Does whatever it takes to correct problems (9.26, 7.96) Delivers on promises specified in proposal/contract (9.49, 8.51)  Completes projects Gets project within budget, on time (9.31, 7.84) correctly, on time (9.29, 7.68)   Gets price we originally agreed upon (9.21, 8.64) 9.0   Tells me cost ahead of time (9.06, 8.46) Provides equipment that operates as vendor said it would (9.24, 8.14) Gets back to me when Takes responsibility for their mistakes (9.18, 8.01) promised (9.04, 7.63) Delivers or installs on Importance promised date (9.02, 7.84) 8.0 LOW 7.0 HIGH 8.0 9.0 10.0 Performance
  • 133.
    133 Figure 9-5 SM Linkage between Soft Measures and Hard Measures for Speed of Complaint Handling S A 10 T 9 I 8 Large Customers S 7 Small Customers F 6 A 5 C 4 T 3 I 2 O 1 2 4 6 8 12 16 20 24 N 0 WORKING HOURS
  • 134.
    Figure 9-6 134 Aligning Company S M Processes with Customer Expectations Customer Expectations 48 Hours Customer Process Blueprint Report Lost Receive New Card Card Company Process Company Sequential Processes Blueprint A A B B C C D D E E F F G G H H Lost Card New Card Reported 40 Days Mailed
  • 135.
    135 SM Chapter 10 PHYSICAL EVIDENCE AND THE SERVICESCAPE
  • 136.
    136 Objectives for Chapter 10: SM Physical Evidence and the Servicescape • Explain the impact on customer perceptions of physical evidence, particularly the servicescape • Illustrate differences in types and roles of servicescapes and their implications for strategy • Explain why the servicescape affects employee and customer behavior • Analyze four different approaches for understanding the effects of physical environment • Present elements of an effective physical evidence strategy
  • 137.
    137 Table 10-1 SM Elements of Physical Evidence Servicescape Other tangibles Facility exterior Business cards Exterior design Stationery Signage Billing statements Parking Reports Landscape Employee dress Surrounding environment Uniforms Brochures Facility interior Internet/Web pages Interior design Equipment Signage Layout Air quality/temperature
  • 138.
    Table 10-2 138 Examples of Physical Evidence from the SM Customer’s Point of View Service Physical evidence Servicescape Other tangibles Insurance Not applicable Policy itself Billing statements Periodic updates Company brochure Letters/cards Hospital Building exterior Uniforms Parking Reports/stationery Signs Billing statements Waiting areas Admissions office Patient care room Medical equipment Recovery room Airline Airline gate area Tickets Airplane exterior Food Airplane interior (décor, seats, air Uniforms quality) Express mail Not applicable Packaging Trucks Uniforms Computers Sporting Parking, Seating, Restrooms Signs event Stadium exterior Tickets Ticketing area, Concession Areas Program Entrance, Playiing Field Uniforms
  • 139.
    Table 10-3 139 Typology of Service Organizations SM Based on Variations in Form and Use of the Servicescape Complexity of the servicescape evidence Servicescape Elaborate Lean usage Self-service Golf Land ATM (customer only) Surf 'n' Splash Ticketron Post office kiosk Internet services Express mail drop-off Interpersonal Hotel Dry cleaner services Restaurants Hot dog stand (both customer and Health clinic Hair salon employeee) Hospital Bank Airline School Remote service Telephone company Telephone mail-order desk (employee only) Insurance company Automated voice-messaging- Utility based services Many professional services
  • 140.
    Figure 10-3 140 A Framework for Understanding SM Environment-user Relationships in Service Organizations PHYSICAL HOLISTIC INTERNAL BEHAVIOR ENVIRONMENTAL ENVIRONMENT RESPONSES DIMENSIONS Cognitive Emotional Physiological Individual Behaviors Employee Responses Ambient Social Conditions Interactions Space/Function Perceived between and Servicescape among customer and Signs, Symbols, employees and Artifacts Customer Responses Individual Behaviors Cognitive Emotional Source: Adapted from Mary Jo Bitner, “Servicescapes.” Physiological
  • 141.
    141 SM Part 4 DELIVERING AND PERFORMING SERVICE
  • 142.
    142 SM Provider GAP 3 CUSTOMER Service Delivery COMPANY GAP 3 Customer-Driven Service Designs and Standards Part 4 Opener
  • 143.
    143 SM Chapter 11 EMPLOYEES’ ROLES IN SERVICE DELIVERY
  • 144.
    144 Objectives for Chapter 11: SM Employees’ Roles in Service Delivery • Illustrate the critical importance of service employees in creating customer satisfaction and service quality • Demonstrate the challenges inherent in boundary- spanning roles • Provide examples of strategies for creating customer-oriented service delivery • Show how the strategies can support a service culture where providing excellent service is a way of life
  • 145.
    145 SM Service Employees • They are the service • They are the firm in the customer’s eyes • They are marketers • Importance is evident in – The Services Marketing Mix (People) – The Service-Profit Chain – The Services Triangle
  • 146.
    146 SM Service Employees • Who are they? – “boundary spanners” • What are these jobs like? – emotional labor – many sources of potential conflict • person/role • organization/client • interclient • quality/productivity
  • 147.
    Figure 11-3 147 Boundary Spanners Interact SM with Both Internal and External Constituents External Environment Internal Environment
  • 148.
    148 Figure 11-4 SM Sources of Conflict for Boundary-Spanning Workers • Person vs. Role • Organization vs. Client • Client vs. Client • Quality vs. Productivity
  • 149.
    Figure 11-5 149 Human Resource Strategies for Closing GAP 3 SM Hire for r Service fo Competencies B Pr e t te t pe es and Service E m e f e he m B le pl rred Co the op Inclination oy Pe er Str ard nd Te Inte kills Tr nica tive Re ure a ch rac Hire the ai n l Pr ervic g fo and ide e Right People on rs w as S r Me ov S Develop Customer- Employees Empower Employees Customers Retain the People to oriented Treat Deliver Best as Service Service People Delivery Quality Em th any’ wo e rk Inc am ot Provide plo e Te rom Co Visio lud es in ye Needed Support mp n P e De Systems Se v e l o s e ur or rvic p as nal i Int ente - e Provide Me ter e Pr ern d In rvic y oc Supportive Se alit es al se s Technology Qu and Equipment
  • 150.
    151 SM Service Culture “A culture where an appreciation for good service exists, and where giving good service to internal as well as ultimate, external customers, is considered a natural way of life and one of the most important norms by everyone in the organization.”
  • 151.
    152 SM Chapter 12 CUSTOMERS’ ROLES IN SERVICE DELIVERY
  • 152.
    153 Objectives for Chapter 12: SM Customers’ Roles in Service Delivery • Illustrate the importance of customers in successful service delivery • Enumerate the variety of roles that service customers play • Productive resources • Contributors to quality and satisfaction • Competitors • Explain strategies for involving service customers effectively to increase both quality and productivity
  • 153.
    154 Importance of Other SM Customers in Service Delivery • Other customers can detract from satisfaction • disruptive behaviors • excessive crowding • incompatible needs • Other customers can enhance satisfaction • mere presence • socialization/friendships • roles: assistants, teachers, supporters
  • 154.
    155 SM How Customers Widen Gap 3 • Lack of understanding of their roles • Not being willing or able to perform their roles • No rewards for “good performance” • Interfering with other customers • Incompatible market segments
  • 155.
    Figure 12-2 156 SM Customer Roles in Service Delivery Productive Resources Contributors to Quality and Satisfaction Competitors
  • 156.
    157 SM Customers as Productive Resources • “partial employees” – contributing effort, time, or other resources to the production process • customer inputs can affect organization’s productivity • key issue: – should customers’ roles be expanded? reduced?
  • 157.
    158 Customers as Contributors SM to Service Quality and Satisfaction • Customers can contribute to – their own satisfaction with the service • by performing their role effectively • by working with the service provider – the quality of the service they receive • by asking questions • by taking responsibility for their own satisfaction • by complaining when there is a service failure
  • 158.
    159 SM Customers as Competitors • customers may “compete” with the service provider • “internal exchange” vs. “external exchange” • internal/external decision often based on: – expertise – resources – time – economic rewards – psychic rewards – trust – control
  • 159.
    160 Technology Spotlight: SM Services Production Continuum Customer Production Joint Production Firm Production 1 2 3 4 5 6 Gas Station Illustration 1. Customer pumps gas and pays at the pump with automation 2. Customer pumps gas and goes inside to pay attendant 3. Customer pumps gas and attendant takes payment at the pump 4. Attendant pumps gas and customer pays at the pump with automation 5. Attendant pumps gas and customer goes inside to pay attendant 6. Attendant pumps gas and attendant takes payment at the pump
  • 160.
    Figure 12-3 161 SM Strategies for Enhancing Customer Participation Effective Define Customer Customer Recruit, Educate, Participation and Reward Jobs Customers Manage the Customer Mix
  • 161.
    162 Strategies for Enhancing SM Customer Participation 1. Define customers’ jobs - helping himself - helping others - promoting the company 2. Individual differences: not everyone wants to participate
  • 162.
    163 Strategies for Recruiting, SM Educating and Rewarding Customers 1. Recruit the right customers 2. Educate and train customers to perform effectively 3. Reward customers for their contribution 4. Avoid negative outcomes of inappropriate customer participation Manage the Customer Mix
  • 163.
    164 SM Chapter 14 MANAGING DEMAND AND CAPACITY
  • 164.
    165 Objectives for Chapter 14: SM Managing Demand and Capacity • Explain: • the underlying issue for capacity-constrained services • the implications of capacity constraints • the implications of different types of demand patterns on matching supply and demand • Lay out strategies for matching supply and demand through: • shifting demand to match capacity or • flexing capacity to meet demand • Demonstrate the benefits and risks of yield management strategies • Provide strategies for managing waiting lines
  • 165.
    166 Understanding Capacity SM Constraints and Demand Patterns Capacity Constraints Demand Patterns • Time, labor, • Charting demand equipment and patterns facilities • Predictable cycles • Optimal versus • Random demand maximal use of fluctuations capacity • Demand patterns by market segment
  • 166.
    167 Figure 14-3 SM Strategies for Shifting Demand to Match Capacity Demand Too High Shift Demand Demand Too Low • Use signage to communicate • Use sales and advertising to busy days and times increase business from current • Offer incentives to customers market segments for usage during non-peak • Modify the service offering to times appeal to new market segments • Take care of loyal or regular • Offer discounts or price customers first reductions • Advertise peak usage times and • Modify hours of operation benefits of non-peak use • Bring the service to the • Charge full price for the customer service--no discounts
  • 167.
    Figure 14-4 168 Strategies for Flexing Capacity SM to Match Demand Demand Too High Flex Capacity Demand Too Low • Stretch time, labor, facilities and equipment • Perform maintenance renovations • Cross-train employees • Schedule vacations • Hire part-time employees • Schedule employee training • Request overtime work from employees • Lay off employees • Rent or share facilities • Rent or share equipment • Subcontract or outsource activities
  • 168.
    Table 14-1 169 SM What is the Nature of Demand Relative to Supply? Extent of demand fluctuations over time Extent to which supply is Wide Narrow constrained Peak demand can 1 2 usually be met Electricity Insurance without a major Natural gas Legal services delay Telephone Banking Hospital maternity unit Laundry and dry cleaning Police and fire emergencies Peak demand 4 3 regularly exceeds Accounting and tax Services similar to those in capacity preparation 2 but which have Passenger transportation insufficient capacity for Hotels and motels their base level of business Restaurants Theaters Source: Christopher H. Lovelock, “Classifying Services to Gain Strategic Marketing Insights,” Journal of Marketing, 47, 3 (Summer 1983): 17.
  • 169.
    Table 14-2 170 What is the Constraint on SM Capacity? Nature of the constraint Type of service Time Legal Consulting Accounting Medical Labor Law firm Accounting firm Consulting firm Health clinic Equipment Delivery services Telecommunication Utilities Health club Facilities Hotels Restaurants Hospitals Airlines Schools Theaters Churches
  • 170.
    171 SM Waiting Line Issues and Strategies • unoccupied time feels longer • preprocess waits feel longer • anxiety makes waits seem longer • uncertain waits seem longer than finite waits • unexplained waits seem longer • unfair waits feel longer • longer waits are more acceptable for “valuable” services • solo waits feel longer
  • 171.
    172 SM Part 5 MANAGING SERVICE PROMISES
  • 172.
    173 SM Provider GAP 4 CUSTOMER COMPANY Service Delivery External Communications GAP 4 to Customers Part 5 Opener
  • 173.
    174 SM Chapter 15 INTEGRATED MARKETING COMMUNICATION
  • 174.
    175 Objectives for Chapter 15: SM Integrated Services Marketing Communications • Introduce the concept of Integrated Services Marketing Communication • Discuss the key reasons for service communication problems • Present four key ways to integrate marketing communication in service organizations • Present specific strategies for managing promises, managing customer expectations, educating customers, and managing internal communications • Provide perspective on the popular service objective of exceeding customer expectations
  • 175.
    176 Figure 15-1 SM Communications and the Services Marketing Triangle Company Internal Marketing External Marketing Vertical Communications Communication Horizontal Communications Advertising Sales Promotion Public Relations Direct Marketing Employees Interactive Marketing Customers Personal Selling Customer Service Center Service Encounters Servicescapes Source: Parts of model adapted from work by Christian Gronroos and Phillip Kotler
  • 176.
    Figure 15-3 177 Approaches for SM Integrating Services Marketing Communication Manage Customer Expectations Goal: Manage Delivery Improve Service greater than Customer Promises or equal to Education promises Manage Internal Marketing Communication
  • 177.
    178 Figure 15-4 SM Approaches for Managing Service Promises MANAGING SERVICE PROMISES Goal: Create Coordinate Offer Delivery Effective Make External Realistic Service greater than Services Communication Guarantees or equal to Communications Promises promises
  • 178.
    Figure 15-8 179 Approaches for SM Managing Customer Expectations Offer Choices Create Tiered-Value Offerings Communicate Criteria for Service Effectiveness Negotiate Unrealistic Expectations Goal: Delivery greater than or equal to promises
  • 179.
    180 Figure 15-9 SM Approaches for Improving Customer Education Teach Customers Prepare Confirm Clarify to Avoid Goal: Performance Expectations Delivery Customers Peak for the to Standards after the Sale Demand greater than Service or equal to Periods Process and promises Seek Slow Periods
  • 180.
    181 Figure 15-10 SM Approaches for Managing Internal Marketing Communications Goal: Delivery greater than or equal to promises Create Effective Vertical Communications Create Effective Horizontal Communications Align Back Office Personnel w/ External Customers Create Cross-Functional Teams
  • 181.
    182 SM Chapter 17 THE FINANCIAL AND ECONOMIC IMPACT OF SERVICE QUALITY
  • 182.
    183 Objectives for Chapter 17: SM The Financial and Economic Impact of Service • Examine the direct effects of service on profits • Consider the impact of service on getting new customers • Evaluate the role of service in keeping customers • Examine the link between perceptions of service and purchase intentions • Emphasize the importance of selecting profitable customers • Discuss what is know about the key service drivers of overall service quality, customer retention and profitability • Discuss the balanced performance scorecard to focus on strategic measurement other than financials
  • 183.
    184 Figure 17-1 SM The Direct Relationship between Service and Profits Service Quality ? Profits
  • 184.
    185 Figure 17-2 SM Offensive Marketing Effects of Service on Profits Service Quality Profits Market Share Reputation Sales Price Premium
  • 185.
    186 Figure 17-3 SM Defensive Marketing Effects of Service on Profit Costs Volume of Margins Service Customer Purchases Quality Retention Price Premium Word of Mouth Profits
  • 186.
    187 Figure 17-5 SM Perceptions of Service, Behavioral Intentions and Profits Costs Volume of Margins Purchases Customer Retention Price Behavioral Premium Service Intentions Word of Mouth Profits Sales
  • 187.
    Figure 17-6 188 SM The “80/20” Customer Pyramid Most Profitable What segment spends more with Customers us over time, costs less to maintain, Best Customers spreads positive word of mouth? Other Customers What segment costs us in time, effort and money yet does not provide the return Least Profitable we want? What segment is Customers difficult to do business with?
  • 188.
    189 Figure 17-7 SM The Expanded Customer Pyramid Most Profitable What segment spends more with Customers Platinum us over time, costs less to maintain, spreads positive word of mouth? Gold Iron What segment costs us in Lead time, effort and money yet does not provide the return Least Profitable we want? What segment is difficult to do business with? Customers
  • 189.
    190 Figure 17-8 SM The Key Drivers of Service Quality, Customer Retention, and Profits Key Drivers Service Encounters Service Encounter Service Encounter Service Behavioral Customer Quality Intentions Retention Profits Service Encounter Service Encounter
  • 190.
    Figure 17-9 191 Sample Measurements for the SM Balanced Scorecard Financial Measures Price Premium Volume Increases Value of Customer Referrals Customer Perspective Value of Cross Sales Operational Long-term Value of Perspective: Customer Service Perceptions Right first time (% hits) Service Expectations Right on time (% hits) Perceived Value Responsiveness (% on Behavioral Intentions: Innovation and time) % Loyalty Learning Perspective Transaction time (hours, % Intent to Switch days) # Customer Number of new products Throughput time Referrals Return on innovation Reduction in waste # Cross Sales Employee skills Process quality # of Defections Time to market Time spent talking to customers Adapted from Kaplan and Norton
  • 191.
    Figure 17-10 192 SM Service Quality Spells Profits Costs Defensive Volume of Margins Marketing Purchases Price Premium Service Customer Quality Retention Word of Mouth Profits Market Share Sales Offensive Marketing Reputation Price Premium
  • 192.