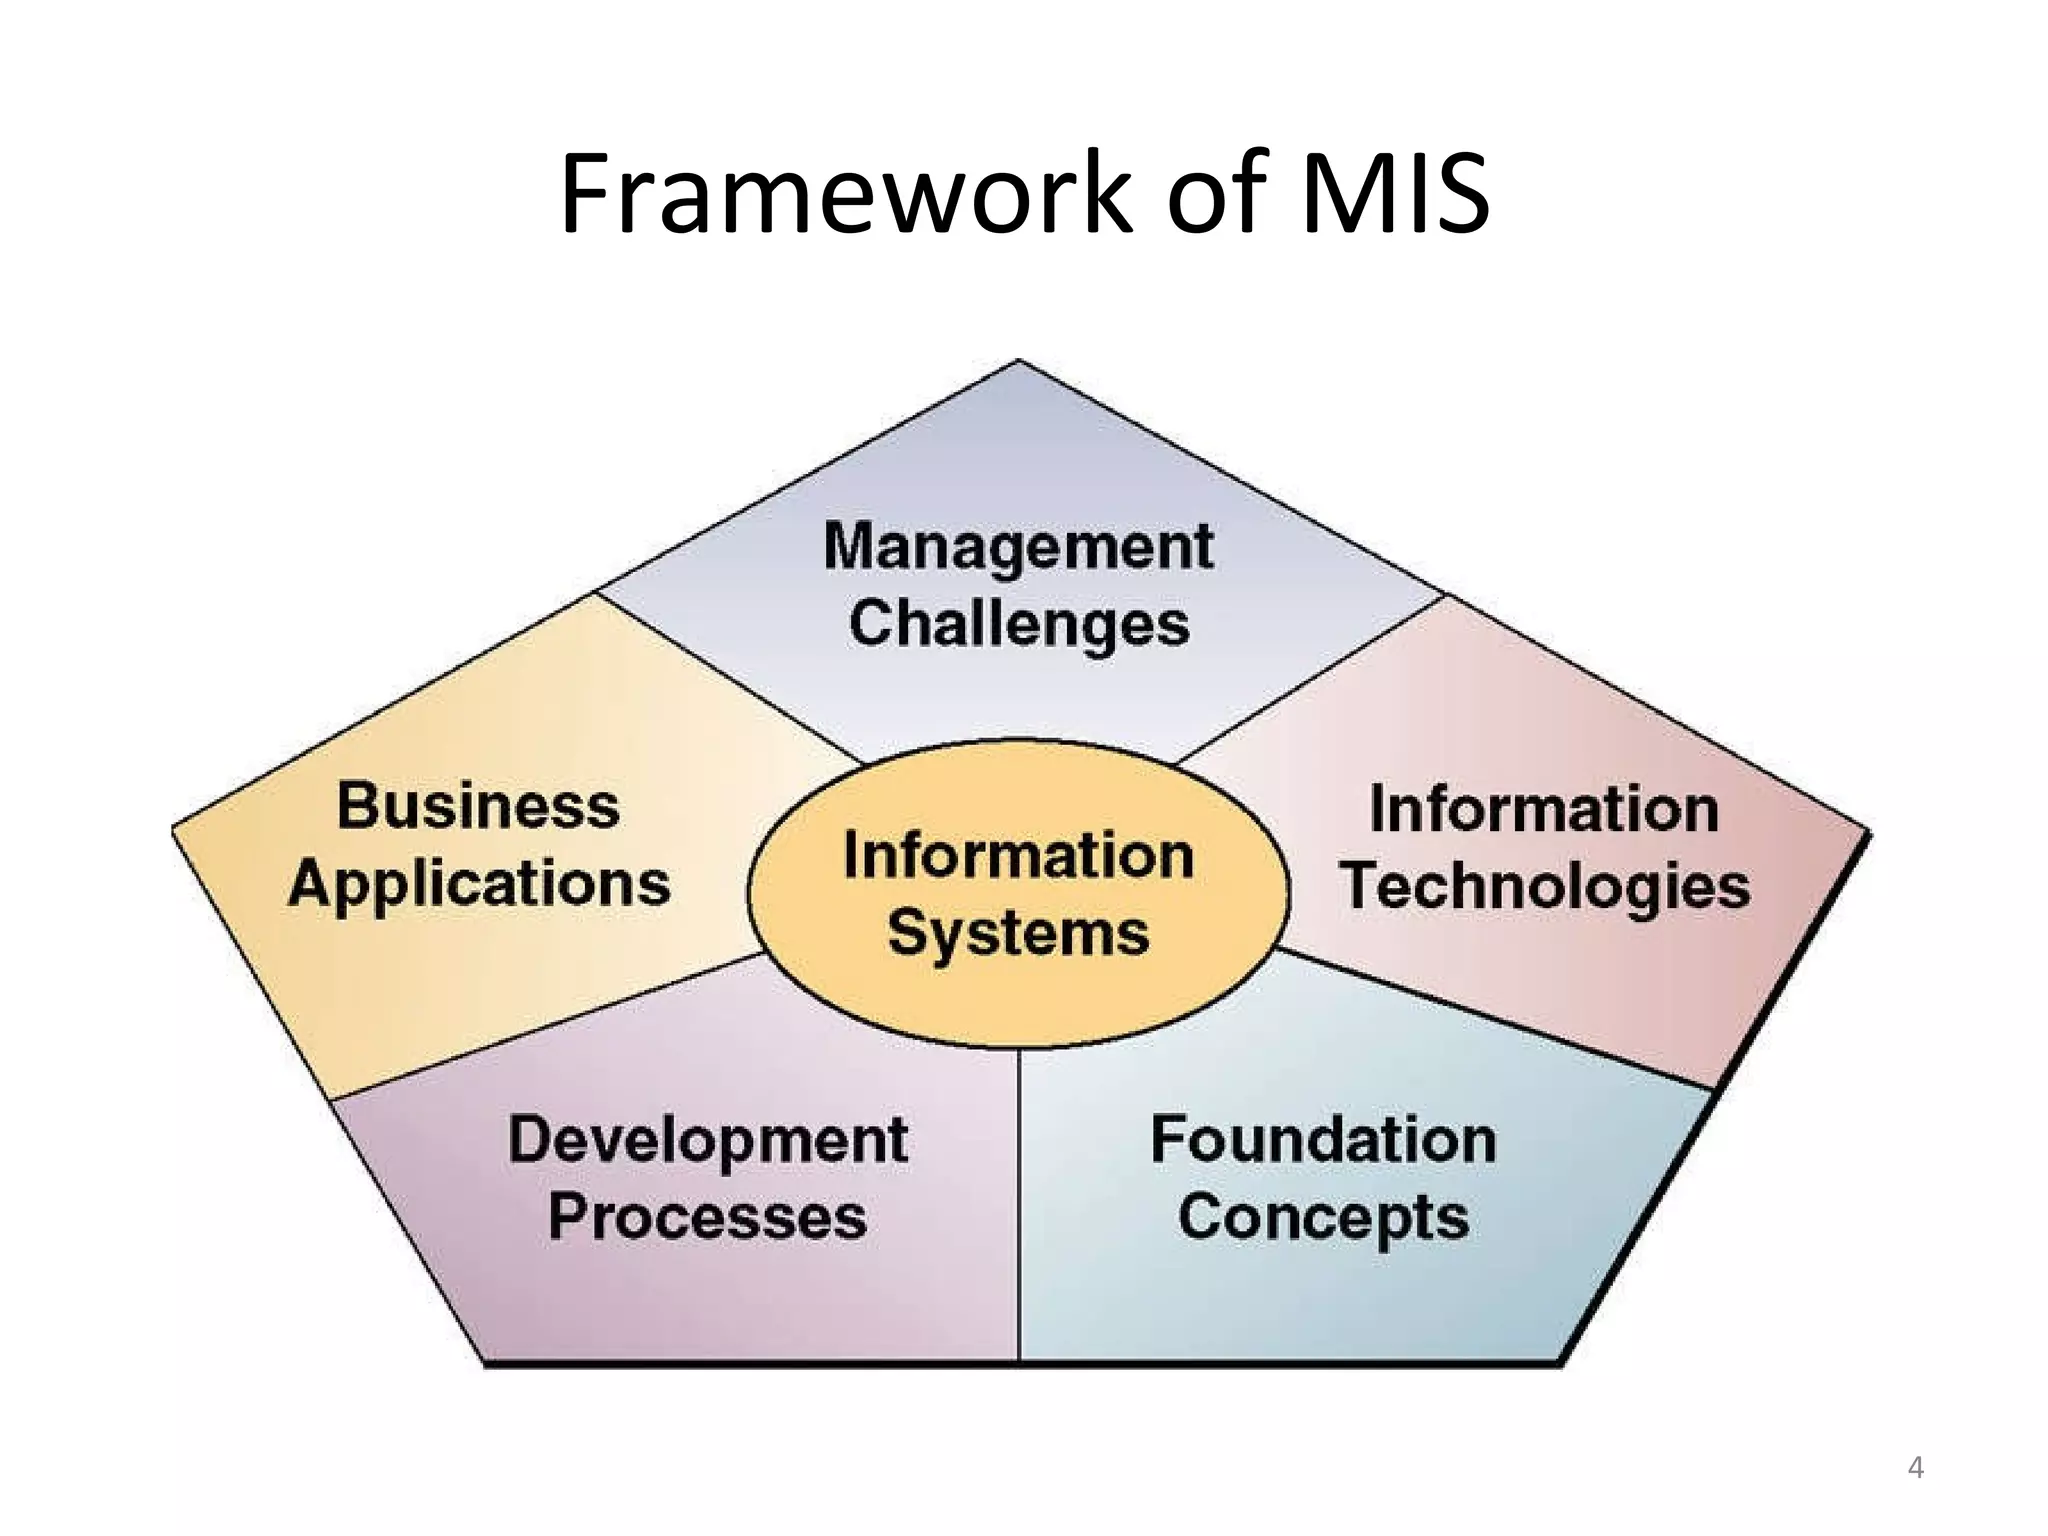
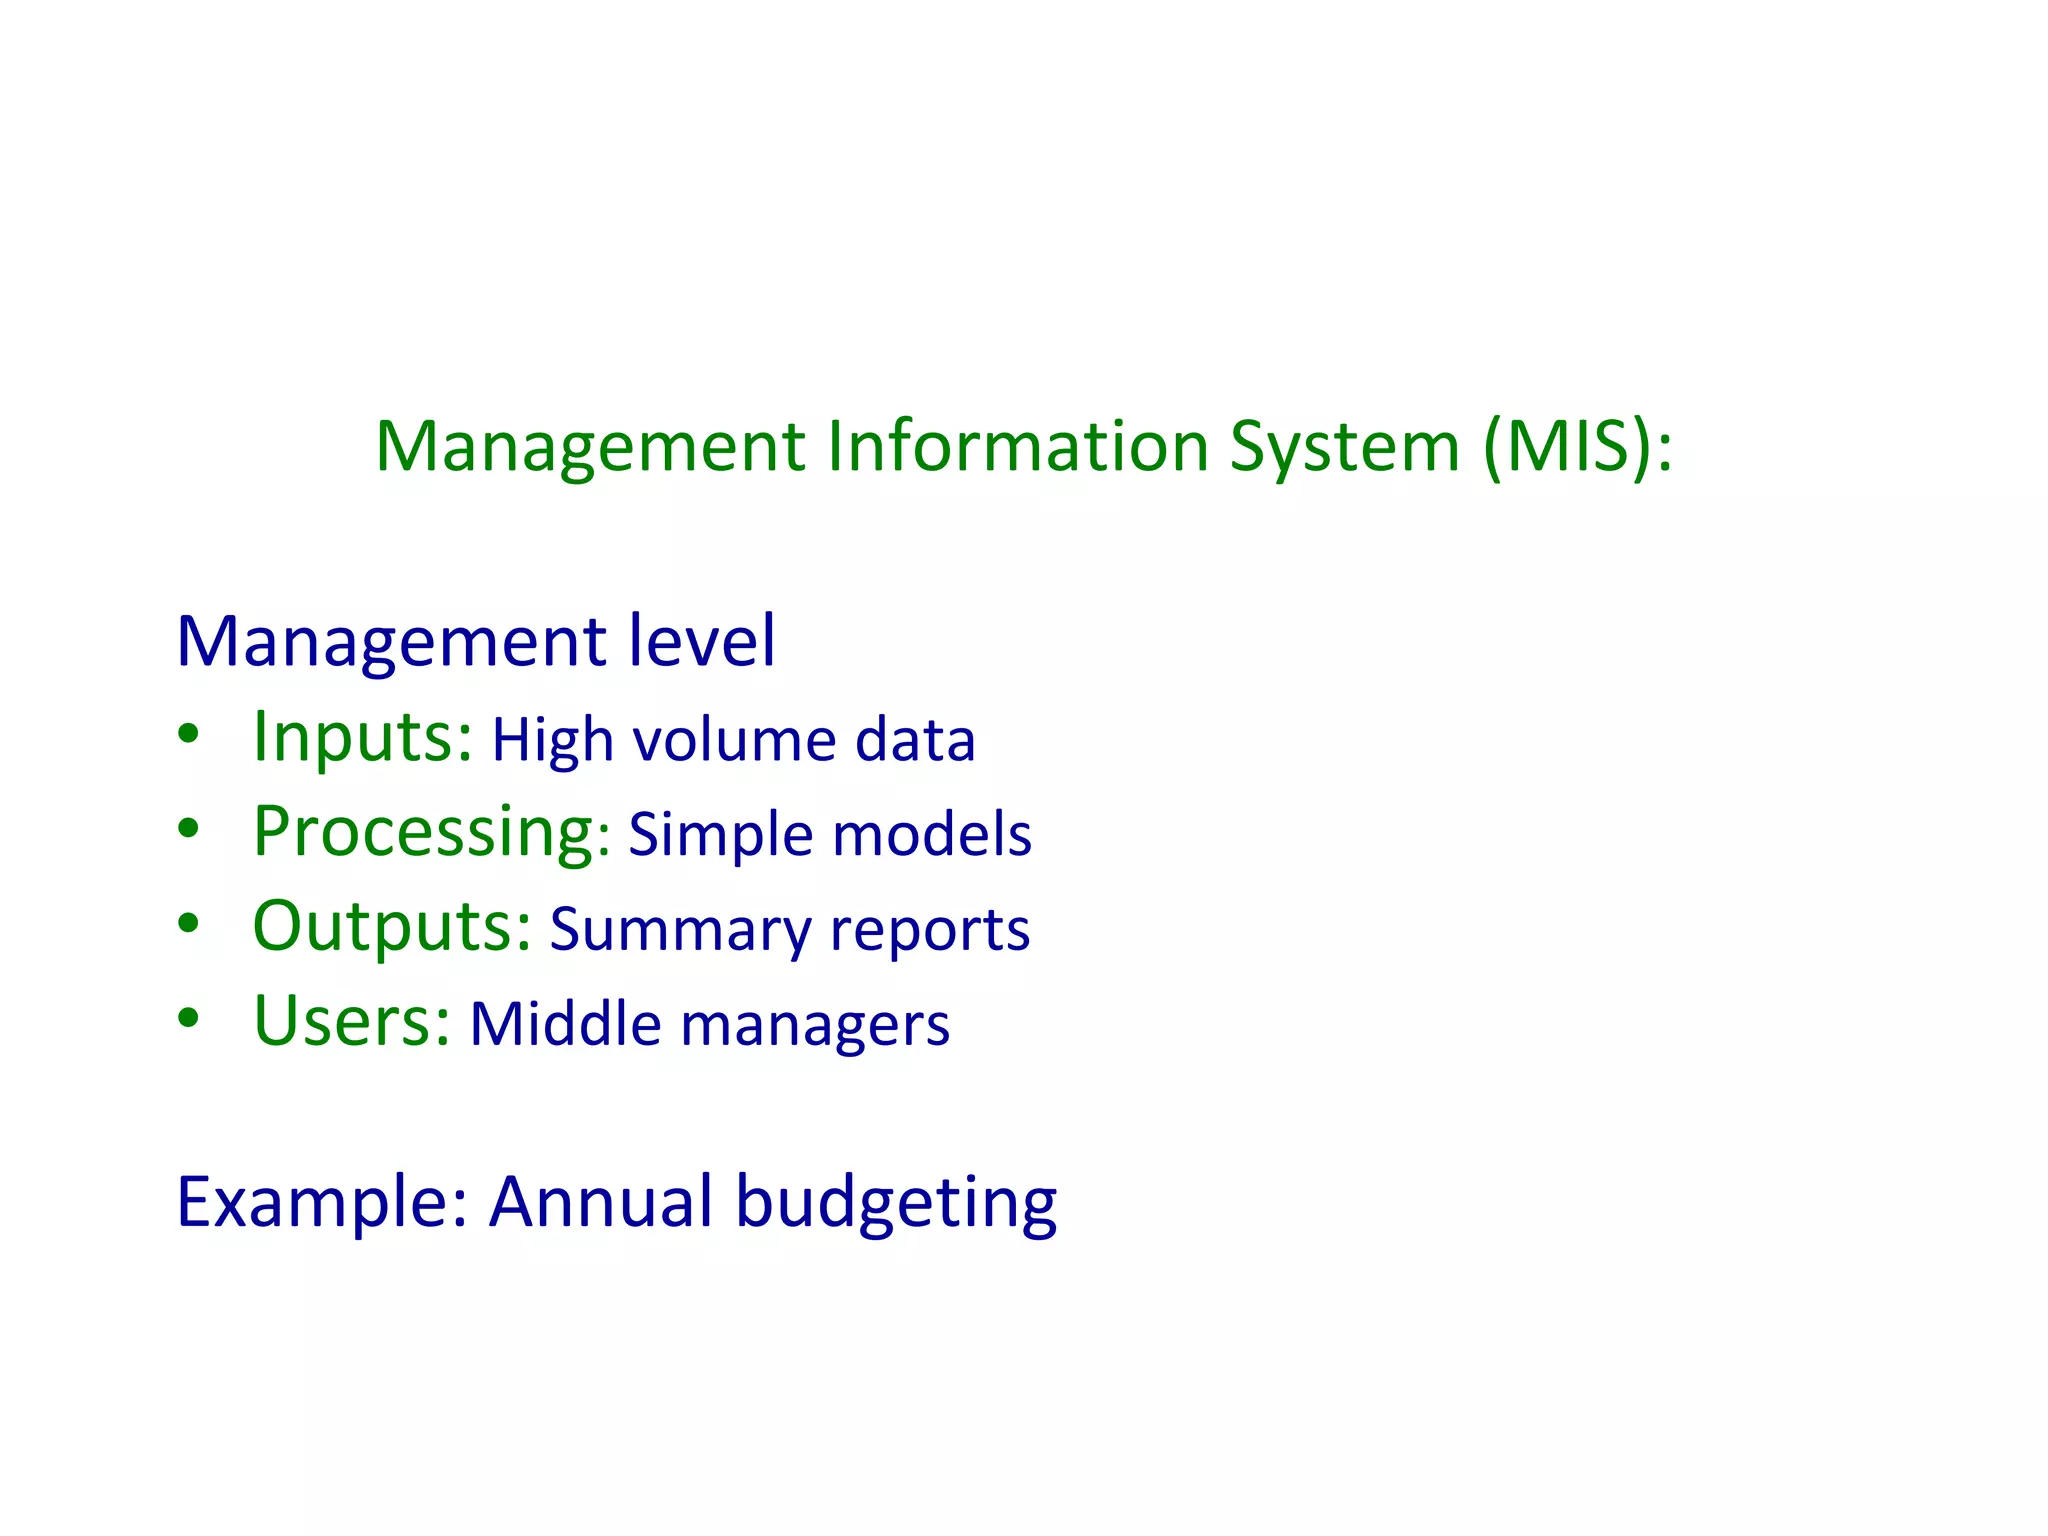
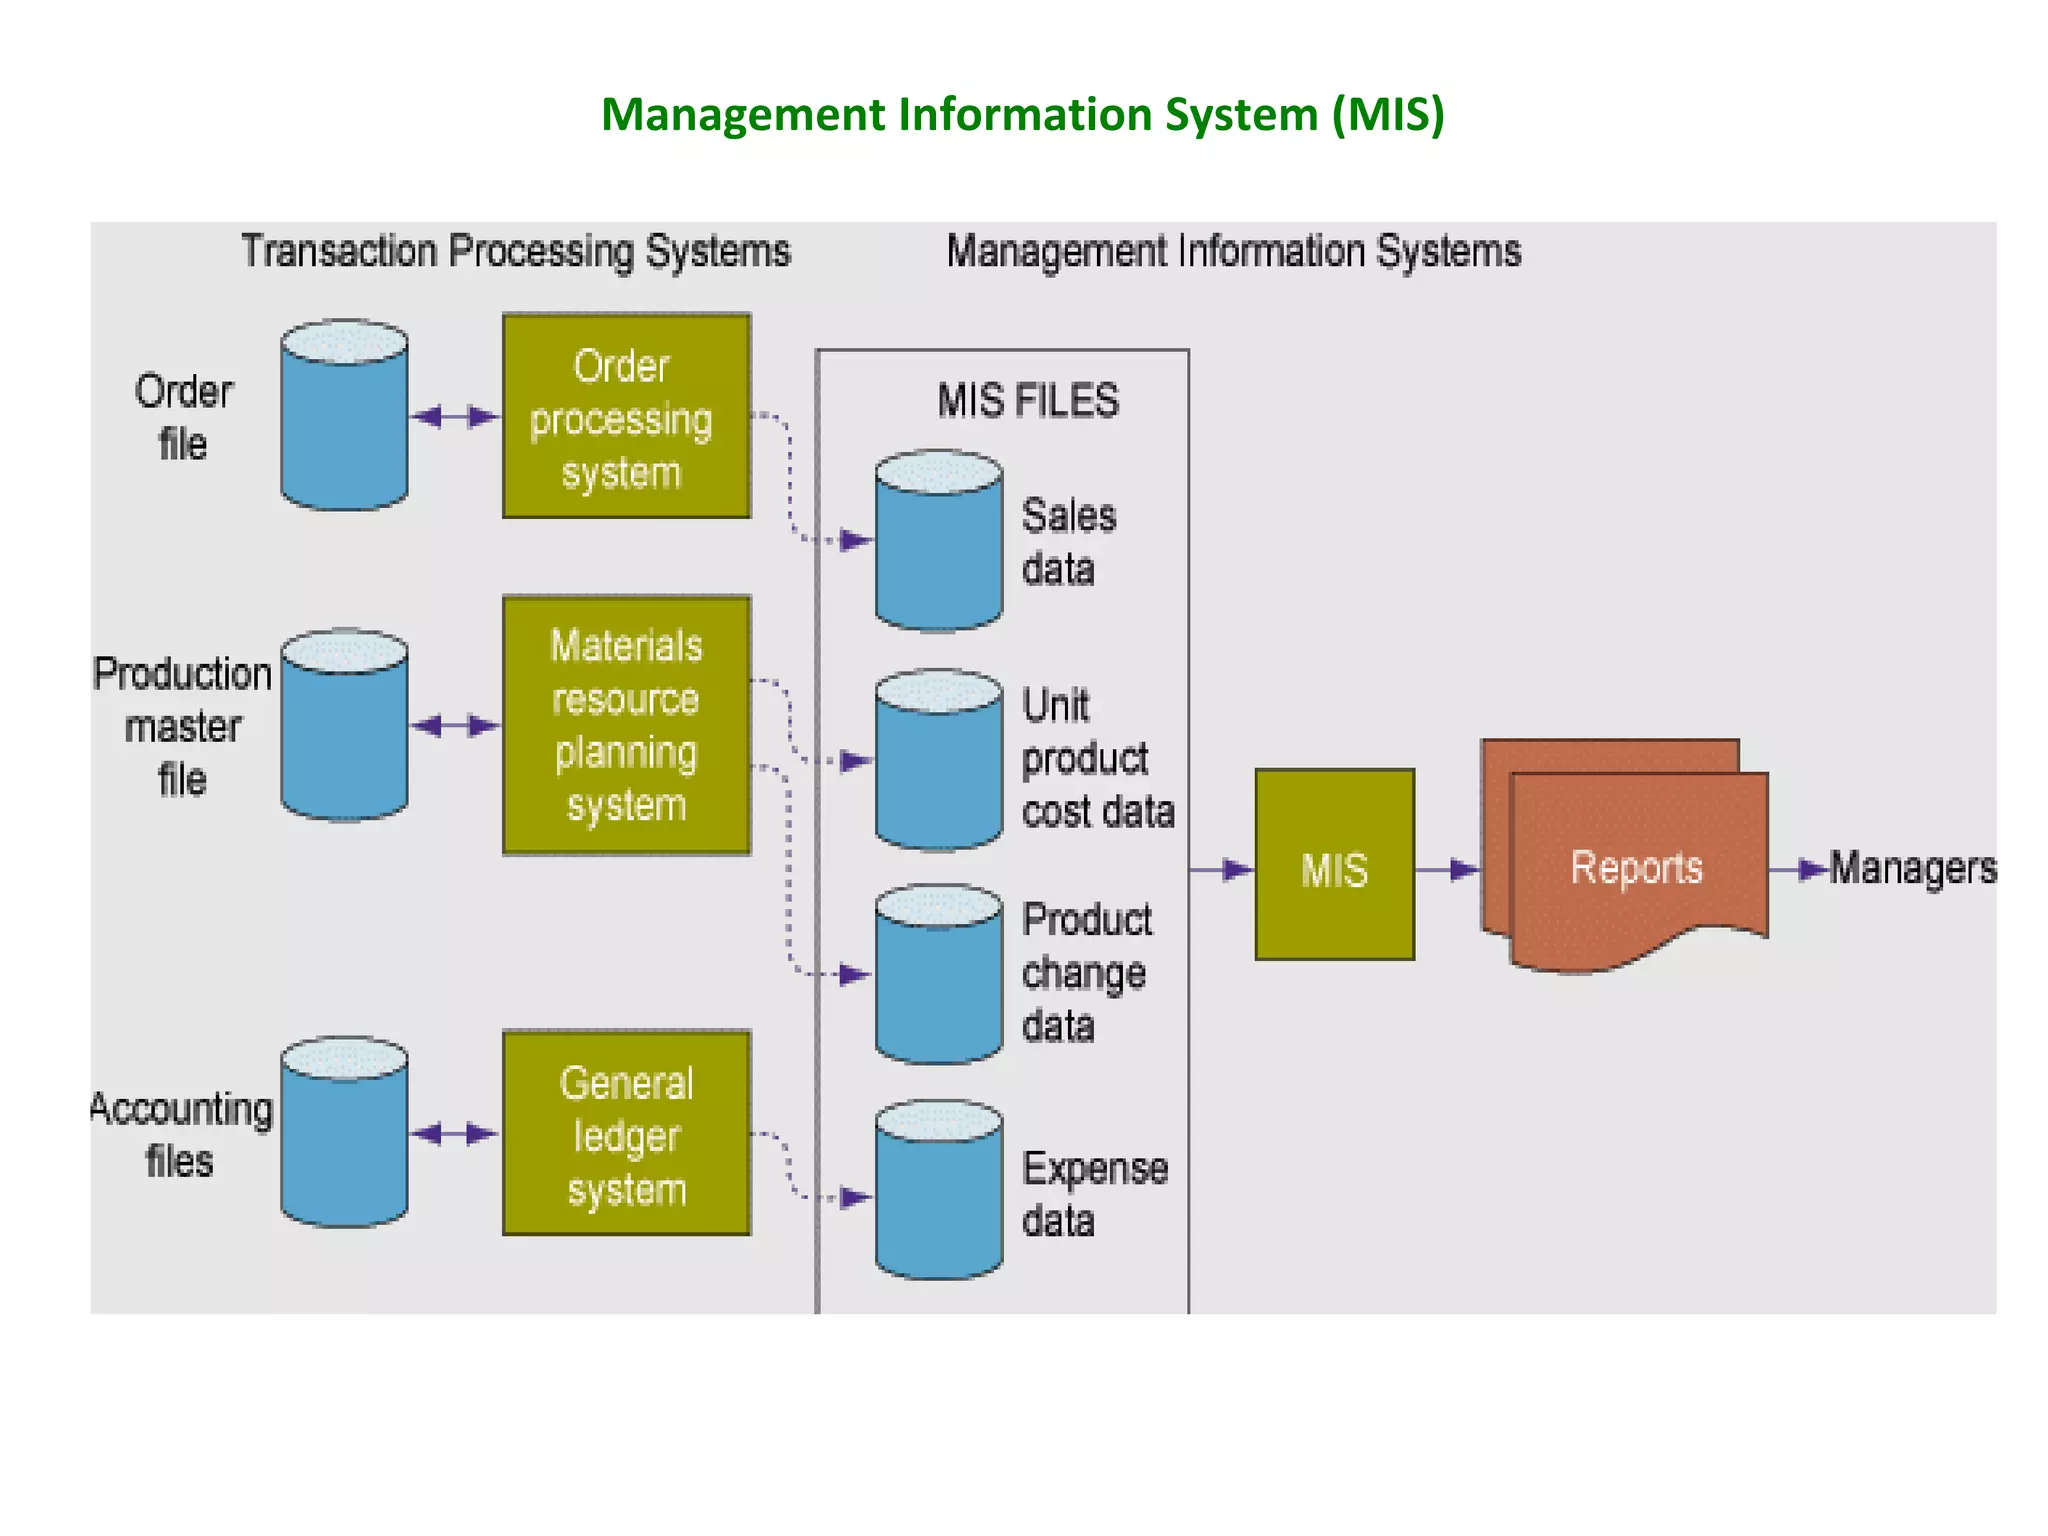
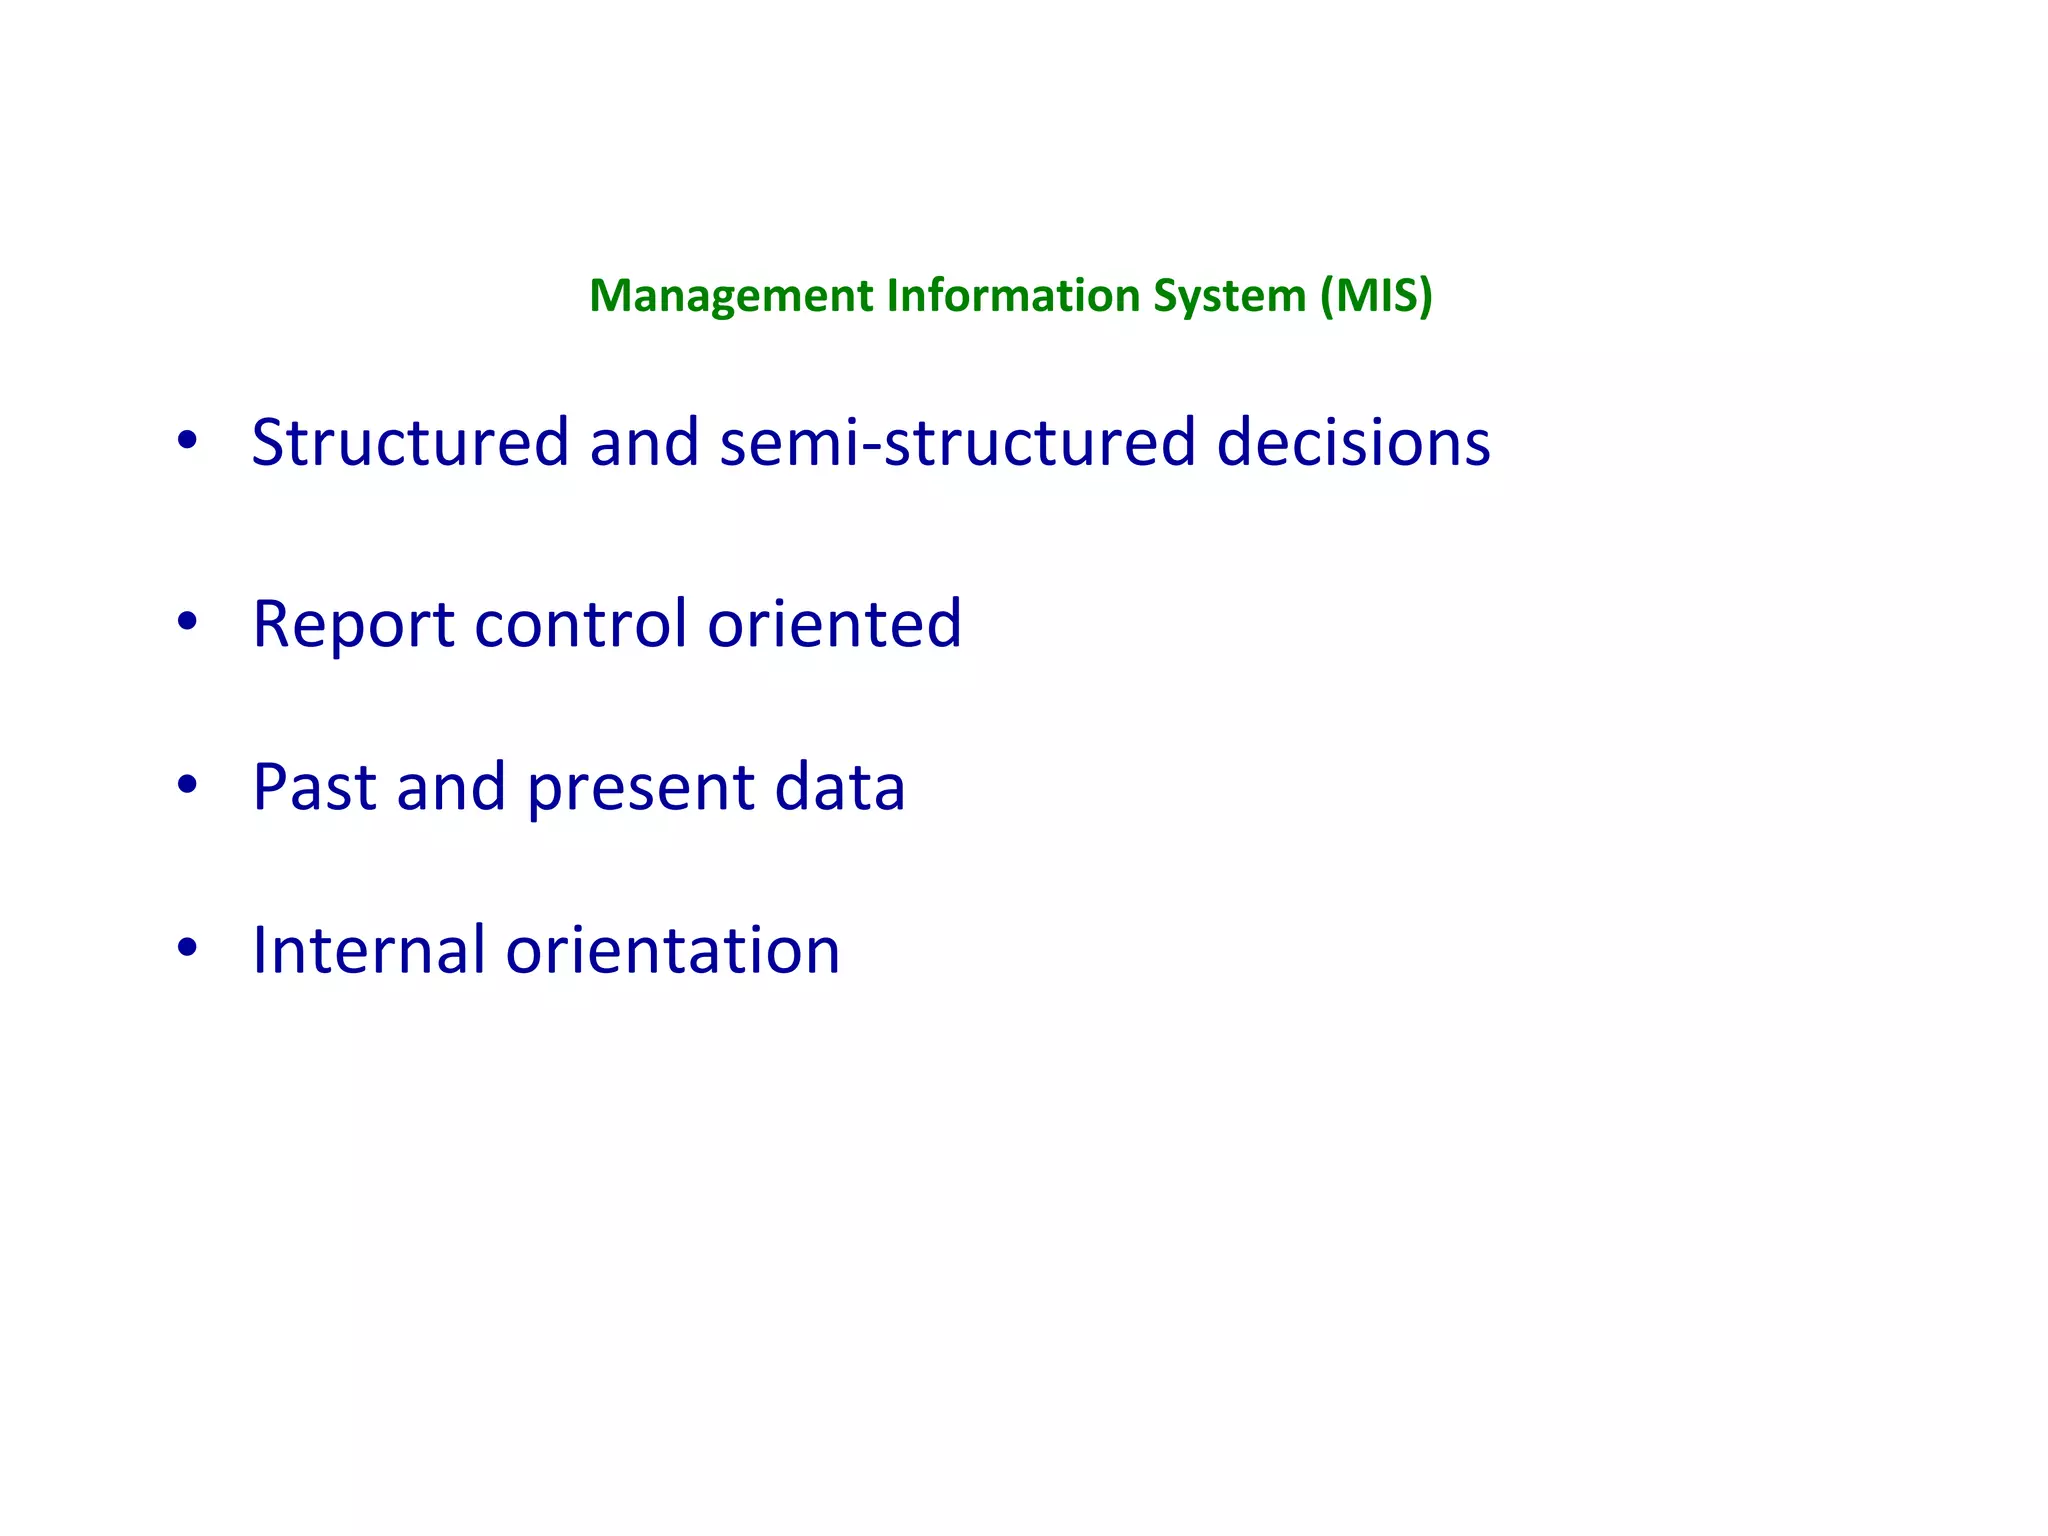
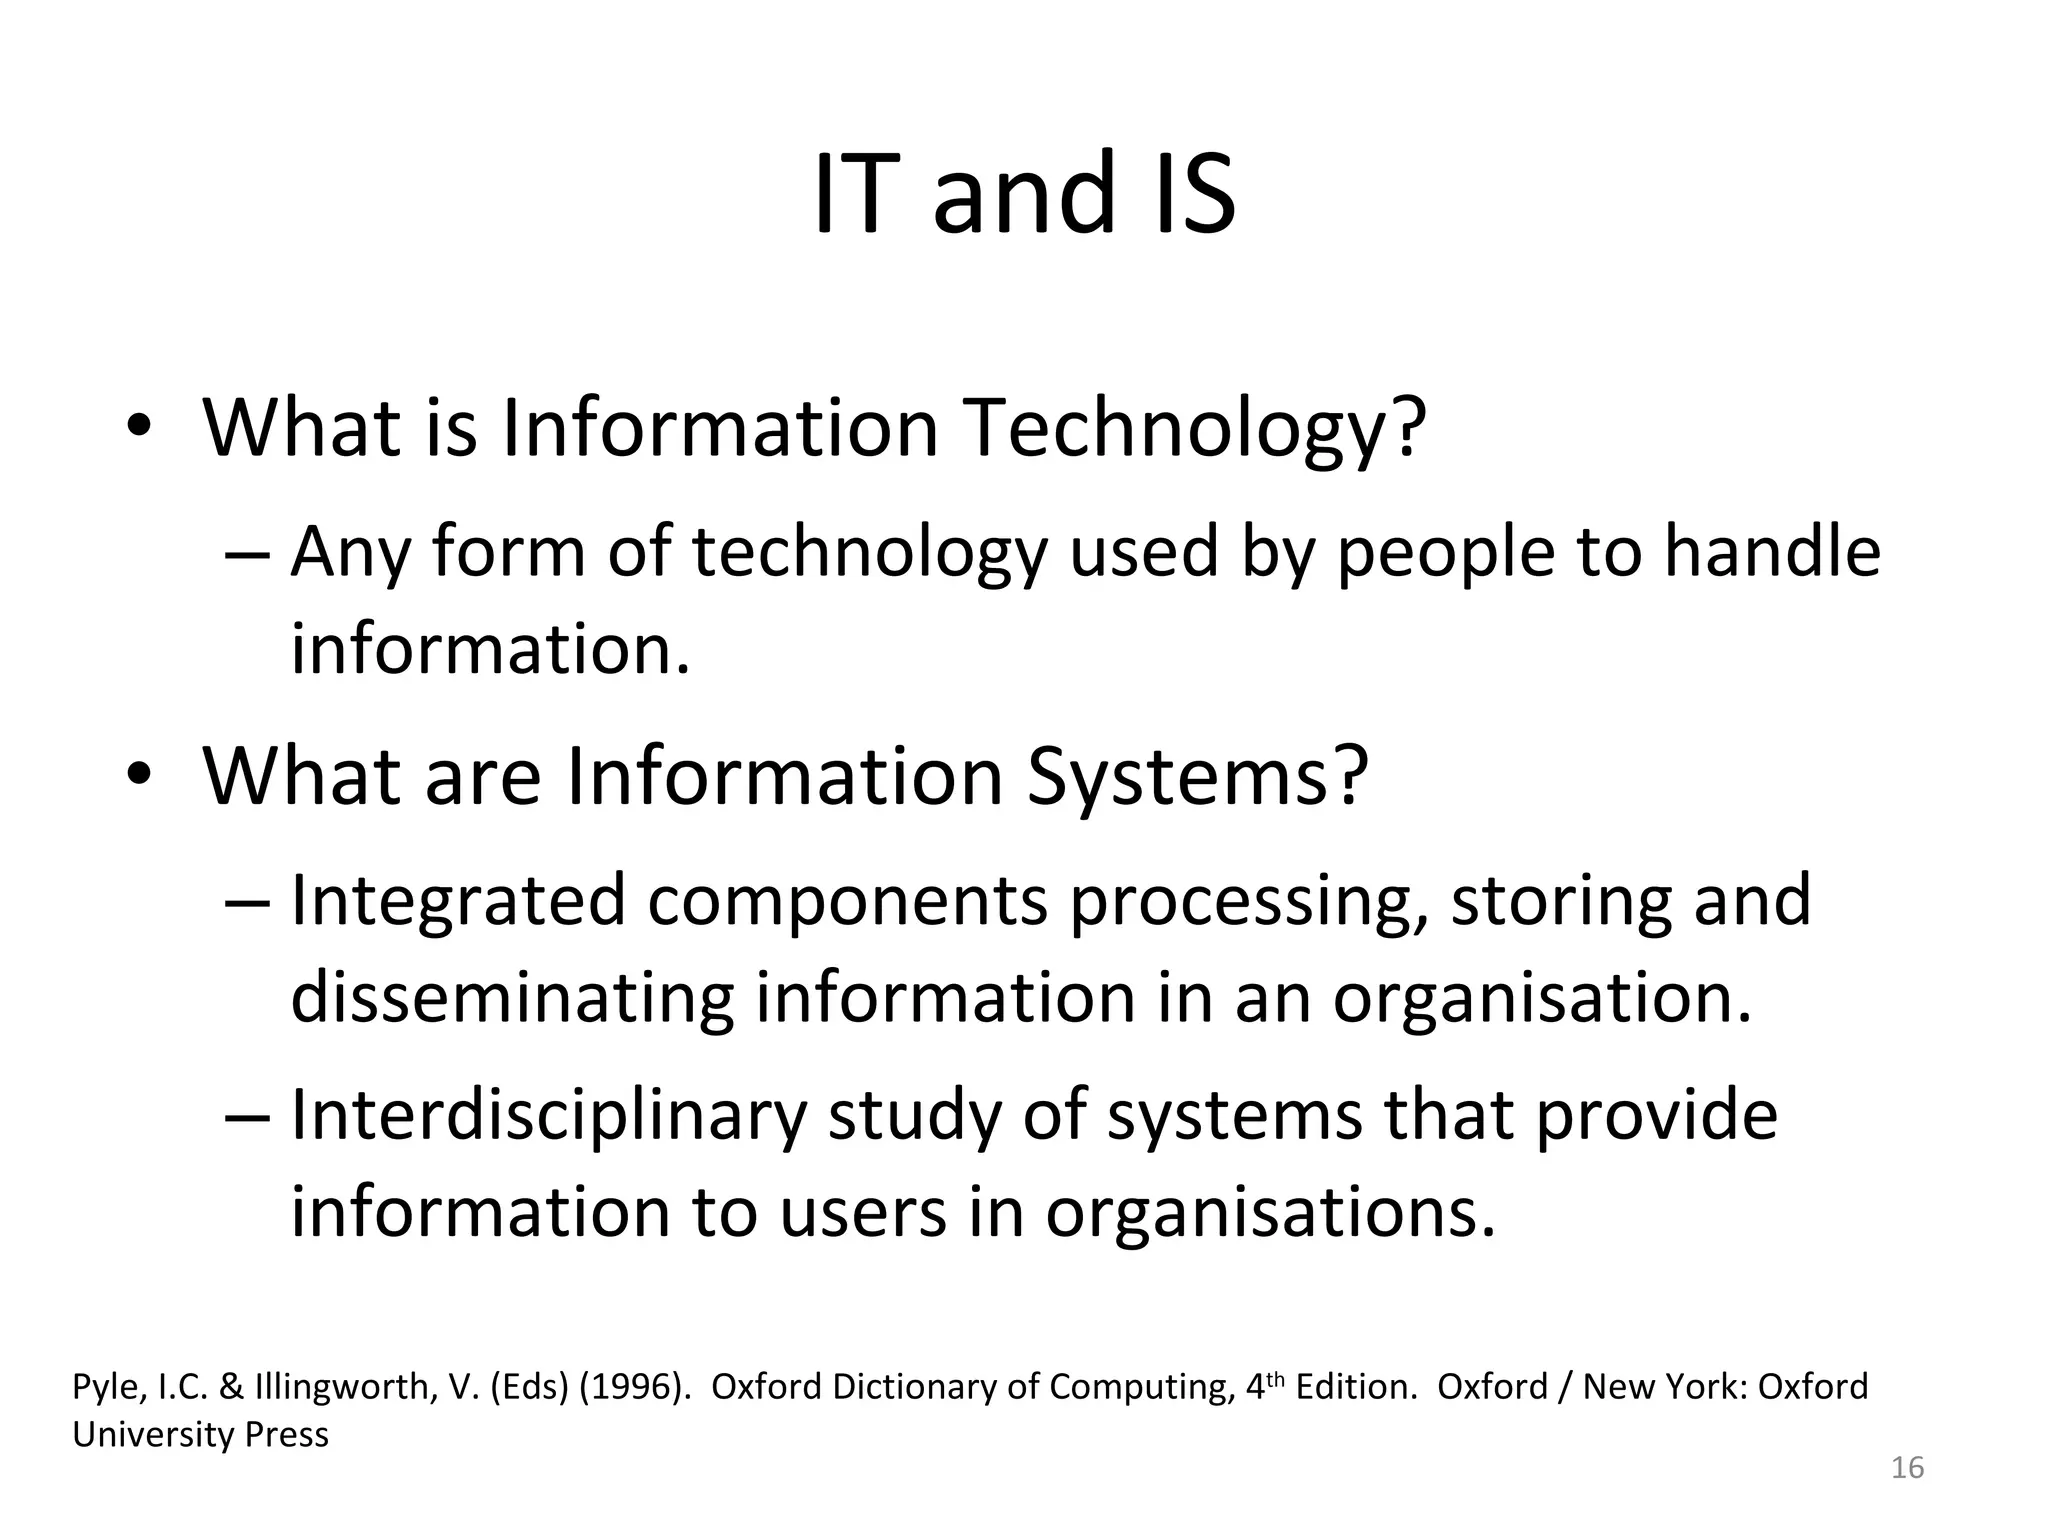
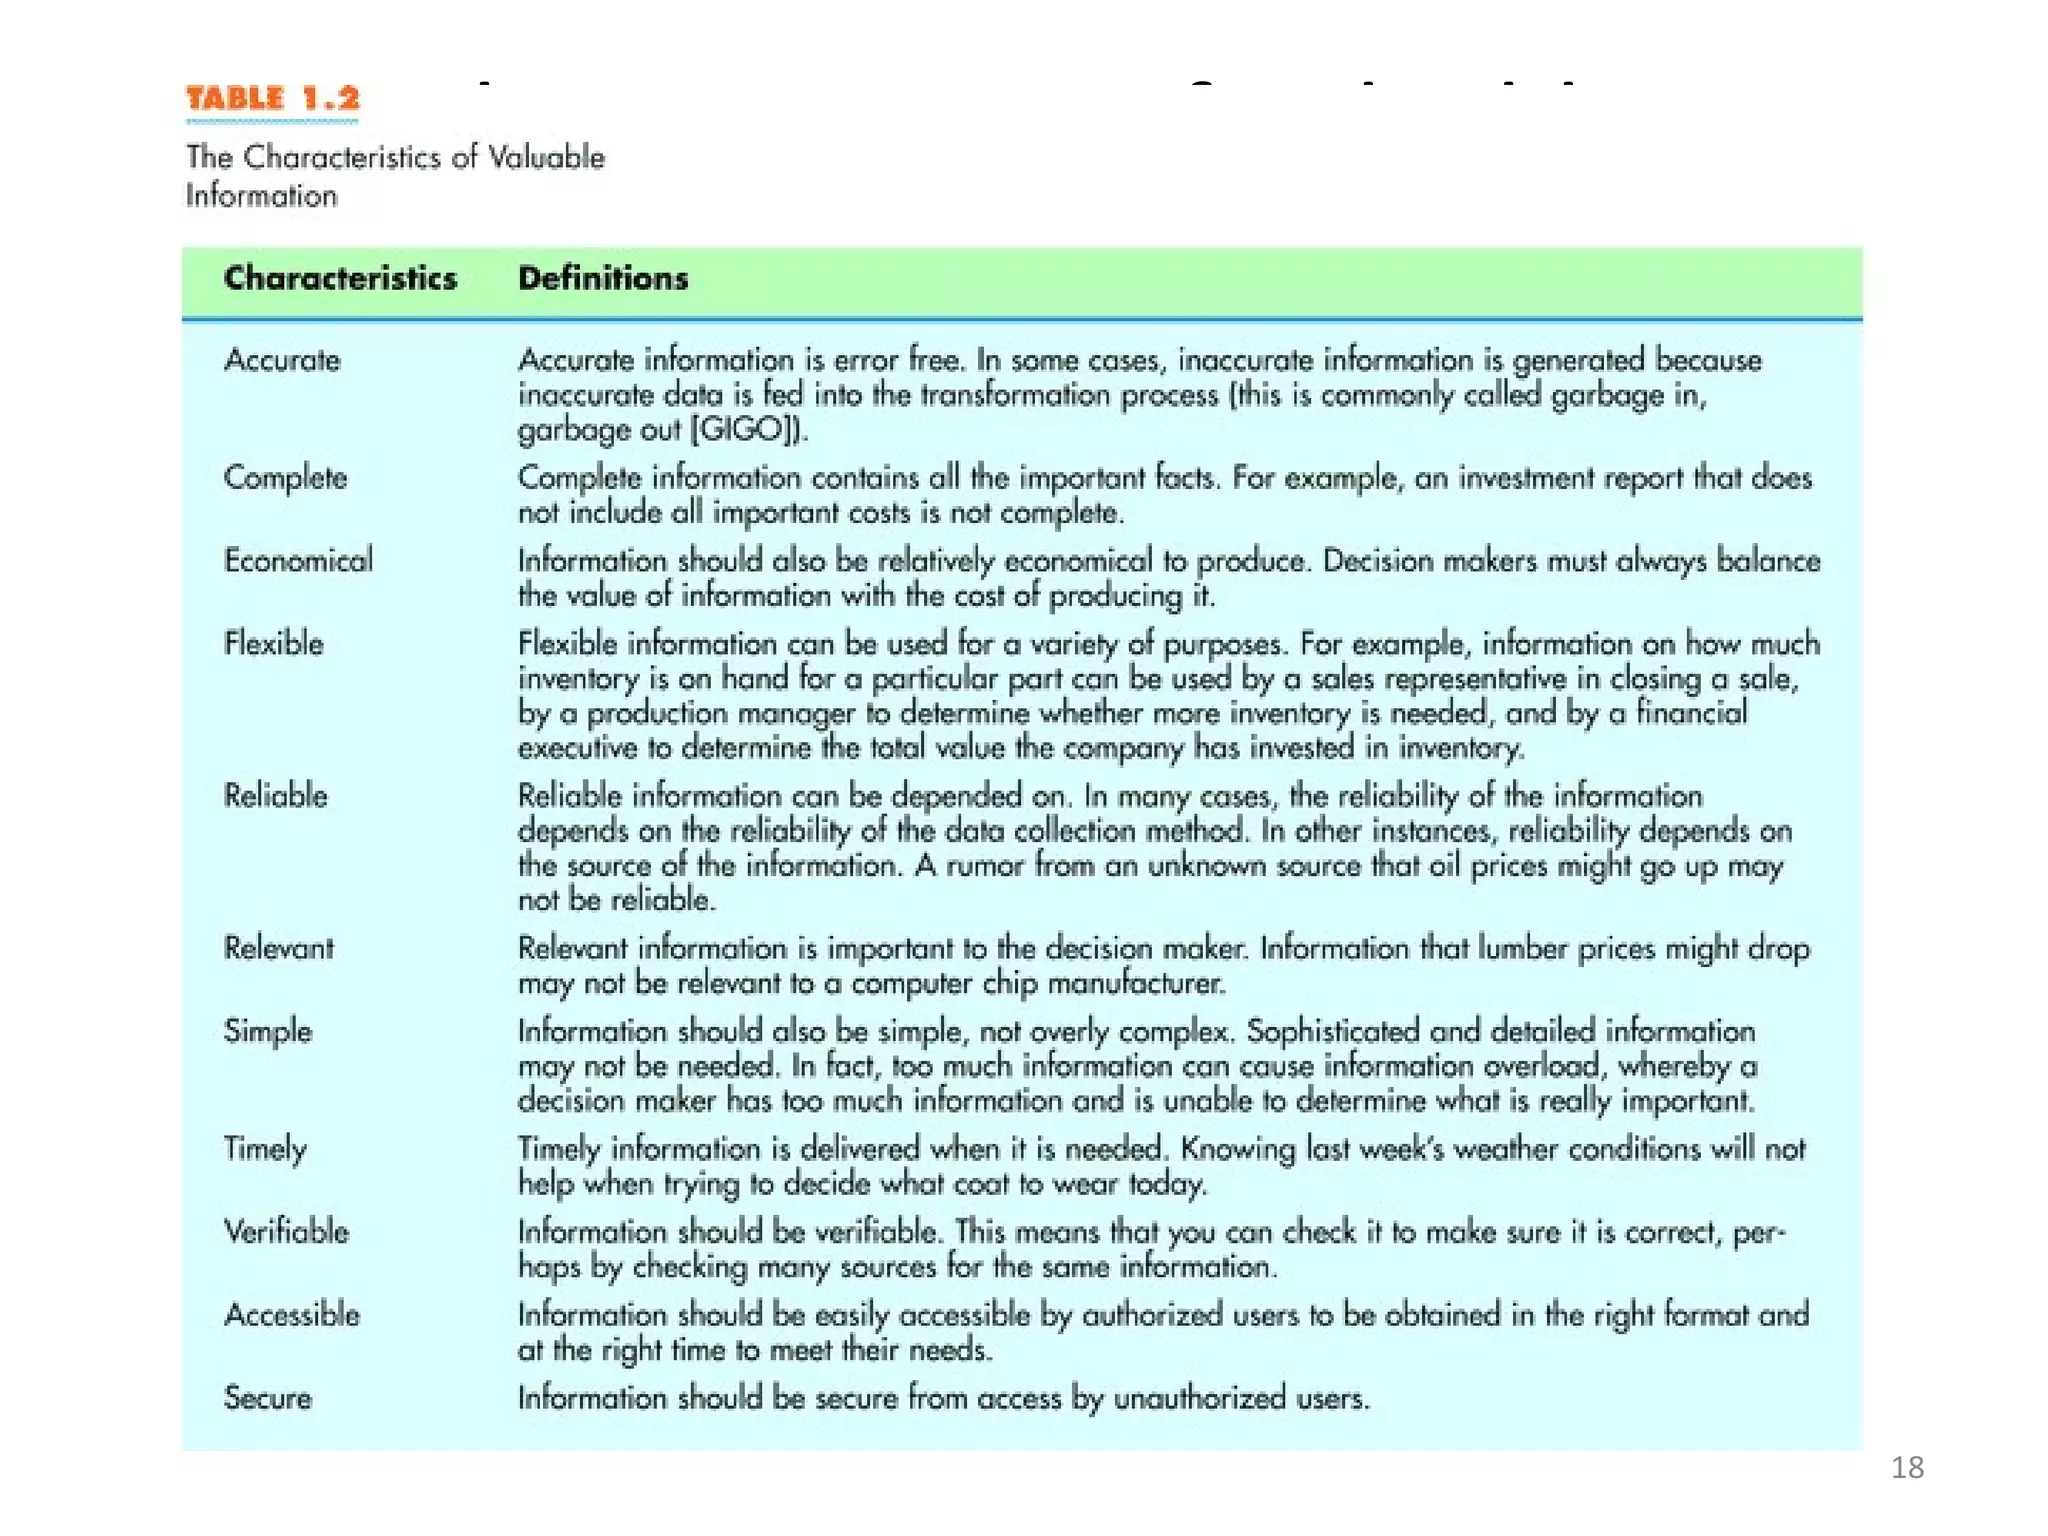
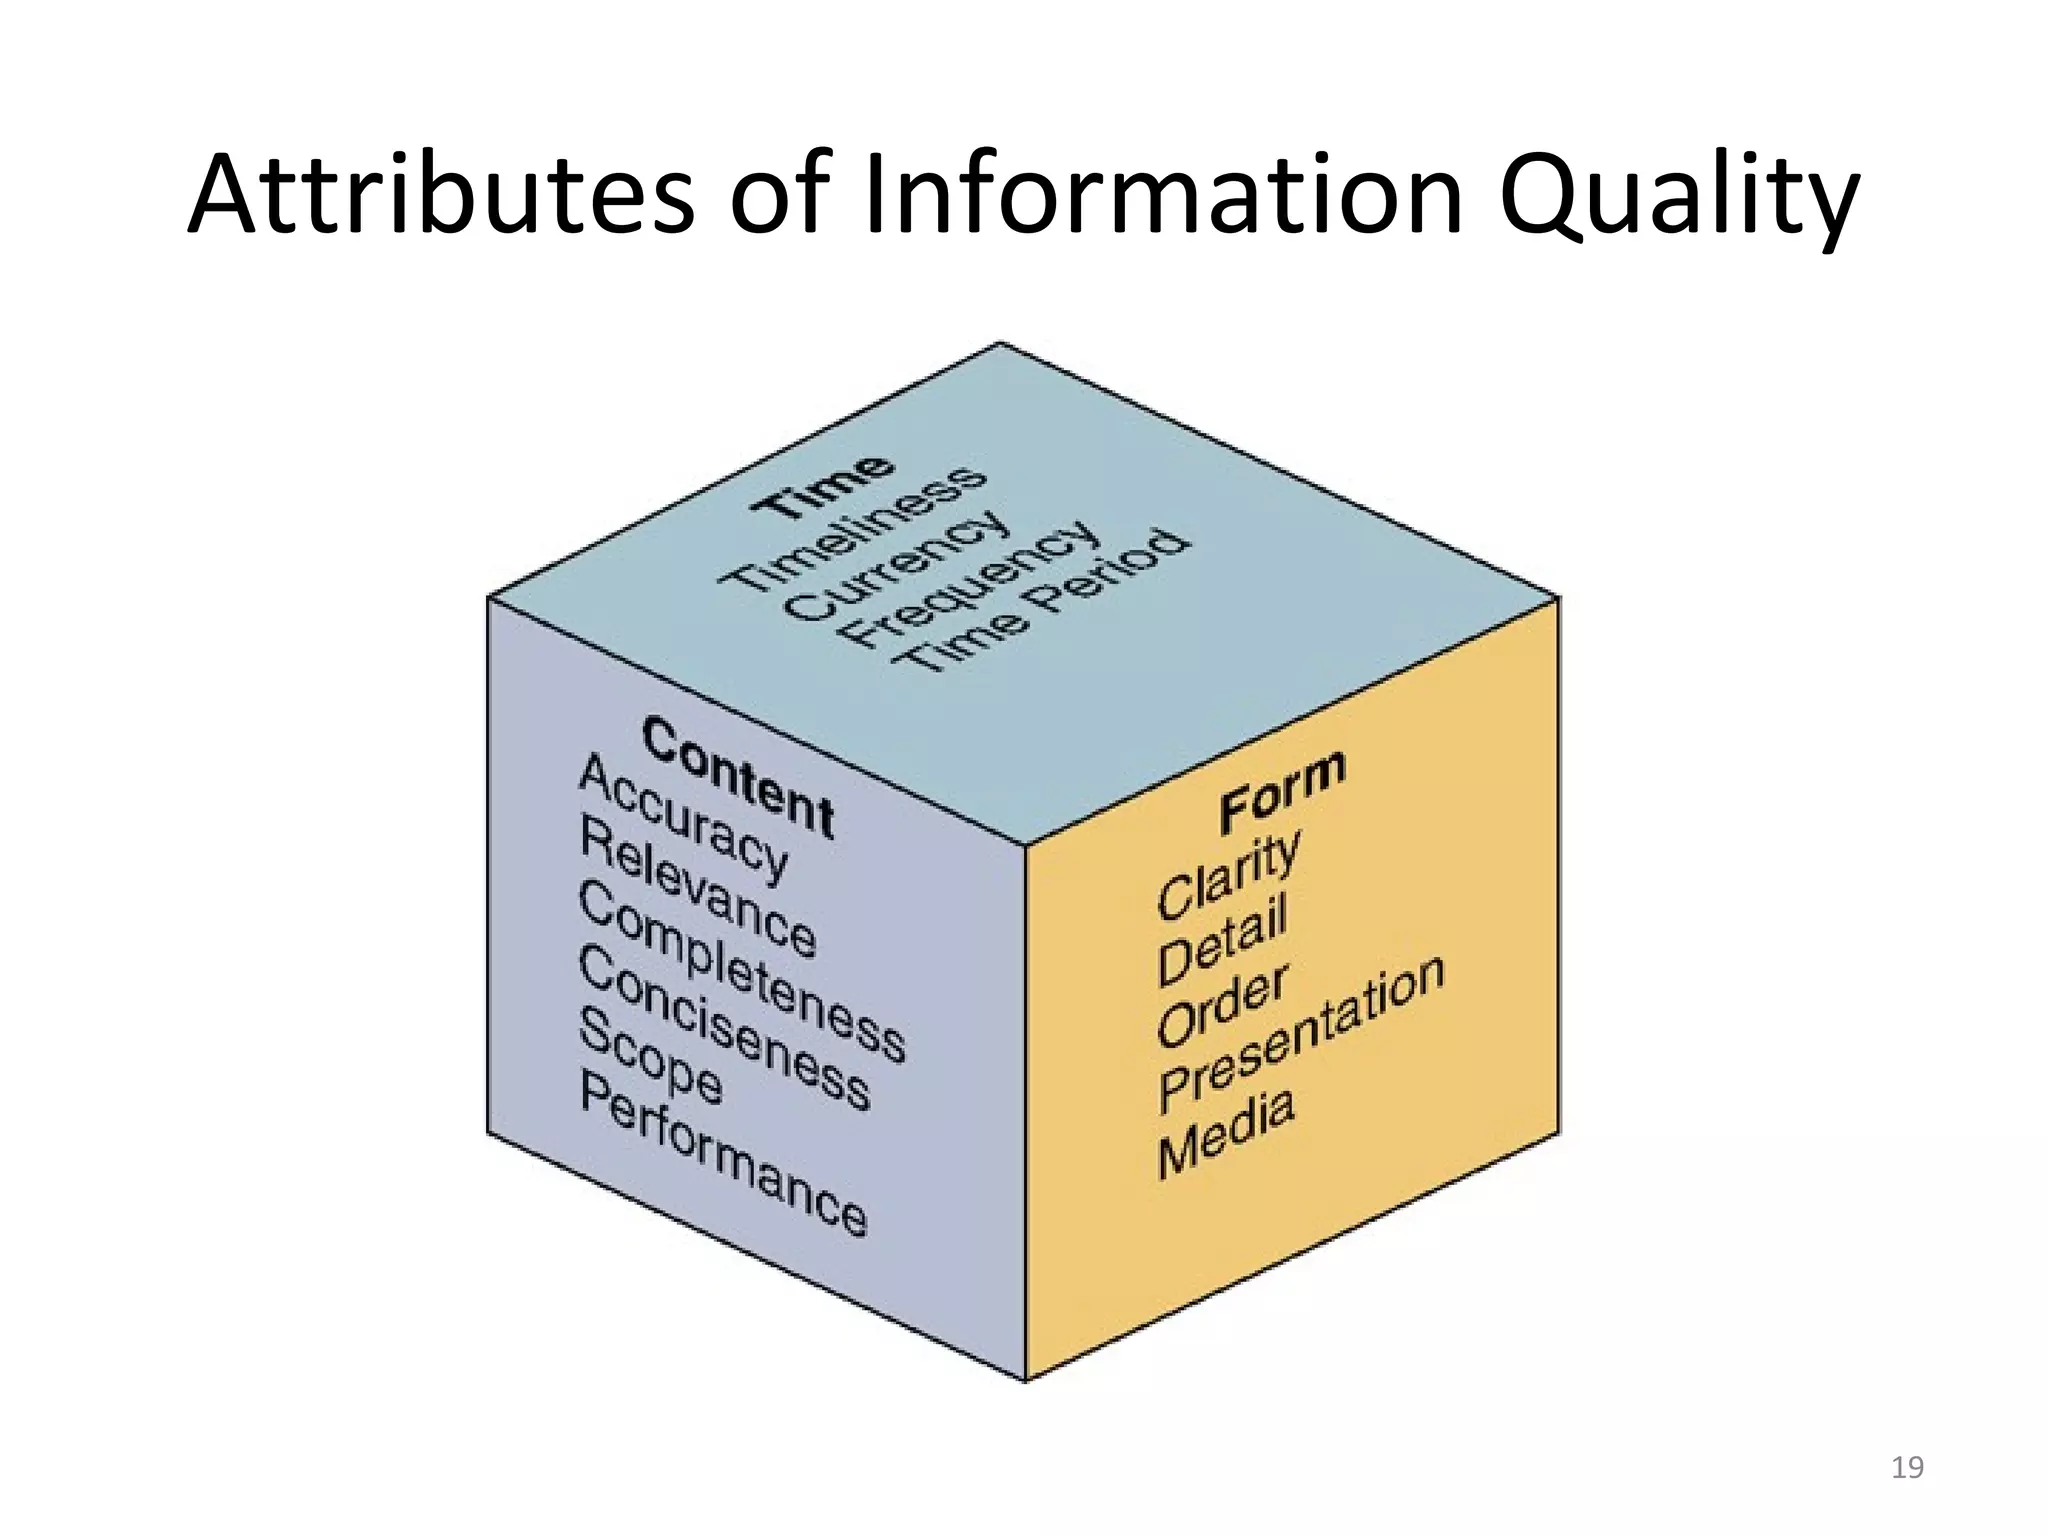
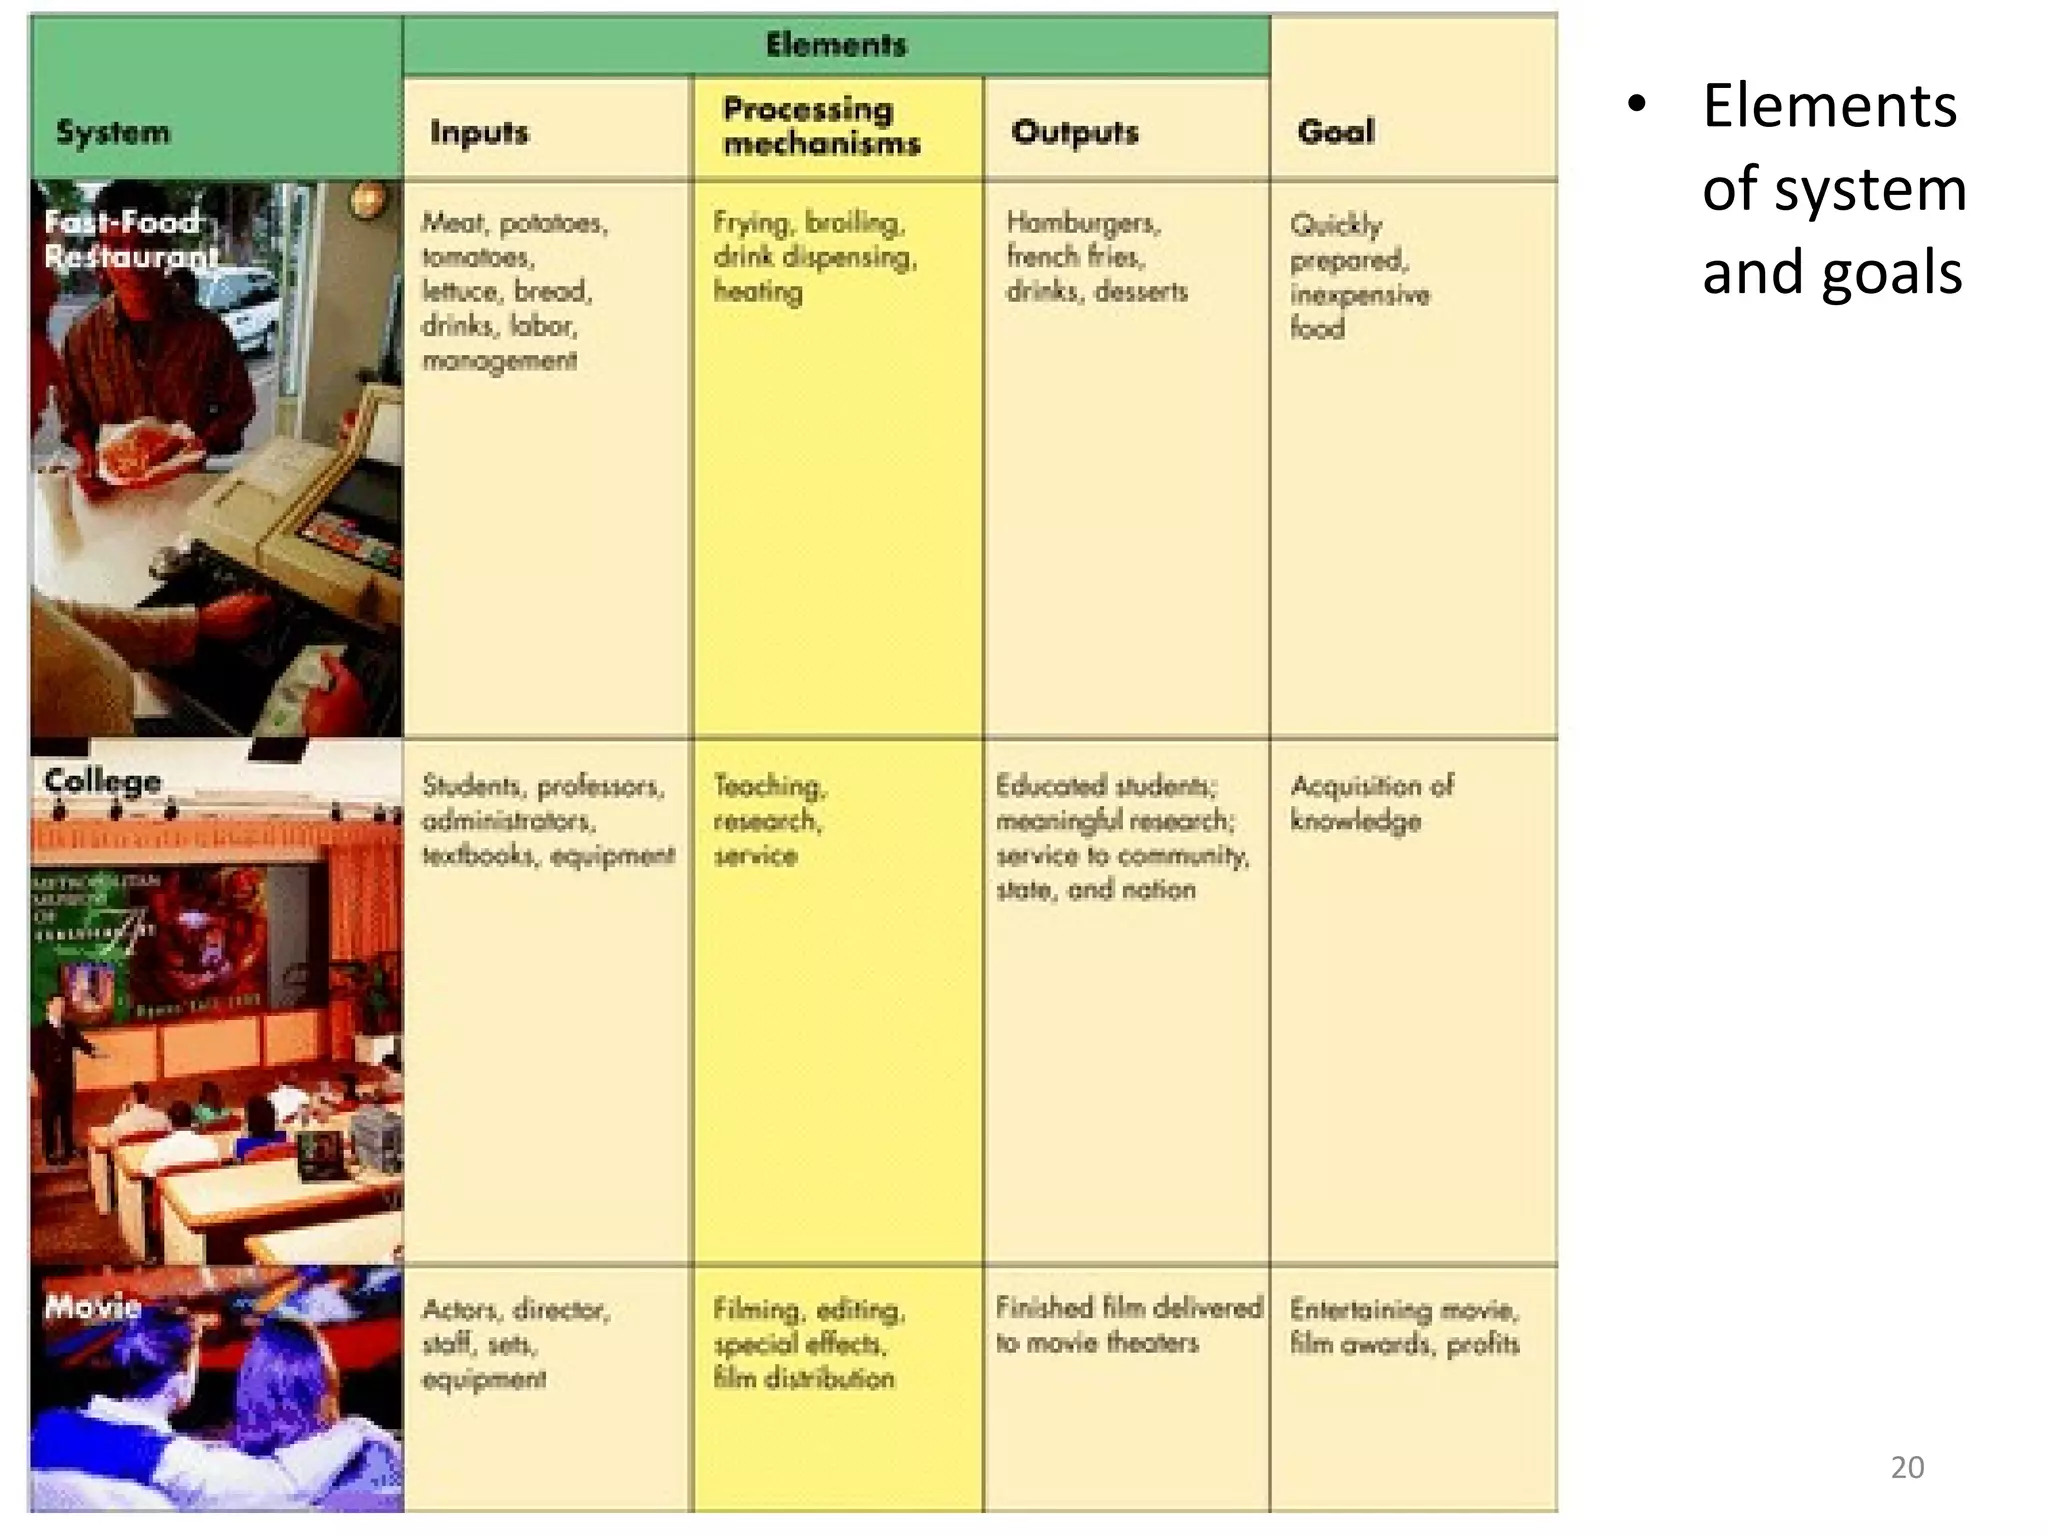
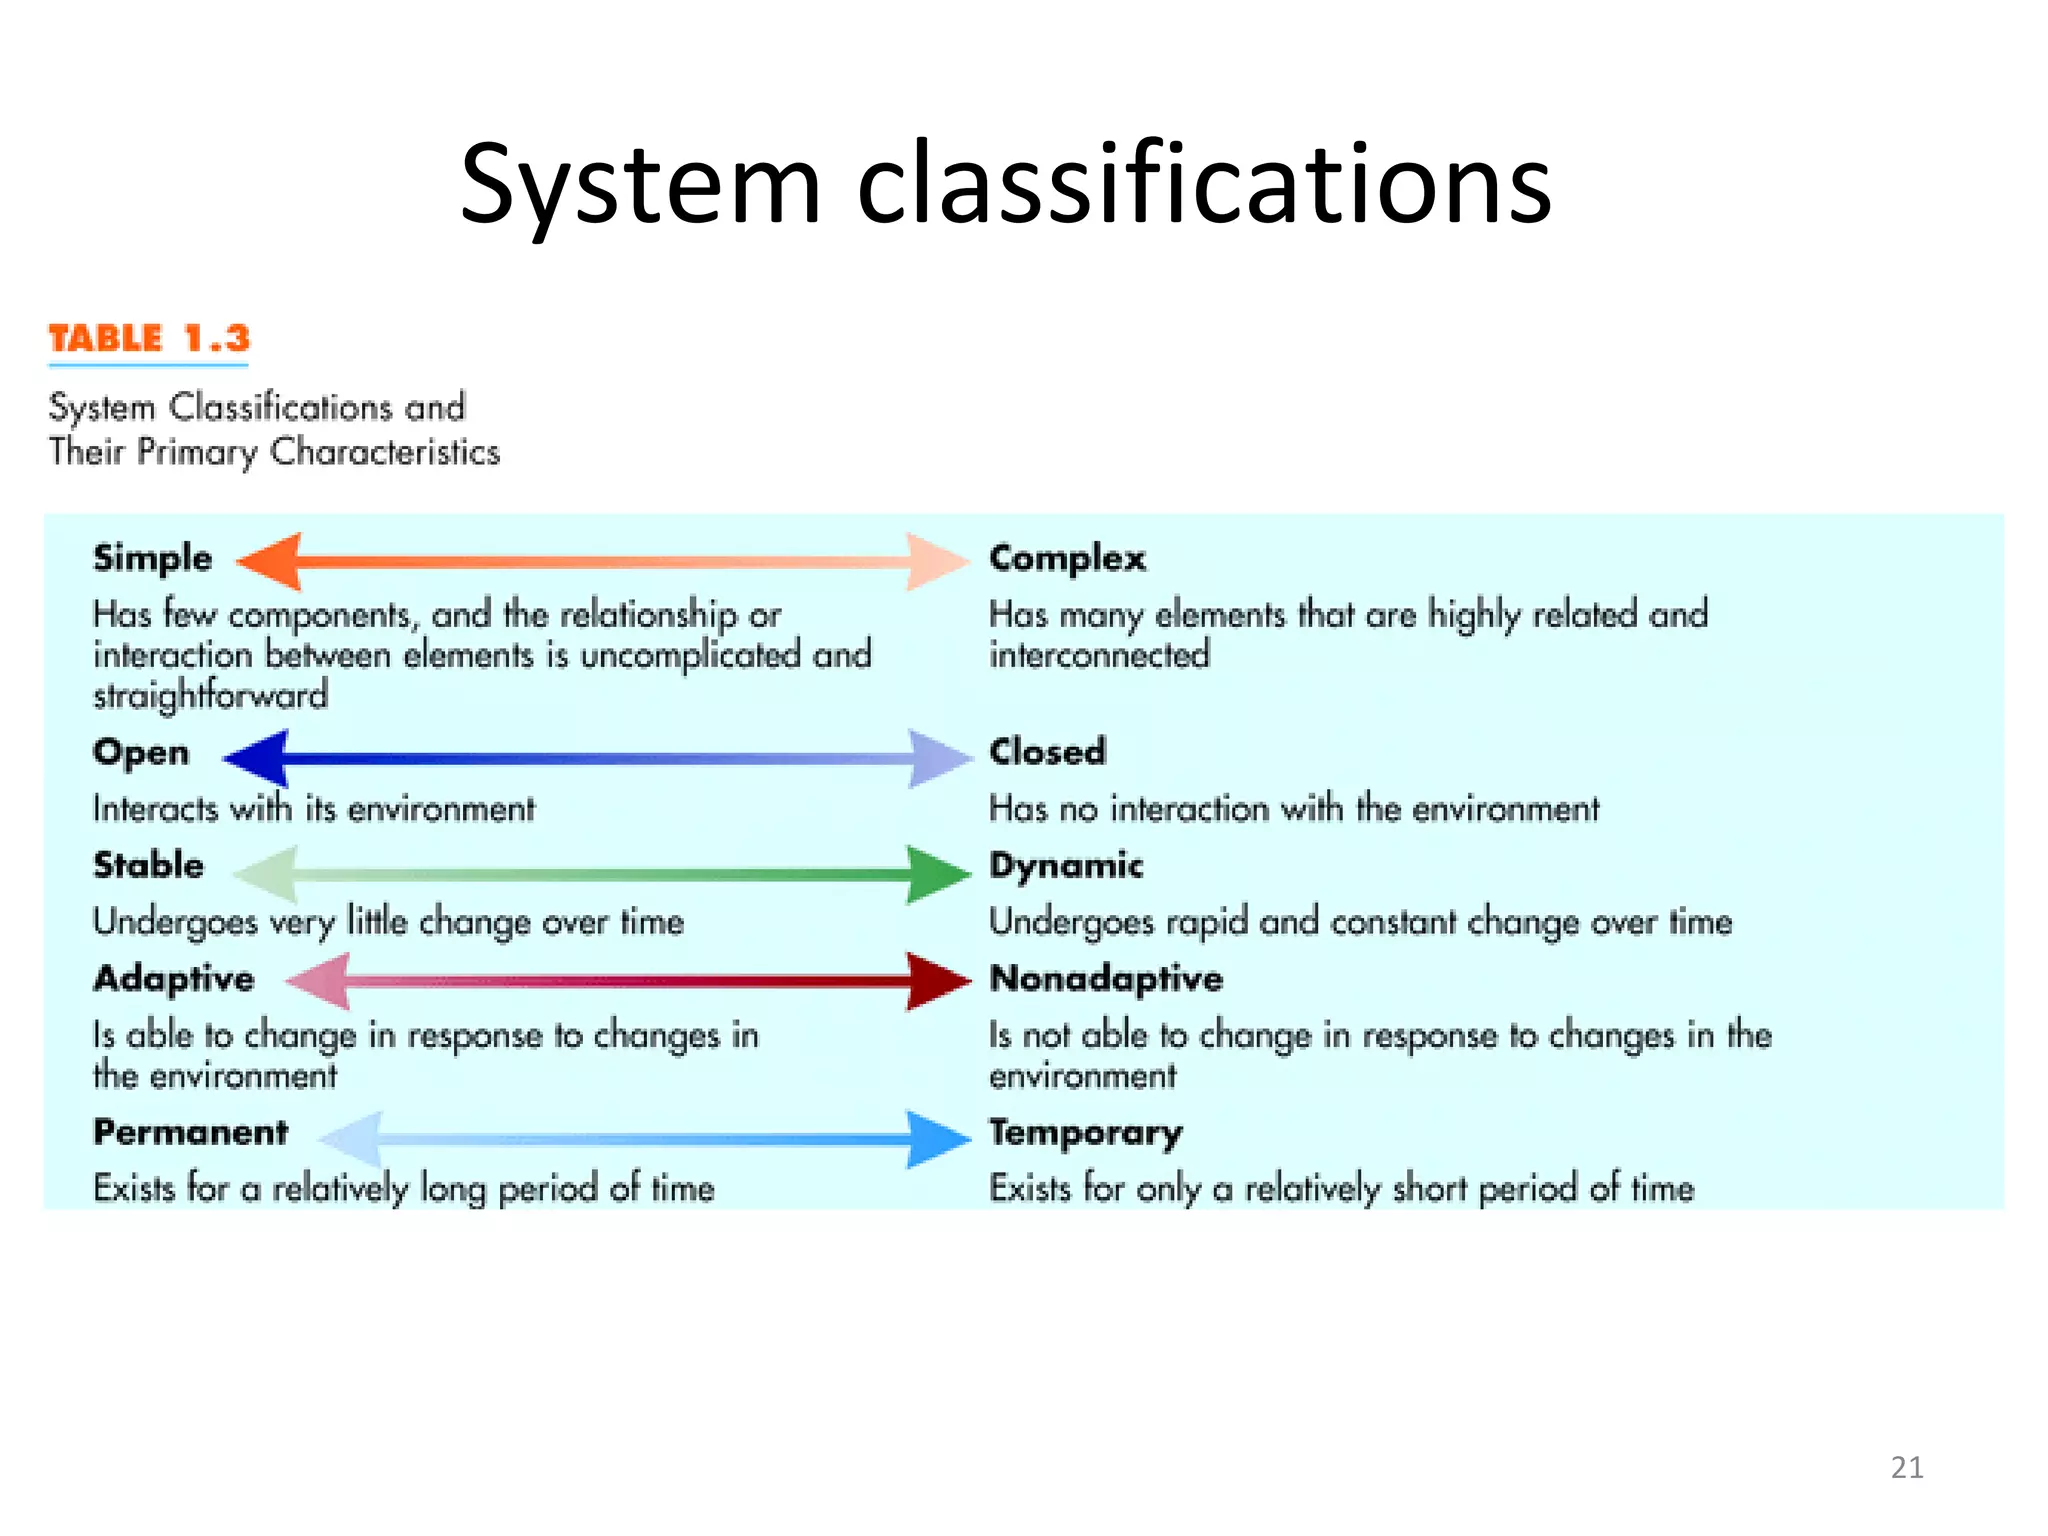
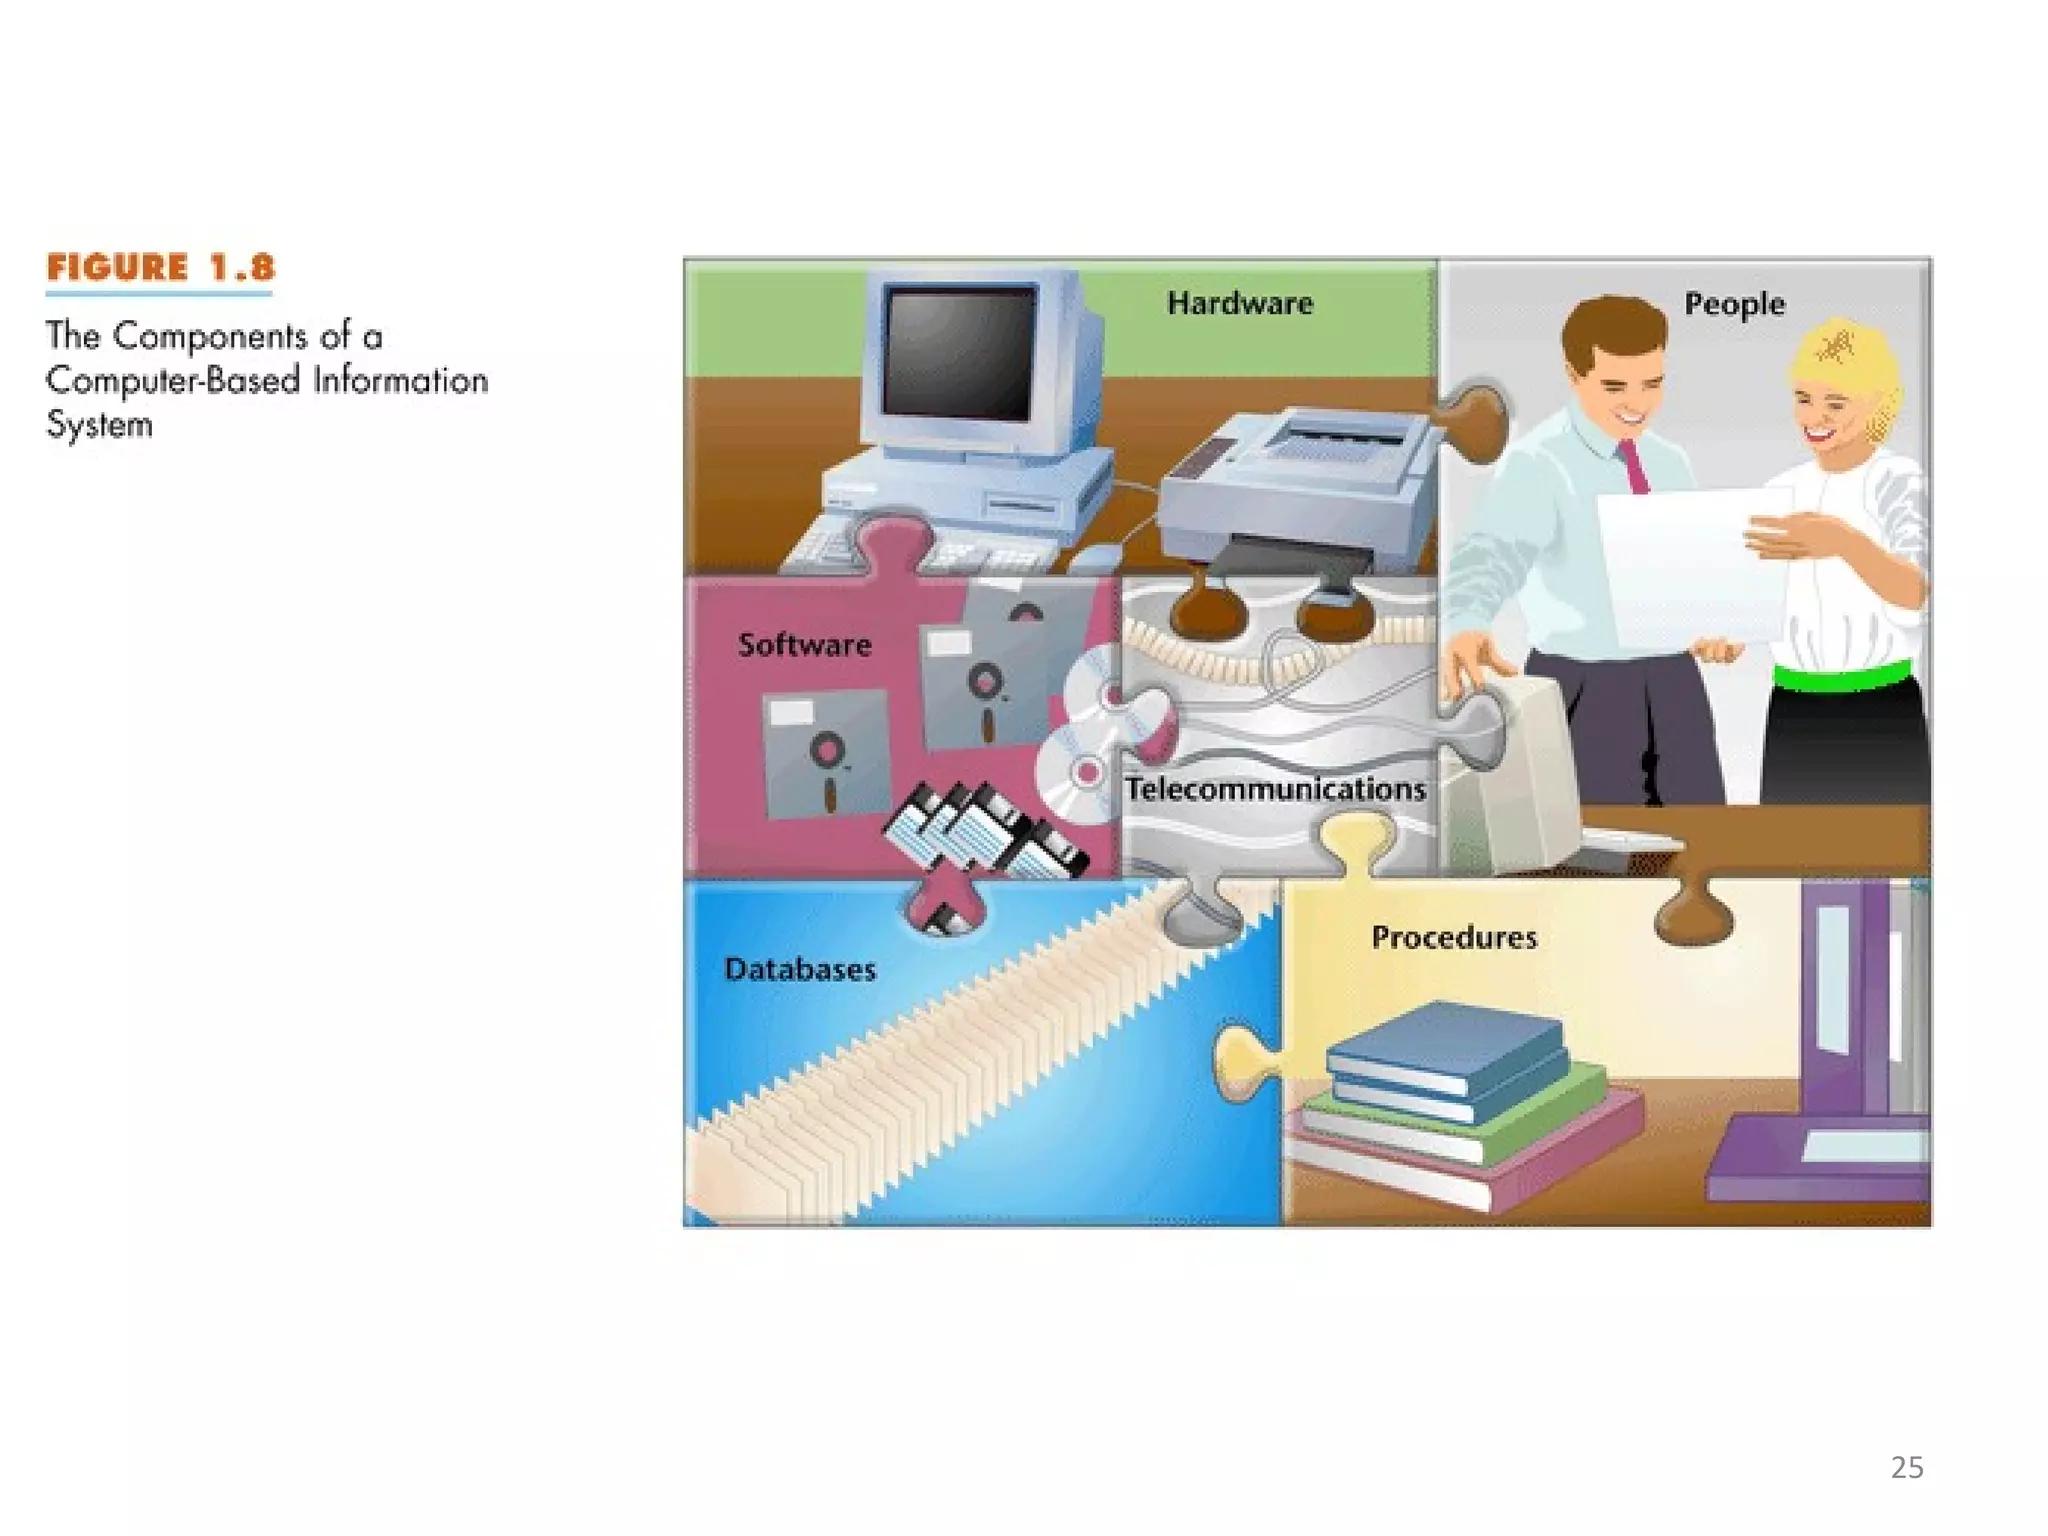
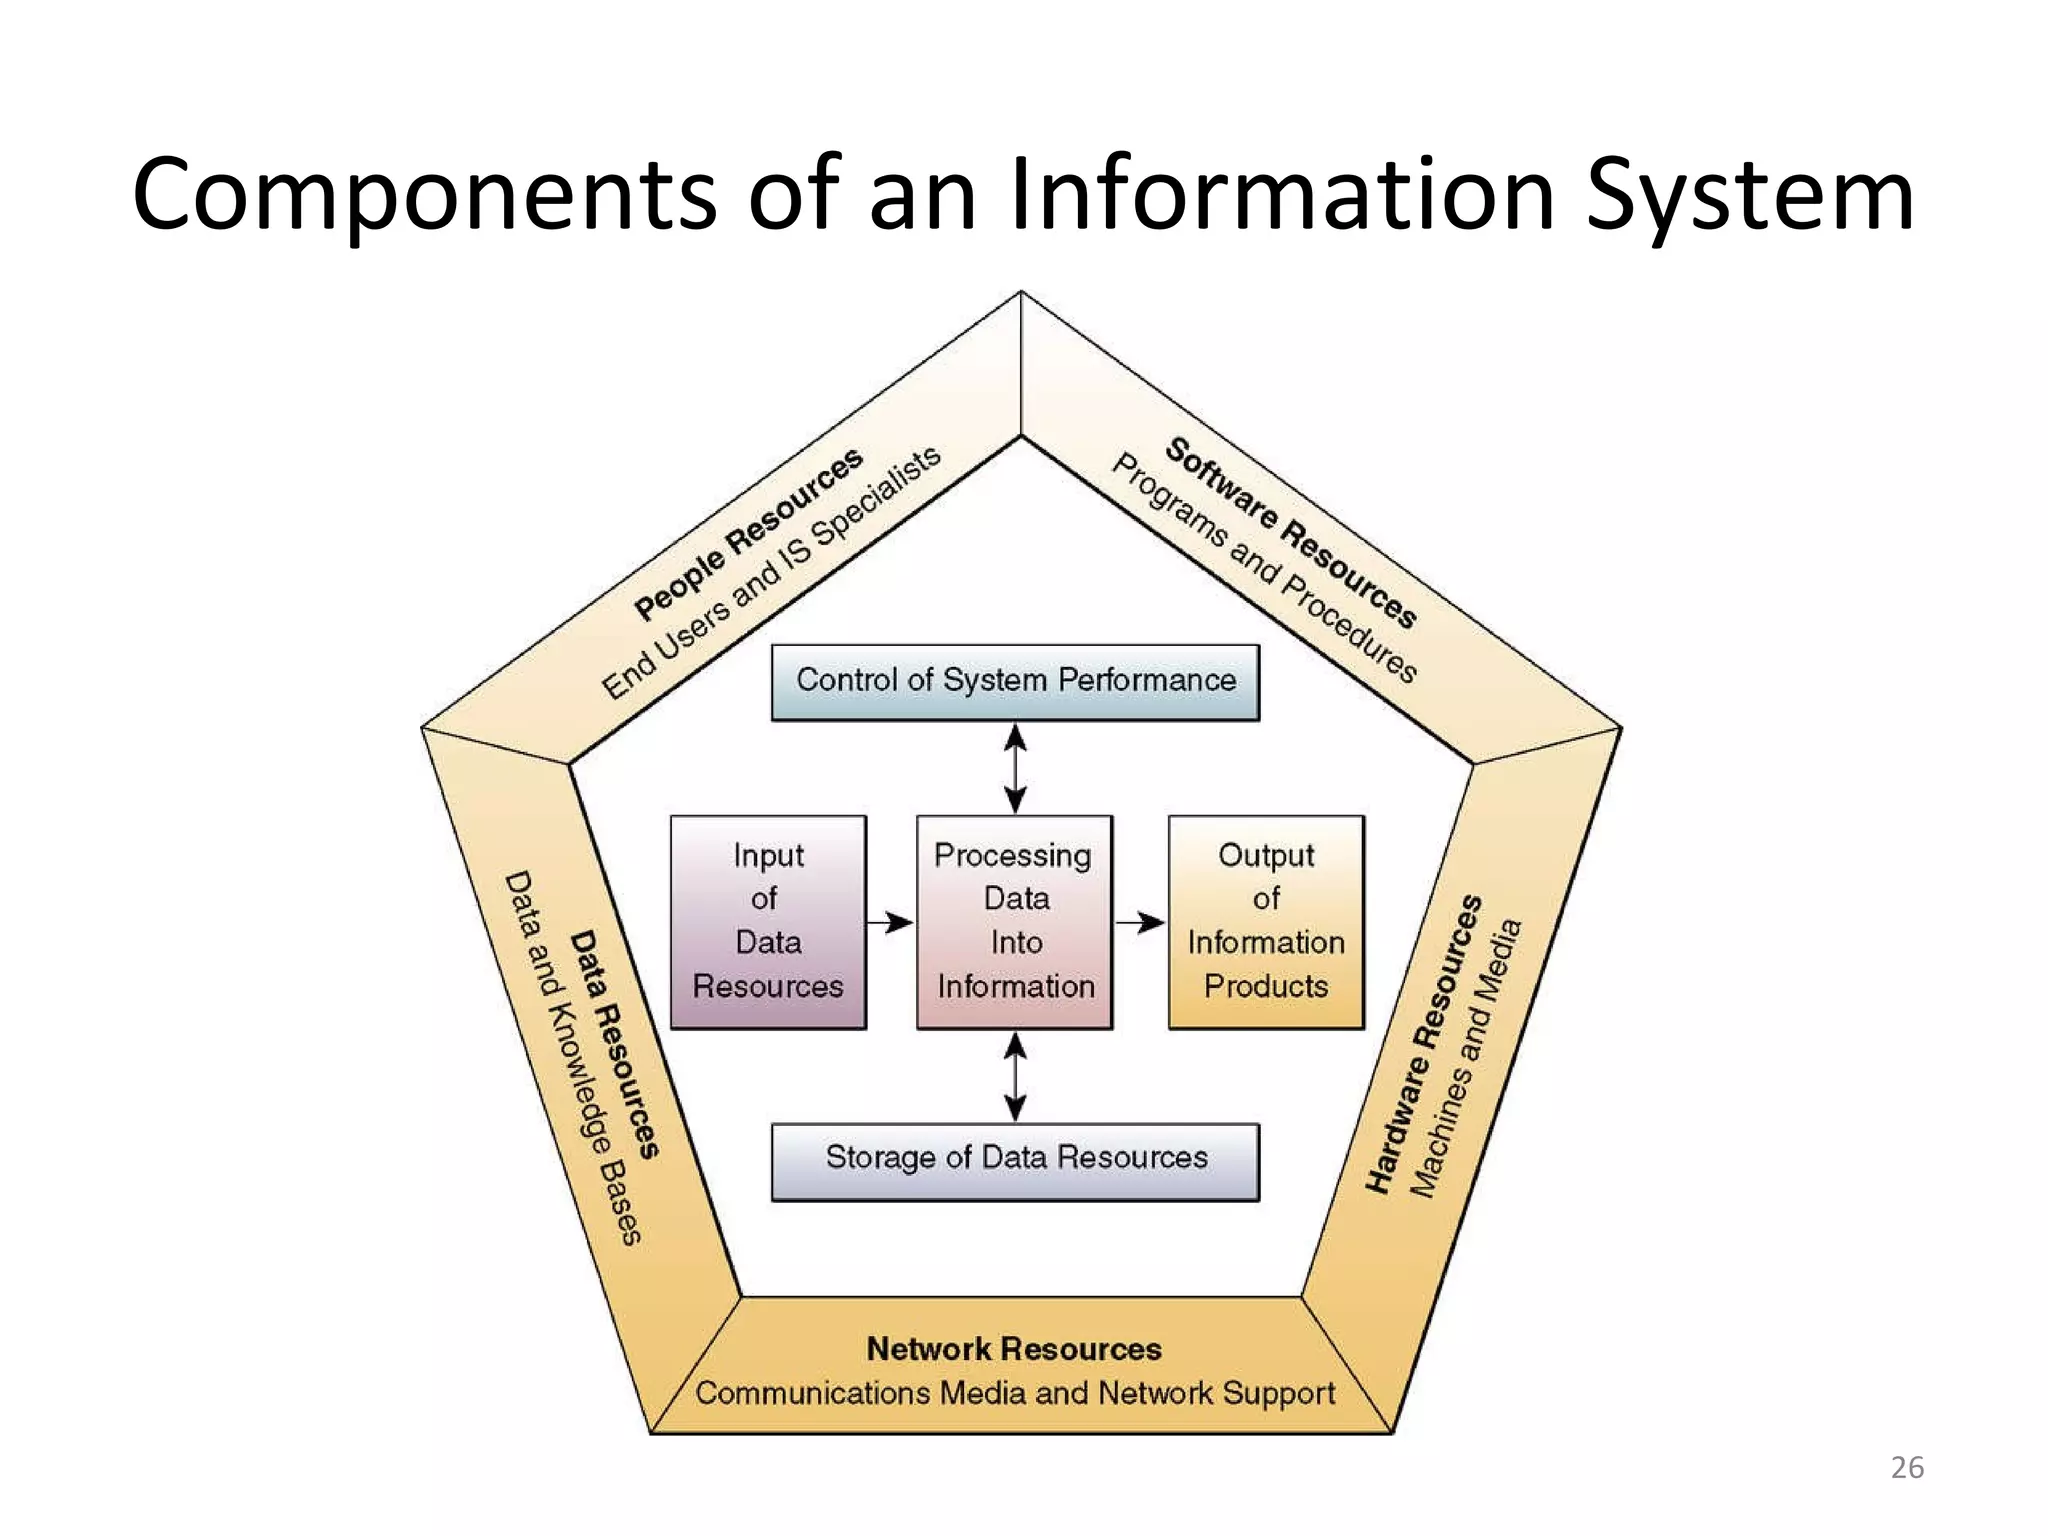
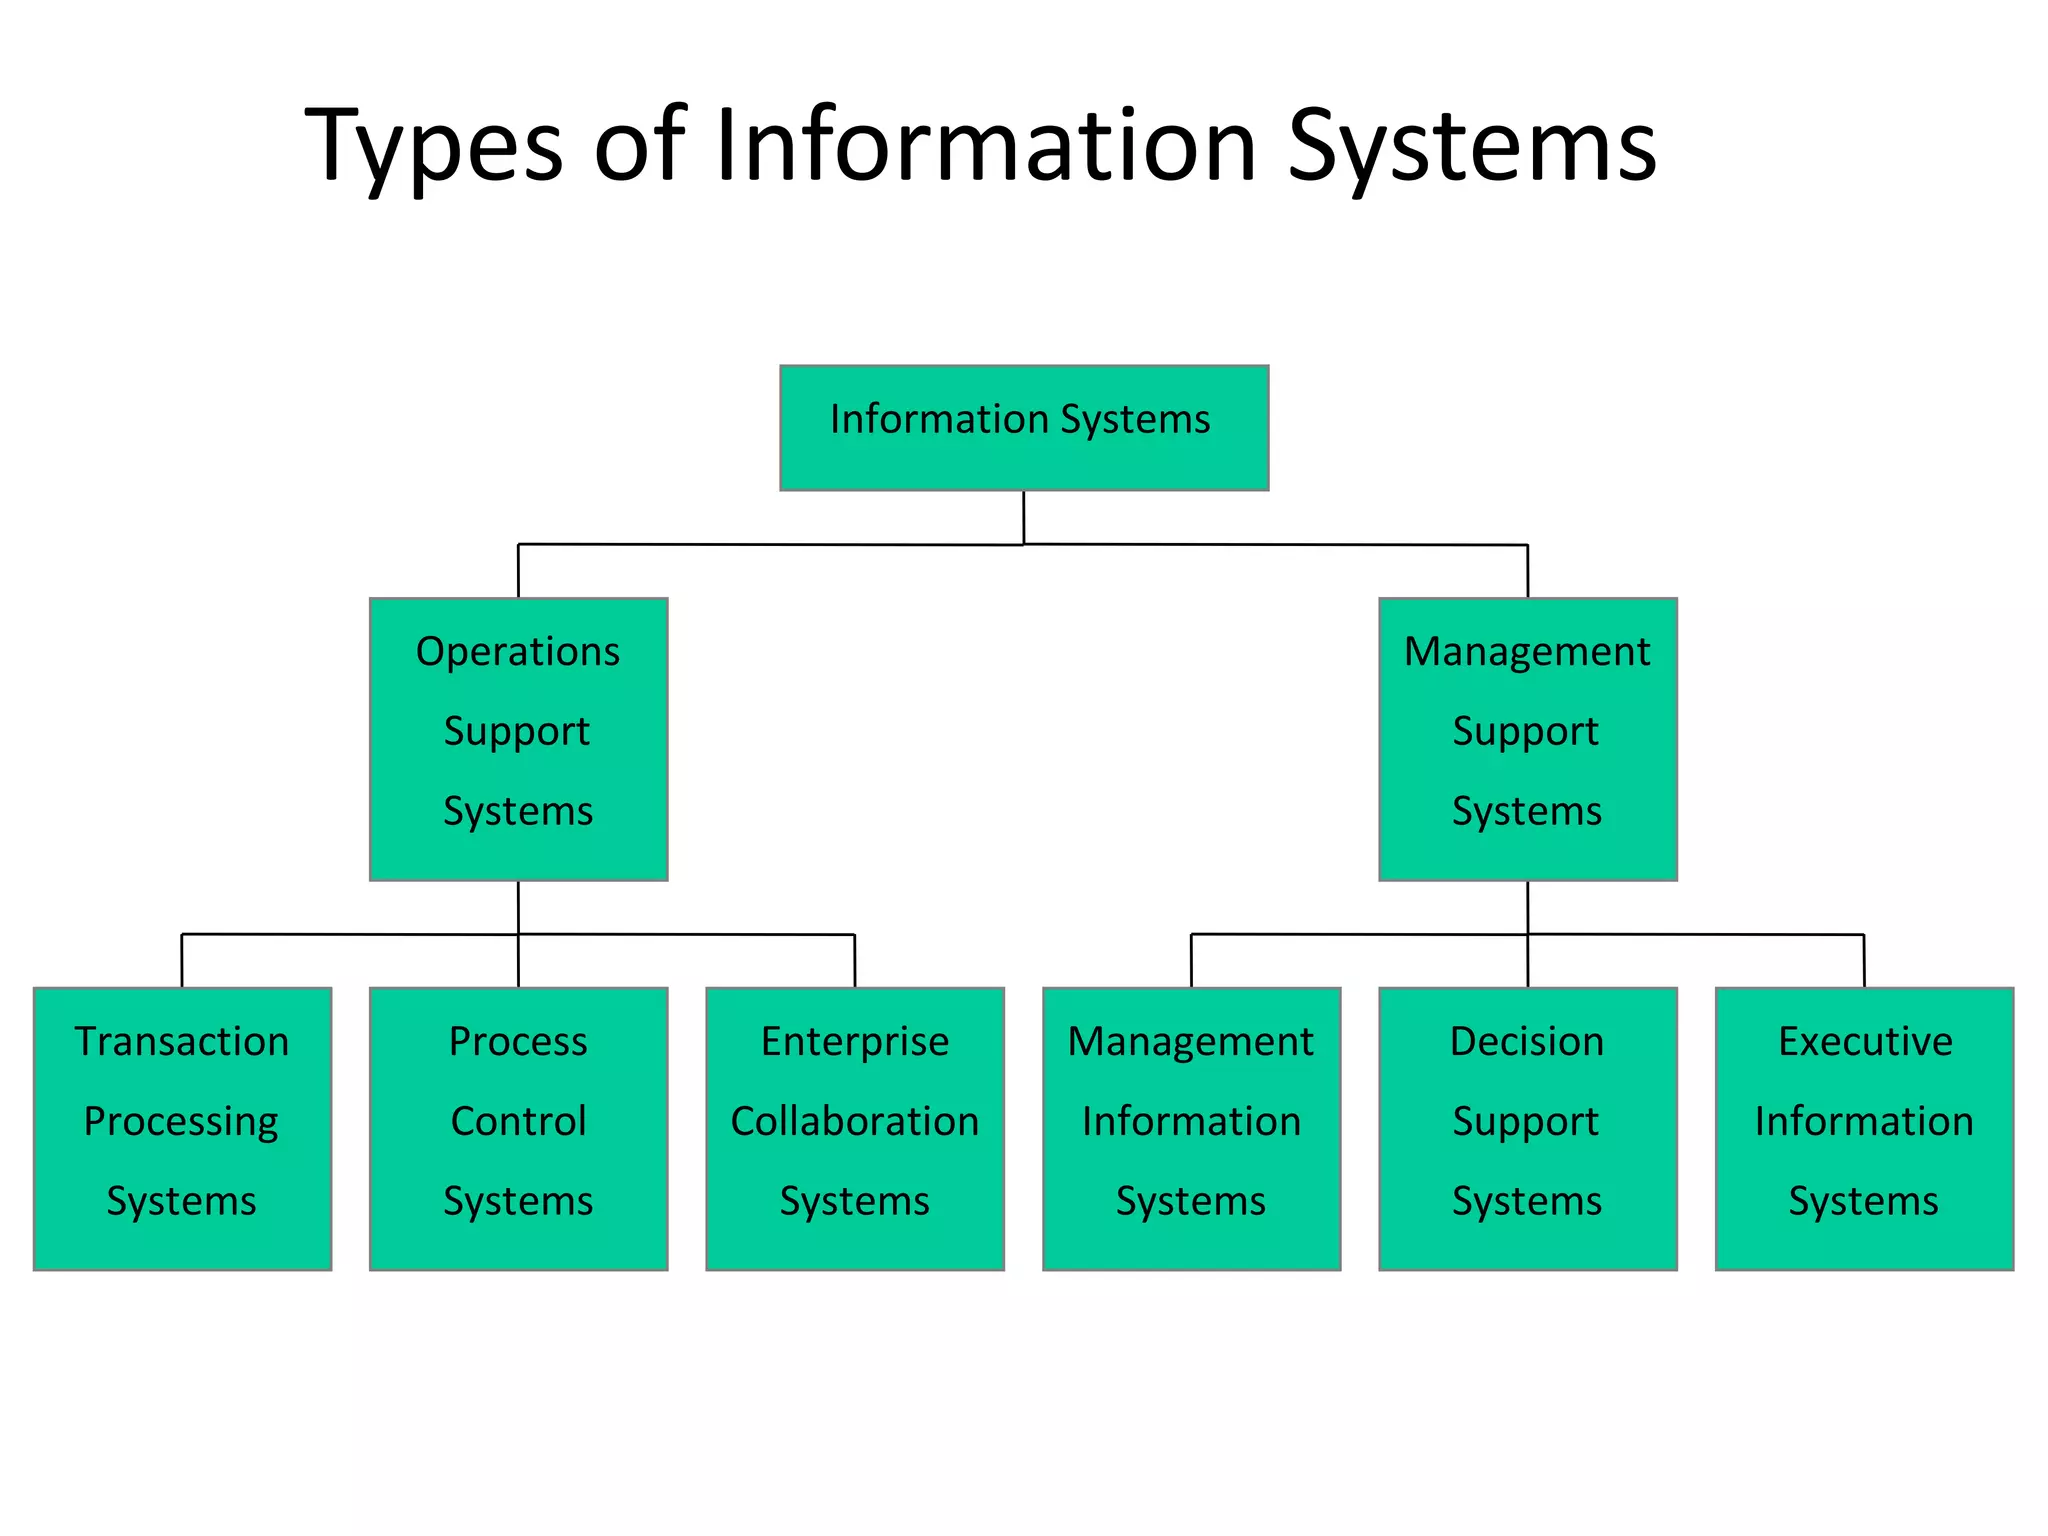
11. System concept Manufacturing Process Input of Raw Materials Output of Finished Products Environment Other Systems Control by Management Control Signals Control Signals Feedback Signals Feedback Signals System Boundary
29. Information Economy 0% 10% 20% 30% 40% 50% 60% 70% 1900 1910 1920 1930 1940 1950 1960 1970 1980 1997 YEAR % SERVICE % WHITE COLLAR % BLUE COLLAR % FARMING
30.
31. Business Processes Information Processing Activities Business Value Management Activities Supply Chain Management Enterprise Management Customer Management Knowledge Management Data Collection and Storage Transformation Into Business Systems Dissemination Planning Coordinating Controlling Modeling and Decision Making Firm Profitability and Strategic Position Figure 1-4 WHY INFORMATION SYSTEMS?
32. Major Roles of Information Systems Support of Strategic Advantage Support of Managerial Decision Making Support of Business Operations
33. TOWARD THE DIGITAL FIRM The Interdependence Between Organizations and Information Systems
35. Types of Information Systems Transaction Processing Systems Process Control Systems Enterprise Collaboration Systems Operations Support Systems Management Information Systems Decision Support Systems Executive Information Systems Management Support Systems Information Systems
36. Other Categories of Information Systems Expert Systems Knowledge Management Systems Functional Business Systems Strategic Information Systems Cross-Functional Information Systems
37.
38.
39.
Editor's Notes
The terms data & information are often used interchangeably. However, there is an important distinction: information is value-added data. Data is processed, organized or transformed to become information. Data are raw facts. For example, if you write down your age & grade on an English test & hand it to me, I see 2 numbers – raw data. However, if you include the average age and average test score for your class, the data would have some meaning to me as a teacher… it would become information. Interestingly, your name and grade – data to me- could very well be information to you. In the context of your life or experiences, those 2 numbers alone would most likely have meaning. Similarly, a grocery store manager would most likely find a list of every item sold today to be of little use – it is data. However, the amount that the store’s total sales are over or under planned sales would be information.
Data can be thought of as the pieces of track for a model railroad. Each piece alone has little value. However, when pieces are combined according to certain rules or relationships, a useful railroad layout emerges. Individual pieces of data have little use. However, they become useful for specific purposes or in certain contexts when combined or processed by certain rules or relationships.
Data can exist in many forms. Although we usually consider data to be numbers or letters, it increasingly consists of images, sounds and video. The growing use of multimedia applications have created new challenges in storing and manipulating data that isn’t alphanumeric.
The set of related tasks that turn data into information is called a “process”. “Knowledge” is necessary to process data into information, or define the rules and relationships needed to turn data into useful information. Knowledge is an understanding of how a given set of data can be turned into information useful in a specific context. Knowledge also involves being able to identify which facts are necessary and which aren’t. For instance, imagine we have a list of IS classes taught at your school. The list itself is raw data – we can’t really use it for anything but a list of classes. Someone scheduling classes has the knowledge of how many sections of each class should be taught each semester, how many instructors there are for each course, how many students should be in a class, when classes should be scheduled, etc. Applying this knowledge to the list of IS classes creates the schedule for the semester – useful information to students and teachers. Data can be converted into information by people or computers. For instance, although the ‘scheduler’ might be a person, it could also be a computer program.
Information Systems: interrelated components working together to collect, process, store, and disseminate information to support decision making, coordination, control, analysis, and visualization in an organization Information Technology: the foundation upon which IS are built.
IT infrastructure is the foundation upon which IS are built.
Information is a vital asset to individuals & businesses. As with any asset, users of information expect it to have certain characteristics or value. Different attributes may be more important than others for different kinds of information. For example, information presented to the IRS would need to be very accurate, complete, timely, verifiable and reliable. However, it would not need to be very flexible or simple. On the other hand, a report to stockholders would need to be accurate, timely, complete, reliable and simple, but verifiability may not be as important as for the IRS. There are also trade-offs among data characteristics. For instance, the most reliable, accurate, verifiable and secure information generally will not be the most economical to produce. There is also a trade-off between accessibility and security; security and flexibility, etc.
The parts of a system include inputs, processing mechanisms, outputs and feedback. Feedback is a type of output that is used to improve the input, processing and output elements of a system. A system boundary defines the system and distinguishes it from its environment. The way elements are arranged in a system is called the system configuration. When defining the configuration, it is essential to understand the goal(s) of the system. Systems are everywhere we look. Consider your college or university. Inputs to the “College system” would include students, professors, administrators, texts, & equipment. The system boundary might be the campus. The goal of the system would be the acquisition and dissemination of knowledge. With that goal in sight, system components are configured (e.g. professors teach courses online or on-campus; there are specific degree programs set up; faculty and students engage in specific research projects). One of the processing mechanisms of the “college system” is teaching. The output of that process is educated students. Feedback to the professor in that process would include course evaluations. Feedback to students would include grades. Read through the other examples in figure 1.3.
Each system can be characterized along a wide range of various characteristics. Organisations (which are systems) can usually be classified by these characteristics. For example, a college is a fairly complex, open, and relatively permanent system. Until recently, colleges and universities were somewhat stable. Lately, with the rapid changes in technology and globalization, universities are becoming far more dynamic and adaptive by having new course delivery modes (e.g. Internet courses), accepting web-based publications as evidence of faculty scholarship, and defining new student markets.
Its important to measure how a system performs. Efficiency is a ratio of what is produced to what is consumed. It ranges from 0 – 100%. Systems can be compared by how efficient they are. For instance, cars are often compared based on “miles per gallon” – a measure of how far a car can go on a gallon of gas. Effectiveness measures how well a system achieves its goals. It can be calculated by comparing actual performance to expected performance. For example, if a business’s webserver is supposed to be available 24 hours a day, but is offline for an hour a day, its effectiveness is 23/24 (96%). 24 hour availability could also be considered a performance standard for this system.
System performance standards are objectives set for a specific system. Effectiveness measures how well a system meets its objectives. In meeting performance standards, decision makers deal with system variables and parameters. Parameters are quantities or variables that the decision maker cannot control, such as the weather. Variables can be controlled. For instance, the price charged for your product is a variable.
Models are abstractions of reality. Since real systems (and the world) are complex & dynamic, we use models to understand or design systems. Models are simplified abstractions of systems. Models can be narrative (words), physical (like a prototype of a car), schematic (graphical or illustrations), or mathematical.
A computer-based information system is a set of hardware, software, databases, telecommunications and networks, people, & procedures arranged to collect & store data, process it into information, and disseminate the information. “ Hardware” is the equipment used for input, processing & output activities, such keyboards, scanners, microphones, processors (also called the central processing unit, or CPU),monitors, and printers. “ Software” refers to the computer programs that control the operation of the computer hardware. “ Databases” are collections of facts and information organized for accessibility. Telecommunications is the electronic transmission of signals. Networks are collections of hardware connected together for telecommunications. The Internet is a kind of network. “ People” include information systems (IS) professionals who create, manage, run and maintain the systems and users (sometimes called end users) who use information systems in their work or in their daily life. “ Procedures” include strategies, policies, rules & methods for using a computer based information system. Procedures would include how often to backup various files or what to do when the power fails.
The emergence of the Internet is providing new business models, such as e-business and e-commerce. Furthermore, this trend is increasing, especially with the Grid initiatives. For example, buterfly.net – online gaming, to a greater extent than already exists. Such global IT infrastructure is eliminating technical, geographic and cost carriers for global organisations. Future developments include the Access Grid, in which global collaborations are facilitated. Some organisations are solely based on IS. For example e-commerce web sites. More traditional examples include companies that have adopted IS to run their business, such as IBM. Digital links include e-commerce, e-business and business-to-business (b2b).
Management information systems provide routine information to decision makers to make structured, recurring decisions, such as restocking decisions or bonus awards. Management Information Systems focus on operational efficiency. The main input to an MIS is data collected and stored by transaction processing systems. An MIS further processes transaction data to produce information useful for specific purposes.
Generally, all MIS outputs have been pre-programmed by information systems personnel. Outputs include: Scheduled reports: These were originally the only reports provided by early management information systems. Scheduled reports are produced periodically, such as hourly, daily, weekly, or monthly. An example might be a weekly sales report that a store manager gets each Monday showing total weekly sales for each department compared to sales this week last year or planned sales. Demand reports provide specific information upon request. For instance, if the store manager wanted to know how weekly sales were going on Friday, and not wait until the scheduled report arrives on Monday, she could request the same report using figures for the part of the week already elapsed. Exception reports are produced to describe unusual circumstances. For example, the store manager might receive a report for the week if any department’s sales were more than 10% below planned sales.