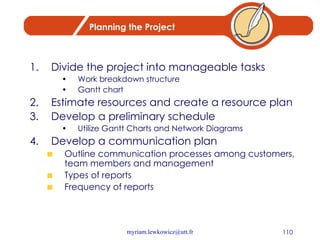
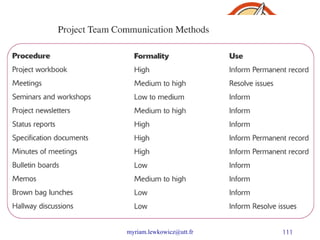
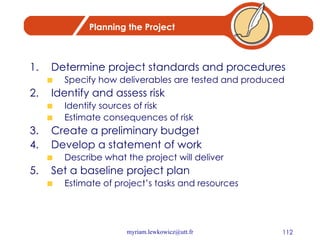
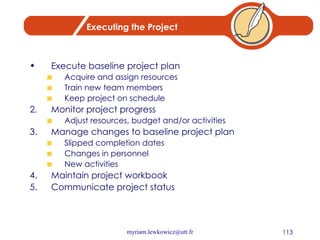
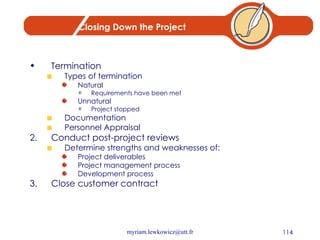
The document provides an overview of managing information systems projects. It discusses the skills required to be an effective project manager and the key phases in project management: initiation, planning, execution, and closedown. During initiation, a project team is established and the scope and objectives are defined. Planning involves breaking the project into tasks, estimating resources and schedules, and developing communication plans. Execution refers to carrying out the planned tasks while monitoring progress. Closedown involves documentation, reviews, and closing out the project contract.


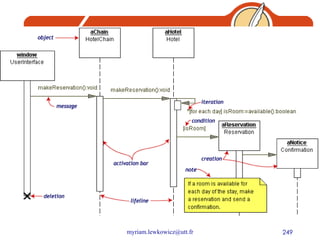
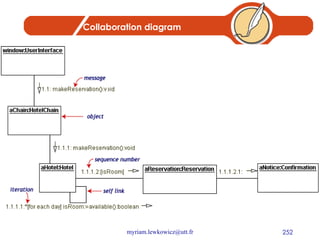
![Explanation The Reservation window sends a makeReservation() message to a HotelChain . The HotelChain then sends a makeReservation() message to a Hotel . If the Hotel has available rooms, then it makes a Reservation and a Confirmation . Each vertical dotted line is a lifeline , representing the time that an object exists. Each arrow is a message call. An arrow goes from the sender to the top of the activation bar of the message on the receiver's lifeline. The activation bar represents the duration of execution of the message. In our diagram, the Hotel issues a self call to determine if a room is available. If so, then the Hotel creates a Reservation and a Confirmation . The asterisk on the self call means iteration (to make sure there is available room for each day of the stay in the hotel). The expression in square brackets, [ ], is a condition . The diagram has a clarifying note , which is text inside a dog-eared rectangle. Notes can be put into any kind of UML diagram.](https://image.slidesharecdn.com/ptht-100126191135-phpapp02/85/Information-system-250-320.jpg)