Download as PDF, PPTX
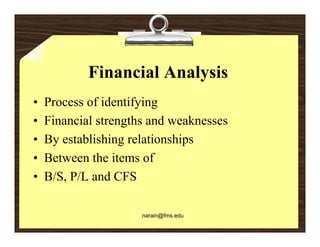
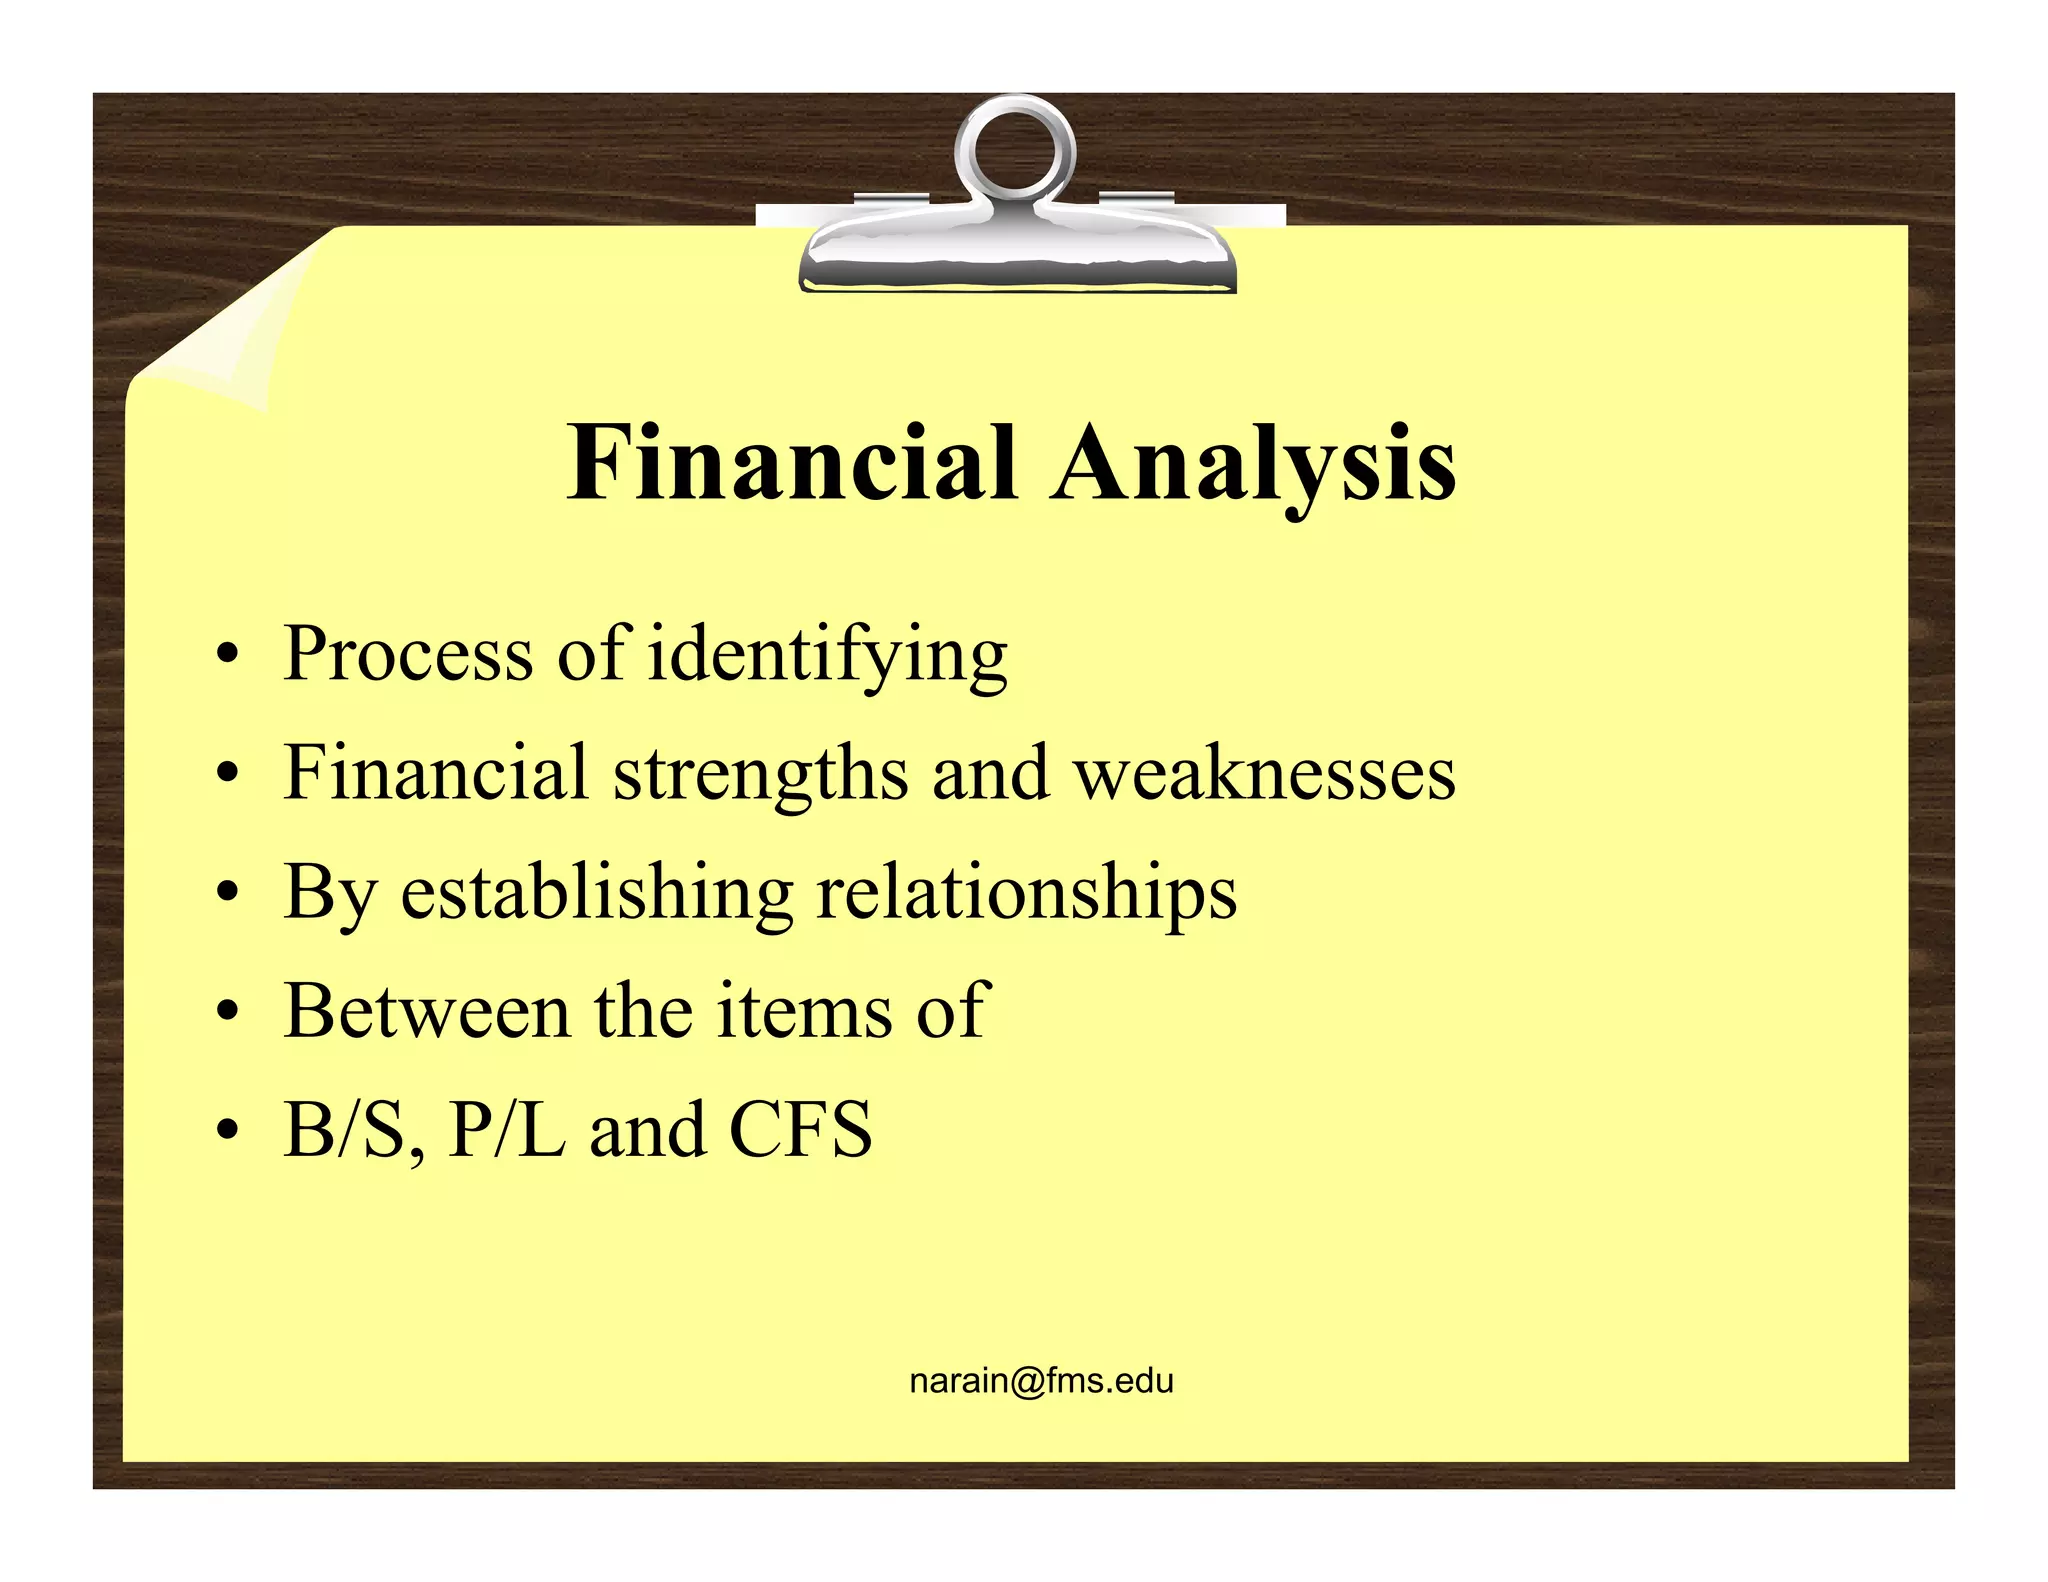
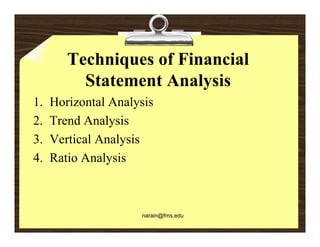
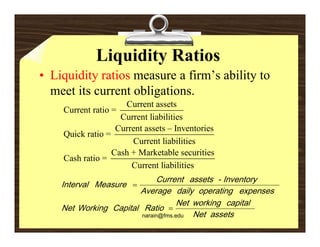
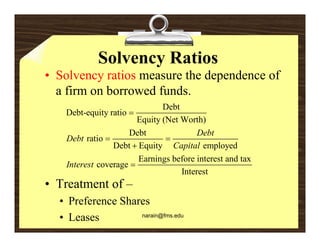
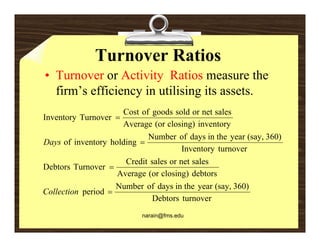
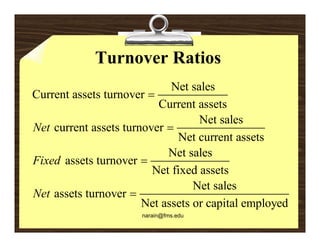
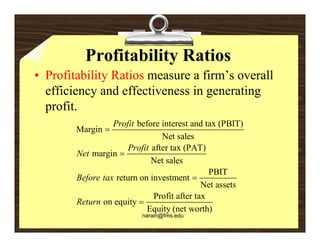
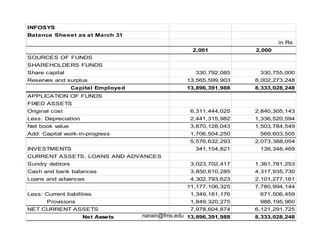
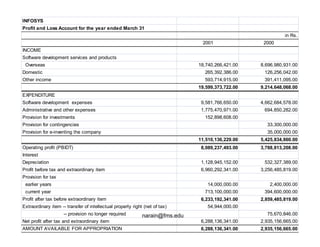
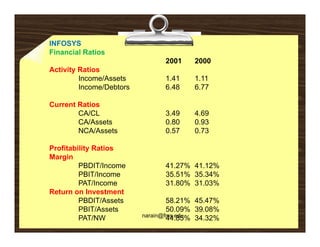
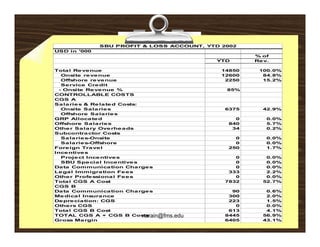
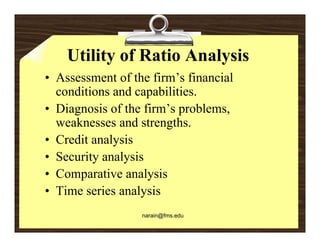
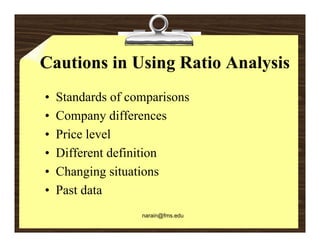

Financial analysis involves establishing relationships between items in a company's balance sheet, profit and loss statement, and cash flow statement to analyze the company's financial strengths and weaknesses. This is used by various stakeholders like creditors, lenders, investors, and management. Key techniques include horizontal analysis, trend analysis, vertical analysis, and ratio analysis which compares accounting numbers through ratios. Common ratios analyzed include liquidity, solvency, turnover, profitability, and leverage ratios.


![Working and functions_of_rbi[1]](https://cdn.slidesharecdn.com/ss_thumbnails/workingandfunctionsofrbi1-110522002449-phpapp01-thumbnail.jpg?width=640&height=640&fit=bounds)


![Csac10[1].p](https://cdn.slidesharecdn.com/ss_thumbnails/csac101-p-110520054545-phpapp01-thumbnail.jpg?width=640&height=640&fit=bounds)
![Csac08[1].p](https://cdn.slidesharecdn.com/ss_thumbnails/csac081-p-110520054521-phpapp01-thumbnail.jpg?width=640&height=640&fit=bounds)
![Csac05[1].p](https://cdn.slidesharecdn.com/ss_thumbnails/csac051-p-110520054504-phpapp01-thumbnail.jpg?width=640&height=640&fit=bounds)
![Csac14[1].p](https://cdn.slidesharecdn.com/ss_thumbnails/csac141-p-110520054443-phpapp02-thumbnail.jpg?width=640&height=640&fit=bounds)
![Csac06[1].p](https://cdn.slidesharecdn.com/ss_thumbnails/csac061-p-110520054419-phpapp01-thumbnail.jpg?width=640&height=640&fit=bounds)
