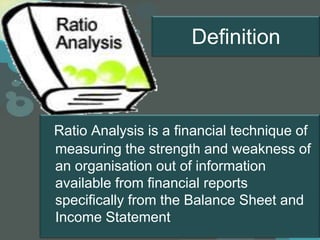
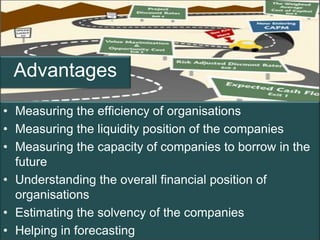
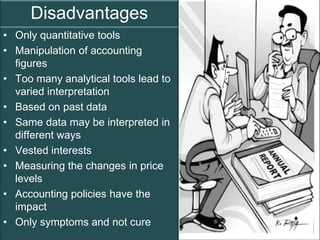
Ratio analysis is a technique that measures the financial strength and weaknesses of an organization using ratios calculated from information in the balance sheet and income statement. There are various types of ratios that serve different purposes, such as liquidity ratios that measure short-term solvency, activity ratios that measure efficiency, and profitability ratios that measure long-term performance. While ratios provide quantitative measures, they also have limitations such as being based on historical data and different interpretation.
![A] Liquidity Ratios
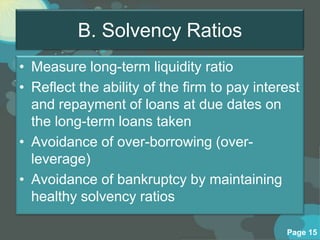
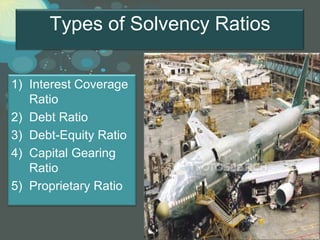
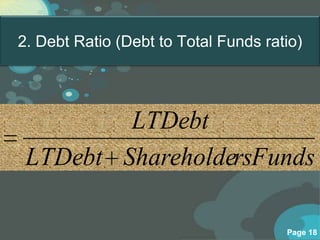
B] Solvency Ratios
C] Activity Ratios
D] Profitability Ratios
Different Ratios E] Shareholders’Page 5
Ratios](https://image.slidesharecdn.com/ratioanalysis-enlargedversion-b-v-raghunandan-130306073205-phpapp01/85/Ratio-analysis-enlarged-version-b-v-raghunandan-5-320.jpg)
![A] Liquidity Ratio
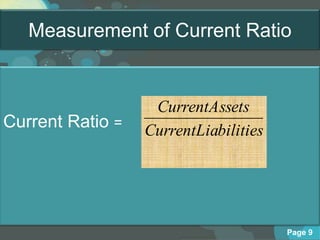
CurrentAssets
• Current Ratio =
CurrentLiabilities
CurrentAss ets Clo sin gStock
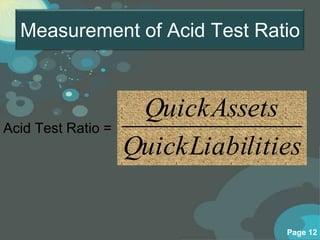
• Acid Test Ratio=
CurrentLia bility
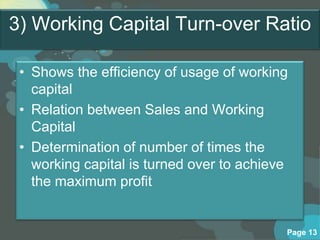
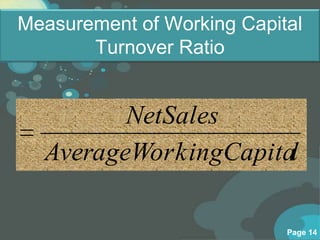
Sales
• Working Capital Turnover Ratio =
WorkingCapital
Page 6](https://image.slidesharecdn.com/ratioanalysis-enlargedversion-b-v-raghunandan-130306073205-phpapp01/85/Ratio-analysis-enlarged-version-b-v-raghunandan-6-320.jpg)


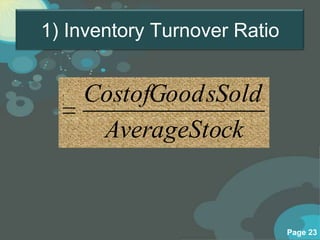
![C] Activity Ratios
1) Inventory Turnover Ratio
2) Debtors Turnover Ratio
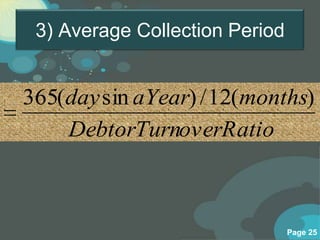
3) Average Collection Period
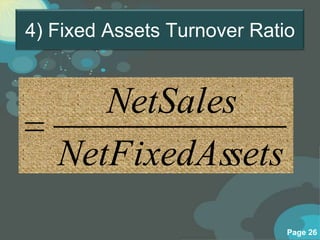
4) Fixed Assets Turnover Ratio
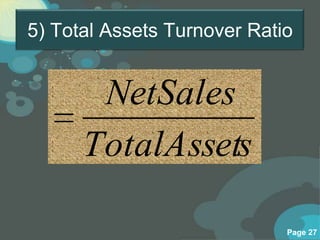
5) Total Assets Turnover Ratio
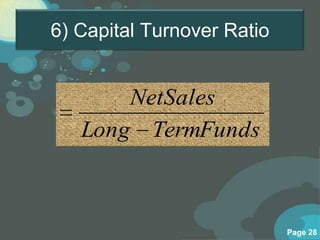
6) Capital Turnover Ratio
Page 22](https://image.slidesharecdn.com/ratioanalysis-enlargedversion-b-v-raghunandan-130306073205-phpapp01/85/Ratio-analysis-enlarged-version-b-v-raghunandan-22-320.jpg)

![D] Profitability Ratios
1) Net Profit Ratio
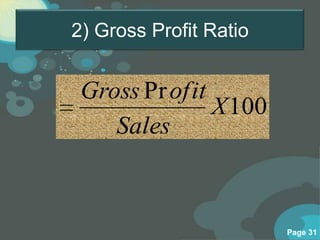
2) Gross Profit
Ratio
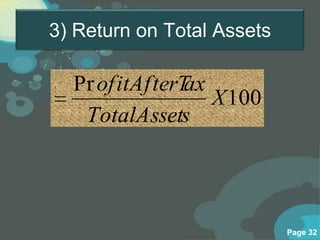
3) Return on Total
Assets
4) Return on Equity
Page 29](https://image.slidesharecdn.com/ratioanalysis-enlargedversion-b-v-raghunandan-130306073205-phpapp01/85/Ratio-analysis-enlarged-version-b-v-raghunandan-29-320.jpg)