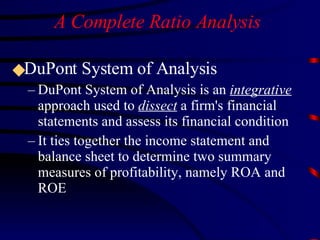
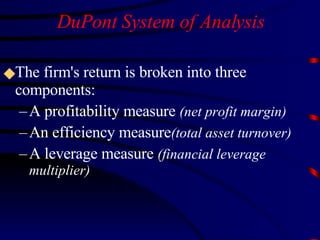
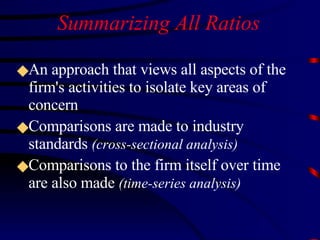
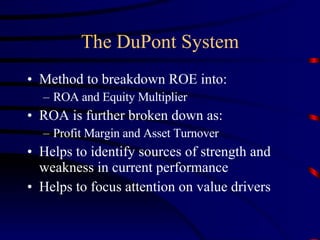
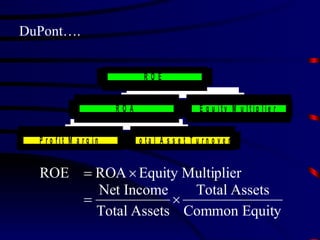
Financial ratios can be used to analyze a company's liquidity, activity, debt, and profitability by comparing financial metrics over time and to other companies. The document discusses various types of ratios that fall under each of these categories and how they are calculated using figures from the income statement and balance sheet. It also introduces the DuPont analysis method, which breaks down return on equity into other component ratios to identify sources of strength or weakness.


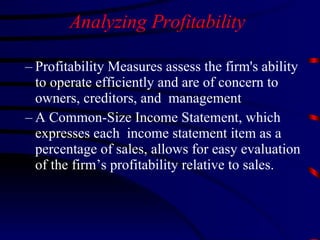
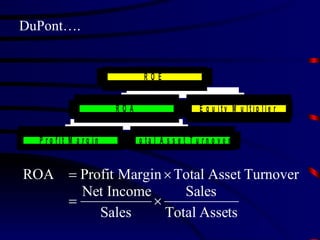
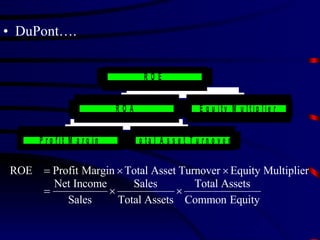
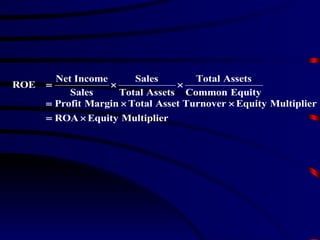
![Debt Ratio (DR) Debt-Equity Ratio (DER) Times Interest Earned Ratio (TIE) Fixed Payment Coverage Ratio (FPC) Four Important Debt Measures Total Liabilities DR= Total Assets Long-Term Debt DER= Stockholders’ Equity Earnings Before Interest & Taxes (EBIT) TIE= Interest Earnings Before Interest & Taxes + Lease Payments FPC= Interest + Lease Payments +{(Principal Payments + Preferred Stock Dividends) X [1 / (1 -T)]}](https://image.slidesharecdn.com/financialratio-1223636237034495-9/85/gty-22-320.jpg)