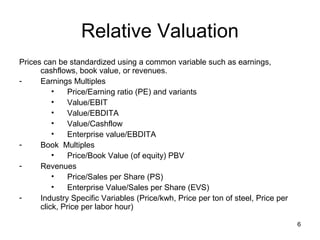
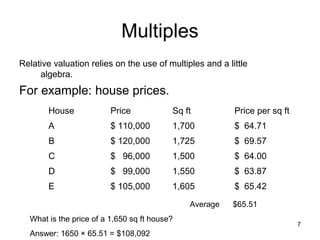
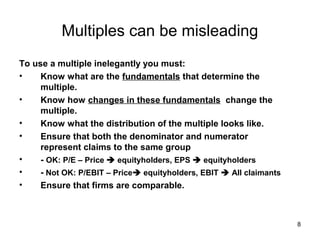
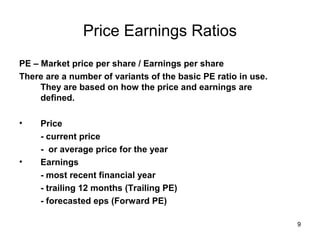
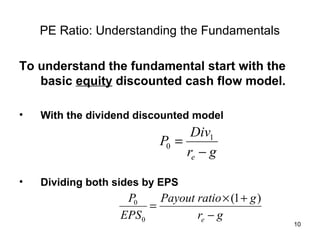
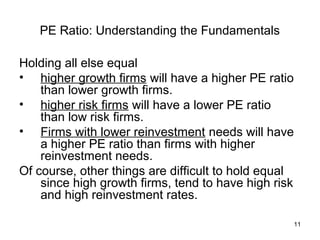
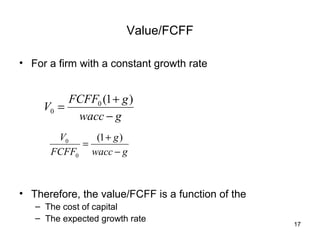
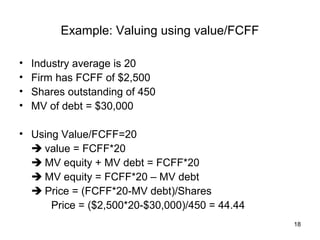
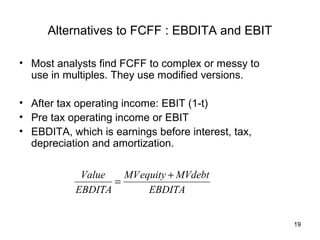
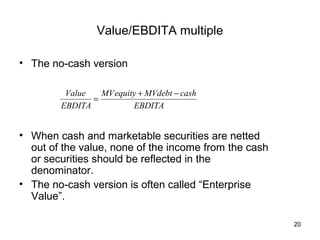
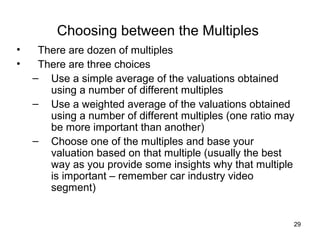
Relative Valuation

Valuing a company relative to
      another company


                                1
Relative vs. Fundamental Valuation
The DCF (WACC, FTE, APV) model of valuation is
  a fundamental method.
• Value of firm (equity) is the PV of future cash
  flows.
• Ignores the current level of the stock market
  (industry).
• Appropriate for comparing investments across
  different asset classes (stocks vs. bond vs. real
  estate, etc).
• In the long run, fundamental is the correct way of
  value any asset.

                                                   2
Relative vs. Fundamental Valuation
Relative valuation is based on P/E ratios and a host of
  other “multiples”.
• Extremely popular with the press, CNBS, Stock brokers
• Used to value one stock against another.
• Can not compare value across different asset classes
  (stocks vs. bond vs. real estate, etc).
• Can not answer the question is the “stock market over
  valued?”
• Can answer the question, “I want to buy a tech stock,
  which one should I buy?”
• Can answer the question, “Which one of these
  overpriced IPO’s is the best buy?”
                                                          3
Relative vs. Fundamental Valuation
You are investing for your retirement. You
 are planning to take a buy and hold
 strategy which involves picking some fairly
 priced stocks and holding them for several
 years. Which valuation approach should
 you use?
Relative or fundamental?


                                           4
Relative vs. Fundamental Valuation
You are a short term investor. You trade
 several times a week on your E-trade
 account, and rarely hold a stock for more
 than a month. Which valuation technique
 should you use?
Relative or fundamental?


                                             5
Relative Valuation
Prices can be standardized using a common variable such as earnings,
      cashflows, book value, or revenues.
-     Earnings Multiples
          •    Price/Earning ratio (PE) and variants
          •    Value/EBIT
          •    Value/EBDITA
          •    Value/Cashflow
          •    Enterprise value/EBDITA
-     Book Multiples
          •    Price/Book Value (of equity) PBV
-     Revenues
          •    Price/Sales per Share (PS)
          •    Enterprise Value/Sales per Share (EVS)
-     Industry Specific Variables (Price/kwh, Price per ton of steel, Price per
      click, Price per labor hour)

                                                                                  6
Multiples
Relative valuation relies on the use of multiples and a little
     algebra.
For example: house prices.
       House             Price            Sq ft           Price per sq ft
       A                 $ 110,000        1,700           $ 64.71
       B                 $ 120,000        1,725           $ 69.57
       C                 $ 96,000         1,500           $ 64.00
       D                 $ 99,000         1,550           $ 63.87
       E                 $ 105,000        1,605           $ 65.42
                                              Average     $65.51
  What is the price of a 1,650 sq ft house?
                                                                            7
  Answer: 1650 × 65.51 = $108,092
Multiples can be misleading
To use a multiple inelegantly you must:
•    Know what are the fundamentals that determine the
     multiple.
•    Know how changes in these fundamentals change the
     multiple.
•    Know what the distribution of the multiple looks like.
•    Ensure that both the denominator and numerator
     represent claims to the same group
•    - OK: P/E – Price  equityholders, EPS  equityholders
•    - Not OK: P/EBIT – Price equityholders, EBIT  All claimants
•    Ensure that firms are comparable.


                                                                     8
Price Earnings Ratios
PE – Market price per share / Earnings per share
There are a number of variants of the basic PE ratio in use.
     They are based on how the price and earnings are
     defined.

•    Price
     - current price
     - or average price for the year
•    Earnings
     - most recent financial year
     - trailing 12 months (Trailing PE)
     - forecasted eps (Forward PE)

                                                               9
PE Ratio: Understanding the Fundamentals

To understand the fundamental start with the
   basic equity discounted cash flow model.

•   With the dividend discounted model
                                 Div1
                           P0 =
                                re − g

•   Dividing both sides by EPS
                    P0    Payout ratio × (1 + g )
                        =
                   EPS0          re − g
                                                    10
PE Ratio: Understanding the Fundamentals

Holding all else equal
• higher growth firms will have a higher PE ratio
    than lower growth firms.
• higher risk firms will have a lower PE ratio
    than low risk firms.
• Firms with lower reinvestment needs will have
    a higher PE ratio than firms with higher
    reinvestment needs.
Of course, other things are difficult to hold equal
    since high growth firms, tend to have high risk
    and high reinvestment rates.

                                                      11
Graph PE ratio
        150
        100
VW_PE
        50
        0


              1975q1   1980q1   1985q1      1990q1   1995q1   2000q1   2005q1
                                         stata_qtr


                                                                                12
Is low (high) PE cheap (expensive)?


• A market strategist argues that stocks are
  over priced because the PE ratio today is
  too high relative to the average PE ratio
  across time. Do you agree?

• Yes
• No
• If you do not agree, what factor might
  explain the high PE ratio today?
                                               13
A Question


You are reading an equity research report on
  Informix, and the analyst claims that the stock is
  undervalued because its PE ratio is 9.71 while
  the average of the sector PE ratio is 35.51.
  Would you agree?
• Yes
• No
• Why or why not?


                                                   14
Example: Valuing a firm using P/E ratios

• In an industry we identify 4 stocks which are similar
  to the stock we want to evaluate.
                                      Stock A   PE=14
                                      Stock B   PE=18
                                      Stock C   PE=24
                                      Stock D   PE=21

• The average PE = (14+18+24+21)/4=19.25
• Our firm has EPS of $2.10
• P/2.25=19.25 P=19.25*2.25=$40.425
• Note – do not include the stock to be valued in the
  average
• Also do not include firm with negative P/E ratios
                                                          15
Value/Cashflow

• PE ratios are for equityholders, while cash flow
  measures are the whole firm.
• Cash flow is from continuing operations before
  capital expenditure.
• FCF is uncommitted freely available cash flow
  after capital expenditure to maintain operations at
  the same economic level.
• FCFF (cash flow from assets) is free cash flow to
  total firm
             Value   MV equity + MVdebt
                   =
             FCFF            FCFF

• In the US in 1999, the mean value was 24.             16
Value/FCFF

• For a firm with a constant growth rate


          FCFF0 (1 + g )
     V0 =
           wacc − g
       V0    (1 + g )
           =
      FCFF0 wacc − g


• Therefore, the value/FCFF is a function of the
   – The cost of capital
   – The expected growth rate
                                                   17
Example: Valuing using value/FCFF

•   Industry average is 20
•   Firm has FCFF of $2,500
•   Shares outstanding of 450
•   MV of debt = $30,000

• Using Value/FCFF=20
   value = FCFF*20
   MV equity + MV debt = FCFF*20
   MV equity = FCFF*20 – MV debt
   Price = (FCFF*20-MV debt)/Shares
      Price = ($2,500*20-$30,000)/450 = 44.44
                                                18
Alternatives to FCFF : EBDITA and EBIT

• Most analysts find FCFF to complex or messy to
  use in multiples. They use modified versions.

• After tax operating income: EBIT (1-t)
• Pre tax operating income or EBIT
• EBDITA, which is earnings before interest, tax,
  depreciation and amortization.

            Value   MV equity + MVdebt
                  =
           EBDITA        EBDITA


                                                    19
Value/EBDITA multiple

• The no-cash version

         Value   MV equity + MVdebt − cash
               =
        EBDITA           EBDITA


• When cash and marketable securities are netted
  out of the value, none of the income from the cash
  or securities should be reflected in the
  denominator.
• The no-cash version is often called “Enterprise
  Value”.

                                                       20
Enterprise Value
• EV = market value of equity + market value of debt – cash
  and marketable securities
• Many companies who have just conducted an IPOs have
  huge amount of cash – a “war chest”
• EV excludes this cash from value of the firm
• Cash +MV of non-cash assets = MV debt + MV equity
   MV of non-cash assets = MV debt + MV equity - Cash

For example: Nasdaq AWRE (did IPO in 1996)
Its 1996 cash was $31.1 million, Total assets = $40.1 million,
   Debt=0  EV=$9 million.

For young firms it is common to use EV instead of Value.   21
Reasons for increased use of Value/EBDITA

1. The multiple can be computed even for firms
   that are reporting net losses, since EBDITA
   are usually positive.
2. More appropriate than the PE ratio for high
   growth firms.
3. Allows for comparison across firms with
   different financial leverage.


                                                 22
Price to Book Value Ratio

The measure of market value of equity to book value of
    equity.

                P MV equity
                 =
                B BVequity


                                                         23
Price Book Value Ratio: Stable Growth Firm
•     Going back to dividend discount model,         Div1
                                               P0 =
                                                    re − g
•     Defining the return on equity (ROE)=EPS0/BV0 and realizing that
      div1=EPS0*payout ratio, the value of equity can be written as
                    BV0 × ROE × payout ratio × (1 + g )
               P0 =
                                 re − g
                 P0         ROE × payout ratio × (1 + g )
                    = PVB =
                BV0                  re − g

•     If the return is based on expected earnings (next period)
                    P0         ROE × payout ratio
                       = PVB =
                   BV0               re − g
                                                                        24
Price Sales Ratio
•   The ratio of market value of equity to the sales


                    P   MV equity
                      =
                    S Total Revenue


•   Though the third most popular ration it has a fundamental
    problem.
    - the ratio is internally inconsistent.


                                                                25
Price Sales Ratio
•   Using the dividend discount model, we have
                                 Div1
                           P0 =
                                re − g
•   Dividing both sides by sales per share and remembering that
                                  Earnings per share
                Profit margin =
                                    Sales per share
•   We get

         P0          Profit margin × payout ratio × (1 + g )
              = PS =
       sales0                       re − g


                                                                  26
Price Sales Ratio and Profit Margin
•       The key determinant of price-sales ratio is profit margin.
•       A decline in profit margin has a twofold effect
    –      First, the reduction in profit margin reduces the price-sales ratio
           directly
    –      Second, the lower profit margin can lead to lower growth and
           indirectly reduce price-sales ratio.


    Expected growth rate = retention rate * ROE
     retention ratio *(Net profit/sales)*( sales/book value of equity)

     retention ratio * (profit margin) * (sales/ BV of equity)


                                                                                 27
Inconsistency in Price/Sales Ratio
•   Price is the value of equity
•   While sales accrue to the entire firm.
•   Enterprise to sales, however, is consistent.

             EV0     MV equity + MV debt - Cash
                   =
            sales0             re − g

•   To value a firm using EV/S
•   Compute the average EV/S for comparable firms
•   EV of subject firm = average EV/S time subject’s firm projected
    sales
•   Market value = EV – market debt value + cash


                                                                      28
Choosing between the Multiples
•    There are dozen of multiples
•    There are three choices
    – Use a simple average of the valuations obtained
       using a number of different multiples
    – Use a weighted average of the valuations obtained
       using a number of different multiples (one ratio may
       be more important than another)
    – Choose one of the multiples and base your
       valuation based on that multiple (usually the best
       way as you provide some insights why that multiple
       is important – remember car industry video
       segment)


                                                          29

Relative valuation

  • 1.
    Relative Valuation Valuing acompany relative to another company 1
  • 2.
    Relative vs. FundamentalValuation The DCF (WACC, FTE, APV) model of valuation is a fundamental method. • Value of firm (equity) is the PV of future cash flows. • Ignores the current level of the stock market (industry). • Appropriate for comparing investments across different asset classes (stocks vs. bond vs. real estate, etc). • In the long run, fundamental is the correct way of value any asset. 2
  • 3.
    Relative vs. FundamentalValuation Relative valuation is based on P/E ratios and a host of other “multiples”. • Extremely popular with the press, CNBS, Stock brokers • Used to value one stock against another. • Can not compare value across different asset classes (stocks vs. bond vs. real estate, etc). • Can not answer the question is the “stock market over valued?” • Can answer the question, “I want to buy a tech stock, which one should I buy?” • Can answer the question, “Which one of these overpriced IPO’s is the best buy?” 3
  • 4.
    Relative vs. FundamentalValuation You are investing for your retirement. You are planning to take a buy and hold strategy which involves picking some fairly priced stocks and holding them for several years. Which valuation approach should you use? Relative or fundamental? 4
  • 5.
    Relative vs. FundamentalValuation You are a short term investor. You trade several times a week on your E-trade account, and rarely hold a stock for more than a month. Which valuation technique should you use? Relative or fundamental? 5
  • 6.
    Relative Valuation Prices canbe standardized using a common variable such as earnings, cashflows, book value, or revenues. - Earnings Multiples • Price/Earning ratio (PE) and variants • Value/EBIT • Value/EBDITA • Value/Cashflow • Enterprise value/EBDITA - Book Multiples • Price/Book Value (of equity) PBV - Revenues • Price/Sales per Share (PS) • Enterprise Value/Sales per Share (EVS) - Industry Specific Variables (Price/kwh, Price per ton of steel, Price per click, Price per labor hour) 6
  • 7.
    Multiples Relative valuation relieson the use of multiples and a little algebra. For example: house prices. House Price Sq ft Price per sq ft A $ 110,000 1,700 $ 64.71 B $ 120,000 1,725 $ 69.57 C $ 96,000 1,500 $ 64.00 D $ 99,000 1,550 $ 63.87 E $ 105,000 1,605 $ 65.42 Average $65.51 What is the price of a 1,650 sq ft house? 7 Answer: 1650 × 65.51 = $108,092
  • 8.
    Multiples can bemisleading To use a multiple inelegantly you must: • Know what are the fundamentals that determine the multiple. • Know how changes in these fundamentals change the multiple. • Know what the distribution of the multiple looks like. • Ensure that both the denominator and numerator represent claims to the same group • - OK: P/E – Price  equityholders, EPS  equityholders • - Not OK: P/EBIT – Price equityholders, EBIT  All claimants • Ensure that firms are comparable. 8
  • 9.
    Price Earnings Ratios PE– Market price per share / Earnings per share There are a number of variants of the basic PE ratio in use. They are based on how the price and earnings are defined. • Price - current price - or average price for the year • Earnings - most recent financial year - trailing 12 months (Trailing PE) - forecasted eps (Forward PE) 9
  • 10.
    PE Ratio: Understandingthe Fundamentals To understand the fundamental start with the basic equity discounted cash flow model. • With the dividend discounted model Div1 P0 = re − g • Dividing both sides by EPS P0 Payout ratio × (1 + g ) = EPS0 re − g 10
  • 11.
    PE Ratio: Understandingthe Fundamentals Holding all else equal • higher growth firms will have a higher PE ratio than lower growth firms. • higher risk firms will have a lower PE ratio than low risk firms. • Firms with lower reinvestment needs will have a higher PE ratio than firms with higher reinvestment needs. Of course, other things are difficult to hold equal since high growth firms, tend to have high risk and high reinvestment rates. 11
  • 12.
    Graph PE ratio 150 100 VW_PE 50 0 1975q1 1980q1 1985q1 1990q1 1995q1 2000q1 2005q1 stata_qtr 12
  • 13.
    Is low (high)PE cheap (expensive)? • A market strategist argues that stocks are over priced because the PE ratio today is too high relative to the average PE ratio across time. Do you agree? • Yes • No • If you do not agree, what factor might explain the high PE ratio today? 13
  • 14.
    A Question You arereading an equity research report on Informix, and the analyst claims that the stock is undervalued because its PE ratio is 9.71 while the average of the sector PE ratio is 35.51. Would you agree? • Yes • No • Why or why not? 14
  • 15.
    Example: Valuing afirm using P/E ratios • In an industry we identify 4 stocks which are similar to the stock we want to evaluate. Stock A PE=14 Stock B PE=18 Stock C PE=24 Stock D PE=21 • The average PE = (14+18+24+21)/4=19.25 • Our firm has EPS of $2.10 • P/2.25=19.25 P=19.25*2.25=$40.425 • Note – do not include the stock to be valued in the average • Also do not include firm with negative P/E ratios 15
  • 16.
    Value/Cashflow • PE ratiosare for equityholders, while cash flow measures are the whole firm. • Cash flow is from continuing operations before capital expenditure. • FCF is uncommitted freely available cash flow after capital expenditure to maintain operations at the same economic level. • FCFF (cash flow from assets) is free cash flow to total firm Value MV equity + MVdebt = FCFF FCFF • In the US in 1999, the mean value was 24. 16
  • 17.
    Value/FCFF • For afirm with a constant growth rate FCFF0 (1 + g ) V0 = wacc − g V0 (1 + g ) = FCFF0 wacc − g • Therefore, the value/FCFF is a function of the – The cost of capital – The expected growth rate 17
  • 18.
    Example: Valuing usingvalue/FCFF • Industry average is 20 • Firm has FCFF of $2,500 • Shares outstanding of 450 • MV of debt = $30,000 • Using Value/FCFF=20  value = FCFF*20  MV equity + MV debt = FCFF*20  MV equity = FCFF*20 – MV debt  Price = (FCFF*20-MV debt)/Shares Price = ($2,500*20-$30,000)/450 = 44.44 18
  • 19.
    Alternatives to FCFF: EBDITA and EBIT • Most analysts find FCFF to complex or messy to use in multiples. They use modified versions. • After tax operating income: EBIT (1-t) • Pre tax operating income or EBIT • EBDITA, which is earnings before interest, tax, depreciation and amortization. Value MV equity + MVdebt = EBDITA EBDITA 19
  • 20.
    Value/EBDITA multiple • Theno-cash version Value MV equity + MVdebt − cash = EBDITA EBDITA • When cash and marketable securities are netted out of the value, none of the income from the cash or securities should be reflected in the denominator. • The no-cash version is often called “Enterprise Value”. 20
  • 21.
    Enterprise Value • EV= market value of equity + market value of debt – cash and marketable securities • Many companies who have just conducted an IPOs have huge amount of cash – a “war chest” • EV excludes this cash from value of the firm • Cash +MV of non-cash assets = MV debt + MV equity  MV of non-cash assets = MV debt + MV equity - Cash For example: Nasdaq AWRE (did IPO in 1996) Its 1996 cash was $31.1 million, Total assets = $40.1 million, Debt=0  EV=$9 million. For young firms it is common to use EV instead of Value. 21
  • 22.
    Reasons for increaseduse of Value/EBDITA 1. The multiple can be computed even for firms that are reporting net losses, since EBDITA are usually positive. 2. More appropriate than the PE ratio for high growth firms. 3. Allows for comparison across firms with different financial leverage. 22
  • 23.
    Price to BookValue Ratio The measure of market value of equity to book value of equity. P MV equity = B BVequity 23
  • 24.
    Price Book ValueRatio: Stable Growth Firm • Going back to dividend discount model, Div1 P0 = re − g • Defining the return on equity (ROE)=EPS0/BV0 and realizing that div1=EPS0*payout ratio, the value of equity can be written as BV0 × ROE × payout ratio × (1 + g ) P0 = re − g P0 ROE × payout ratio × (1 + g ) = PVB = BV0 re − g • If the return is based on expected earnings (next period) P0 ROE × payout ratio = PVB = BV0 re − g 24
  • 25.
    Price Sales Ratio • The ratio of market value of equity to the sales P MV equity = S Total Revenue • Though the third most popular ration it has a fundamental problem. - the ratio is internally inconsistent. 25
  • 26.
    Price Sales Ratio • Using the dividend discount model, we have Div1 P0 = re − g • Dividing both sides by sales per share and remembering that Earnings per share Profit margin = Sales per share • We get P0 Profit margin × payout ratio × (1 + g ) = PS = sales0 re − g 26
  • 27.
    Price Sales Ratioand Profit Margin • The key determinant of price-sales ratio is profit margin. • A decline in profit margin has a twofold effect – First, the reduction in profit margin reduces the price-sales ratio directly – Second, the lower profit margin can lead to lower growth and indirectly reduce price-sales ratio. Expected growth rate = retention rate * ROE  retention ratio *(Net profit/sales)*( sales/book value of equity)  retention ratio * (profit margin) * (sales/ BV of equity) 27
  • 28.
    Inconsistency in Price/SalesRatio • Price is the value of equity • While sales accrue to the entire firm. • Enterprise to sales, however, is consistent. EV0 MV equity + MV debt - Cash = sales0 re − g • To value a firm using EV/S • Compute the average EV/S for comparable firms • EV of subject firm = average EV/S time subject’s firm projected sales • Market value = EV – market debt value + cash 28
  • 29.
    Choosing between theMultiples • There are dozen of multiples • There are three choices – Use a simple average of the valuations obtained using a number of different multiples – Use a weighted average of the valuations obtained using a number of different multiples (one ratio may be more important than another) – Choose one of the multiples and base your valuation based on that multiple (usually the best way as you provide some insights why that multiple is important – remember car industry video segment) 29