Downloaded 110 times
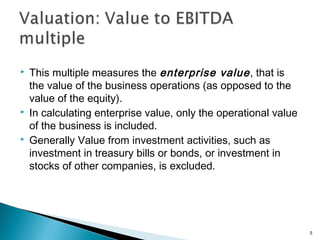
![ PER – most commonly used multiples
Make sure definition is consistent & uniform
PER = MPS / EPS
Variant of PER
Current PER = Current MPS / Current EPS
Some analyst may use average price over last 6m or a year
Trailing PER = Current MPS / EPS based on last 4 quarters.
[or, LTM: Last twelve months]
Forward PER = Current MPS / expected EPS during next F/Y
EPS may further be based on fully diluted basis or primary basis
EPS may include or exclude extraordinary items
22](https://image.slidesharecdn.com/relativevaluation-121224070805-phpapp01/85/Relative-valuation-22-320.jpg)
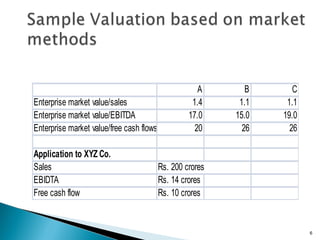
![ P/B ratio = market value of equity / book value of equity
Book value is computed from the Financial Statement
Price of book ratio near to 4 is highly priced stock [mean
P/B ratio of all listed firm in USA during 2006 was 4]
Price to Sales ratio
(Revenue multiple) = market value of equity
Revenue
The larger the revenue multiple better it is.
Generally there is no sectoral Revenue multiple.
25](https://image.slidesharecdn.com/relativevaluation-121224070805-phpapp01/85/Relative-valuation-25-320.jpg)
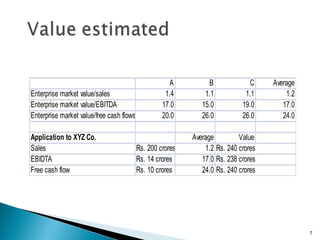
![ If MVIC is used to value on a minority interest basis, no
adjustment should be made to the subject company’s
actual capital structure (since minority shareholders
cannot force such an adjustment)
Equity should be taken on a fully diluted basis (For
options, warrants, convertibles, the no. of equity units
should be computed as if conversion rights were
exercised.
[No. of units of ES O/S = no. of ES after dilution]
28](https://image.slidesharecdn.com/relativevaluation-121224070805-phpapp01/85/Relative-valuation-28-320.jpg)
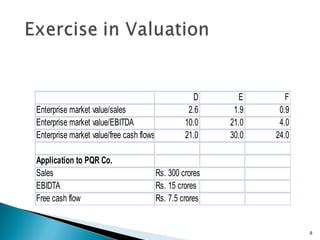
![ MVIC = Equity + PS + LTD + current portion of LTID
[or all IBD, i.e. interest bearing debt]
[may also subtract cash or cash equivalent. Marketable
securities are included with cash equivalent]
This is more preferable because different cash mix
creates problem.
29](https://image.slidesharecdn.com/relativevaluation-121224070805-phpapp01/85/Relative-valuation-29-320.jpg)
![ Conceptually only LTD (including current
portion of LTD) should be considered.
Due to practical difficulty we use AIBL
[ difficult to assess how much interest is
short term or long term. Some companies
use ST debt as if it is LTD]
31](https://image.slidesharecdn.com/relativevaluation-121224070805-phpapp01/85/Relative-valuation-31-320.jpg)
![Description of the subject Co. in terms of
Line of business
◦ Market served
◦ Size: Revenue and Asset
◦ Other criteria
I) Then use above information to select guideline Co.
II) Based on definition create a population of companies in similar line of
business
III) Normalize financials of both subject Co. & guideline Co.
IV) Carryout comparative Financial analysis
V) Identify and list similarities and assess relative strength and weakness.
[site visit and management interviews helps]
32](https://image.slidesharecdn.com/relativevaluation-121224070805-phpapp01/85/Relative-valuation-32-320.jpg)
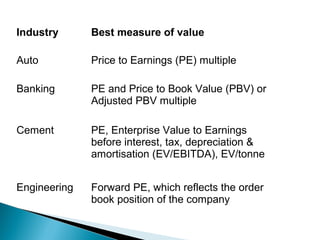
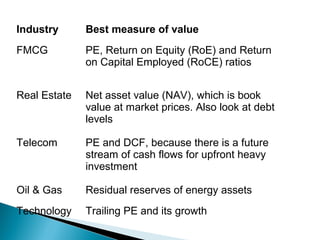

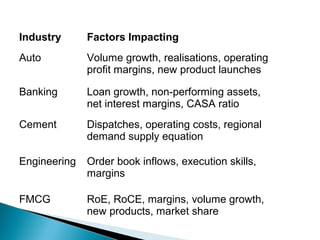
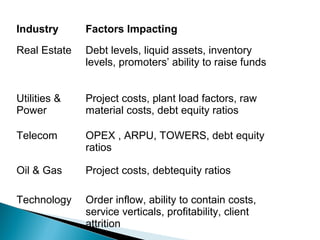

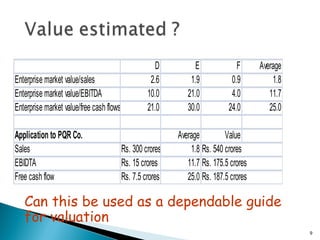
The document discusses various valuation multiples used to value companies based on their industry. It provides the best valuation multiples to use for different industries such as price to earnings for auto companies, price to book value for banks, and enterprise value to EBITDA for cement companies. It also outlines key factors that impact valuation for each industry, such as volume growth and margins for auto companies, and loan growth and non-performing assets for banks.


