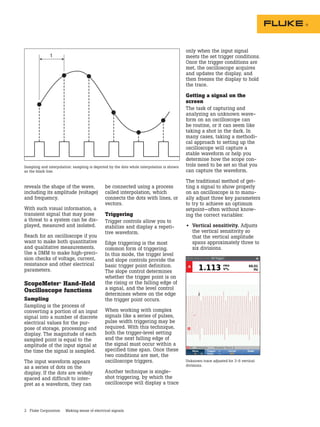
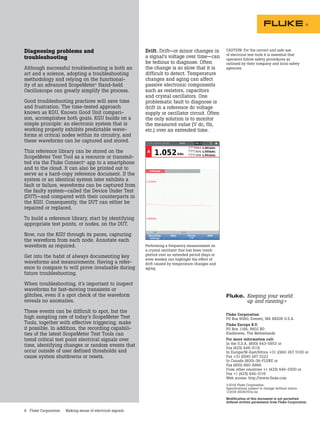
- Oscilloscopes display voltage signals as waveforms over time to reveal important information about electrical signals that control electro-mechanical devices. They show voltage, frequency, noise and signal anomalies.
- Most oscilloscopes are now digital, which enables more accurate measurements, data storage, automated analysis and remote sharing of readings. Handheld digital oscilloscopes offer advantages like battery power and electrical isolation.
- Oscilloscopes reveal the shape, amplitude and frequency of waves to identify transient or harmonic signals that could compromise systems, while multimeters only provide numeric readings. Oscilloscope functions like sampling, triggering, and automated setup help analyze unknown waveforms.
Power Quality Analyzer
• Simultaneous Power & Power quality measurements
• Helpful support functions
• Measurement with high accuracy
• Remote monitoring on PC and Android device
• Various Clamp Current Sensors
• Energy consumption check on site
• IEC 61010-1 CAT IV 300V, CAT III 600V, CAT II 1000V
Inc. Accessories: 7141B (Voltage test lead), 7170 (Power cord), 7219 (USB cable)
8326-02 (SD card 2GB), 9125 (Carrying case for KEW 6315), 9135 (Carrying case for KEW 6315-03), Input terminal plate × 6, KEW Windows for KEW 6315 (software), Quick manual, Alkaline size AA battery (LR6) × 6
Inquiry at info.f@kew-india.co.in
They always sound so high tech that we hardly notice that our day-to-day lives always involve the use of sensors. From IR sensors in TV remotes to passive infrared sensors on automatic doors or LDRs for outdoor and street lightings, sensors are everywhere.
Sensors detect changes, acknowledge those changes, and produce outputs from those changes. They detect and measure qualities such as light, temperature, sound, and other types of output from the environment.
Read more at https://www.asap-supplychain.com/blog/different-types-of-sensors/
Buy various types of speed and temperature sensors from asap-supplychain.com
https://www.asap-supplychain.com/nsn/part-type/speed-sensor/
https://www.asap-supplychain.com/nsn/part-type/temperature-sensor/
ASAP Supply Chain is trusted one stop solution to access over 32 million aircraft and electronics parts from 7300 manufacturers of different industries.
A wave analyzer is an instrument designed to measure relative amplitudes of single frequency components in a complex waveform. Basically, a wave instrument acts as a frequency selective voltmeter which is tuned to the frequency of one signal while rejecting all other signal components.
Small, widely available and dirt-cheap ultrasonic sensors enable us to design both simple and lavish measuring devices for all kinds of ranging. Take one of these modules, add a display, a couple of press-buttons and a micro-controller loaded with software, and you now have all the ingredients for a circuit of this kind.
Auto-navigation of Unmanned Helicopter to Detect and Extinguish Forest FireJerome Stanislaus
Auto-Navigation of unmanned helicopter to extinguish forest fire using wireless sensor networks (WSN). The prototype was made using an RC helicopter, thermostat and IRIS motes for WSN.
A Modified Radar With Missile Tracking and Automatic Destructionsanjay kushwaha
This project is to plan and build programmed target following and destroy framework. The framework is intended to recognize the objective moving in different directions. The crushing framework moves consequently toward missile and fires it after tracking the objective.
Cathode Ray Oscilloscope CRO & Digital Oscilloscope 'S WORKINGAbdul Qayoom Mangrio
it contain the working of CRO & DO
IT CONTAINs all the subtopics related to it. it has Block diagram, internal working and much more.
Subject; Measurement & Instrumentation
Teacher; ma'am Falak Naz Pathan
MEHRAN UET SZAB CAMPUS KHAIRPUR MIR'S
1.Oscilloscope. 2.Block diagram of Oscilloscope. 3.Types of Oscilloscope. 4.A...AL- AMIN
1.Oscilloscope.
2.Block diagram of Oscilloscope.
3.Types of Oscilloscope.
4.Applications of Oscilloscope.
5.Signal generator.
6. Types of signal generator.
7. Frequency synthesizer.
8.Analyzer.
9.Types of analyzer
Kyoritsu Power Quality Analyzer - Kew 6315
Simultaneous recording of Power & Power Quality measurements in one survey,
The perfect tools for Energy Saving and Power Quality control.
Specification : http://www.kew-ltd.co.in/product/kew-6315/
The modern-day power grid aims at providing reliable and quality power, which requires careful monitoring of the power grid against catastrophic faults.
Therefore one promising way is to provide the system a wide protection and control named as “Wide Area Measurement and Control System” /PMU is required.
Water scarcity is the lack of fresh water resources to meet the standard water demand. There are two type of water scarcity. One is physical. The other is economic water scarcity.
Automobile Management System Project Report.pdfKamal Acharya
The proposed project is developed to manage the automobile in the automobile dealer company. The main module in this project is login, automobile management, customer management, sales, complaints and reports. The first module is the login. The automobile showroom owner should login to the project for usage. The username and password are verified and if it is correct, next form opens. If the username and password are not correct, it shows the error message.
When a customer search for a automobile, if the automobile is available, they will be taken to a page that shows the details of the automobile including automobile name, automobile ID, quantity, price etc. “Automobile Management System” is useful for maintaining automobiles, customers effectively and hence helps for establishing good relation between customer and automobile organization. It contains various customized modules for effectively maintaining automobiles and stock information accurately and safely.
When the automobile is sold to the customer, stock will be reduced automatically. When a new purchase is made, stock will be increased automatically. While selecting automobiles for sale, the proposed software will automatically check for total number of available stock of that particular item, if the total stock of that particular item is less than 5, software will notify the user to purchase the particular item.
Also when the user tries to sale items which are not in stock, the system will prompt the user that the stock is not enough. Customers of this system can search for a automobile; can purchase a automobile easily by selecting fast. On the other hand the stock of automobiles can be maintained perfectly by the automobile shop manager overcoming the drawbacks of existing system.
Industrial Training at Shahjalal Fertilizer Company Limited (SFCL)MdTanvirMahtab2
This presentation is about the working procedure of Shahjalal Fertilizer Company Limited (SFCL). A Govt. owned Company of Bangladesh Chemical Industries Corporation under Ministry of Industries.
Democratizing Fuzzing at Scale by Abhishek Aryaabh.arya
Presented at NUS: Fuzzing and Software Security Summer School 2024
This keynote talks about the democratization of fuzzing at scale, highlighting the collaboration between open source communities, academia, and industry to advance the field of fuzzing. It delves into the history of fuzzing, the development of scalable fuzzing platforms, and the empowerment of community-driven research. The talk will further discuss recent advancements leveraging AI/ML and offer insights into the future evolution of the fuzzing landscape.
Cosmetic shop management system project report.pdfKamal Acharya
Buying new cosmetic products is difficult. It can even be scary for those who have sensitive skin and are prone to skin trouble. The information needed to alleviate this problem is on the back of each product, but it's thought to interpret those ingredient lists unless you have a background in chemistry.
Instead of buying and hoping for the best, we can use data science to help us predict which products may be good fits for us. It includes various function programs to do the above mentioned tasks.
Data file handling has been effectively used in the program.
The automated cosmetic shop management system should deal with the automation of general workflow and administration process of the shop. The main processes of the system focus on customer's request where the system is able to search the most appropriate products and deliver it to the customers. It should help the employees to quickly identify the list of cosmetic product that have reached the minimum quantity and also keep a track of expired date for each cosmetic product. It should help the employees to find the rack number in which the product is placed.It is also Faster and more efficient way.
Explore the innovative world of trenchless pipe repair with our comprehensive guide, "The Benefits and Techniques of Trenchless Pipe Repair." This document delves into the modern methods of repairing underground pipes without the need for extensive excavation, highlighting the numerous advantages and the latest techniques used in the industry.
Learn about the cost savings, reduced environmental impact, and minimal disruption associated with trenchless technology. Discover detailed explanations of popular techniques such as pipe bursting, cured-in-place pipe (CIPP) lining, and directional drilling. Understand how these methods can be applied to various types of infrastructure, from residential plumbing to large-scale municipal systems.
Ideal for homeowners, contractors, engineers, and anyone interested in modern plumbing solutions, this guide provides valuable insights into why trenchless pipe repair is becoming the preferred choice for pipe rehabilitation. Stay informed about the latest advancements and best practices in the field.
Overview of the fundamental roles in Hydropower generation and the components involved in wider Electrical Engineering.
This paper presents the design and construction of hydroelectric dams from the hydrologist’s survey of the valley before construction, all aspects and involved disciplines, fluid dynamics, structural engineering, generation and mains frequency regulation to the very transmission of power through the network in the United Kingdom.
Author: Robbie Edward Sayers
Collaborators and co editors: Charlie Sims and Connor Healey.
(C) 2024 Robbie E. Sayers
Vaccine management system project report documentation..pdfKamal Acharya
The Division of Vaccine and Immunization is facing increasing difficulty monitoring vaccines and other commodities distribution once they have been distributed from the national stores. With the introduction of new vaccines, more challenges have been anticipated with this additions posing serious threat to the already over strained vaccine supply chain system in Kenya.
COLLEGE BUS MANAGEMENT SYSTEM PROJECT REPORT.pdfKamal Acharya
The College Bus Management system is completely developed by Visual Basic .NET Version. The application is connect with most secured database language MS SQL Server. The application is develop by using best combination of front-end and back-end languages. The application is totally design like flat user interface. This flat user interface is more attractive user interface in 2017. The application is gives more important to the system functionality. The application is to manage the student’s details, driver’s details, bus details, bus route details, bus fees details and more. The application has only one unit for admin. The admin can manage the entire application. The admin can login into the application by using username and password of the admin. The application is develop for big and small colleges. It is more user friendly for non-computer person. Even they can easily learn how to manage the application within hours. The application is more secure by the admin. The system will give an effective output for the VB.Net and SQL Server given as input to the system. The compiled java program given as input to the system, after scanning the program will generate different reports. The application generates the report for users. The admin can view and download the report of the data. The application deliver the excel format reports. Because, excel formatted reports is very easy to understand the income and expense of the college bus. This application is mainly develop for windows operating system users. In 2017, 73% of people enterprises are using windows operating system. So the application will easily install for all the windows operating system users. The application-developed size is very low. The application consumes very low space in disk. Therefore, the user can allocate very minimum local disk space for this application.
1. Making sense of
electrical signals
APPLICATION NOTE
Devices that convert electrical power to mechani-
cal power run the industrial world, including pumps,
compressors, motors, conveyors, robots and more.
Voltage signals that control these electro-mechan-
ical devices are a critical but unseen force. So
how do you capture and see that unseen force?
The graph on an
oscilloscope can reveal
important information:
• The voltage and current signals when
operating as intended
• Signal anomalies
• Calculated frequency of an oscillating signal
and any variations in frequency
• Whether signal includes noise and changes
to the noise
Oscilloscopes (or scopes) test
and display voltage signals as
waveforms, visual representa-
tions of the variation of voltage
over time. The signals are plot-
ted on a graph, which shows
how the signal changes. The
vertical (Y) access represents
the voltage measurement and
the horizontal (X) axis repre-
sents time.
Most of today’s oscilloscopes
are digital, which enables more
detailed accurate signal mea-
surements and fast calculations,
data storage capabilities and
automated analysis. Handheld
digital oscilloscopes such as the
Fluke ScopeMeter®
Test Tools
offer several advantages over
benchtop models: They are
battery operated, use electri-
cally isolated floating inputs
and also offer the advantage of
embedded features that make
oscilloscope usage easier and
more accessible to a variety of
workers.
The newest generation
of ScopeMeter®
Portable
Oscilloscopes are designed to
be operated quickly and easily
in the field and can even share
readings in real time over a
smartphone app in order to
receive consultation from col-
leagues or other experts, or
to save data in the cloud for
further analysis.
These designs also make
safety-certified measurements
possible in CAT III 1000 V and
CAT IV 600 V environments—a
critical need for safely trouble-
shooting electrical devices in
high-energy applications.
Multimeter vs.
oscilloscope
The difference between an
oscilloscope and a DMM (Digital
Multimeter) can be most
simply stated as “pictures vs.
numbers.” A DMM is a tool for
making precise measurements
of discrete signals, enabling
readings of up to eight digits of
resolution for the voltage, cur-
rent or frequency of a signal.
On the other hand, it cannot
depict waveforms visually to
reveal signal strength, wave
shape, or the instantaneous
value of the signal. Nor is it
equipped to reveal a transient
or a harmonic signal that could
compromise the operation of a
system.
An oscilloscope adds a wealth
of information to the numeric
readings of a DMM. While dis-
playing the numerical values of
a wave instantaneously, it also
2. 2 Fluke Corporation Making sense of electrical signals
reveals the shape of the wave,
including its amplitude (voltage)
and frequency.
With such visual information, a
transient signal that may pose
a threat to a system can be dis-
played, measured and isolated.
Reach for an oscilloscope if you
want to make both quantitative
and qualitative measurements.
Use a DMM to make high-preci-
sion checks of voltage, current,
resistance and other electrical
parameters.
ScopeMeter®
Hand-Held
Oscilloscope functions
Sampling
Sampling is the process of
converting a portion of an input
signal into a number of discrete
electrical values for the pur-
pose of storage, processing and
display. The magnitude of each
sampled point is equal to the
amplitude of the input signal at
the time the signal is sampled.
The input waveform appears
as a series of dots on the
display. If the dots are widely
spaced and difficult to inter-
pret as a waveform, they can
be connected using a process
called interpolation, which
connects the dots with lines, or
vectors.
Triggering
Trigger controls allow you to
stabilize and display a repeti-
tive waveform.
Edge triggering is the most
common form of triggering.
In this mode, the trigger level
and slope controls provide the
basic trigger point definition.
The slope control determines
whether the trigger point is on
the rising or the falling edge of
a signal, and the level control
determines where on the edge
the trigger point occurs.
When working with complex
signals like a series of pulses,
pulse width triggering may be
required. With this technique,
both the trigger-level setting
and the next falling edge of
the signal must occur within a
specified time span. Once these
two conditions are met, the
oscilloscope triggers.
Another technique is single-
shot triggering, by which the
oscilloscope will display a trace
only when the input signal
meets the set trigger conditions.
Once the trigger conditions are
met, the oscilloscope acquires
and updates the display, and
then freezes the display to hold
the trace.
Getting a signal on the
screen
The task of capturing and
analyzing an unknown wave-
form on an oscilloscope can
be routine, or it can seem like
taking a shot in the dark. In
many cases, taking a methodi-
cal approach to setting up the
oscilloscope will capture a
stable waveform or help you
determine how the scope con-
trols need to be set so that you
can capture the waveform.
The traditional method of get-
ting a signal to show properly
on an oscilloscope is to manu-
ally adjust three key parameters
to try to achieve an optimum
setpoint—often without know-
ing the correct variables:
• Vertical sensitivity. Adjusts
the vertical sensitivity so
that the vertical amplitude
spans approximately three to
six divisions.
Sampling and interpolation: sampling is depicted by the dots while interpolation is shown
as the black line.
t
Unknown trace adjusted for 3-6 vertical
divisions.
3. 3 Fluke Corporation Making sense of electrical signals
Unknown trace adjusted for 3-4 periods
horizontally.
• Horizontal timing. Adjusts
the horizontal time per divi-
sion so that there are three
to four periods of the wave-
form across the width of the
display.
• Trigger position. Sets the
trigger position to a point
of the vertical amplitude.
Depending on the signal
characteristics, this action
may or may not result in a
stable display.
By pressing the AUTO button
you enable Connect-and-View.
At this point you should see
a trace that 1) lies within the
vertical range of the display,
2) shows at least three periods
of a waveform, and 3) is stable
enough to allow you to recog-
nize the overall characteristics
of the waveform. Next, you can
start fine-tuning the settings.
Understanding and
reading waveforms
The majority of electronic
waveforms encountered are
periodic and repetitive, and
they conform to a known
shape. However, there are
several wave characteristics
to consider in order to train
your eye to look at the various
dimensions.
Some Fluke ScopeMeter®
Test Tools offer a proprietary
onboard algorithm called
IntellaSet™ to assist waveform
analysis. Once the waveform is
displayed on screen, if initiated,
the new IntellaSet™ technology
evaluates the signal and associ-
ated waveform by comparing
it against a database of known
waveforms. The ScopeMeter®
Test Tool then intelligently
suggests critical measurements
to characterize the unknown
signal so potential areas of con-
cern can be identified. As an
example, when the measured
waveform is a line voltage
signal, the V ac + dc and Hz
readings are automatically
displayed.
While intelligent programs
help minimize the time it takes
to scrutinize waveforms, it’s
important to know what to look
for when using an oscilloscope.
Trigger level adjusted to a unique
repetitive position, outside the aberration
on the second period.
Trigger point is set to a point but due to
the aberration on the leading edge in the
second period, an additional trigger results
in an unstable display.
Those three parameters, when
adjusted properly show you a
symmetrical “trace,” the line
that connects the samples of
the signal to create the visual
depiction of the waveform.
Waveforms can vary indefi-
nitely from the most common
sine-wave that ideally mirrors
between positive and negative
on the zero axis point or a uni-
directional square wave typical
of electronic pulses, or even a
shark tooth form.
The manual setup method often
requires tediously adjusting the
settings to make the waveform
readable in order to analyze it.
Automating setup
In contrast, Fluke ScopeMeter®
Hand-held Oscilloscopes
include a technology called
Connect-and-View™ that auto-
mates the process of digitizing
the analog waveform to see
a clear picture of the signal.
Connect-and-View adjusts the
vertical and horizontal timing
and the trigger position for you,
enabling hands-off operation
to display complex unknown
signals. This function optimizes
and stabilizes the display on
nearly all waveforms. If the
signal changes, the setup will
track these changes.
4. 4 Fluke Corporation Making sense of electrical signals
Use horizontal cursors to identify
amplitude fluctuations.
Evaluate period-to-period time changes.
Rising and falling edges.
Particularly with square waves
and pulses, the rising or fall-
ing edges of the waveform can
greatly affect the timing in
digital circuits. It may be neces-
sary to decrease the time per
division to see the edge with
greater resolution.
Use cursors and the gridlines to evaluate
the rise and fall times of the leading and
trailing edges of a waveform.
Amplitude. Verify that the
level is within the operating
specifications of the circuit.
Also check for consistency, from
one period to the next. Monitor
the waveform for an extended
period of time, watching for any
changes in amplitude.
Evaluate waveform dc offsets.
Periodic wave shape.
Oscillators and other circuits
will produce waveforms with
constant repeating peri-
ods. Evaluate each period in
time using cursors to spot
inconsistencies.
Amplitude offsets. DC-couple
the input and determine where
the ground reference marker
is. Evaluate any dc offset and
observe if this offset remains
stable or fluctuates.
Here are the factors to consider
in analyzing waveforms:
Shape. Repetitive waveforms
should be symmetrical. That is,
if you were to print the traces
and cut them in two like-sized
pieces, the two sides should be
identical. A point of difference
could indicate a problem.
If the two components of the waveform are
not symmetrical, there may be a problem
with the signal.
5. 5 Fluke Corporation Making sense of electrical signals
A ground reference-point measurement
showing induced random noise.
Ringing. Ringing can be seen
mostly in digital circuits and in
radar and pulse-width-mod-
ulation applications. Ringing
shows up at the transition from
a rising or falling edge to a flat
dc level.
Check for excessive ringing,
adjusting the time base to give
a clear depiction of the transi-
tioning wave or pulse.
A transient is occurring on the rising edge
of a pulse.
Noise. Noise can be caused by
faulty power supply circuits,
circuit overdrive, crosstalk,
or interference from adjacent
cables.
Or, noise can be induced
externally from sources such
as dc-dc converters, lighting
systems and high-energy
electrical circuits.
Waveform anomalies
Here are typical anomalies that
may appear on a waveform,
along with the typical sources
of such anomalies.
Transients or glitches. When
waveforms are derived from
active devices such as transis-
tors or switches, transients
or other anomalies can result
from timing errors, propagation
delays, bad contacts or other
phenomena.
Excessive ringing occurring on the top of
the square wave.
Momentary fluctuation
Momentary changes in the
measured signal generally
result from an external influ-
ence such as a sag or surge in
the main voltage, activation of a
high-power device that is con-
nected to the same electrical
circuit, or a loose connection.
Use the ScopeRecord function
and Event Capture mode of the
ScopeMeter Test Tool to moni-
tor the signal over long periods
of time to detect the elusive
momentary events.
A momentary change of approximately 1.5
cycles in the amplitude of the sinewave.