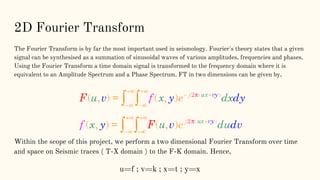
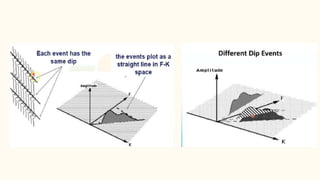
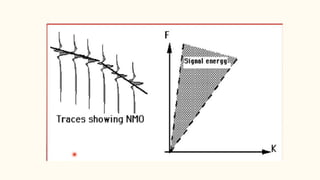
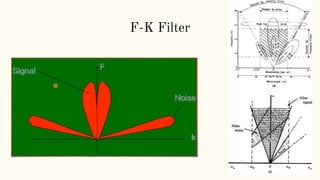
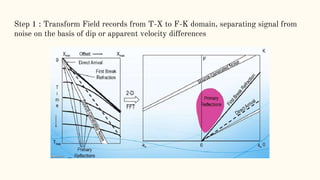
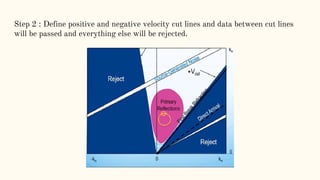
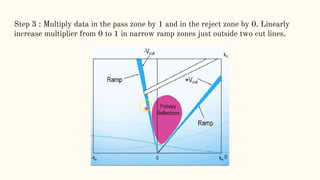
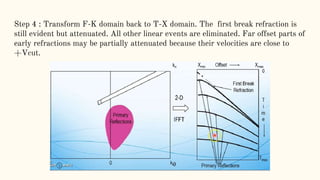
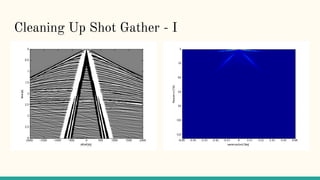
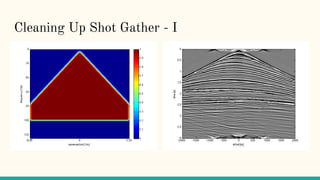
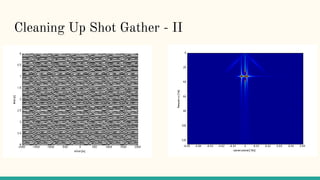
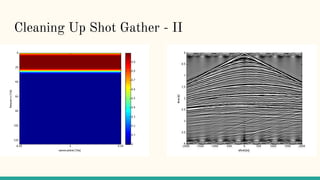
F-K Filtering for Seismic Data
Processing
By Adithya Shashidhara Shettar
What is F-K
filtering?
The Fourier Transform is by far the most important used in seismology. Fourier's theory states that a given
signal can be synthesised as a summation of sinusoidal waves of various amplitudes, frequencies and phases.
Using the Fourier Transform a time domain signal is transformed to the frequency domain where it is
equivalent to an Amplitude Spectrum and a Phase Spectrum. FT in two dimensions can be given by,
Within the scope of this project, we perform a two dimensional Fourier Transform over time
and space on Seismic traces ( T-X domain ) to the F-K domain. Hence,
u=f ; v=k ; x=t ; y=x
2D Fourier Transform
A filter is simply a multiplicative factor applied in some transform domain, typically or , followed by an
inverse transform. For example, a band-pass filter in the domain filters out higher temporal frequencies by
setting them to zero.
1. Filtering can be used to separate out a particular seismic event, which is shown on the seismic section,
using apparent velocity as the selection criterion. Each straight-line event, like a direct wave, refracted
wave or surface wave, has a particular apparent velocity.
2. The gradient Vapp = dx/dt of the arrivals on the seismic section gives the apparent velocity.
3. The filtering can be applied to the F-K spectrum to separate out a particular seismic event, which is
shown as a sloping linear trend of peaks on the F-K spectrum, as Vapp = df/dk.
4. However, a reflection event shows as a curved hyperbola on the original section.
5. The instantaneous gradient of the arrivals gives the apparent arrival velocity at the surface, so the
reflection event has a range of apparent velocities from infinity, at x=0 for vertical arrivals with
horizontal wavefronts, down to the limiting stacking velocity, where the arrivals run parallel to a
direct or refracted event.
F-K Filtering
F-K Filter
How is F-K
filtering done?
Step 1 : Transform Field records from T-X to F-K domain, separating signal from
noise on the basis of dip or apparent velocity differences
Step 2 : Define positive and negative velocity cut lines and data between cut lines
will be passed and everything else will be rejected.
Step 3 : Multiply data in the pass zone by 1 and in the reject zone by 0. Linearly
increase multiplier from 0 to 1 in narrow ramp zones just outside two cut lines.
Step 4 : Transform F-K domain back to T-X domain. The first break refraction is
still evident but attenuated. All other linear events are eliminated. Far offset parts of
early refractions may be partially attenuated because their velocities are close to
+Vcut.
Our
Implementation
Cleaning Up Shot Gather - I
Cleaning Up Shot Gather - II
Acknowledgement
● Seismic Laboratory for Imaging and Modeling, University of British Columbia,
for Seismic Data and functions to process .su files on MATLAB.
● Center for Seismic Imaging, Geosciences Department, Petronas University of
Technology
● Society of Exploration Geophysicists Wiki

F-K Filtering for Seismic Data Processing

  • 1.
    F-K Filtering forSeismic Data Processing By Adithya Shashidhara Shettar
  • 2.
  • 3.
    The Fourier Transformis by far the most important used in seismology. Fourier's theory states that a given signal can be synthesised as a summation of sinusoidal waves of various amplitudes, frequencies and phases. Using the Fourier Transform a time domain signal is transformed to the frequency domain where it is equivalent to an Amplitude Spectrum and a Phase Spectrum. FT in two dimensions can be given by, Within the scope of this project, we perform a two dimensional Fourier Transform over time and space on Seismic traces ( T-X domain ) to the F-K domain. Hence, u=f ; v=k ; x=t ; y=x 2D Fourier Transform
  • 4.
    A filter issimply a multiplicative factor applied in some transform domain, typically or , followed by an inverse transform. For example, a band-pass filter in the domain filters out higher temporal frequencies by setting them to zero. 1. Filtering can be used to separate out a particular seismic event, which is shown on the seismic section, using apparent velocity as the selection criterion. Each straight-line event, like a direct wave, refracted wave or surface wave, has a particular apparent velocity. 2. The gradient Vapp = dx/dt of the arrivals on the seismic section gives the apparent velocity. 3. The filtering can be applied to the F-K spectrum to separate out a particular seismic event, which is shown as a sloping linear trend of peaks on the F-K spectrum, as Vapp = df/dk. 4. However, a reflection event shows as a curved hyperbola on the original section. 5. The instantaneous gradient of the arrivals gives the apparent arrival velocity at the surface, so the reflection event has a range of apparent velocities from infinity, at x=0 for vertical arrivals with horizontal wavefronts, down to the limiting stacking velocity, where the arrivals run parallel to a direct or refracted event. F-K Filtering
  • 7.
  • 8.
  • 9.
    Step 1 :Transform Field records from T-X to F-K domain, separating signal from noise on the basis of dip or apparent velocity differences
  • 10.
    Step 2 :Define positive and negative velocity cut lines and data between cut lines will be passed and everything else will be rejected.
  • 11.
    Step 3 :Multiply data in the pass zone by 1 and in the reject zone by 0. Linearly increase multiplier from 0 to 1 in narrow ramp zones just outside two cut lines.
  • 12.
    Step 4 :Transform F-K domain back to T-X domain. The first break refraction is still evident but attenuated. All other linear events are eliminated. Far offset parts of early refractions may be partially attenuated because their velocities are close to +Vcut.
  • 13.
  • 16.
    Cleaning Up ShotGather - I
  • 17.
    Cleaning Up ShotGather - I
  • 18.
    Cleaning Up ShotGather - II
  • 19.
    Cleaning Up ShotGather - II
  • 20.
    Acknowledgement ● Seismic Laboratoryfor Imaging and Modeling, University of British Columbia, for Seismic Data and functions to process .su files on MATLAB. ● Center for Seismic Imaging, Geosciences Department, Petronas University of Technology ● Society of Exploration Geophysicists Wiki