Downloaded 733 times


![Chapter No.1 Introduction
2
1.1 Introduction
Formaldehyde is widely abundant in nature and the anthropogenic environments owing to several
natural and non-natural decomposition pathways of both biological and non-natural organic
matter. Formaldehyde, also called Methanal (formulated HCHO), an organic compound, the
modest of the aldehydes, used in huge amounts in a diversity of chemical manufacturing
processes. It is formed principally by the vapor-phase oxidation of methanol and is normally sold
as formalin. The chemical compound formaldehyde (also known as methanal) is a gas with a
pungent smell. It is the modest aldehyde. Its chemical formula is H2CO. Formaldehyde was first
produced by the Russian chemist Aleksandr Butlerov in 1859 but was finally identified by
August Wilhelm von Hofmann in 1868.
Formaldehyde readily results from the incomplete burning of carbon-containing materials. It may
be found in the smoke from forestry fires, in vehicle exhaust, and in tobacco smoke. In
the atmosphere, formaldehyde is formed by the action of sunlight and oxygen on
atmospheric methane and further hydrocarbons. Small amounts of formaldehyde are made as
a metabolic byproduct in maximum organisms, including humans.[1]
Figure 1.1: Formaldehyde Formula
Formaldehyde can be listed on a product tag by other names, such as: Formalin, Formic
aldehyde, Methanediol, Methanal, Methyl aldehyde, Methylene glycol, Methylene oxide.
1.2 History:
Formaldehyde is a naturally arising organic compound composed of carbon, hydrogen and
oxygen. It has a modest chemical structure of CH2O. Formaldehyde was first defined in 1859 by
Alexander Mikhailovich Butlerov when he tried to make methylene glycol. However,
formaldehyde wasn’t finally identified until 1868, when August Wilhelm von Hofmann, a
professor of chemistry and director of the laboratory of the University of Berlin, set out to clearly
create both the structure and identity of formaldehyde. The method that Hoffman used to identify
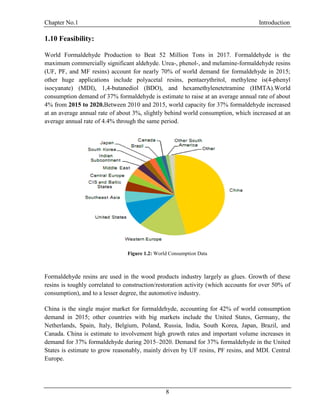
formaldehyde placed the foundation for the modern formaldehyde manufacturing process.](https://image.slidesharecdn.com/fyp-formaldehyde-180503065602/85/Production-of-66000-ton-year-of-Formaldehyde-from-Methanol-using-Silver-catalyst-Final-year-project-BSC-Chemical-Engineering-2014-2018-14-320.jpg)
![Chapter No.1 Introduction
3
1.3 Properties:
Although formaldehyde is a gas at room temperature, it is voluntarily soluble in water. It is most
normally sold as a 37 % aqueous solution with trade names such as formalin or formol. In water,
formaldehyde changes to the hydrate CH2(OH)2. Thus formalin contains very little H2CO. These
solutions typically contain a few percent methanol to limit the range of polymerization.
Formaldehyde shows most of the chemical properties of the aldehydes, but that it is more
reactive. Formaldehyde is a good electrophile. It can contribute in electrophilic aromatic
substitution reactions with aromatic compounds and can go through electrophilic addition
reactions with alkenes. In the existence of basic catalysts, formaldehyde go through a Cannizaro
reaction to produce formic acid and methanol. Formalin reversibly polymerizes to produce its
cyclic trimer, 1, 3, 5-trioxane or the linear polymer polyoxymethylene. Because of the creation of
these derivatives, formaldehyde gas diverges strongly from the ideal gas law, especially at high
pressure or low temperature. Formaldehyde is voluntarily oxidized by atmospheric oxygen to
form formic acid. Formaldehyde solutions should be protected from air [25]
.
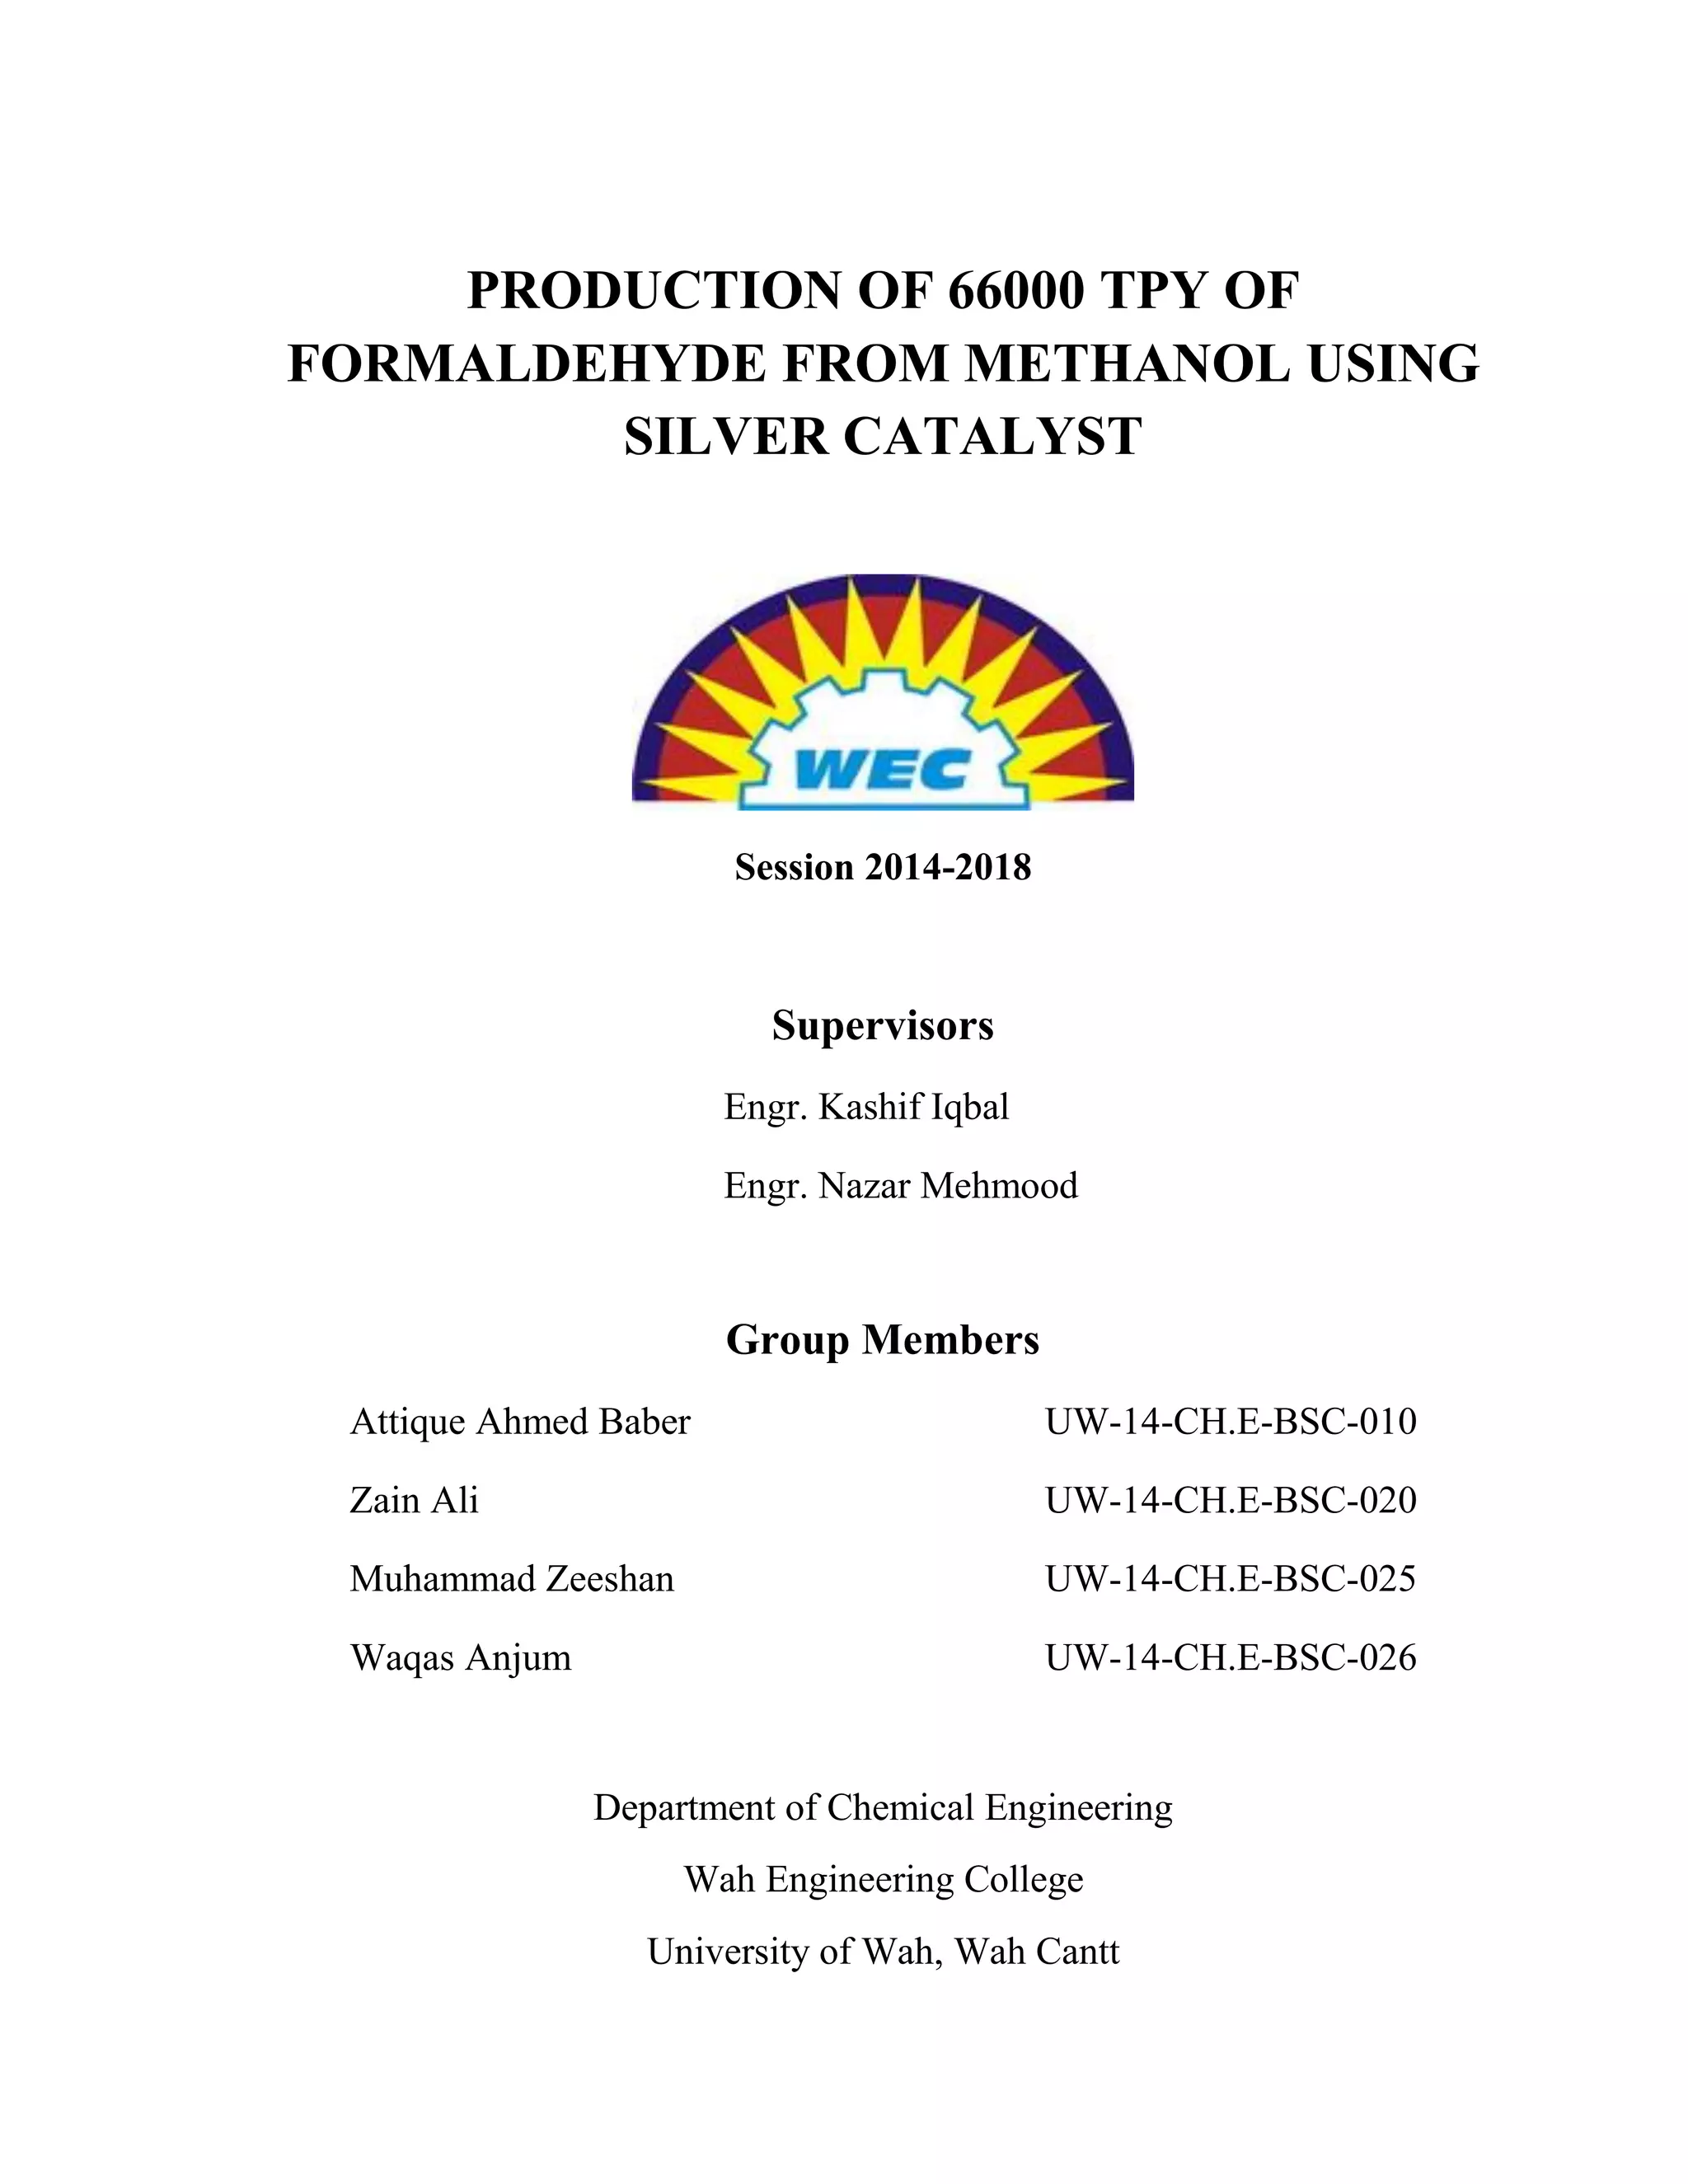
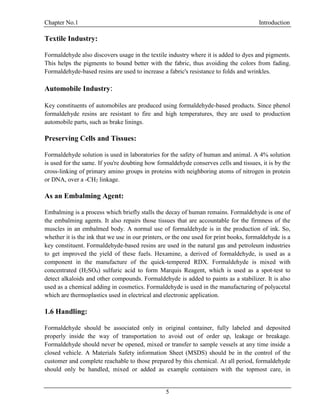
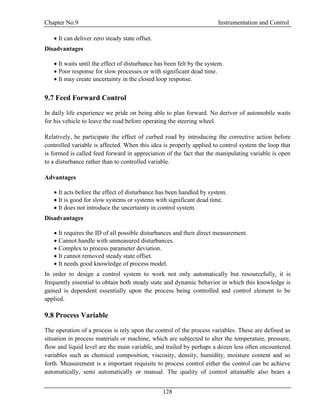
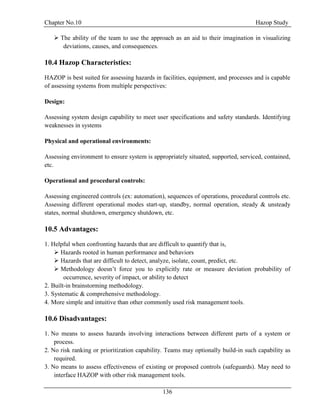
Physical& Thermal Properties:
Table 1.1: Physical & Thermal Properties
Physical Properties
Boiling point at 101.3 kPa -19.2 o
C
Melting point -118 o
C
Density at –80 o
C 0.9151g/cm3
Molecular weight 30.03
Thermal Properties
Heat of formation at 25 o
C -115.9+6.3 kJ/mol
Heat of combustion at 25 o
C 561.5 kJ/mol
Heat of vaporization at –19.2 23.32 kJ/mol
Specific heat capacity at 25o
C 35.425 J/mol K
Entropy at 25o
C 218.8 kJ/mol K
Flash Point 310o
F (154o
C)
Auto Ignition Temp 932o
F (499o
C) [1]](https://image.slidesharecdn.com/fyp-formaldehyde-180503065602/85/Production-of-66000-ton-year-of-Formaldehyde-from-Methanol-using-Silver-catalyst-Final-year-project-BSC-Chemical-Engineering-2014-2018-15-320.jpg)
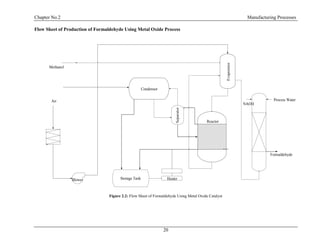
![Chapter No.2 Manufacturing Process
10
2.1 Production Methods:
For making Formaldehyde there are mostly two methods are used.
Silver Catalyst Method
Metal Oxide Catalyst Method [14]
But we are interested to make formaldehyde by Silver Catalyst Method
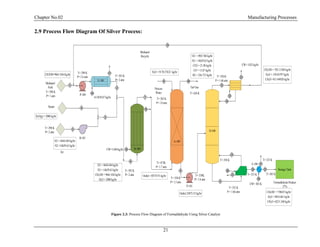
2.2 Silver Process
The silver process for the making of formaldehyde uses a silver catalyst, over which partial
oxidation and dehydrogenation of methanol take place. The reactor feed is a mixture of air, steam
and methanol, which is on the methanol-rich side of a flammable mixture and the reaction of
oxygen is almost complete. Reactions 1, 2 are the key reactions that occur during the conversion
of methanol to formaldehyde using the silver process. Reactions 3, 4, are secondary reactions,
making by-products. Extra by-products are methyl formate, methane and formic acid.
CH3OHCH2O + H2 H = +84 kJ/mol
CH3OH + ½ O2 CH2O + H2O H = -159 kJ/mol
CH2O CO + H2 H = 12.5 kJ/mol
CH3OH + 3
/2 O2 CO2 + 2 H2O H = -674 kJ/mol [17]
Process Description:
Between 50 and 60% of the formaldehyde is made via reaction 2 and the rest by reaction 1, and
this combination gives a net exothermic result. The silver catalyzed reaction mechanism will be
discussed in more detail in the next section.
The ratio of methanol to water (as steam) in the feed is normally 60:40. Steam is added to the
feed for three main reasons. It rises the total moles present, which raises the equilibrium
conversion of the endothermic reaction 1 (this reaction is preferred by high temperature, low
pressure and a high value of total moles). A second reason for the adding of steam is that it
avoids damage to the catalyst. It stops sintering of the silver (which results in loss of activity) and
reduces the rate of creation of carbonaceous deposits on the silver (that decrease the active
region). Steam also acts as a heat sink. The predominant means of temperature control is the
addition of additional methanol or steam. However, these additions are bound by the wanted
composition of the formaldehyde product. The ratio of methanol to oxygen in the feed to](https://image.slidesharecdn.com/fyp-formaldehyde-180503065602/85/Production-of-66000-ton-year-of-Formaldehyde-from-Methanol-using-Silver-catalyst-Final-year-project-BSC-Chemical-Engineering-2014-2018-22-320.jpg)
![Chapter No.2 Manufacturing Process
11
industrial reactors is about 2.5. Since the reaction is lead adiabatically, it is probable to disturb the
net exothermicity and reaction temperature increase by changing the quantity of air fed to the
reactor. The feed move in the reactor at a temperature extensively below the reactor leaving
temperature. There are two types of the silver process used. One includes the complete
conversion (97-98%) of methanol and is well-known as the BASF process. In this process silver
is used in the form of crystals and the reaction is carried out at 680 - 720 °C (at atmospheric
pressure). The feed is superheated and fed to the reactor where it permits over a bed of silver
crystals 25 - 30 mm thick. The temperature is high enough to let complete conversion (rate and
equilibrium conversion of the endothermic dehydrogenation reaction (1) increase with
temperature). Gases are cooled when they leave the reactor (to avoid unwanted side reactions)
and then fed to an absorption column where formaldehyde is wash out, giving a product that has
40-55 wt.% formaldehyde, 1.3 wt% methanol and 0.01 wt% formic acid. The yield ranges
between 89.5 and 90.5%. The largest well-known reactor for this process has a diameter of 3.2 m
and an annual production of 72000 tons, calculated as 100% formaldehyde.
The second type of the silver process includes incomplete conversion and distillative recovery of
methanol. Superheated feed passes over as bed of silver crystals 1-5 cm thick or through layers of
silver gauze. The reactor temperature lies in the range of 600-650°C. At these relatively low
temperatures the undesirable secondary reactions are suppressed. The oxygen conversion is
complete and the methanol conversion is between 77 and 87%. The gases are cooled after exit the
catalyst bed and enter to an absorption column. The product includes about 42 wt% formaldehyde
and is lead to a distillation column to recover and recycle unreacted methanol. After exiting the
distillation column the formaldehyde solution is generally fed to an anion exchange unit to
decrease the formic acid content to less than 50 mg/kg. The final product include up to 55 wt%
formaldehyde and less than 1% methanol. The overall yield is between 91 and 92%. The tail gas
for the silver process contains about 20% hydrogen and is burnt to produce steam and eliminate
releases of carbon monoxide and other organics [2]
.
2.3 Metal Oxide Process:
Main Reaction:
CH3OH + ½ O2 CH2O + H2O H = -159 kJ/mol
CH3OH + 3
/2 O2 CO2 + 2H2O H = -674 kJ/mol
CH2O + O2 CO2 + H2O H = -519 kJ/mol
Process Description:
The oxide process for formaldehyde making uses a metal oxide (modified iron molybdenum-
vanadium oxide) catalyst. The feed mixture of steam, air and methanol is thin in methanol (to](https://image.slidesharecdn.com/fyp-formaldehyde-180503065602/85/Production-of-66000-ton-year-of-Formaldehyde-from-Methanol-using-Silver-catalyst-Final-year-project-BSC-Chemical-Engineering-2014-2018-23-320.jpg)
![Chapter No.2 Manufacturing Process
14
product is very low. That’s why we select Silver Catalyst process. Moreover operating cost of
silver process is less than metal oxide process.
2.6 Capacity Selection and Its Justification:
Production of Formaldehyde in Pakistan is 340000 MT/Year. And Demand of Formaldehyde in
Pakistan is 400000 MT/Year
Capacity of Formaldehyde required to produce.
Demand-Consumption = Capacity
400000 – 340000 = 60000 ton/year
To meet this production capacity 60000 ton/year we have to produce 200 ton/day [23] [24]
.
Capacity per day * Working Day of plant = Required production capacity per year
200*330 = 66000 ton/year
We select capacity of 200 ton/day to fulfill the need of Pakistan.
Price of formaldehyde is 42-45 Rs/Kg
Table 2.2: Capacity Selection
Sr.No Companies That are Producing CH2O Capacity of CH2O ton/year
1 Super Chemical (Karachi and Lahore) 100000 ton/year
2 Dyena (Karachi and Lahore) 59000 ton/year
3 ZRK (Peshawar) 45000 ton/year
4 Wah Noble (Wah Cantt.) 30000 ton/year
5 Other Rest Companies 106000 ton/year
6 Total 340000 ton/year
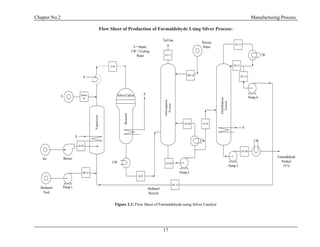
2.7 Silver Process Description and Flow Sheet:
In early formaldehyde plants methanol was oxidized over a copper catalyst but this process has
been almost completely replaced with silver. The silver catalyzed reaction occurs at essentially at
atmospheric pressure and 600 to 650 C0
and can be represented by two simultaneous reactions
CH3OH + ½ O2 → HCHO + H2O
CH3OH → HCHO + H2](https://image.slidesharecdn.com/fyp-formaldehyde-180503065602/85/Production-of-66000-ton-year-of-Formaldehyde-from-Methanol-using-Silver-catalyst-Final-year-project-BSC-Chemical-Engineering-2014-2018-26-320.jpg)
![Chapter No.2 Manufacturing Process
16
and the remaining methanol is converted over a metal oxide catalyst such as that described below
(85). In another two-stage process, both first and second stages use silver catalysts (86-88).
Formaldehyde-methanol solutions can be made directly from methanol oxidation product by
absorption in methanol. The absorber tail gas contains about 20 mol% hydrogen and has a higher
heating value of ca 2420 kJ/m3 (65 Btu/SCF). With increased fuel costs and in-creased attention
to the environment and tail gas is burned for the twofold purpose of generating steam and
eliminating organic and carbon monoxide emissions.
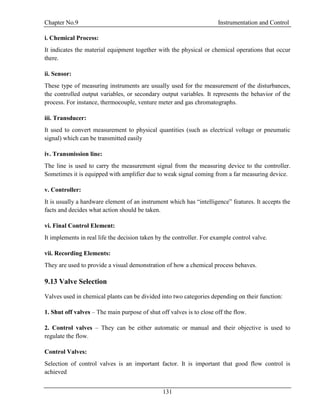
Aqueous formaldehyde is corrosive to carbon steel, but formaldehyde in the vapor phase is not.
All parts of the manufacturing equipment exposed to hot formaldehyde solutions must be a
corrosion-resistant alloy such as type-316 stainless. Theoretically the reactor and the upstream
can be carbon steel but in practice alloys are required in this part of the plant to protect the
sensitive silver catalyst from metal contamination [5]
.](https://image.slidesharecdn.com/fyp-formaldehyde-180503065602/85/Production-of-66000-ton-year-of-Formaldehyde-from-Methanol-using-Silver-catalyst-Final-year-project-BSC-Chemical-Engineering-2014-2018-28-320.jpg)

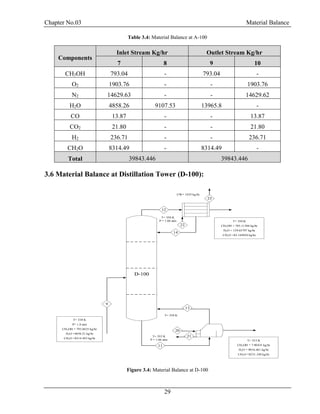
![Chapter No.03 Material Balance
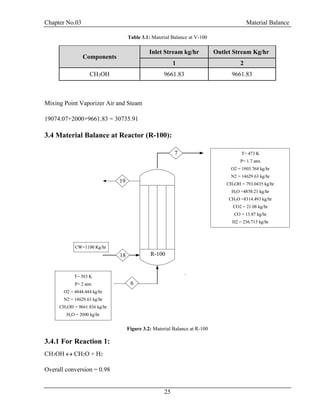
30
F = D + W
F.xf = D.xd + W.xw
Top Product: Methanol = 0.99
Bottom Product: Formaldehyde = 0.99, H2O = 0.99
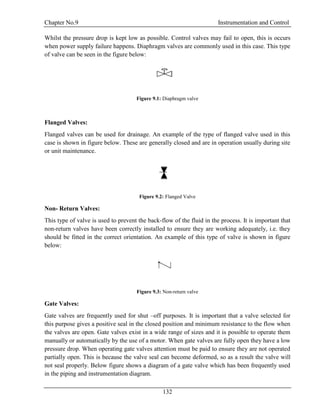
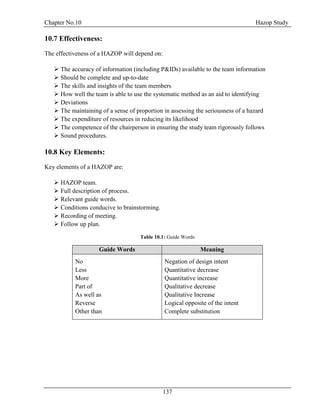
Table 3.5: Material Balance at D-100
Components
Inlet Stream
Kg/hr
Outlet Stream Kg/hr
9 12 11
CH3OH 793.04 785.11 7.93
H2O 13965.8 139.65 13826.14
CH2O 8314.49 83.14 8231.34
Total 23073.33 23073.33
From Bottom:
CH3OH =7.930435/22065.42 = 0.0003594 =0.03%
H2O =13826.14/22065.42 =0.6265 =62.65%
CH2O =8231.348/22065.42 =0.3730 =37.30% [4]](https://image.slidesharecdn.com/fyp-formaldehyde-180503065602/85/Production-of-66000-ton-year-of-Formaldehyde-from-Methanol-using-Silver-catalyst-Final-year-project-BSC-Chemical-Engineering-2014-2018-42-320.jpg)
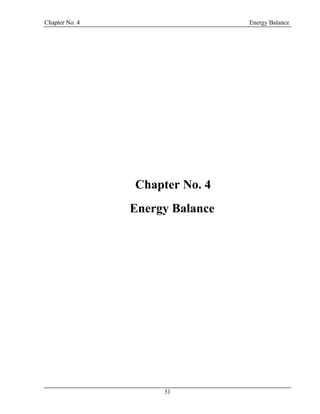
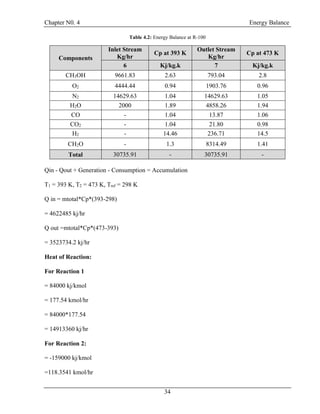
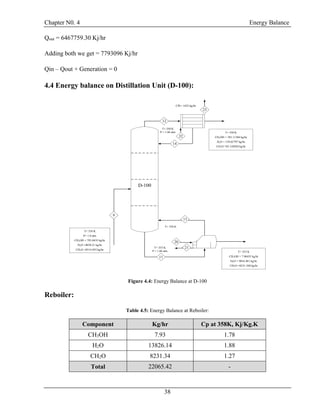
![Chapter N0. 4 Energy Balance
40
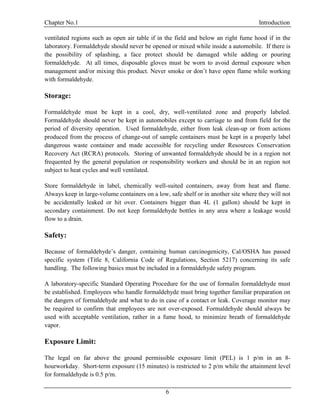
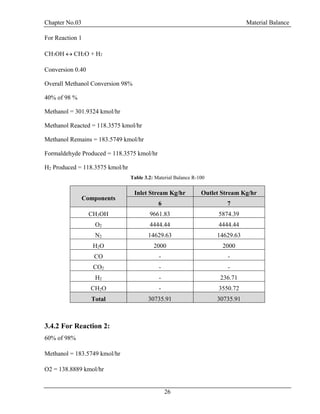
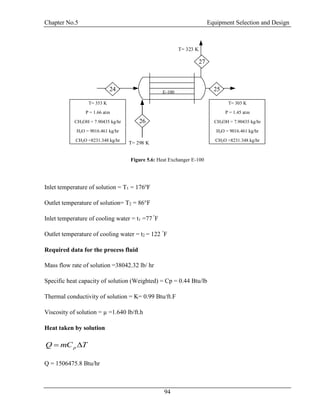
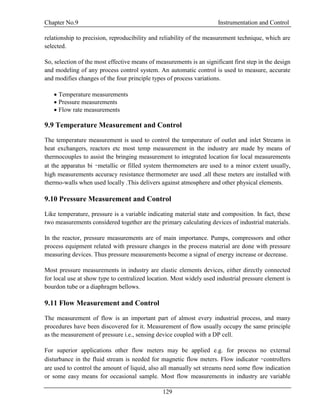
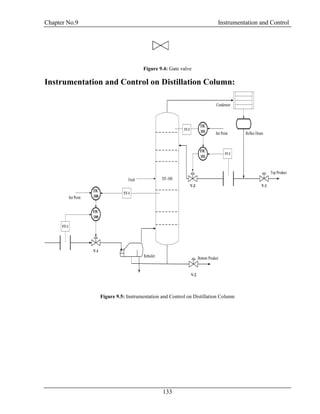
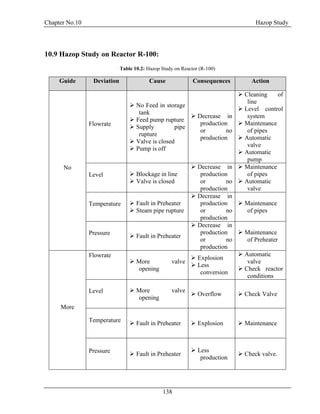
4.5 Energy Balance at Exchanger (E-100):
T= 303 K
P = 1.45 atm
CH3OH = 7.90435 kg/hr
H2O = 9016.461 kg/hr
CH2O =8231.348 kg/hr
T= 353 K
P = 1.66 atm
CH3OH = 7.90435 kg/hr
H2O = 9016.461 kg/hr
CH2O =8231.348 kg/hr
T= 298 K
T= 323 K
E-100
24
26
25
27
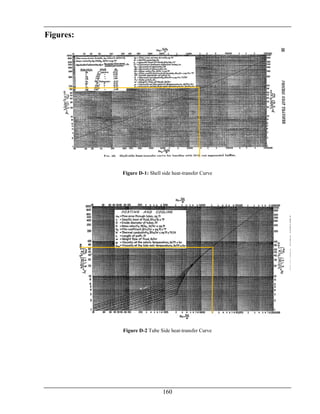
Figure 4.5: Energy Balance at E-100
T1 = 353 K, T2 = 303 K, Tmean = 328 K
Cp = 1.873 kJ/kg.K
Q=mCpΔT
=36601.539*(323)
=1830076.9 kJ/hr
For Cooling Water:
T1 = 298 K, T2 = 318 K, Tmean = 308 K
Cp = 4.204 kJ/kg.K
Q=mCpΔT
m= Q/CpΔT
=1830076.9/4.204* (293)
=21765.901kg/h [4] [15]](https://image.slidesharecdn.com/fyp-formaldehyde-180503065602/85/Production-of-66000-ton-year-of-Formaldehyde-from-Methanol-using-Silver-catalyst-Final-year-project-BSC-Chemical-Engineering-2014-2018-52-320.jpg)
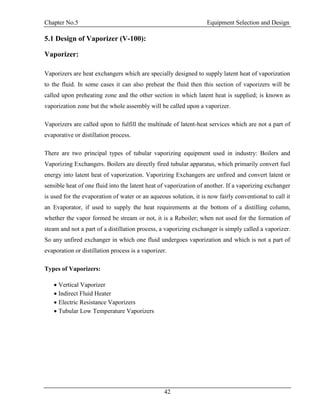
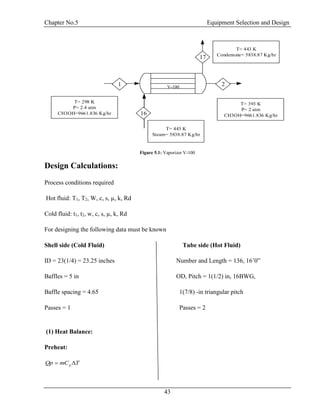
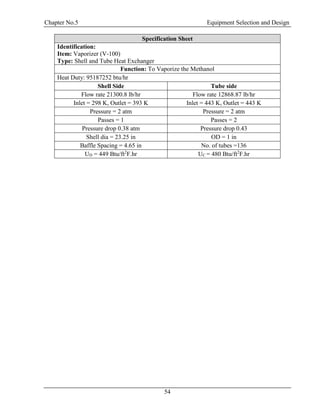
![Chapter No.5 Equipment Selection and Design
45
LMTD =
(𝑇1−𝑡2)−(𝑇2−𝑡1)
𝐿𝑛[
(𝑇1−𝑡2)
𝑇2−𝑡1
]
(LMTD) p = 127.48o
F
For Vaporizing Zone:
T1 = 338o
F T2 = 338o
F
t1 = 149o
F t2 = 248o
F
LMTD =
(𝑇1−𝑡2)−(𝑇2−𝑡1)
𝐿𝑛[
(𝑇1−𝑡2)
𝑇2−𝑡1
]
(LMTD) v = 35.177o
F
Q p / (∆t) p = 45242686.8 / 127.48 = 354900.273
Q v / (∆t) v = 49944565 / 35.17 = 1420089.996
∑ q / (∆t) = 354900.273 + 1420089.996 = 1774990.269 o
F
Weighted ∆t = Q/∑ q / (∆t)
Weighted ∆t = 11324606 / 1774990.269 o
F
Weighted ∆t = 6.38009 o
F
Assumption:
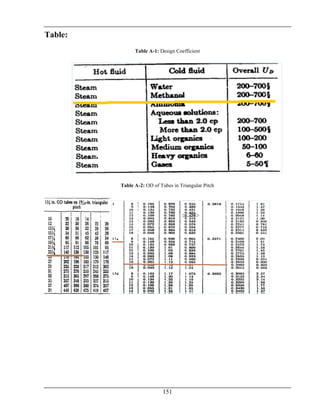
From Appendix A Table: A-1
Assume Ud = 500 Btu/hr ft2 o
F
A = Q/Ud*∆t
A = 45242686.8 / (500*127.48)
A = 709.8005 ft2
Tube Specification: 1(1/4) in, 16 BWG](https://image.slidesharecdn.com/fyp-formaldehyde-180503065602/85/Production-of-66000-ton-year-of-Formaldehyde-from-Methanol-using-Silver-catalyst-Final-year-project-BSC-Chemical-Engineering-2014-2018-57-320.jpg)
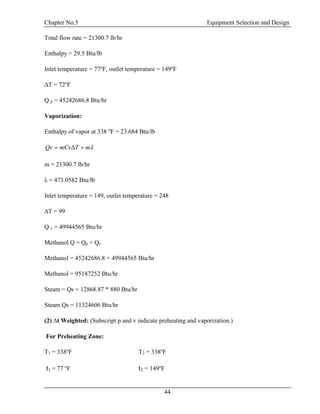
![Chapter No.5 Equipment Selection and Design
51
Pressure Drop
Tube Side, Steam:
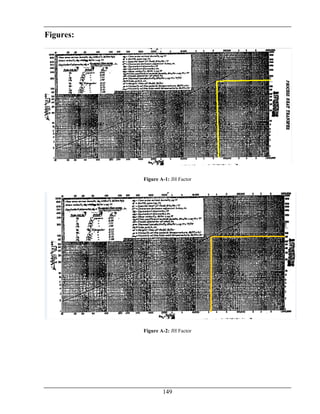
(1): For Reynolds tube side = 71135.7, f = 0.00018 ft2
/in2
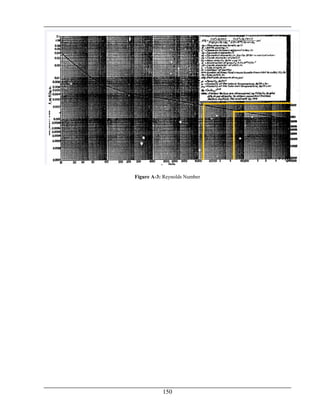
From Appendix A Figure: A-3
Specific volume of steam at 14.7 Pisa = 26.8 ft2
/ lb
S = 1/ (26.8*62.5)
S = 0.000597015
(2):
Dspt
LnfG
P t 10
2
2
1
1022.5
1000597015.00.07251022.5
216087.65E0.00018
102
1
tP
∆Pt = 6.4422 psi (Allowable 10 psi)
Shell Side, Methanol:
Preheat:
(1): Re = 65848.022f = 0.0015 ft2
/ in2 [fig 29]
(2): Length of preheat zone:
Lp = Lap / Ac
Lp = 16*1390.8231/ 17702.641 = 1.2570537 ft
(3): No. of crosses:
N+1 = 12Lp/B
N+1 = 12*1.2570537 / 5 = 3.01693
S = 0.5, Ds = 23.25/5 = 1.9375, G^2 = 6.3175E+10](https://image.slidesharecdn.com/fyp-formaldehyde-180503065602/85/Production-of-66000-ton-year-of-Formaldehyde-from-Methanol-using-Silver-catalyst-Final-year-project-BSC-Chemical-Engineering-2014-2018-63-320.jpg)
![Chapter No.5 Equipment Selection and Design
53
S mean = (0.00103 + 0.50) / 2 = 0.2505126
sDeS
NDsfG
PS s
10
2
1
1022.5
1
1
w
s
125.09375.11022.5
3831.350.827106.3175E0.0021
10
PS
∆PS = 5.480027 psi
∆PS (total) = 5.73 psi (Allowable 10 psi) [9] [18]](https://image.slidesharecdn.com/fyp-formaldehyde-180503065602/85/Production-of-66000-ton-year-of-Formaldehyde-from-Methanol-using-Silver-catalyst-Final-year-project-BSC-Chemical-Engineering-2014-2018-65-320.jpg)

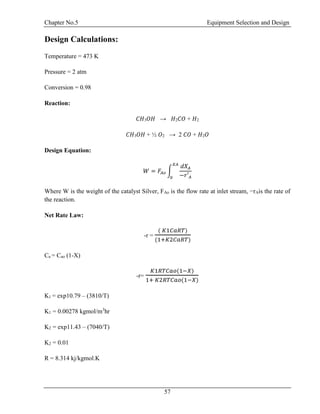
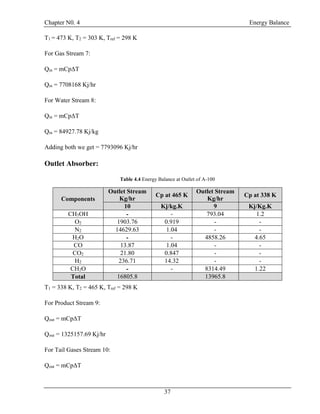
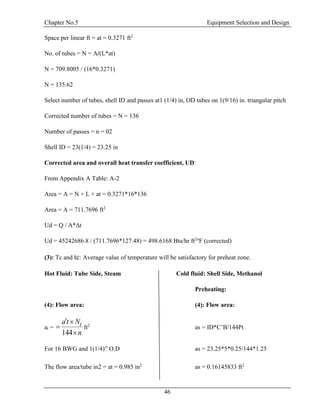
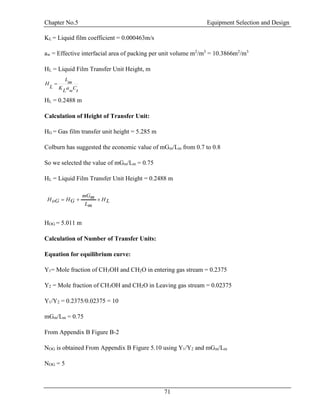
![Chapter No.5 Equipment Selection and Design
59
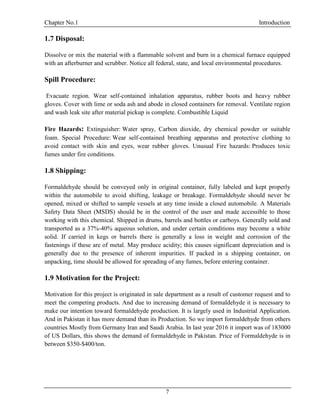
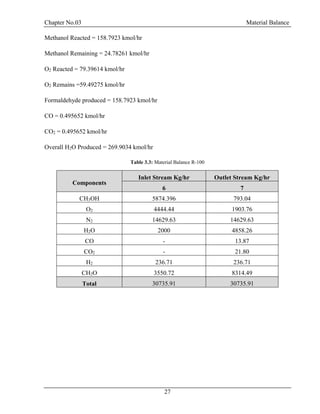
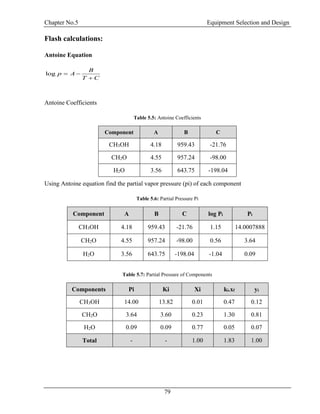
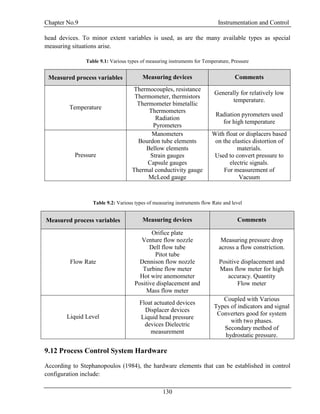
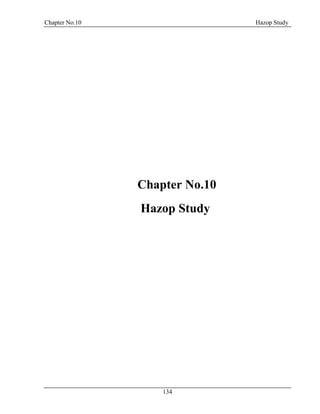
Levenspiel Plot:
Plot Between conversion and inverse of rate law:
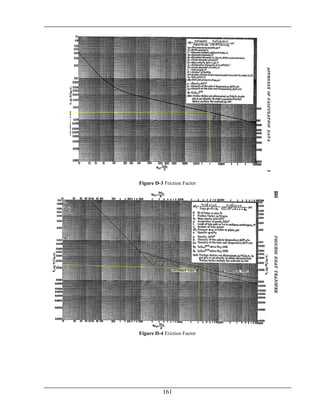
Figure 5.3: Levenspiel Plot between Conversion and Inverse of Rate Law
Weight of Catalyst:
Simpson two point rule:
∆X= 0.98-0 = 0.98
= 0.98/2 = 0.49
W =
∆X
2
[
FAo
−r′
A(X = 0)
+
FAo
−r′
A(X = 0.98)
]
=0.49*(2899.415037 + 144968.1514)
W = 72455.11 kg
Density of Catalyst:
= 10490 kg/m3
Volume of Catalyst (Vc):
= Weight of catalyst/Density
0
200000
400000
600000
800000
1000000
1200000
0 0.2 0.4 0.6 0.8 1 1.2
InverseOfRateLaw(1/-ra)
Conversion (X)
Levenspiel Plot](https://image.slidesharecdn.com/fyp-formaldehyde-180503065602/85/Production-of-66000-ton-year-of-Formaldehyde-from-Methanol-using-Silver-catalyst-Final-year-project-BSC-Chemical-Engineering-2014-2018-71-320.jpg)
![Chapter No.5 Equipment Selection and Design
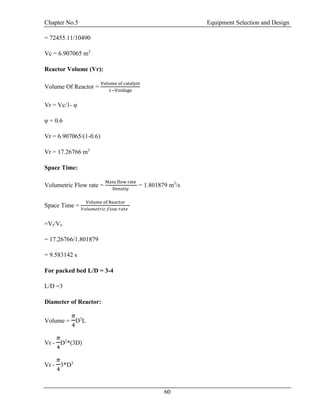
62
Volumetric flow rate = mass flow rate / density
Volumetric flow rate = 1.801878906 m3/s
Superficial velocity = volumetric flow rate / cross sectional area = 0.6163 m/s
Average Density of feed = 4.73825 kg/m3
Average viscosity of feed = 0.00047035 kg/m sec
Dp = 0.004 m
L = 5.789637 m
Ɛ = 0.5
Putting values in Pressure Drop equation
∆P/L = 6299.08
∆P = 36469.42 pas
∆P = 36469.42/105
∆P = 0.32 atm [20]](https://image.slidesharecdn.com/fyp-formaldehyde-180503065602/85/Production-of-66000-ton-year-of-Formaldehyde-from-Methanol-using-Silver-catalyst-Final-year-project-BSC-Chemical-Engineering-2014-2018-74-320.jpg)
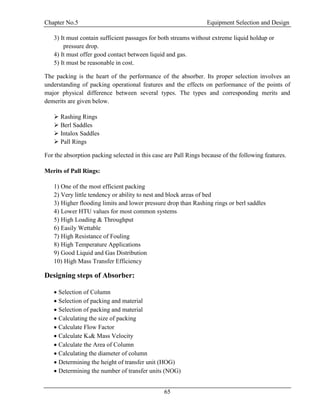
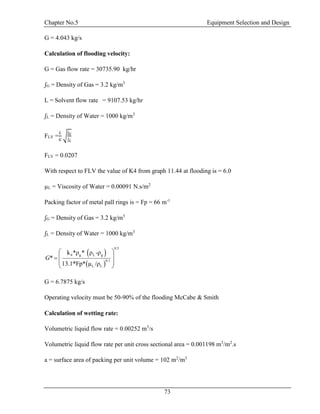
![Chapter No.5 Equipment Selection and Design
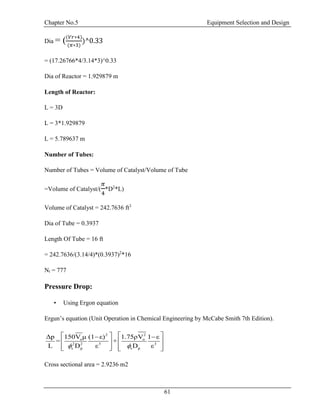
75
ʃG = Density of Gas = 3.2 kg/m3
ʃL = Density of Water = 1000 kg/m3
µL = Viscosity of Water = 0.00091 N.s/m2
𝐺2
∗ 𝐹𝑝 ∗ µ0.1
ʃ 𝑔(ʃ𝑙 − ʃ 𝑔)𝑔𝑐
= 0.07633
With respect to
𝐺 𝑥
𝐺 𝑦
√
ʃ 𝑦
(ʃ 𝑥−ʃ 𝑦)
and
𝐺2∗𝐹𝑝∗µ0.1
ʃ 𝑔(ʃ 𝑙−ʃ 𝑔)𝑔 𝑐
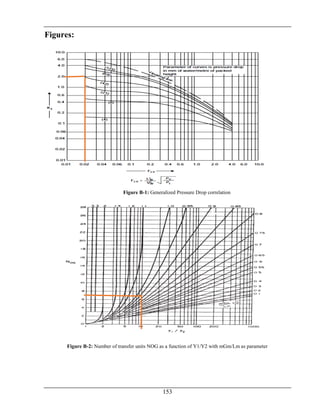
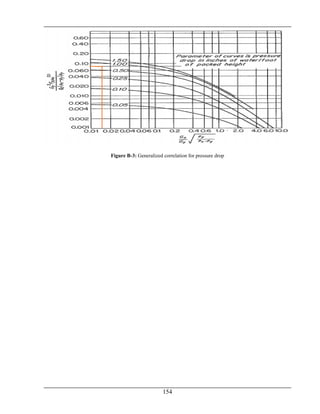
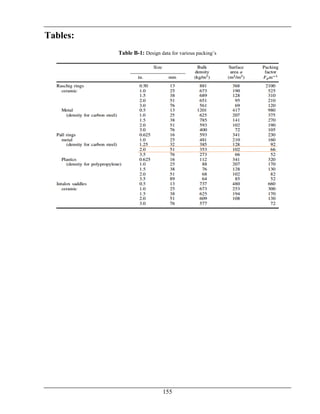
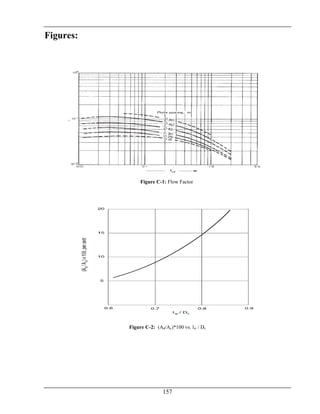
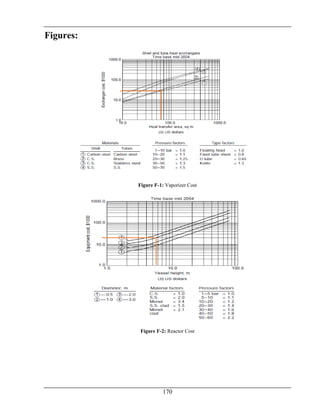
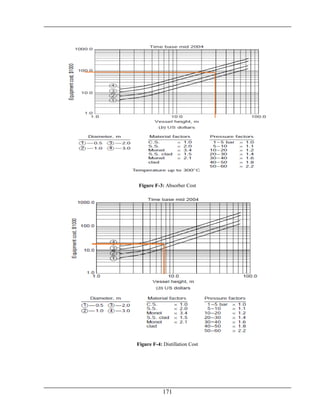
pressure drop from the graph will be From Appendix B
Figure B-3
ΔP = 0.72 in.H2O/ft of packing
ΔP = 1.764mmH2O/ft of packing
ΔP = 5.785 mmH2O/m of packing
Total Height of packing = 25 m
Total ΔP = ΔP*Total Height of packing
Total ΔP = 5.785*25
Total ΔP = 144.791 mmH2O
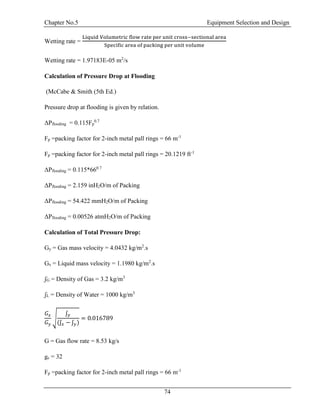
Total ΔP = 0.2 atm [17]](https://image.slidesharecdn.com/fyp-formaldehyde-180503065602/85/Production-of-66000-ton-year-of-Formaldehyde-from-Methanol-using-Silver-catalyst-Final-year-project-BSC-Chemical-Engineering-2014-2018-87-320.jpg)
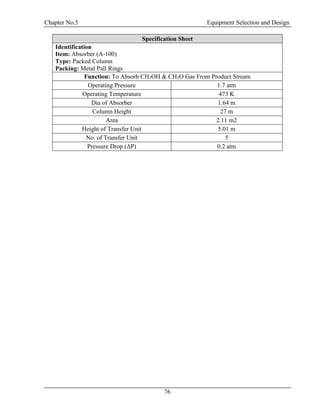
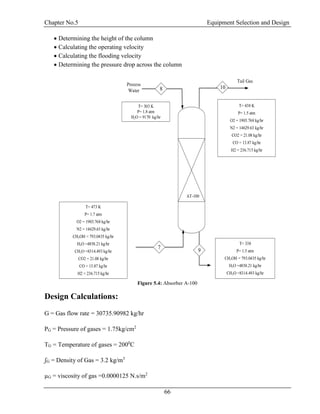
![Chapter No.5 Equipment Selection and Design
77
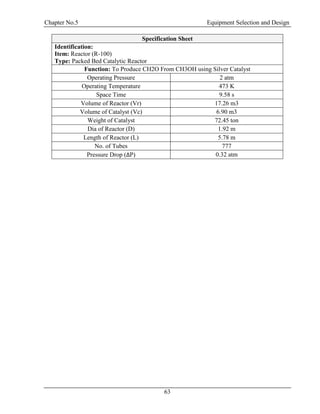
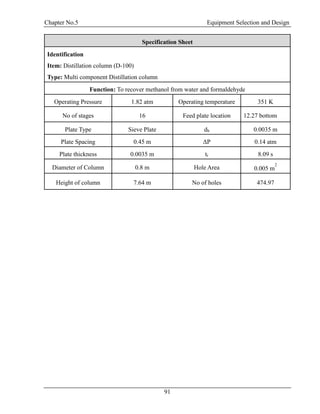
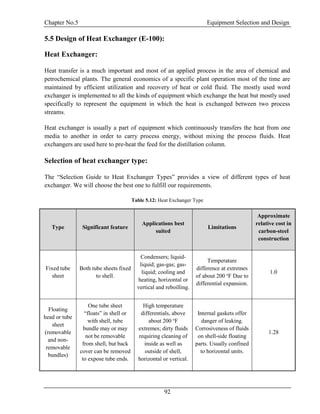
5.4 Design of Distillation Column (D-100):
The purpose of following distillation design is to recover unreacted methanol from the solution of
water and formaldehyde. Methanol is recovered from the top and mixture of water and
formaldehyde is received from the bottom of the column.
Types of distillation:
There two major types on the basis of operation:
Batch distillation
Continuous distillation
Choice of Distillation Column:
Here continuous distillation is selected to get continuous and large quantity of product in a short
period. Operating pressure is one atm, moderated temperature. Sieve plates are used for
economical separation.
Table 5.3: Choice of Distillation
Comparing
Parameters
Valve Plate
Bubble Cap
Plate
Sieve Plate
Cost Moderate High Low
Capacity Low Low High
Pressure Drop Moderate High Low
Fouling High High Low
Designing steps:
Steps for design of Distillation Column are following[36].
Bubble point and Dew point calculation
Minimum Reflux Ratio Rm.
Optimum reflux ratio.
Theoretical number of stages.
Actual number of stages.
Diameter of the column.
Weeping point.
Residence time.](https://image.slidesharecdn.com/fyp-formaldehyde-180503065602/85/Production-of-66000-ton-year-of-Formaldehyde-from-Methanol-using-Silver-catalyst-Final-year-project-BSC-Chemical-Engineering-2014-2018-89-320.jpg)
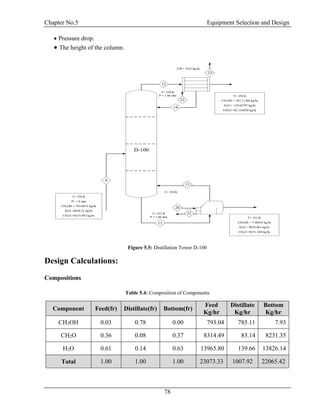
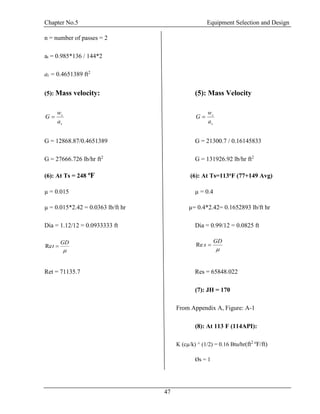
![Chapter No.5 Equipment Selection and Design
81
αi = 3.84
i i
i
i i
x
y
x
yi = 0.12
1
c
i i
k
x
kc = 3.59
Bubble point of feed is 338 K at 1.8 atm
Dew Point Calculation of Top
T = 350 K
P = 1.8 atm
Table 5.9: Dew Point Calculation of Top
Components Α Ki Xd Σxi=ΣXd/Ki
CH3OH 3.84 13.82 0.78 0.06
CH2O 1.00 3.60 0.08 0.02
H2O 0.03 0.09 0.14 1.54
Total - - - 1.62
So Dew Point is 350 K at 1.8 atm
Bubble Point Calculation of Bottom:
Table 5.10: Bubble Point Calculation of Bottom
Components Ki xb Ki..x b
CH3OH 17.77 0.00 0.01
CH2O 2.31 0.37 0.86
H2O 0.21 0.63 0.13
Total - - 1.00
So the bubble point is 355 K at 1.8 atm [8]](https://image.slidesharecdn.com/fyp-formaldehyde-180503065602/85/Production-of-66000-ton-year-of-Formaldehyde-from-Methanol-using-Silver-catalyst-Final-year-project-BSC-Chemical-Engineering-2014-2018-93-320.jpg)
![Chapter No.5 Equipment Selection and Design
83
1 i f
i
x
q
As feed is at boiling point so
1q
1 0q
Calculation of minimum reflux ratio
1 i d
m
i
x
R
Rm = 3.93
R = 3.93(1.2) = 4.72
Ideal no of stages:
Fenskey equation
min
log
1
log
lk hk
hk lkd b
lk
x x
x x
N
Nmin +1 = 7.88
Nmin = 6.88
To estimate ideal number of stages use Eduljee relationship
𝑁 − 19.86
𝑁 + 1
= 0.75 [1 − (
𝑅 − 𝑅 𝑚𝑖𝑛
𝑅 + 1
)
0.566
]
𝑁 − 19.86
𝑁 + 1
= 0.75 [1 − (
4.72 − 3.93
4.72 + 1
)
0.566
]
N = 14.87
Sample calculation for heavy key](https://image.slidesharecdn.com/fyp-formaldehyde-180503065602/85/Production-of-66000-ton-year-of-Formaldehyde-from-Methanol-using-Silver-catalyst-Final-year-project-BSC-Chemical-Engineering-2014-2018-95-320.jpg)
![Chapter No.5 Equipment Selection and Design
89
0.7vap w
act
v h
V
U
A
𝑈 𝑎𝑐𝑡
𝑣𝑎𝑝
= 0.47
𝑚
𝑠
𝐼 𝑝 = 2.8 × 4
𝐼 𝑝 = 9.8 𝑚𝑚
Dry tray Pressure drop:
2
0.9
h h
p p
dA
A l
𝐴ℎ
𝐴 𝑝
= 0.9 × [
3.5
11.20
]
0.114
h
p
A
A
𝑃𝑙𝑎𝑡𝑒 𝑇ℎ𝑖𝑐𝑘𝑛𝑒𝑠𝑠
𝑑ℎ
=
3
3.5
𝑃𝑙𝑎𝑡𝑒 𝑇ℎ𝑖𝑐𝑘𝑛𝑒𝑠𝑠
𝑑ℎ
= 0.86
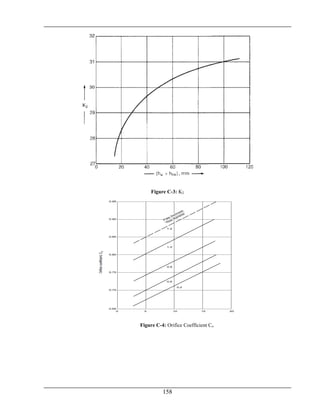
From Appendix C Figure C-4
Co = 0.81
2
51
h v
d
o L
U
h
C
ℎ 𝑑 = 10.96 𝑚𝑚 of liquid
Residual head:
3
12.5*10
r
L
h
](https://image.slidesharecdn.com/fyp-formaldehyde-180503065602/85/Production-of-66000-ton-year-of-Formaldehyde-from-Methanol-using-Silver-catalyst-Final-year-project-BSC-Chemical-Engineering-2014-2018-101-320.jpg)
![Chapter No.5 Equipment Selection and Design
90
ℎ 𝑟 = 15.39 𝑚𝑚
Plate Pressure Drop:
3
9.81 10t t lP h
𝛥𝑃𝑡 = 642.87 𝑝𝑎
Area of Single Hole =
2
4
hd
Area of single hole= 0.000010 m2
No. of holes = 474.97
Total Drop:
t d w ow rh h h h h
ℎ 𝑡 = 80.70 𝑚m
Pressure Drop:
ΔP = 9.8 * 10-3
h1ρ
=0.14 atm [10]](https://image.slidesharecdn.com/fyp-formaldehyde-180503065602/85/Production-of-66000-ton-year-of-Formaldehyde-from-Methanol-using-Silver-catalyst-Final-year-project-BSC-Chemical-Engineering-2014-2018-102-320.jpg)

![Chapter No.5 Equipment Selection and Design
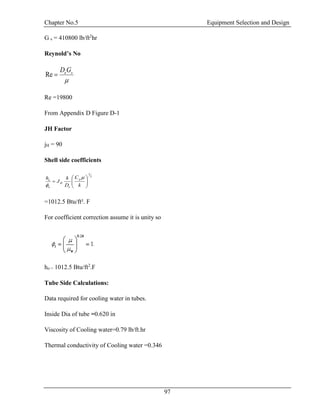
95
Mass flow rate of water
Mass flow of cooling water = m= 47985.59 lb/hr
LMTD
LMTD =
(𝑇1−𝑡2)−(𝑇2−𝑡1)
𝐿𝑛[
(𝑇1−𝑡2)
𝑇2−𝑡1
]
= 25.15 o
F
Since cooling water is condensing medium therefore R = 2, S=0.45 and FT =0.62 so
tTm
=15.59 o
F
Assumed calculations
From Appendix D Table D-1
Value of UD assumed UD = 250Btu/ft2
.F
Heat transfer area
tU
Q
A
D
A= 389.4 ft2
From Appenndix D Table D-2
Tube O.D. = 0.75 ft
From Appendix D Table D-3
BWG=16
Tube pitch=PT = 1 in square
No.of passes=Nt=2](https://image.slidesharecdn.com/fyp-formaldehyde-180503065602/85/Production-of-66000-ton-year-of-Formaldehyde-from-Methanol-using-Silver-catalyst-Final-year-project-BSC-Chemical-Engineering-2014-2018-107-320.jpg)
![Chapter No.5 Equipment Selection and Design
96
Internal area per unit length of tube =at =0.042 ft2
No. of tubes required are
=
𝐴
(𝑎𝑡)∗(𝐿−(𝑡𝑢𝑏𝑒 𝑠ℎ𝑒𝑒𝑡 𝑡ℎ𝑖𝑐𝑘𝑛𝑒𝑠𝑠)
= 123 tubes
From nearest tube count Table
For 124 tubes shell I.D. for two pass = 15.25 in
Shell Side Calculations:
Shell side data
Shell outer diameter =ID =15.25 in
Baffle spacing on shell side =B =3.65 in [Eq. (11.4)]
Tube pitch=PT= 3/4in square= 1 in square
Tube OD =0.75 in
Clearance between tubes = C/
= PT -O.D=1-0.75 =0.25 in
Equivalent diameter of shell for square pitch with clearance
= De = 0.0792 ft
Flow area
T
s
P
BIDxC
a
'
a s =0.0926 ft2
Mass velocity
s
s
a
W
G ](https://image.slidesharecdn.com/fyp-formaldehyde-180503065602/85/Production-of-66000-ton-year-of-Formaldehyde-from-Methanol-using-Silver-catalyst-Final-year-project-BSC-Chemical-Engineering-2014-2018-108-320.jpg)
![Chapter No.5 Equipment Selection and Design
99
Dirt factor:
Rd = (Uc-Ud)/(Uc*Ud)
Rd = 0.00165
Pressure Drop (Shell Side):
From Appendix D Figure D-3
Friction factor for shell side = f = 0.0018ft2
/in2
Diameter of the shell =Ds =1.104 ft
No. of crosses, N+1 = 12L/B = 54.8
se
ss
s
sDx
NDfG
P
11
2
1054.2
)1(
ΔPs=6.17 psi
Pressure Drop(Tube Side):
From Appendix D Figure D-4
Friction factor for tube side = f = 0.00025 ft2/in2
t
t
s
Dsx
LnfG
P
11
2
1054.22
1
ΔPs= 3.30 psi
Both pressure drops are in allowable limit
Result:
The unit has been designed satisfactorily [18]](https://image.slidesharecdn.com/fyp-formaldehyde-180503065602/85/Production-of-66000-ton-year-of-Formaldehyde-from-Methanol-using-Silver-catalyst-Final-year-project-BSC-Chemical-Engineering-2014-2018-111-320.jpg)
![Chapter No.6 Mechanical Design
105
𝜎𝑟 = 0.101 𝑁/𝑚𝑚2
6.11 Bending Moment:
𝑀𝑥 =
𝑊𝑋2
2
𝑀𝑥 = 33.457 𝑁𝑚𝑚
6.12 Dead Weight Stress:
𝜎 𝑤 =
𝑊𝑣
𝜋𝑡(𝐷𝑖 + 𝑡)
𝜎 𝑤 = 29.50 𝑁/𝑚𝑚2
6.13 Bending Stress:
𝐼𝑣 =
𝜋(𝐷𝑜
4
− 𝐷𝑖
4
)
64
𝐼𝑣 = 1.17 ∗ 1010
𝑚𝑚4
𝜎𝑏 =
𝑀𝑥
𝐼𝑣
(
𝐷𝑖
2
+ 𝑡)
𝜎𝑏 = 2.76
𝑁
𝑚𝑚2
6.14 Allowable Stress Intensity:
Circumferential Stress:
σ1 =
1
2
[σh + σ 𝑧 + √(σh − σ 𝑧)2 + 4𝑡2]
σ1 = 52 N/mm2
Longitudinal Stress:
σ2 =
1
2
[σh + σ 𝑧 − √(σh − σ 𝑧)2 + 4𝑡2]
σ2 = 32.27 N/mm2](https://image.slidesharecdn.com/fyp-formaldehyde-180503065602/85/Production-of-66000-ton-year-of-Formaldehyde-from-Methanol-using-Silver-catalyst-Final-year-project-BSC-Chemical-Engineering-2014-2018-117-320.jpg)
![Chapter No.6 Mechanical Design
106
Radial Stress:
σ3 = 0.5P
σ3 = 0.101 N/mm2
σ1 − σ2 = 19.73 N/mm2
σ1 − σ3 = 51.90 N/mm2
σ2 − σ3 = 32.17 N/mm2
σ1 − σ3 < 𝑓
The vessel wall thickness is sufficient to ensure the maximum stress intensity does not exceed the
design stress. [16] [17]](https://image.slidesharecdn.com/fyp-formaldehyde-180503065602/85/Production-of-66000-ton-year-of-Formaldehyde-from-Methanol-using-Silver-catalyst-Final-year-project-BSC-Chemical-Engineering-2014-2018-118-320.jpg)
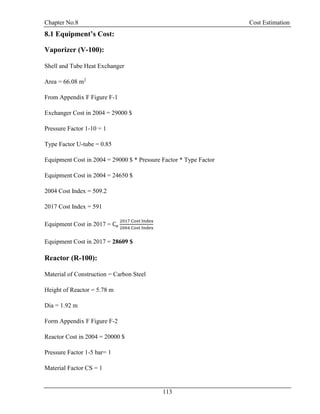
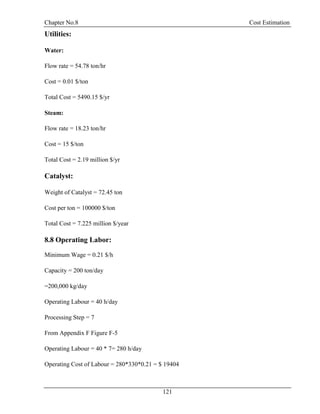
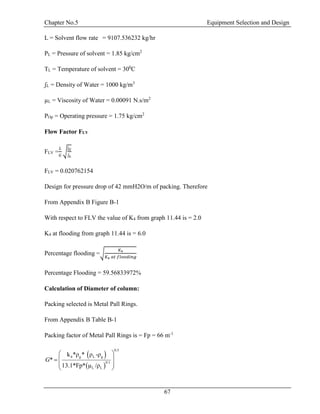
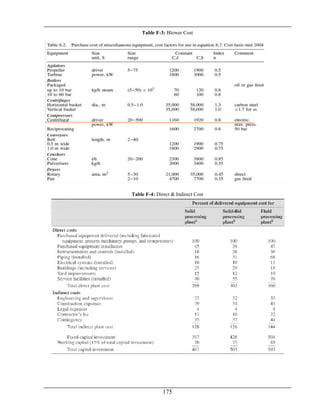
![Chapter No.8 Cost Estimation
123
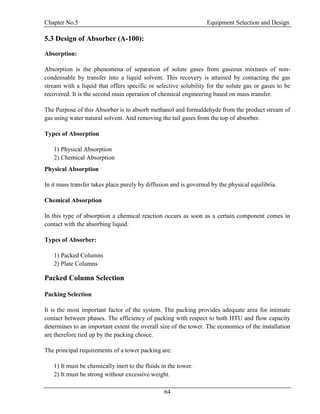
8.10 General Expenses:
Table 8.3: General Expenses
Function
Percentage of Total
Production Cost
Cost ($)
Administration 2% 300201.08
Distribution and Marketing 2% 300201.08
Research and Development 5% 750502.70
Total 1350904.87
General Expenses = 1.35 million $/yr
Total Production Cost = Manufacturing Cost + General Expenses
= 16.36 million $/yr
Total Production Cost/Capacity (ton/year) = 16360958.96 /66000
= 247.89 $/ton
8.11 Depreciation:
Depreciation = D =
V− Vs
N
FCI = V = $ 2.42 million
Salvage Value = s = 5%
Number of Years = N = 20 yr
D = $ 0.11 million
8.12 Gross Earning:
Capacity = 66000 ton /yr
Selling Price = 300 $/ton [12]
Total Income = 19.80 million $/yr](https://image.slidesharecdn.com/fyp-formaldehyde-180503065602/85/Production-of-66000-ton-year-of-Formaldehyde-from-Methanol-using-Silver-catalyst-Final-year-project-BSC-Chemical-Engineering-2014-2018-135-320.jpg)
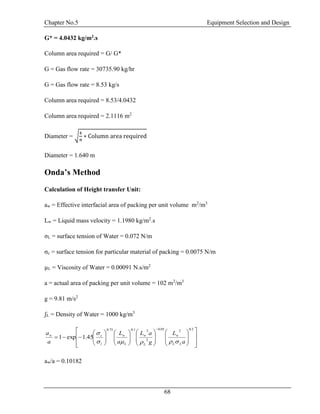
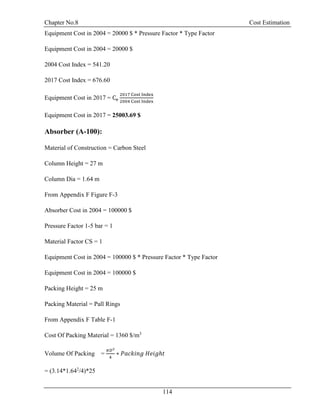
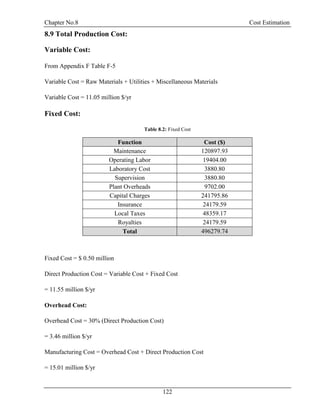
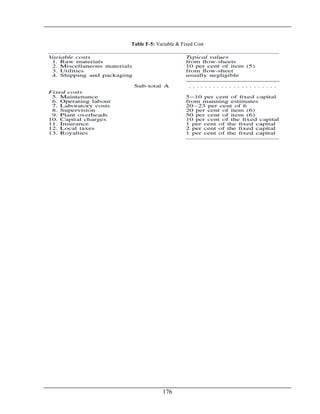
![Chapter No.8 Cost Estimation
124
Gross Income = Total Income – Total Production Cost – Depreciation
= 3.32 million $/yr
Taxes = 40% Gross Income
Taxes = 1.33 million $/yr
Net Income = Gross Income – Taxes
= 1.99 million $/yr
8.13 Rate of Return (ROR):
ROR =
Net Income
Total Capital Investment
∗ 100
= 71.73%
8.14 Payback Period:
Payback Period =
1
ROR
∗ 100
= 1.39years [19]](https://image.slidesharecdn.com/fyp-formaldehyde-180503065602/85/Production-of-66000-ton-year-of-Formaldehyde-from-Methanol-using-Silver-catalyst-Final-year-project-BSC-Chemical-Engineering-2014-2018-136-320.jpg)
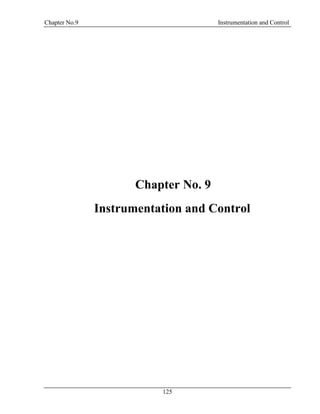
![Chapter No. 11 Environmental Impact Assessment
143
11.2.3 Spills and emergencies
Dilute with water and mop up, or absorb with an inert dry material and place in an appropriate
waste disposal container. Flammable liquid. Poisonous liquid. Keep away from heat. Keep away
from sources of ignition. Stop leak if without risk. Absorb with Dry earth, sand or other non-
combustible material. Do not get water inside container. Do not touch spilled material [13]
.
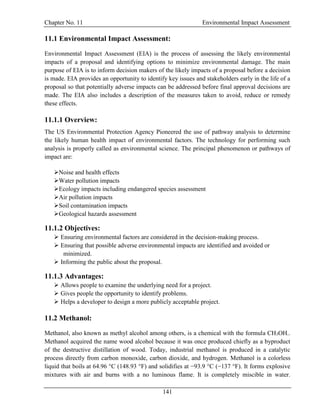
11.3 Formaldehyde:
Formaldehyde (systematic name methanal), is a naturally occurring organic compound with the
formula CH2O (H-CHO). It is the simplest of the aldehydes. Formaldehyde is a colorless
poisonous gas synthesized by the oxidation of methanol and used as an antiseptic, disinfectant,
histologic fixative, and general-purpose chemical reagent for laboratory applications.
Formaldehyde is readily soluble in water and is commonly distributed as a 37% solution in water;
formalin, a 10% solution of formaldehyde in water, is used as a disinfectant and to preserve
biological specimens. Environmentally, formaldehyde may be found in the atmosphere, smoke
from fires, automobile exhaust and cigarette smoke. Small amounts are produced during normal
metabolic processes in most organisms, including humans.
11.3.1 Hazards:
11.3.1.1 Fire Hazards:
Formaldehyde becomes a fire or explosion hazard in the presence of heat, flames or other sources
of ignition. Upon ignition, the chemical decomposes into carbon oxides (i.e. carbon monoxide,
carbon dioxide), which can be hazardous to humans. Use dry Chemical, CO2, water spray or
alcohol resistant foam as extinguisher agents. Use water spray to reduce the vapors.
11.3.1.2 Health Hazard:
Formaldehyde can be highly toxic if swallowed, inhaled or absorbed though skin. Ingestion of as
little as 30 mL of a solution containing 37% formaldehyde has been reported to cause death in
adults. Formaldehyde is classified as a suspected human carcinogen, based on evidence obtained
from human and/or animal studies. Exposure to formaldehyde can lead to allergic reactions in
certain individuals. Sensitization is an immune response. Formaldehyde can become irritating to
the eyes at low concentrations. Irreversible damage. At concentrations near 0.1 parts per million
(ppm), exposure to formaldehyde can be irritating to the skin, eyes and respiratory tract.
Symptoms of exposure include coughing, wheezing, dermatitis, headaches, watery eyes, nausea,
chest tightness and burning sensations in the eyes, nose and throat. Long-term exposure can result
in headaches, insomnia, depression, mood changes, attention deficit and impairment of dexterity,
memory and equilibrium.](https://image.slidesharecdn.com/fyp-formaldehyde-180503065602/85/Production-of-66000-ton-year-of-Formaldehyde-from-Methanol-using-Silver-catalyst-Final-year-project-BSC-Chemical-Engineering-2014-2018-155-320.jpg)
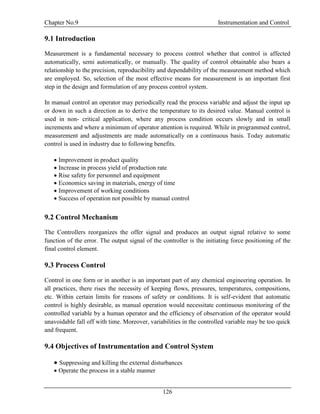
![Chapter No. 11 Environmental Impact Assessment
144
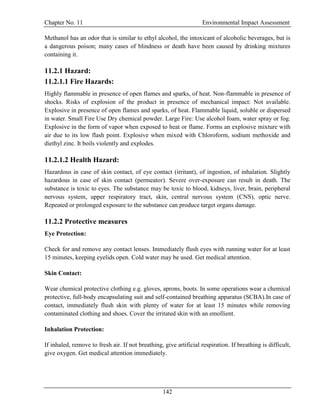
11.3.2 Protective measures
11.3.2.1 Eye Protection:
Tight-fitting safety goggles or a full face shield (8-inch minimum) should be worn when handling
formaldehyde.
11.3.2.2 Foot Protection:
Closed-toed footwear is required in all laboratories with hazardous chemicals.
11.3.2.3 Hand Protection:
Concentrated formaldehyde solutions (i.e. 10% or greater) should be handled with medium or
heavyweight nitrile, neoprene, natural rubber or PVC gloves.
11.3.2.4 Skin and Body Protection:
In most laboratories, a lab coat or chemical-resistant apron should be worn when handling
formaldehyde. Further protection for the body may be necessary depending on the concentrations
of formaldehyde being used and operations being performed.
11.3.2.5 Respiratory Protection:
Researchers working in labs with formaldehyde that have exceeded the OSHA action level,
permissible exposure limit or short-term exposure limit may be required to wear respiratory
protection. All employees required to wear respirators in laboratories must have a medical
evaluation, training and a fit test prior to use.
11.3.3 Spills and emergencies:
Evacuate the personal and secure and control entrance to area. Eliminate all the ignition source.
Absorb liquids in vermiculite, dry sand, earth, or a similar material and place into sealed
container for disposal. Ventilate and wash area after clean-up is complete [1]
.](https://image.slidesharecdn.com/fyp-formaldehyde-180503065602/85/Production-of-66000-ton-year-of-Formaldehyde-from-Methanol-using-Silver-catalyst-Final-year-project-BSC-Chemical-Engineering-2014-2018-156-320.jpg)
![145
References:
[1]. Formaldehyde,” Wikipedia. Wikimedia Foundation, Web
Web < http://en.wikipedia.org/wiki/Formaldehyde>
[2]. "Formaldehyde Production from Methanol." McMaster University,
[3]. Couper, James R. Chemical Process Equipment: Selection and Design. Amsterdam: Elsevier,
2005. Print.
[4]. Felder, Richard M., and Ronald W. Rousseau. Elementary Principles of Chemical Processes.
New York: Wiley, 2005. Print.
[5]. Kirk, Raymond E., Donald F. Othmer, Jacqueline I. Kroschwitz, and Mary Howe-Grant.
Encyclopedia of Chemical Technology. New York: Wiley, 1991. Print.
[6]. Rosaler, Robert C. Standard Handbook of Plant Engineering. New York: McGraw-Hill,
1995. Print.
[7]. ScienceLab: Chemicals & Laboratory Equipment." ScienceLab: Chemicals & Laboratory
Equipment Web <http://www.sciencelab.com/>.
[8]. Smith, J. M., Hendrick C. Van. Ness, and Michael M. Abbott. Introduction to Chemical
Engineering Thermodynamics. New York [etc.: McGraw-Hill, 2001. Print.
[9]. Holman, J. P. Heat Transfer. New York: McGraw-Hill, 2010. Print.
[10]. Holland, Charles Donald. Fundamentals of Multicomponent Distillation. New York:
McGraw-Hill, 1981. Print.
[11]. Fair, James R. Advanced Process Engineering. New York, NY: American Institute of
Chemical Engineers, 1980. Print.
[12]. Alibaba Manufacturer Directory - Suppliers, Manufacturers, Exporters & Importers."
Alibaba. Web. <http://www.alibaba.com/>.
[13]. Methanol." Wikipedia. Wikimedia Foundation,. Web.
<http://en.wikipedia.org/wiki/Methanol>.
[14].https://www.academia.edu/6244446/iii_MANUFACTURE_OF_FORMALDEHYDE_FRO
M_METHANOL_A_PROJECT_REPORT
[15]. Perry, R.H., and D.W. GREEN, Perry’s chemical engineers’ Handbook, Seventh edition,
McGraw-Hill, 1997.](https://image.slidesharecdn.com/fyp-formaldehyde-180503065602/85/Production-of-66000-ton-year-of-Formaldehyde-from-Methanol-using-Silver-catalyst-Final-year-project-BSC-Chemical-Engineering-2014-2018-157-320.jpg)
![146
[16]. Coulson, J.M., J.F. Richardson, “Chemical Engineering” Volume 1 Sixth Edition
[17]. Coulson, J.M., J.F. Richardson, “Chemical Engineering” Volume 6 Sixth Edition
[18]. Kern, Donald Q. Kern “Process Heat Transfer”. First Edition.
[19]. Max S. Peter,Klaus D. Timmerhaus , Ronald E West “Plant Design and Economics of
Chemical Engineering” Fifth Edition.
[20]. Fogler Scott, “Element of Chemical Reaction Engineering” Fifth Edition
[21]. Ludwig, “Applied Process Design for Chemical Plants, Volume 2
[22]. Dyena Company of Formaldehyde, Web http://www.dynea.com/technology-sales/silver-
catalysed-formaldehyde-plant/operational-cost/
[23]. Wah Noble Company Web http://www.wah noble company.com.pk
[24]. ZRK Peshawar Web. http://www.ZRKpeshawar.com.pk
[25].http://www.referatele.com/referate/engleza/online2/FORMALDEHYDE---Physical-
Properties-Chemical-Structure-Preparation-Methods-Reactions-Usagem-Danger-Ma.php](https://image.slidesharecdn.com/fyp-formaldehyde-180503065602/85/Production-of-66000-ton-year-of-Formaldehyde-from-Methanol-using-Silver-catalyst-Final-year-project-BSC-Chemical-Engineering-2014-2018-158-320.jpg)

The document details the production of 66,000 tons per year of formaldehyde from methanol utilizing a silver catalyst, addressing various aspects such as manufacturing processes, equipment design, energy and material balances, and cost estimations. It is a final year project report submitted as part of a Bachelor of Science in Chemical Engineering at Wah Engineering College, featuring extensive contributions from supervisors and faculty. The aim is to achieve a 98% conversion of methanol and explore the industrial applications and implications of formaldehyde.


