This document is a declaration form for a thesis submitted by five students - Abubakar Saleem, Muhammad Noman Saeed, Irfan Riaz, Umair Shoaib, and Muhammad Humza. The thesis is titled "A Plant Design Report on Production of 100,000 MTPY of Styrene from Dehydrogenation of Ethyl benzene". The declaration form certifies that the thesis is the original work of the students and complies with university policies regarding publishing and copyright. It has been reviewed and approved by the students' supervisor, Dr. Fahad Rehman.


![45
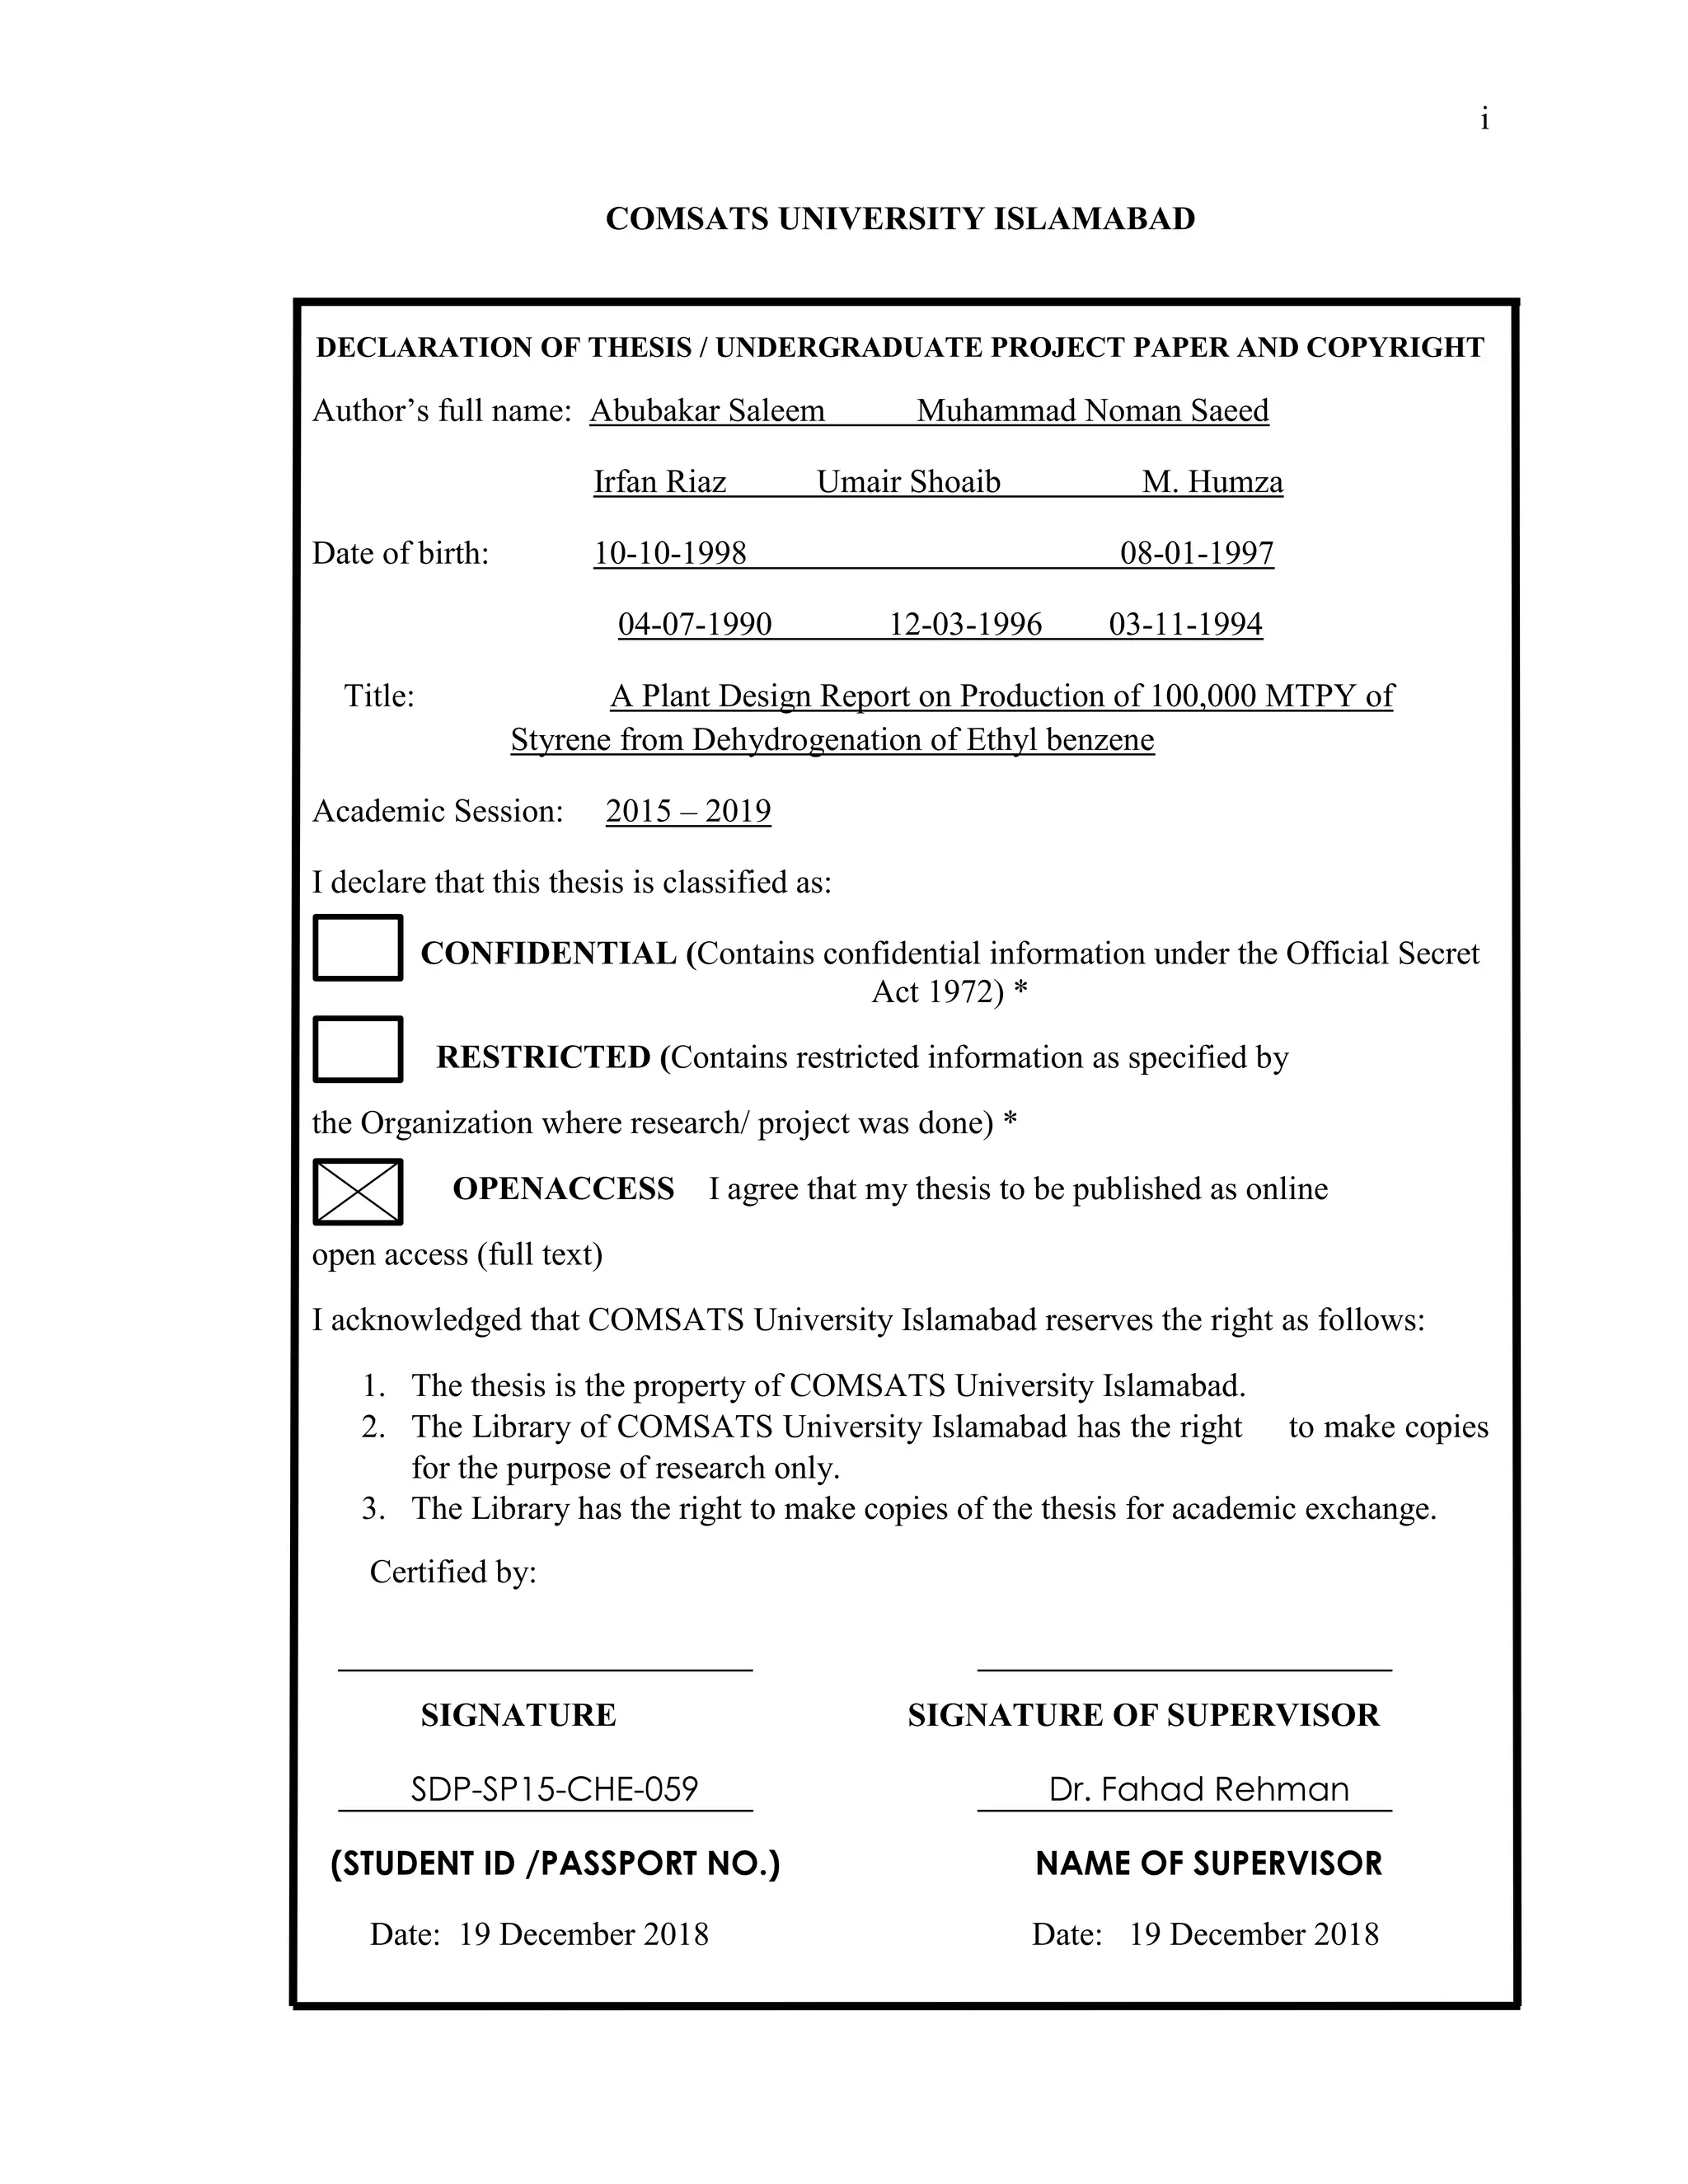
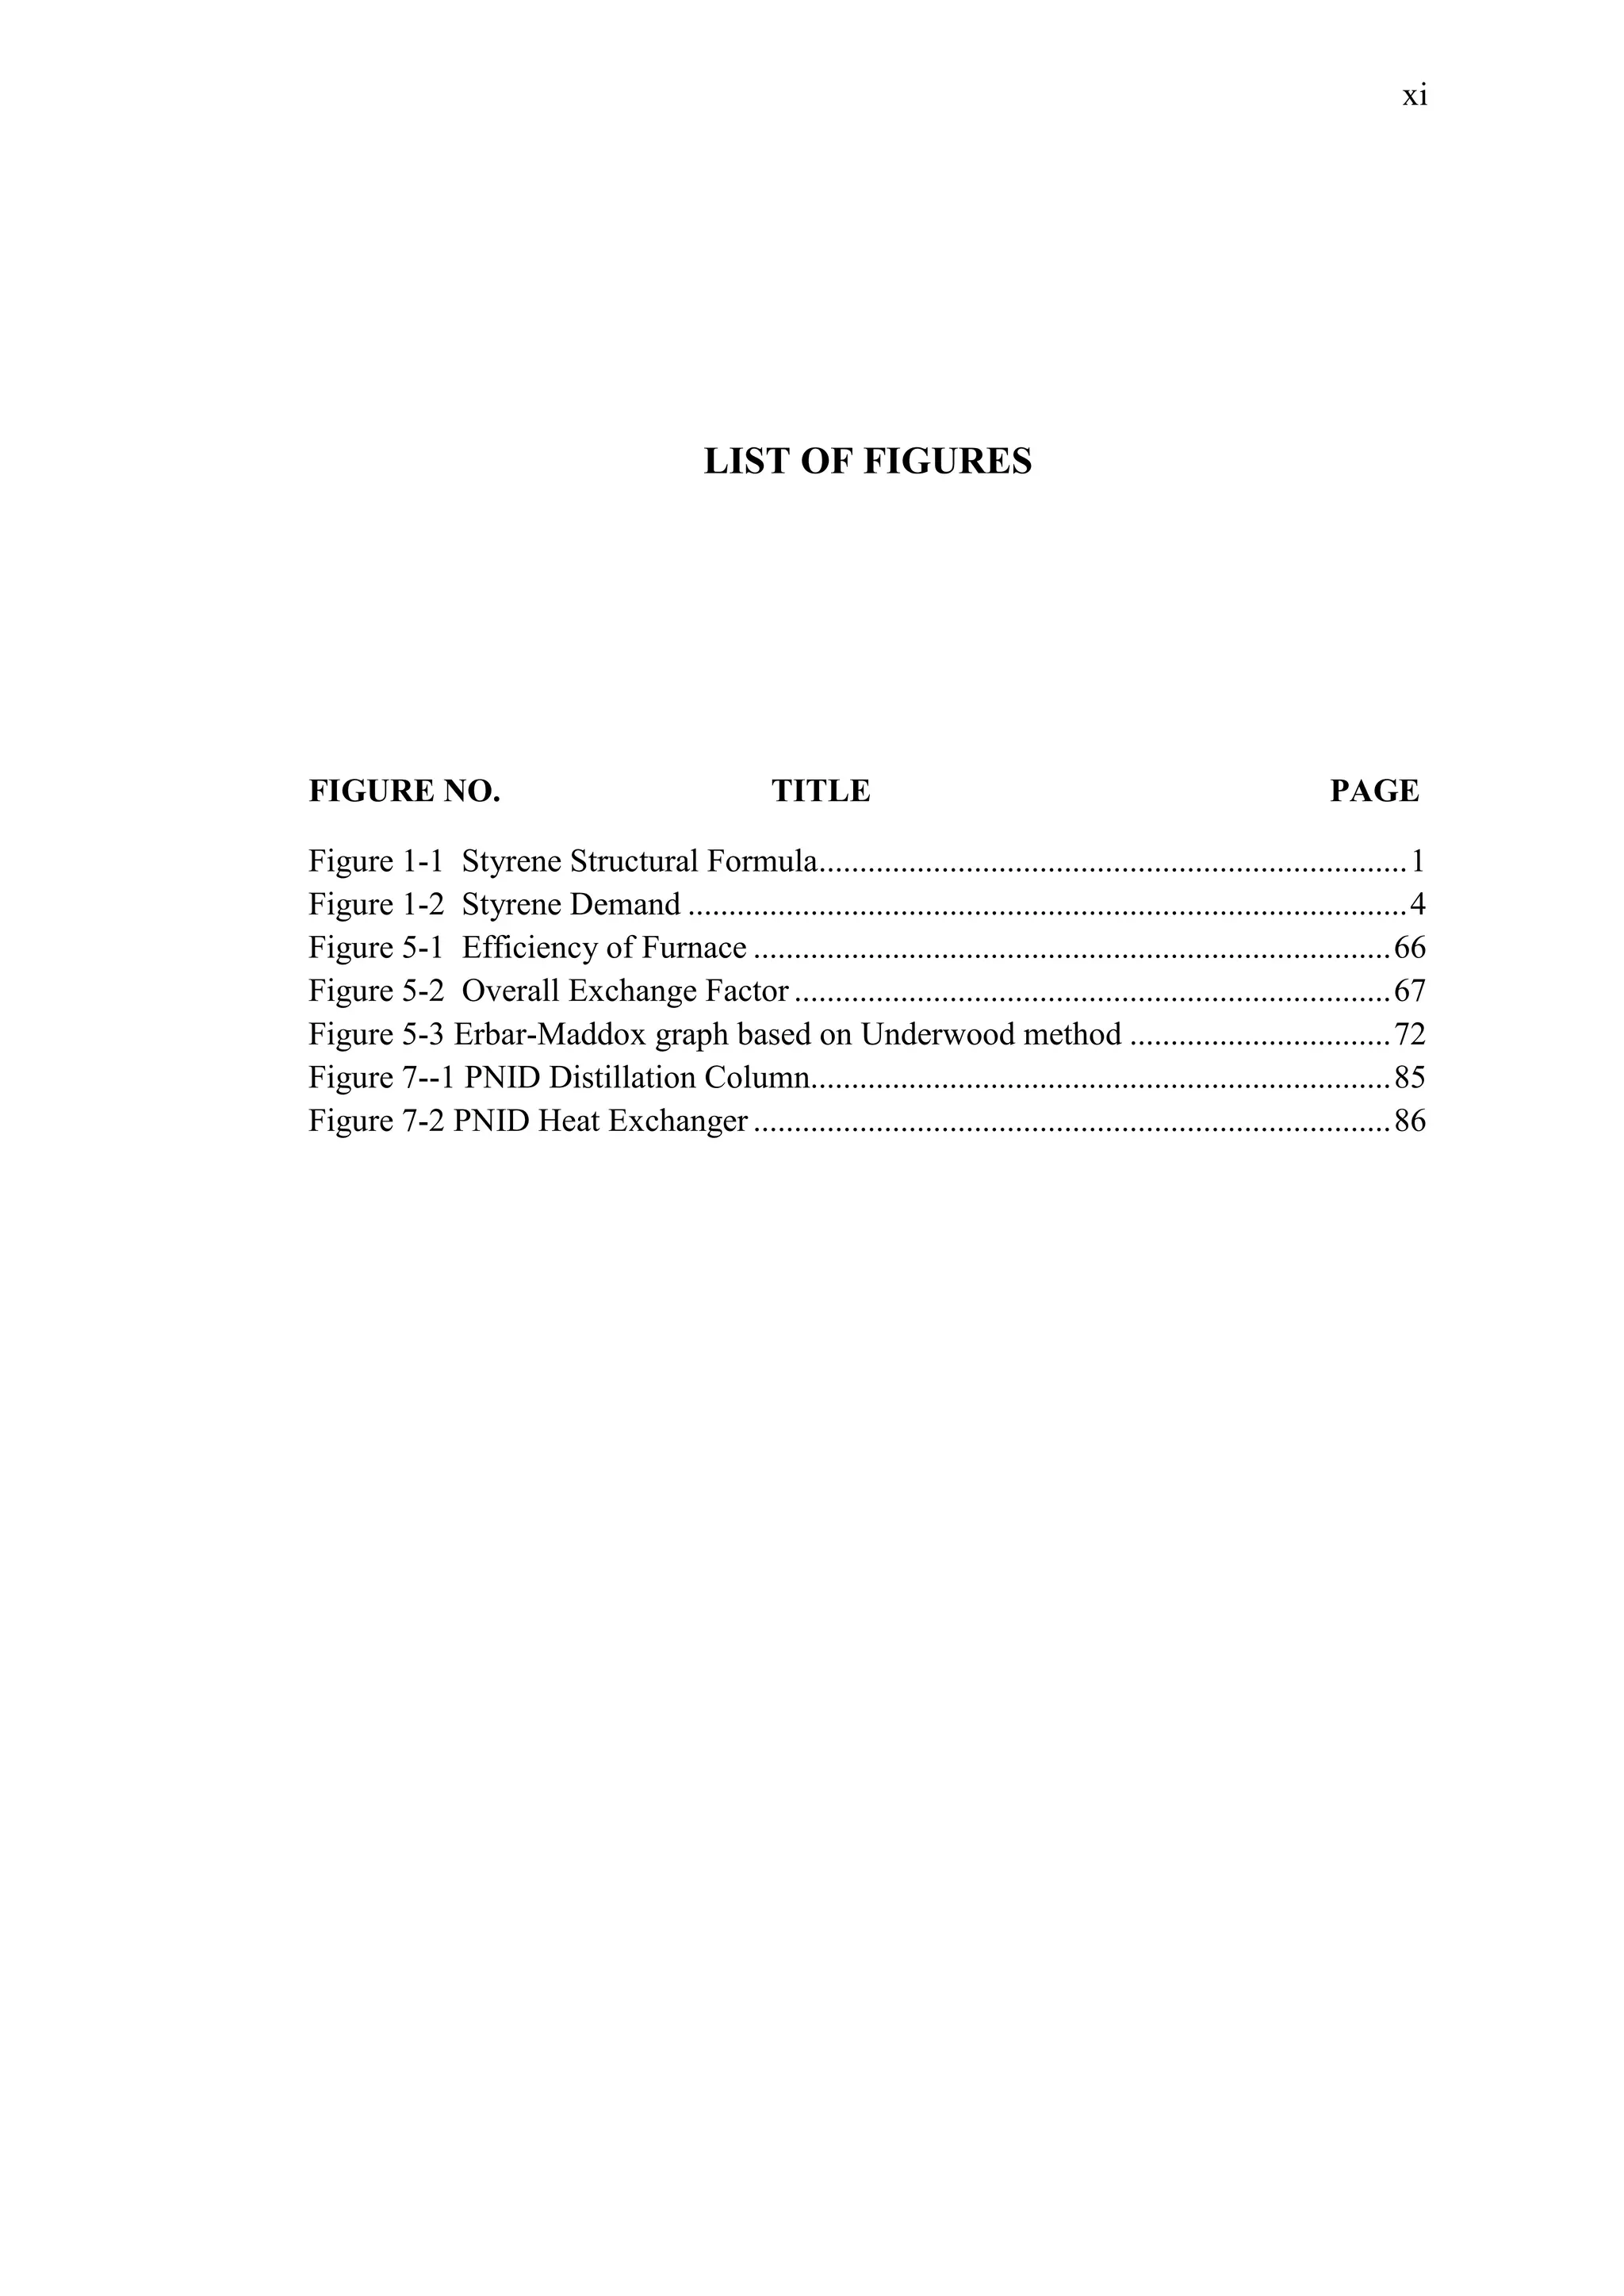
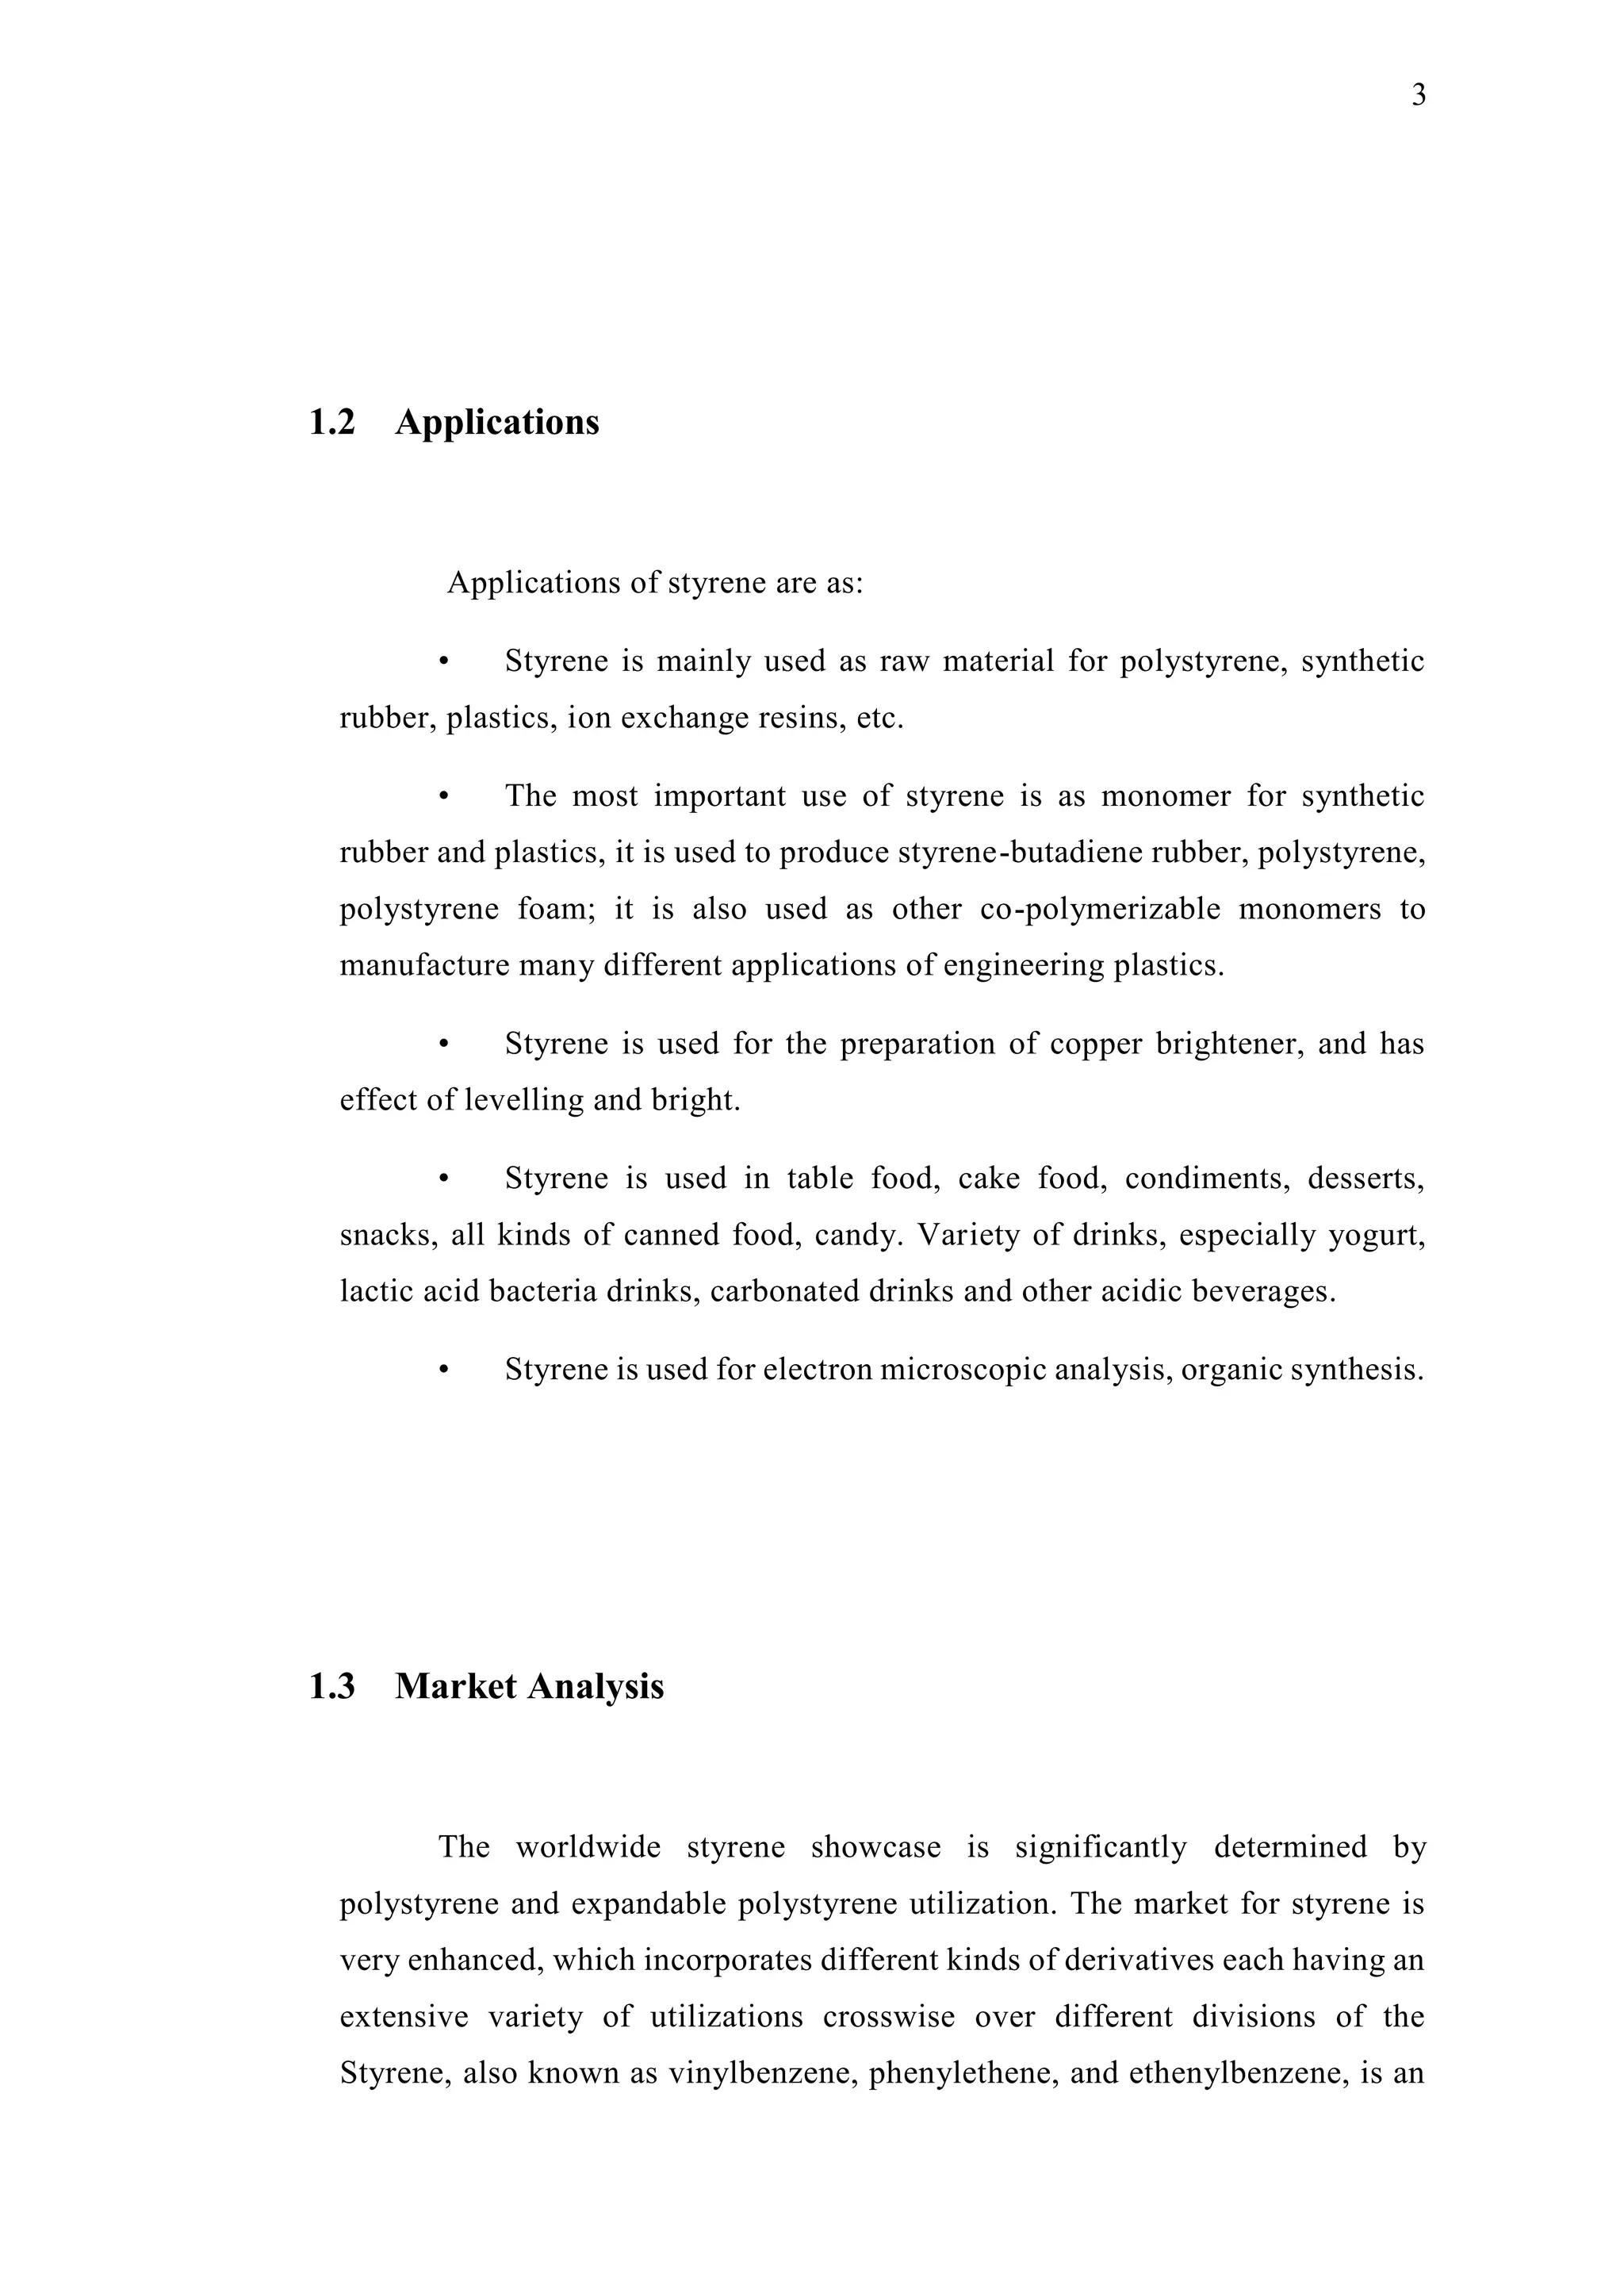
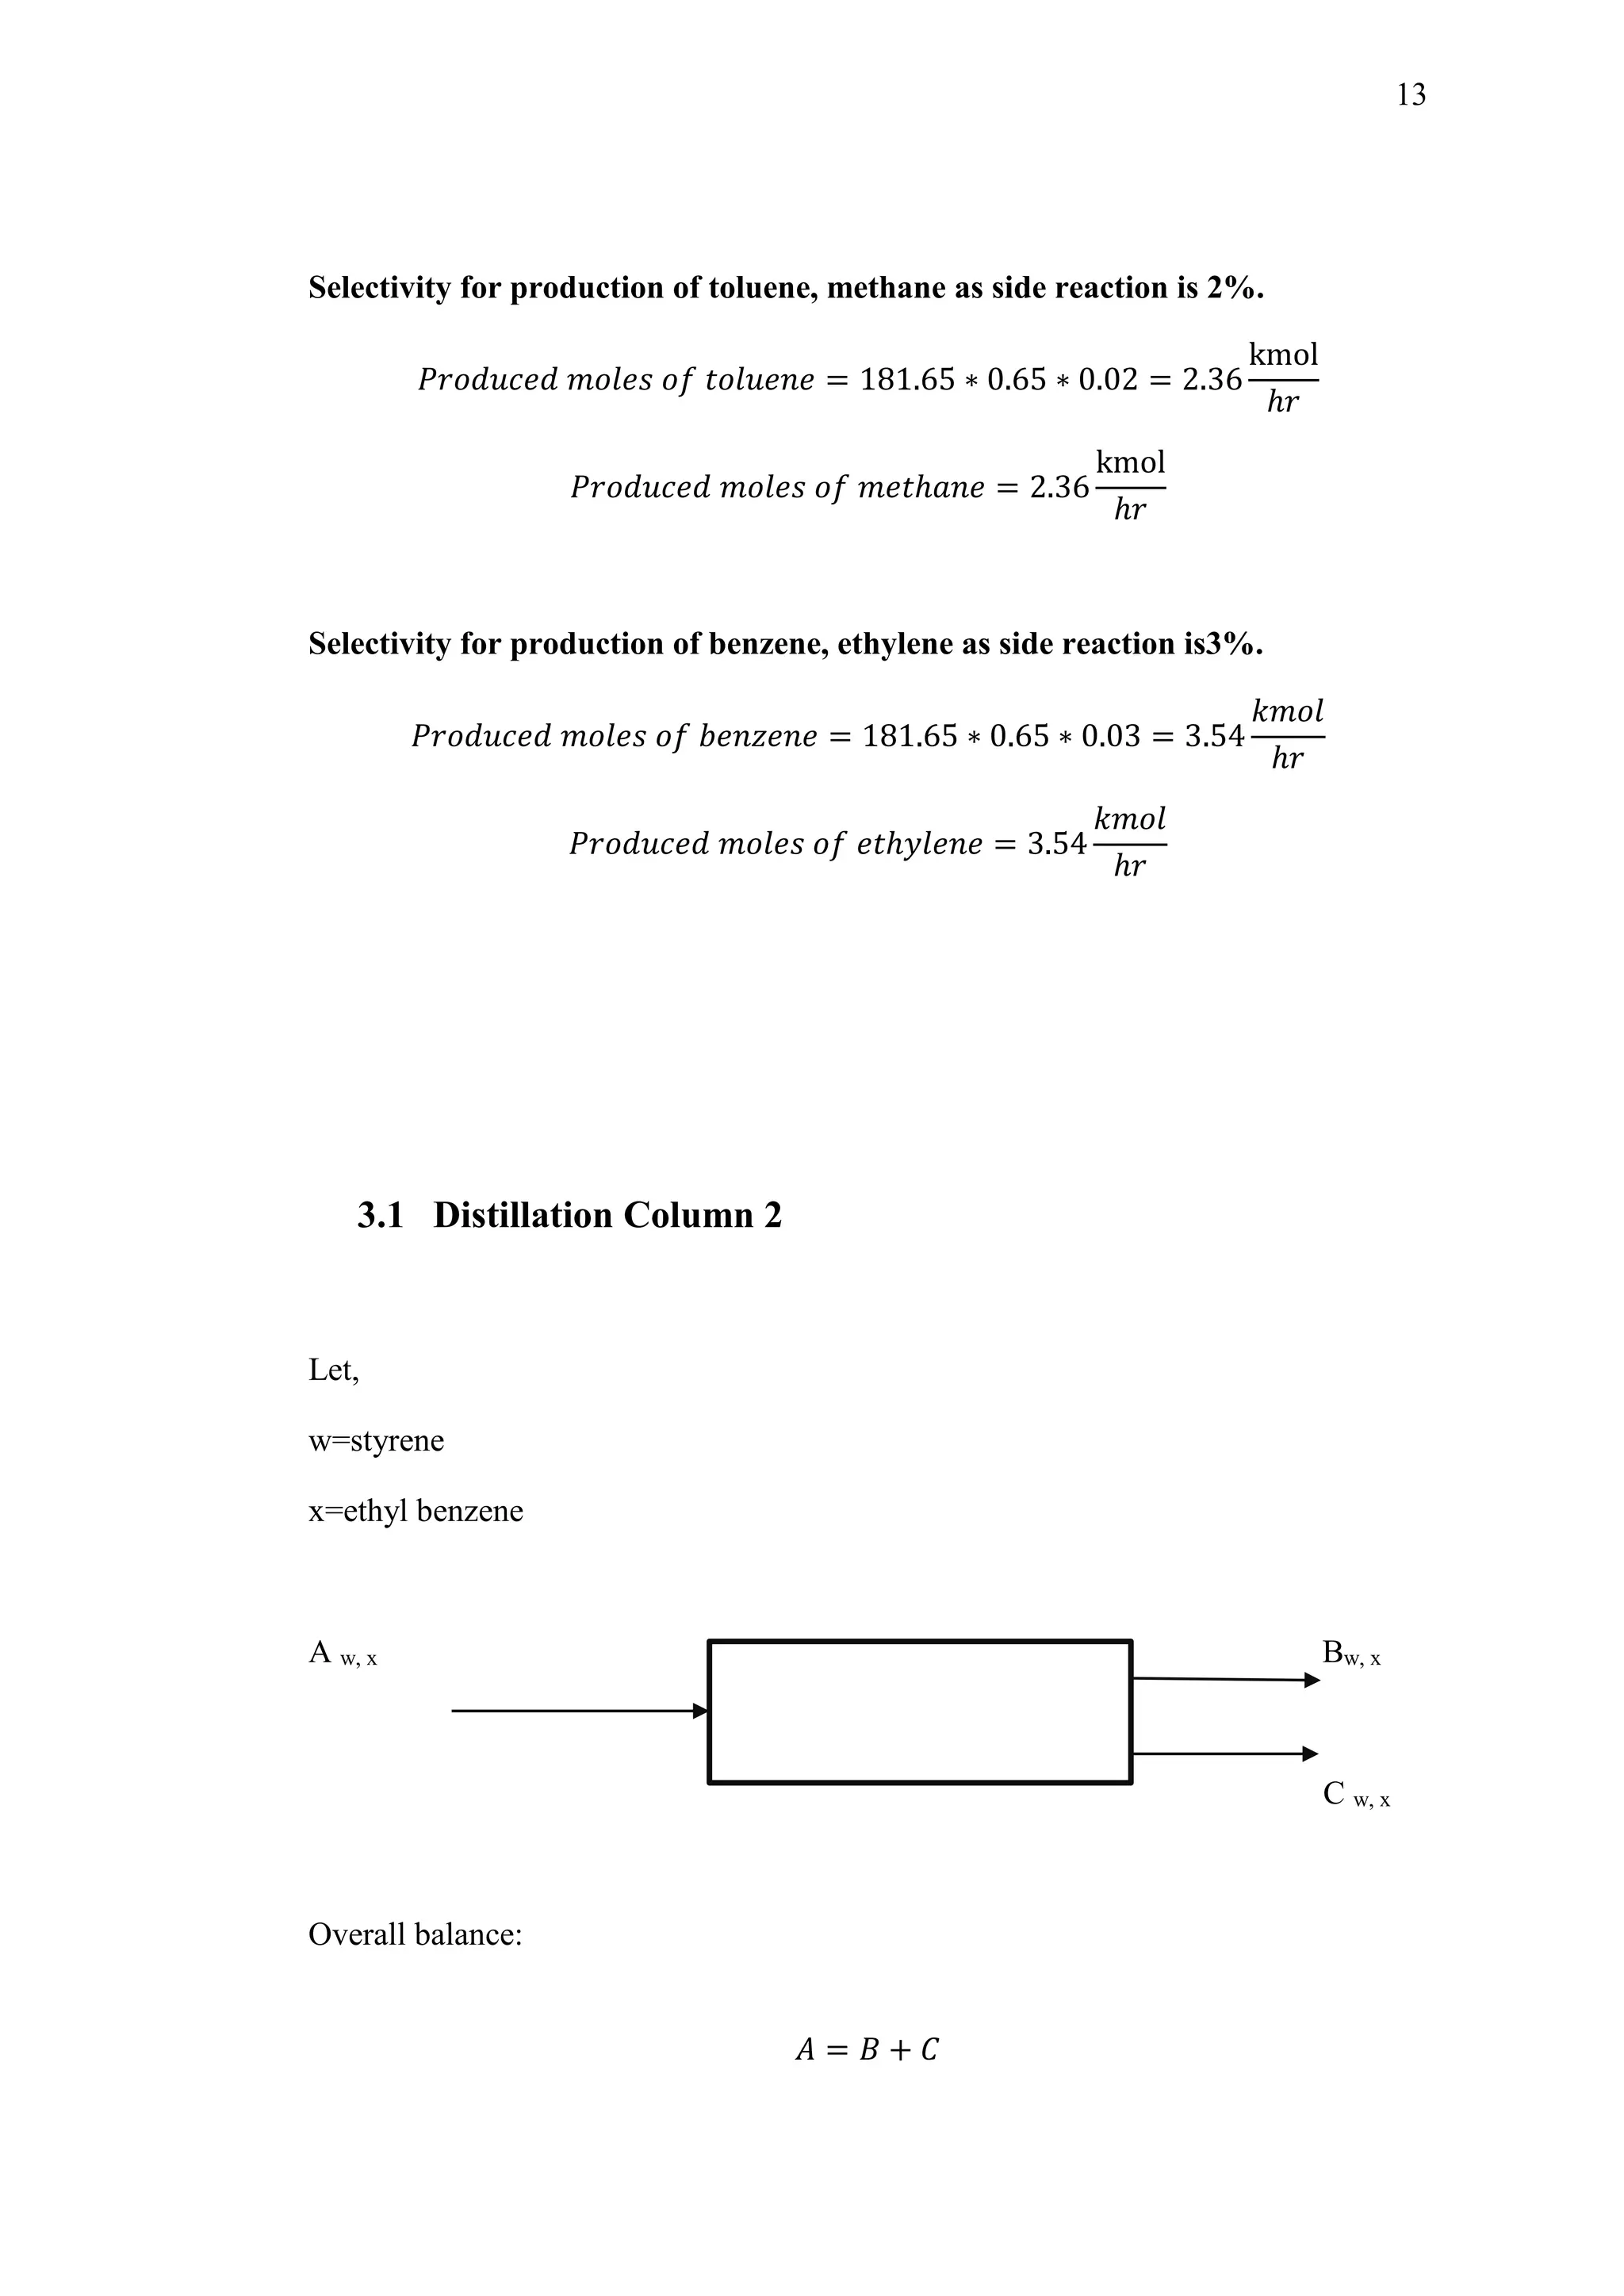
Energy Balance
Energy balance for adiabatic operation of packed bed reactor is given as
𝑋 =
𝛴𝜃𝑖 𝐶 𝑝 𝑖
(𝑇 − 𝑇0)
−[∆𝐻 𝑅𝑋
𝑂 (𝑇) + ∆𝐶 𝑃(𝑇 − 𝑇𝑅)]
∆𝐻 𝑅𝑋
𝑂
= 118000
𝐽
𝑚𝑜𝑙
By this relation temperature of reaction can be related to conversion.
𝜃𝑖 = 1 + 1 − 1 = 1
𝛴𝜃𝑖 𝐶 𝑝 𝑖
= 𝐶 𝑝 𝐸𝐵+ 𝜃𝑠𝑡 𝐶 𝑝 𝑠𝑡
+ 𝜃 𝐻 𝐶 𝑝 𝐻
𝐶 𝑃 𝐸𝐵
= 299
𝐽
𝑚𝑜𝑙. 𝐾
𝐶 𝑃 𝑆𝑇
= 273
𝐽
𝑚𝑜𝑙. 𝐾
𝐶 𝑃 𝐻
= 30
𝐽
𝑚𝑜𝑙. 𝐾
Overall Rate Equation
−𝑟𝐸𝐵 = 𝑘𝑖[𝑃𝑇 𝑦 𝐸𝐵 − 𝑃𝑇
2 𝑦𝑆𝑇 𝑦 𝐻2
𝐾𝑝1
]viii
Now
𝑘 𝑝1 = 8.2 ∗ 106
∗ 𝑒(
−15200
𝑇
)ix
Where Kp1 is in bar.
And
𝑘𝑖 = 𝑒
[𝐴 𝑖−
−𝐸 𝑖
𝑅
(
1
𝑇 𝑅
)]
∗ 3600
Where
𝐴 = 0.851; 𝐸𝑖 = 90891
𝐽
𝑚𝑜𝑙](https://image.slidesharecdn.com/productionofstyrene-190805163317/75/Production-of-styrene-57-2048.jpg)
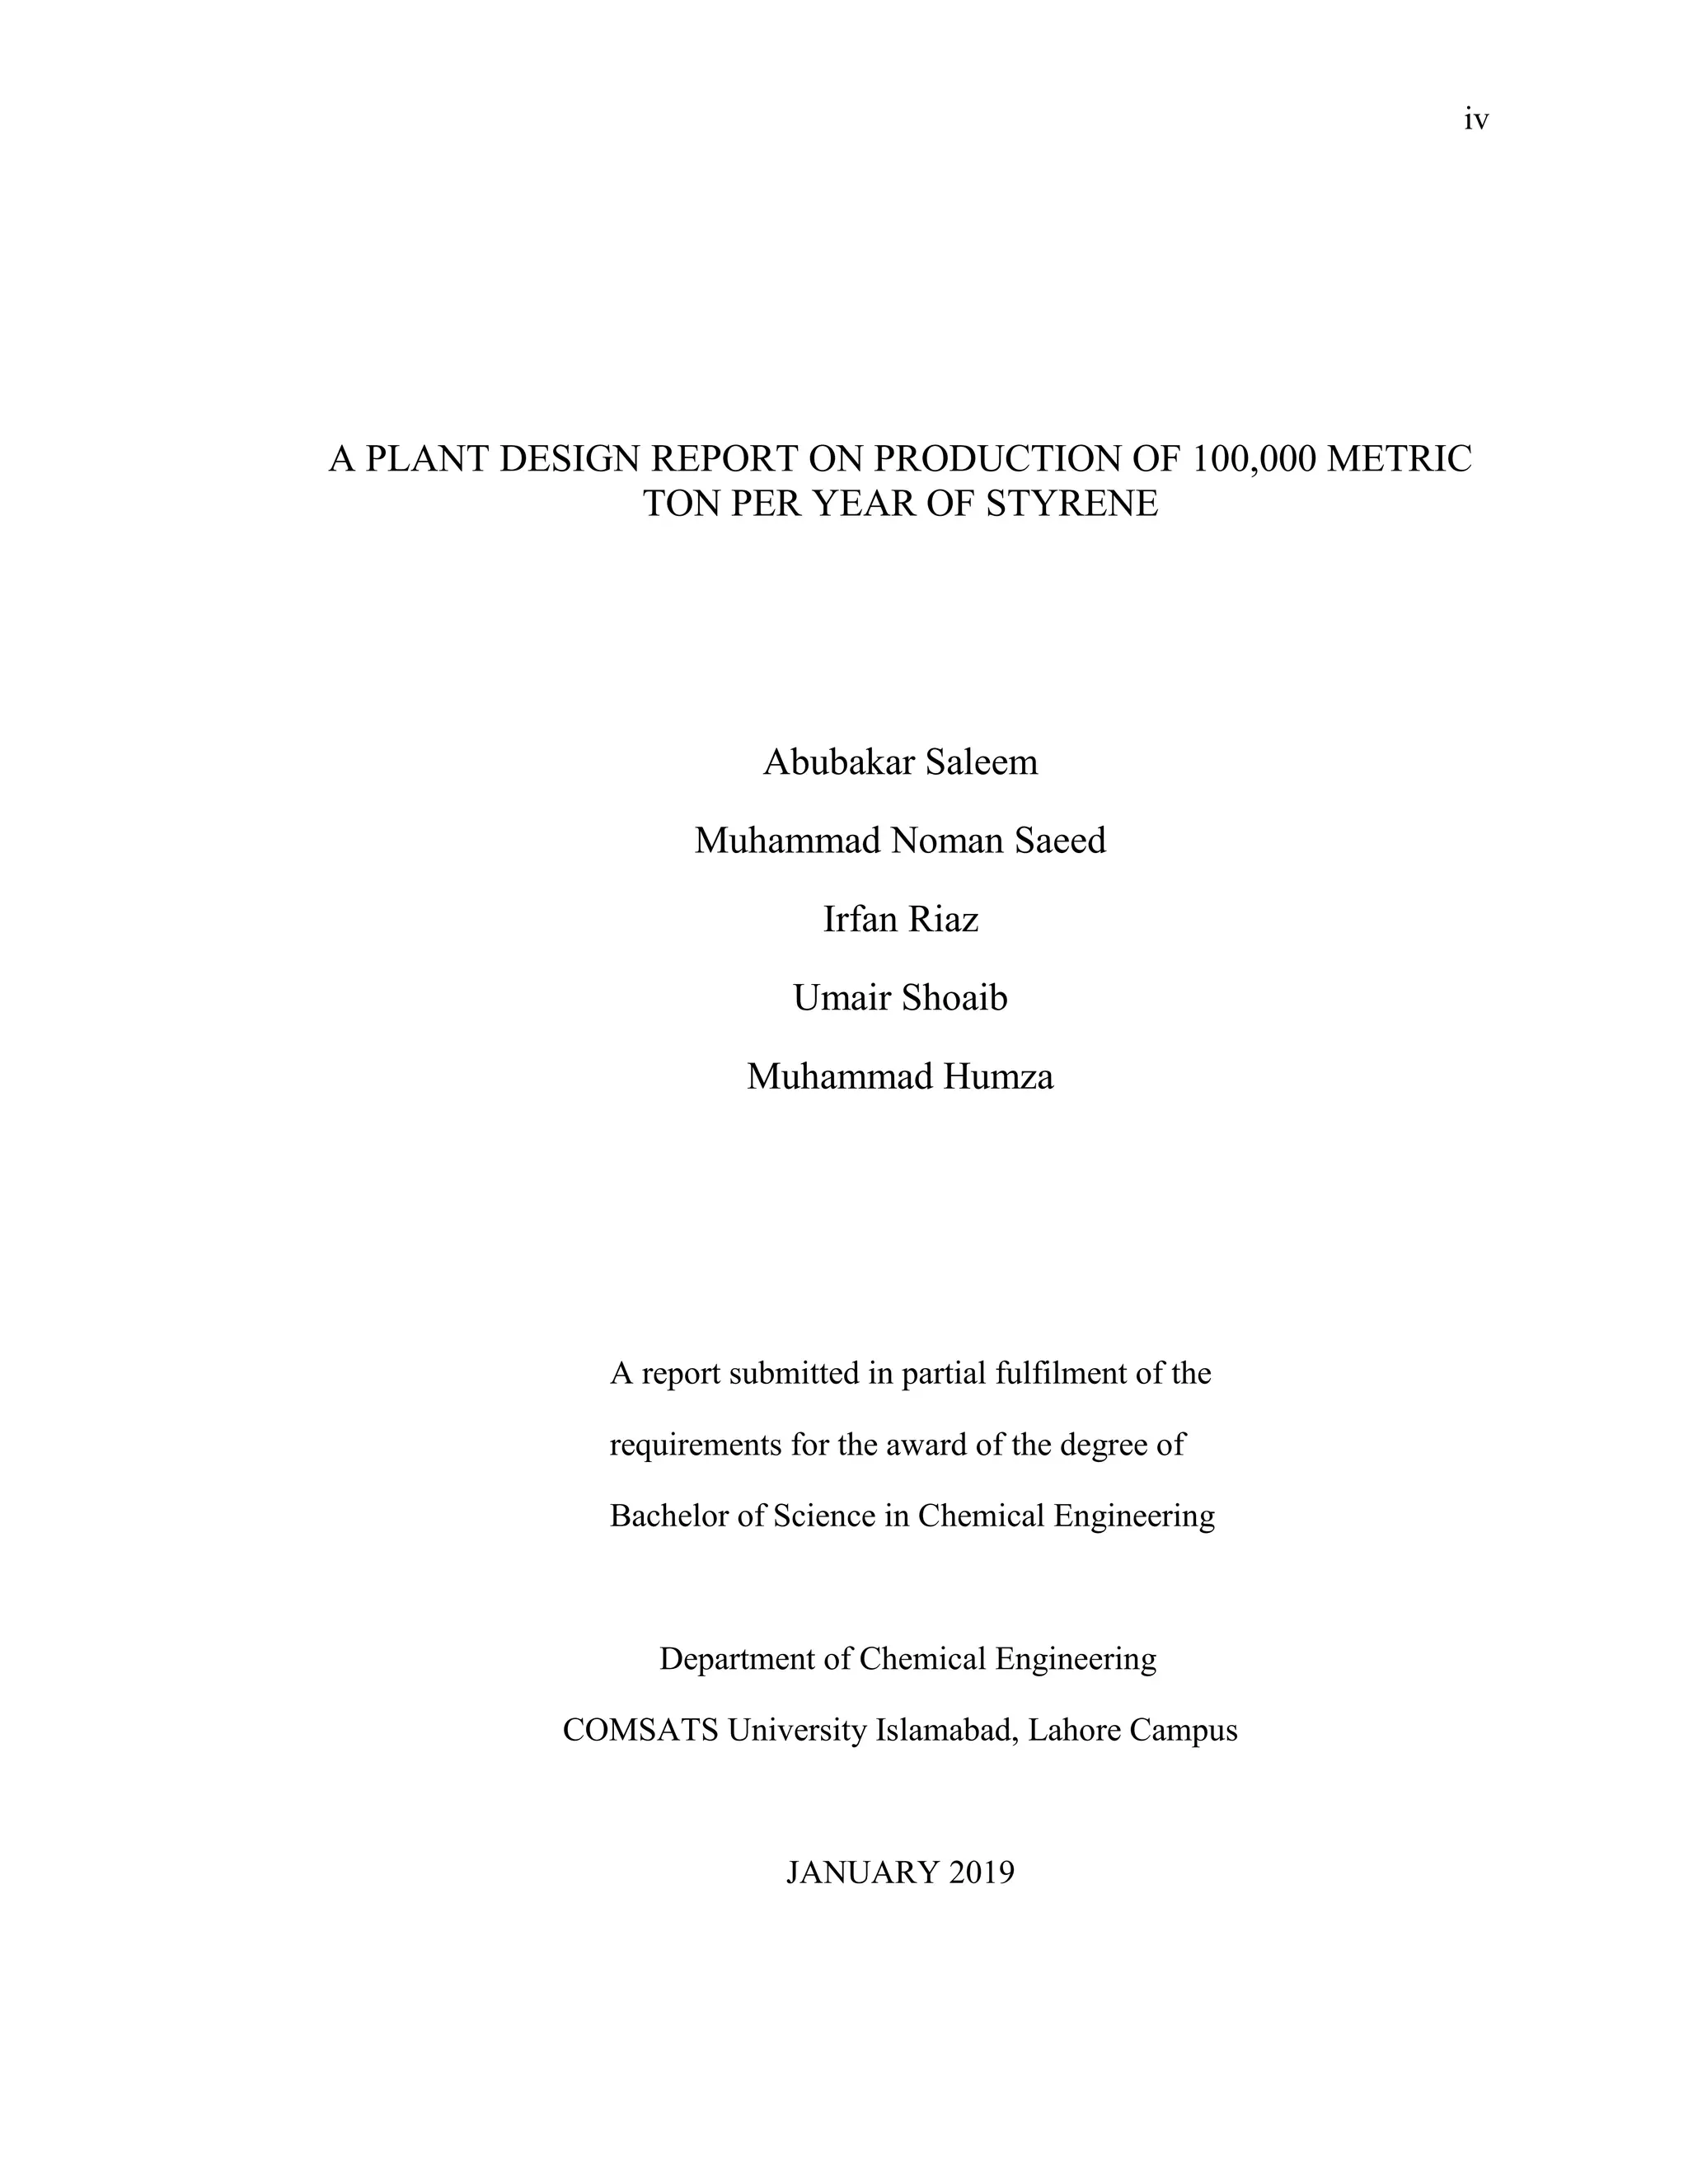
![46
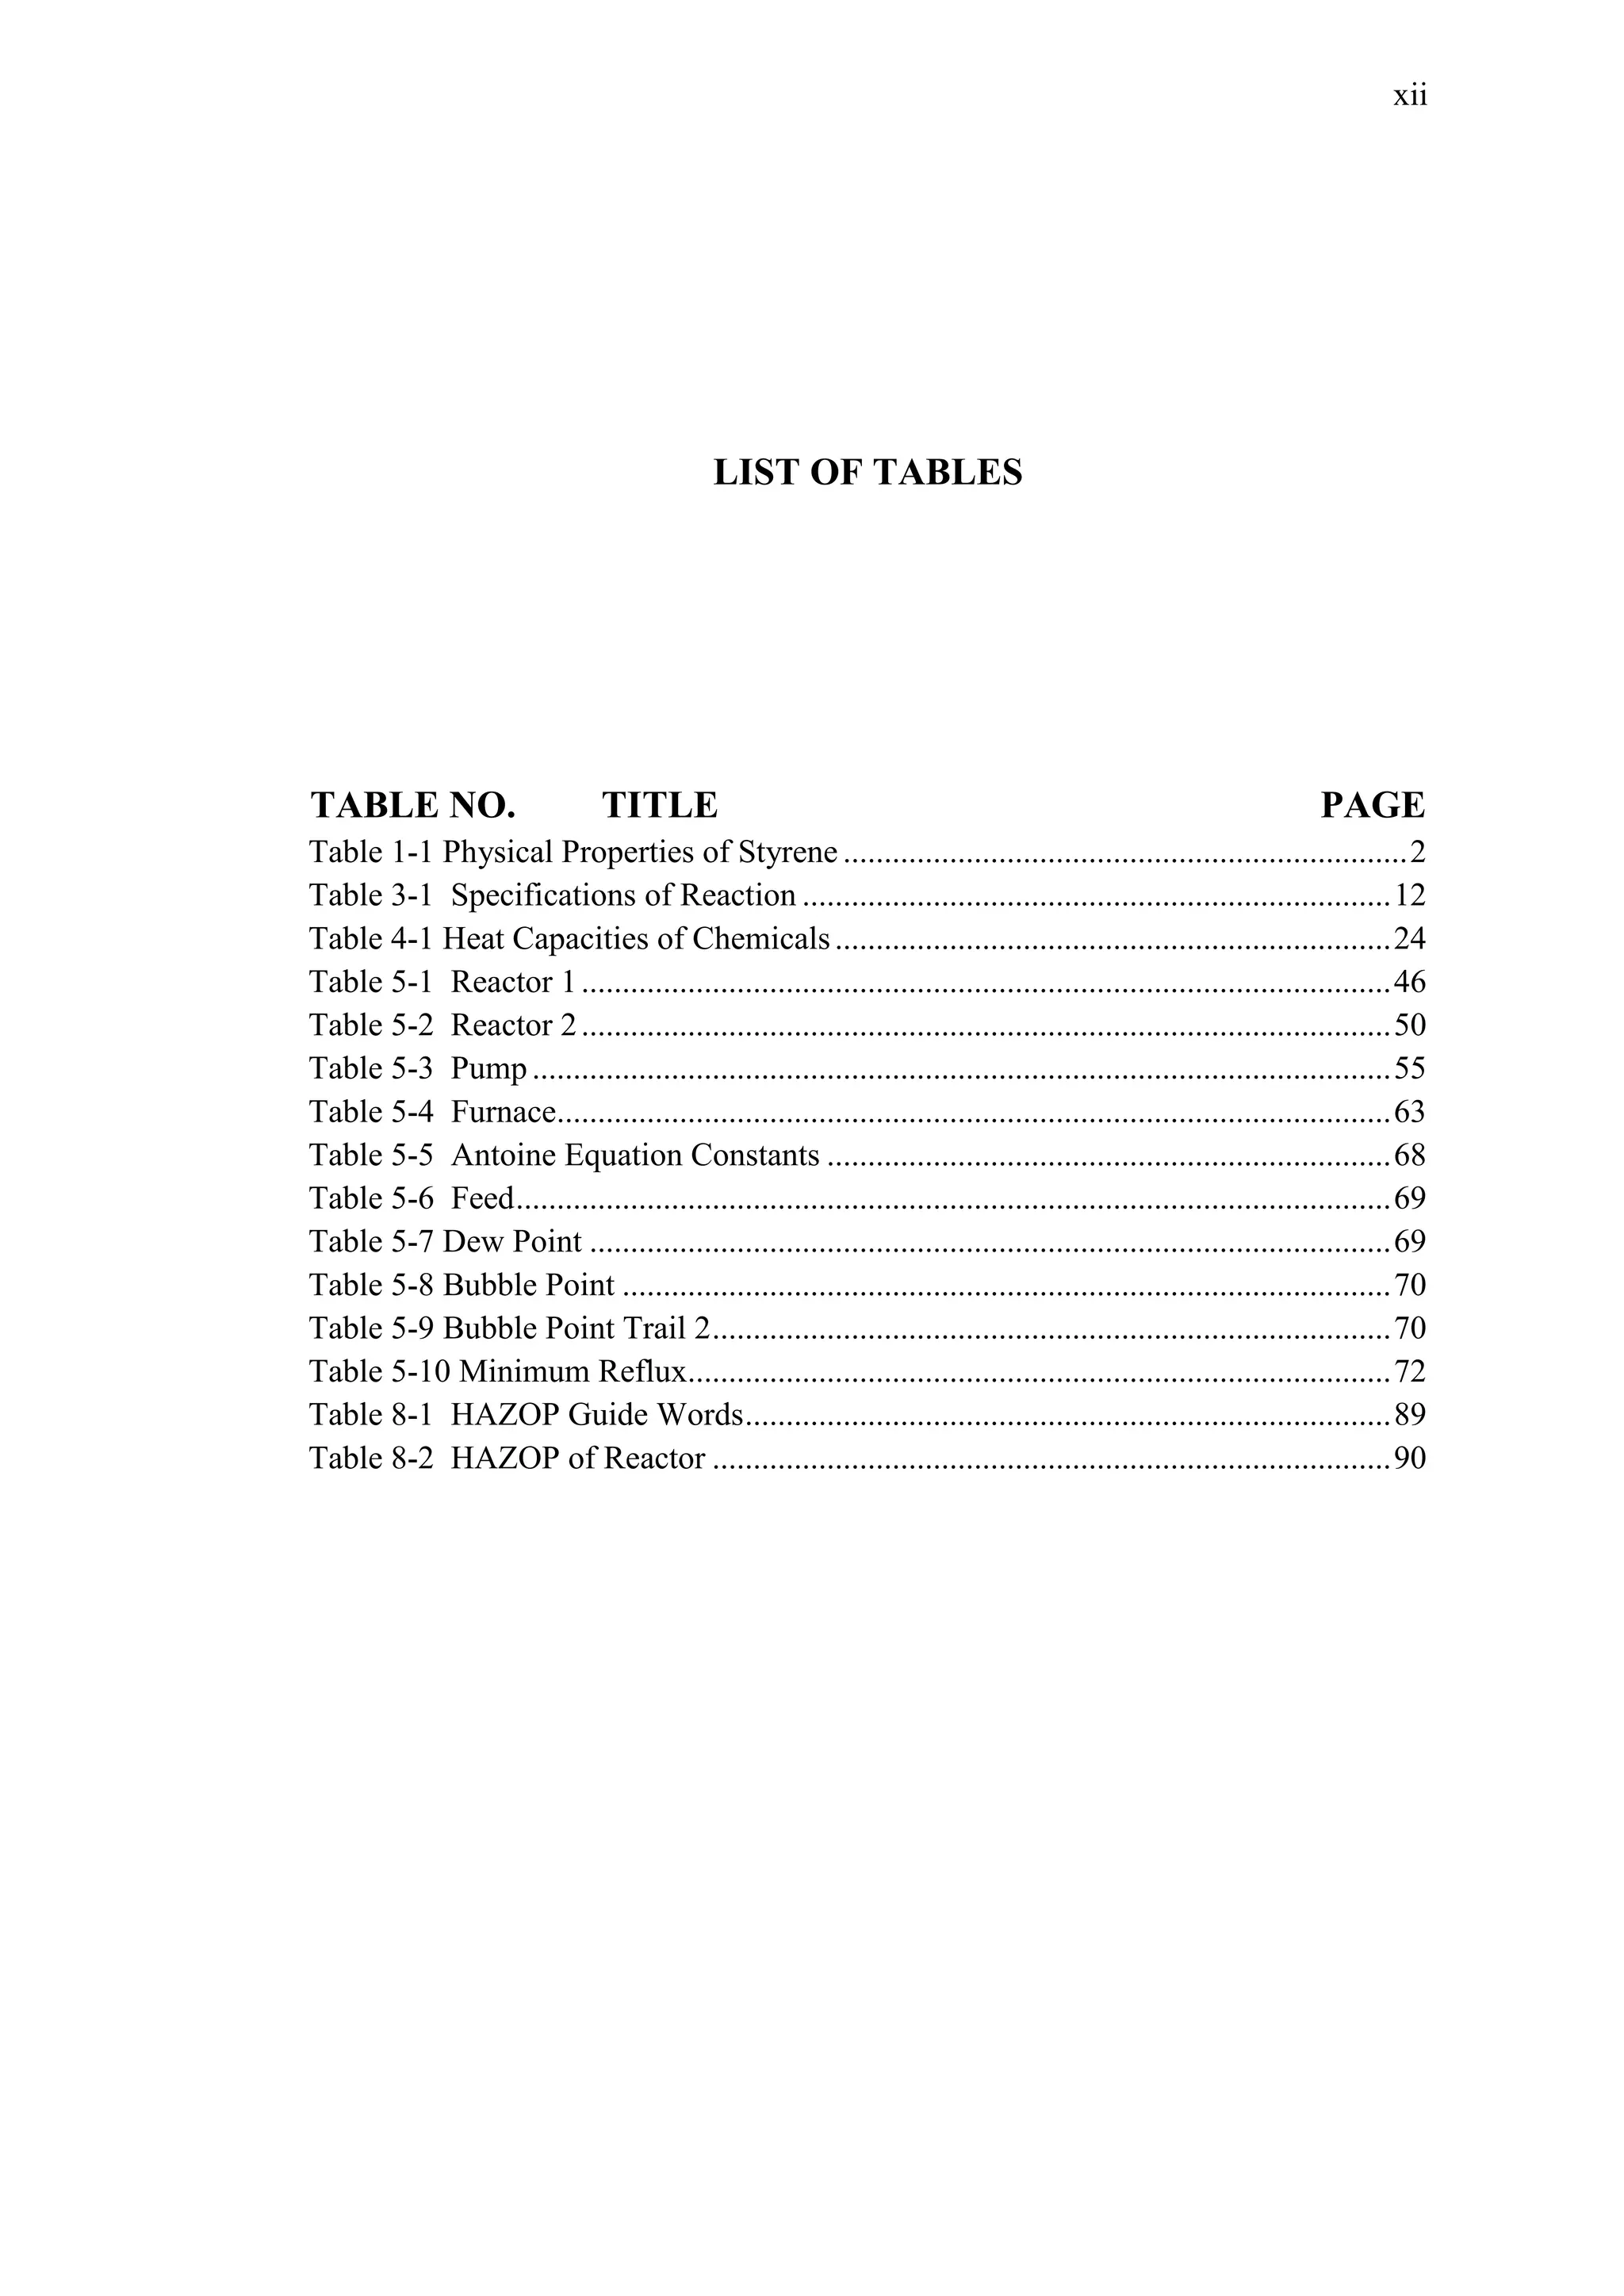
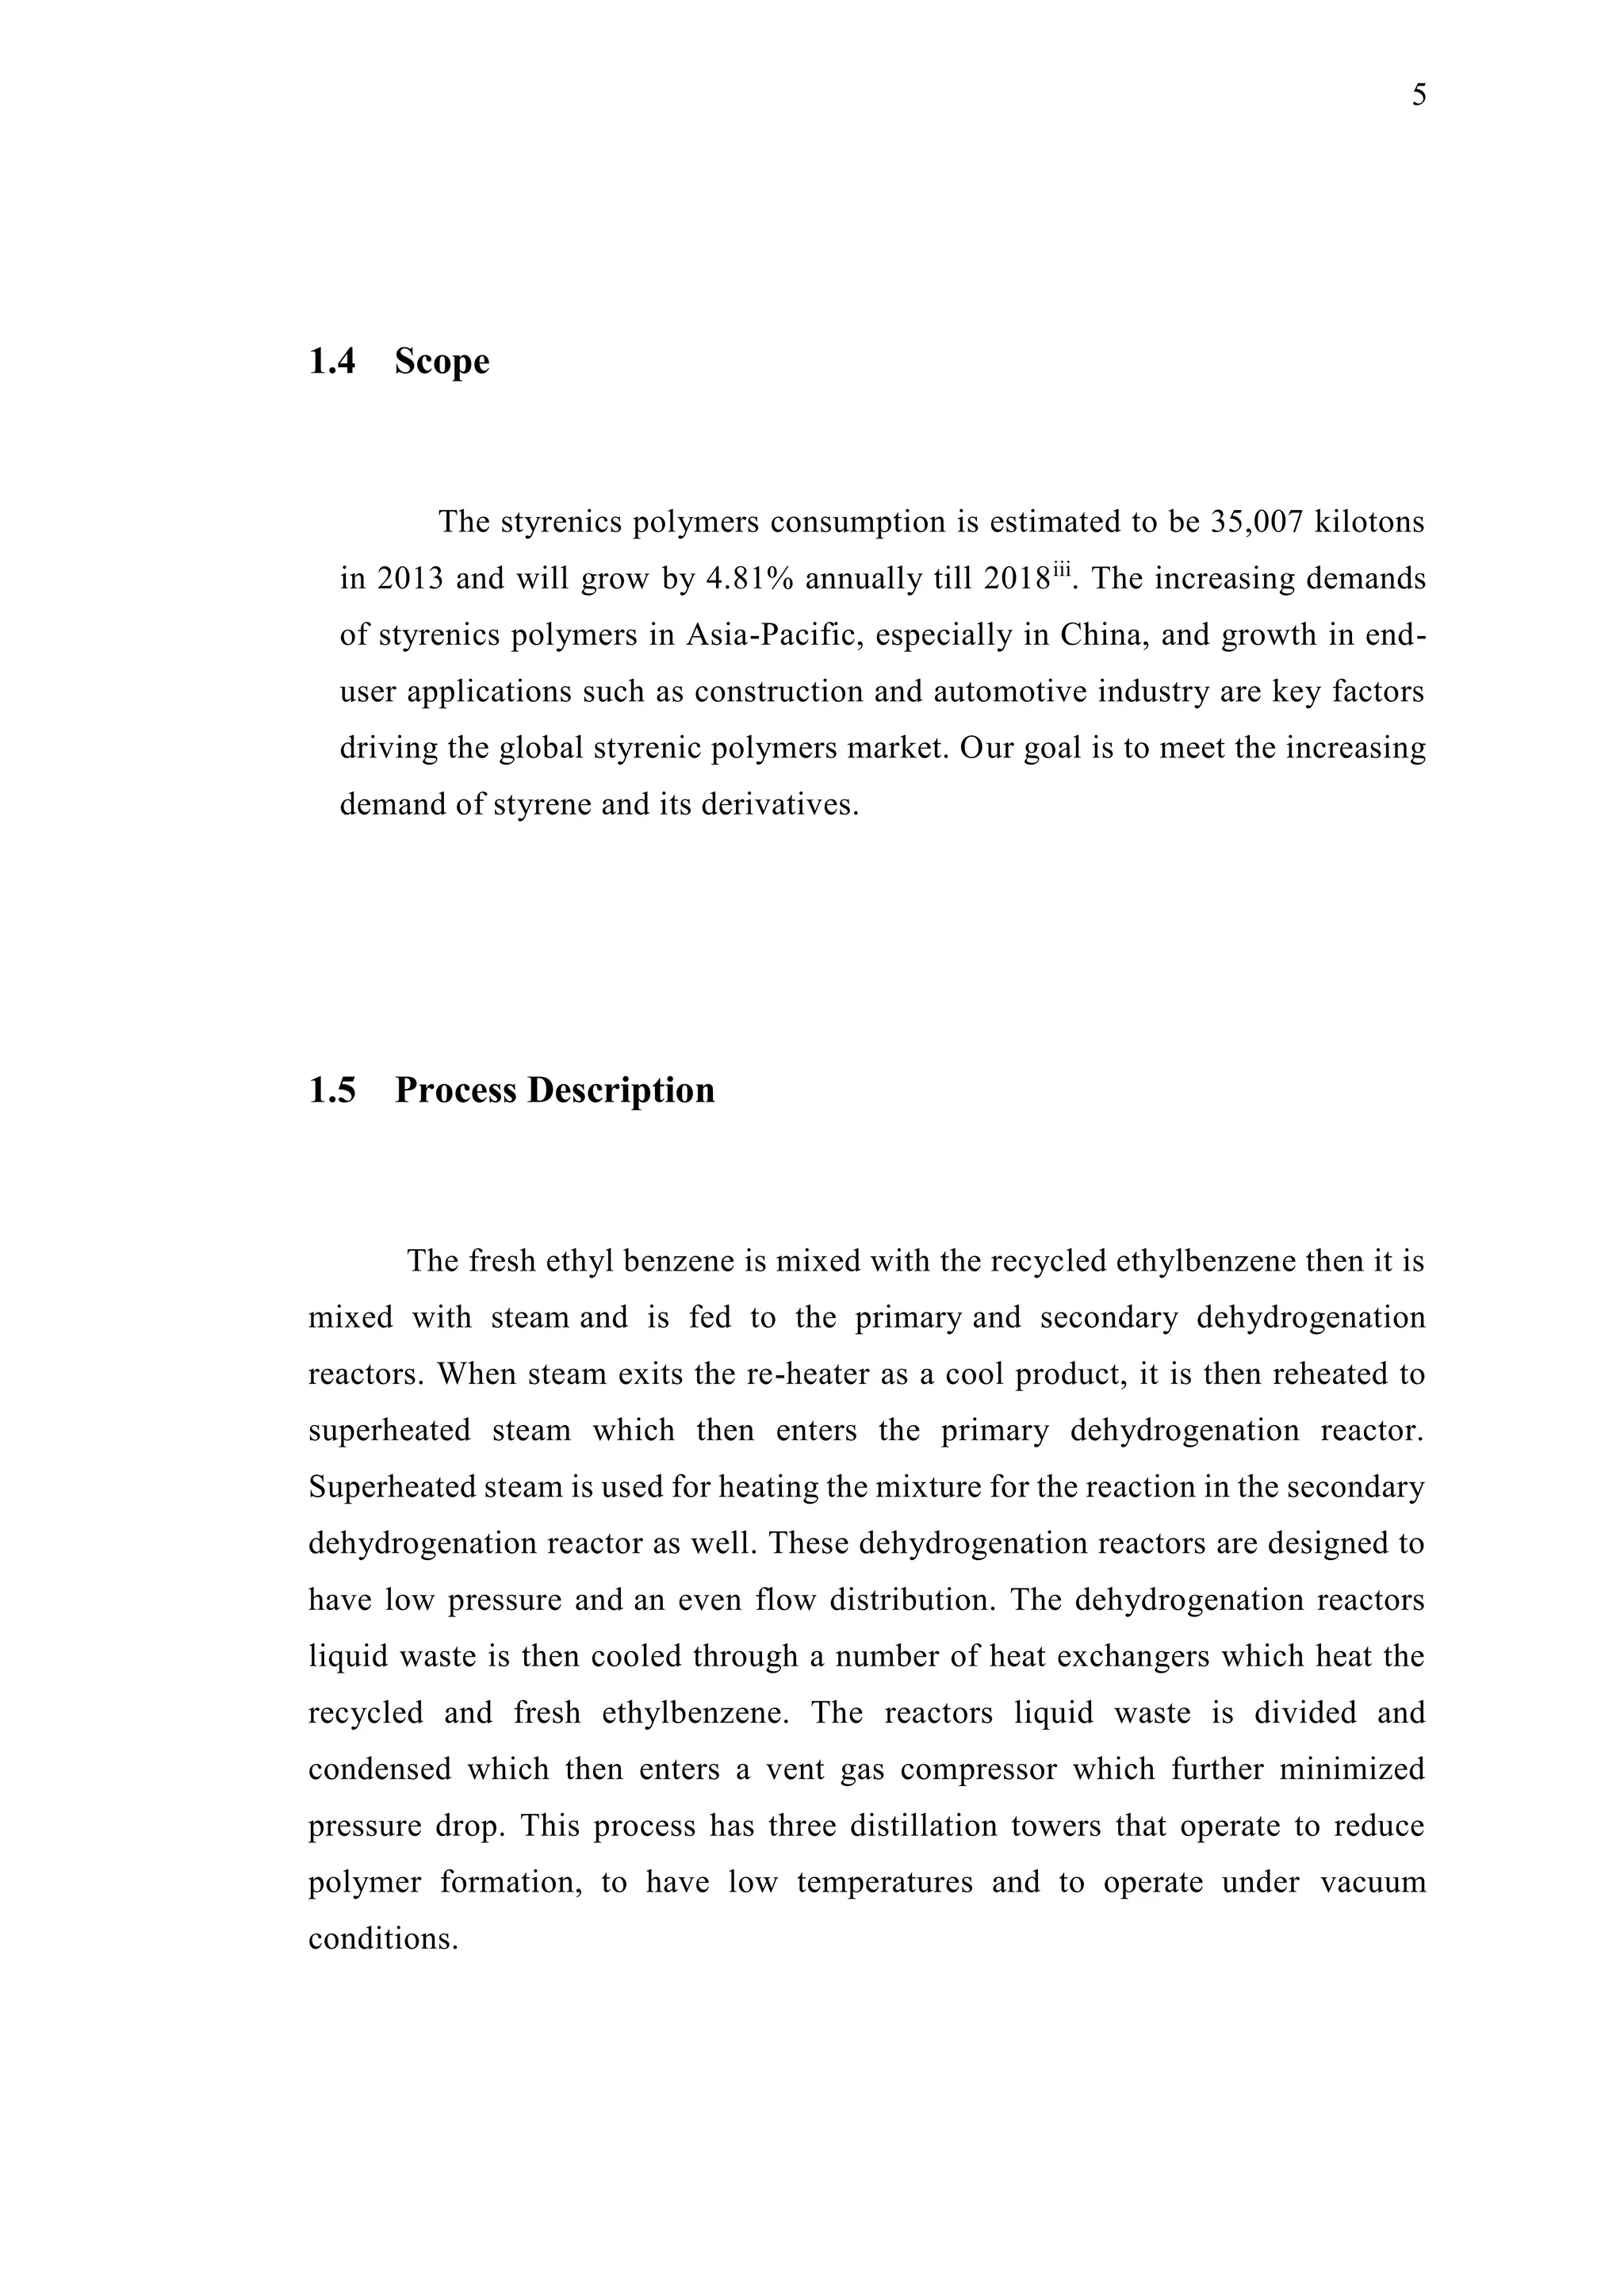
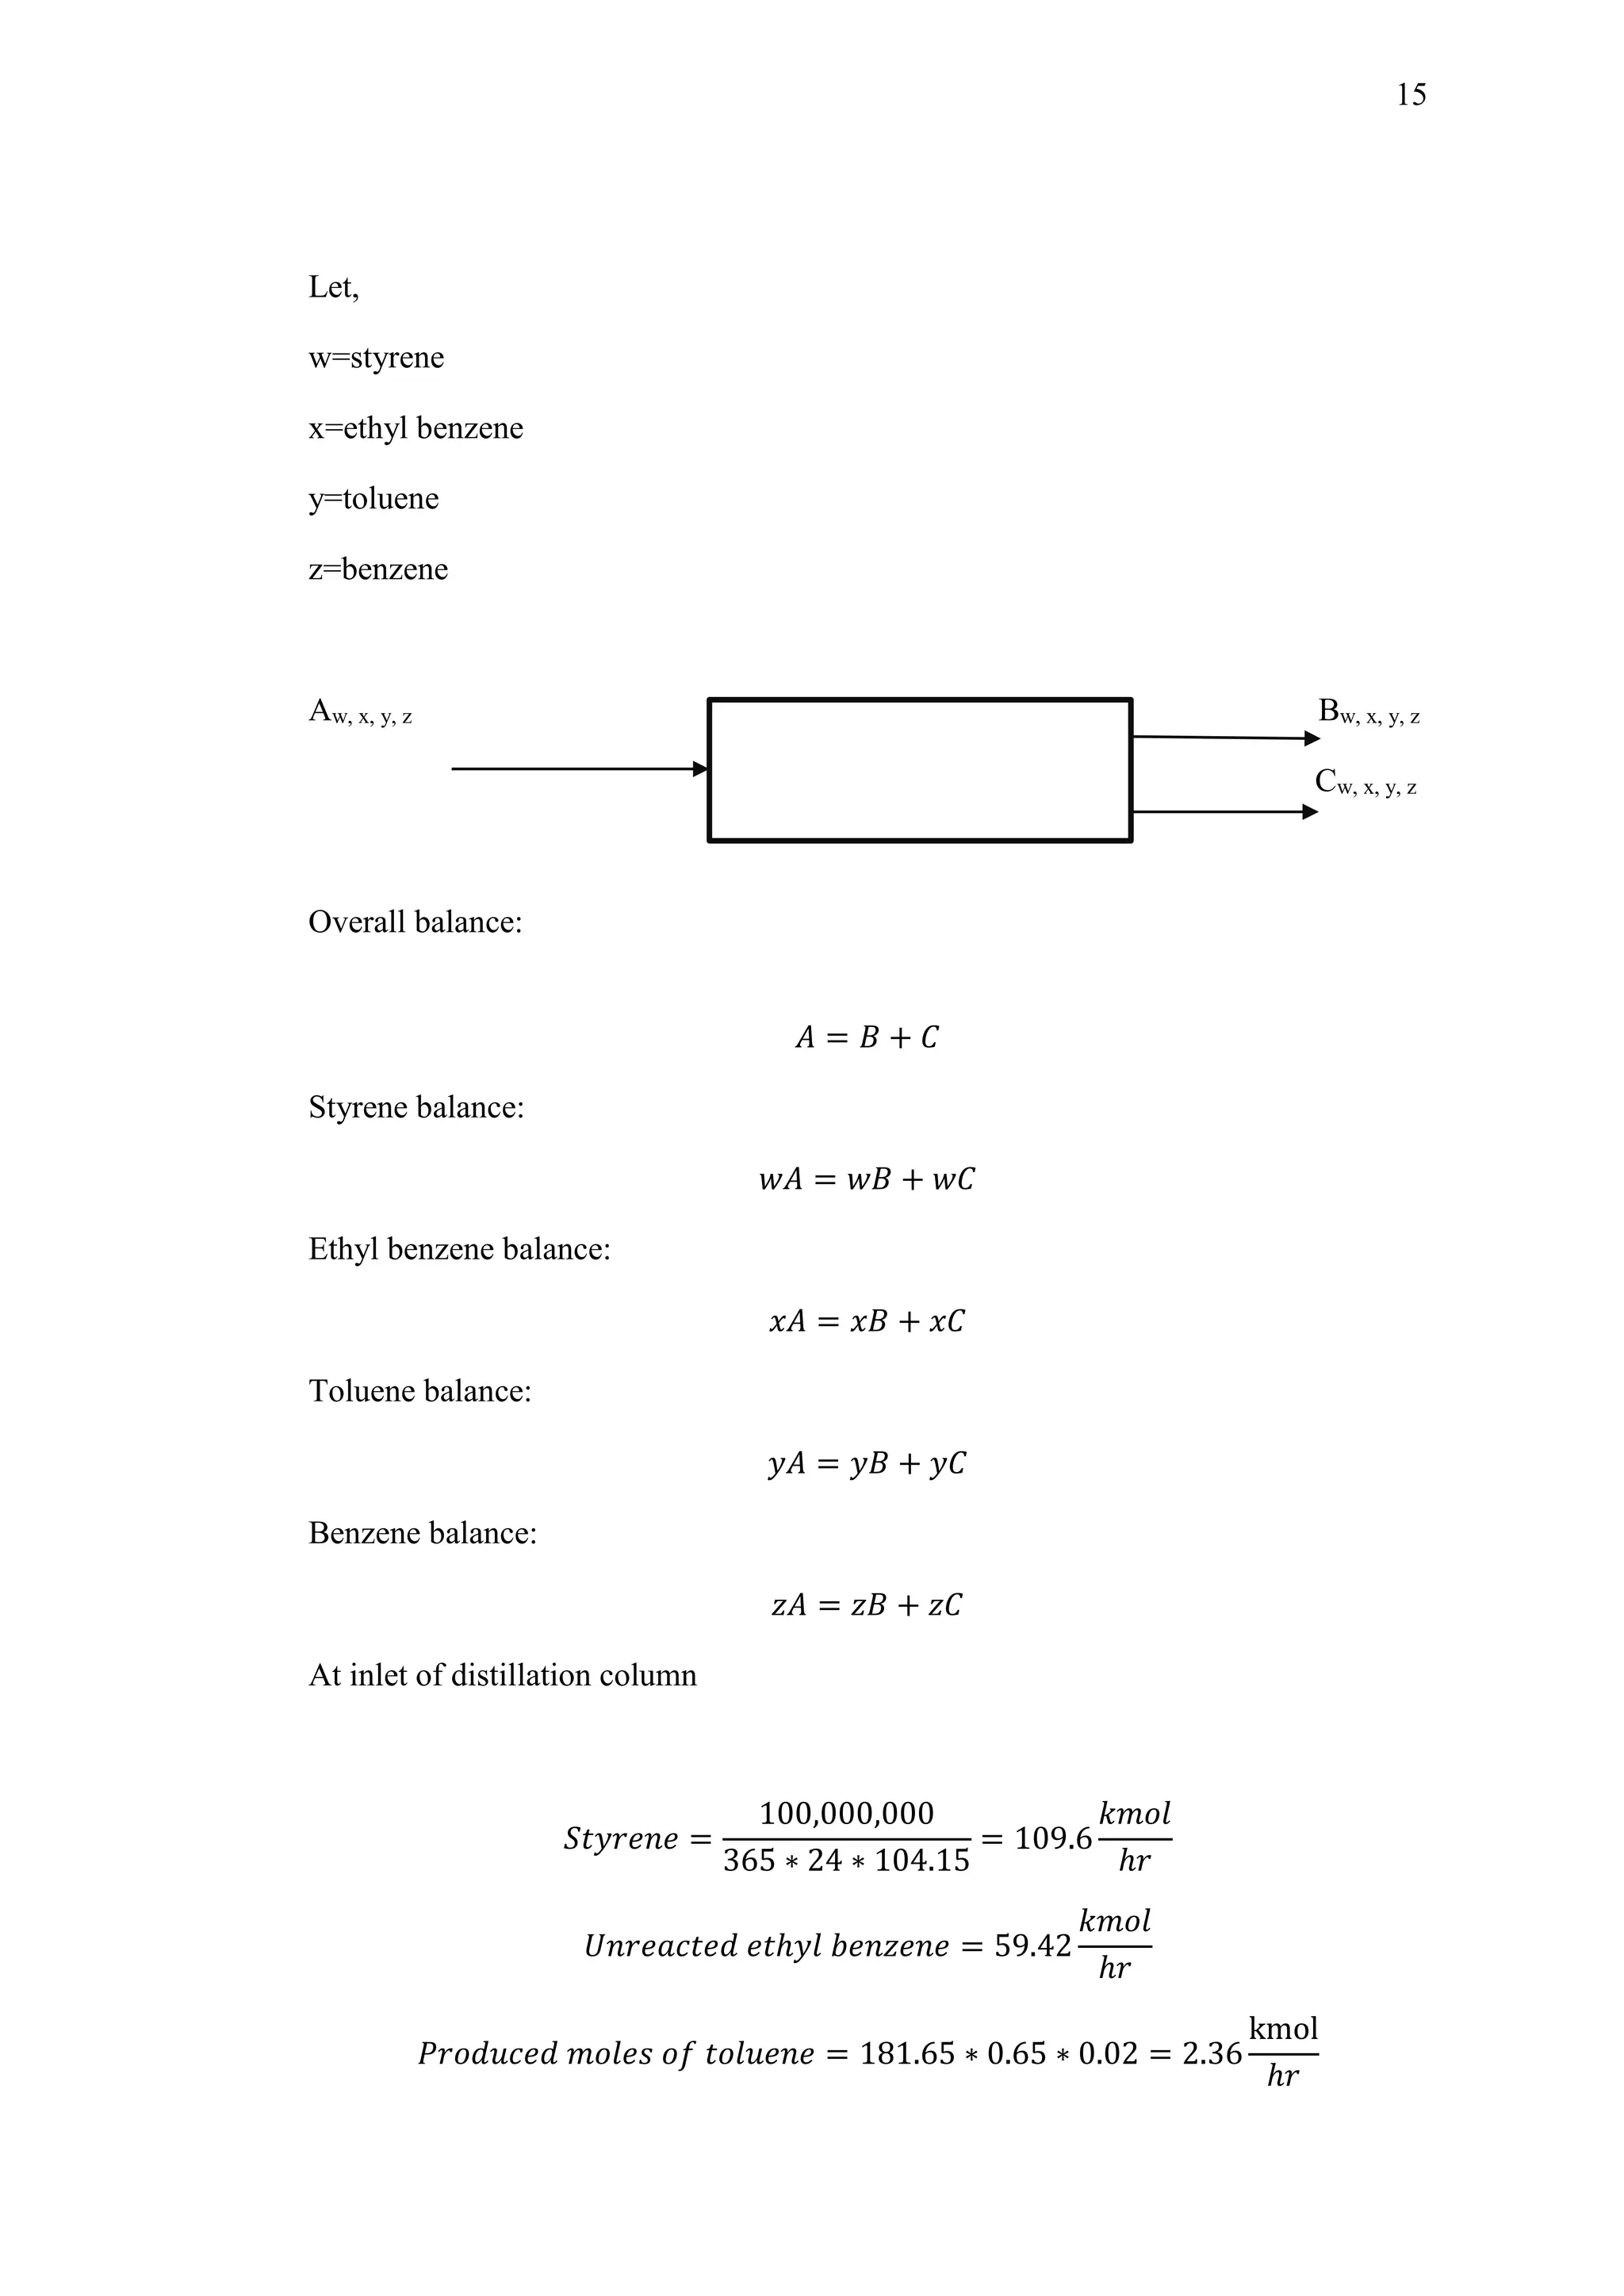
Putting rate equation in design equation
𝑊 = 𝐹𝐴𝑂 ∫
(9 + 𝑋)2
𝐾𝑝1 𝑑𝑋
𝑘𝑖 𝑃𝑇[(1 − 𝑋)(9 + 𝑋)𝐾𝑝1 − 𝑃𝑇 𝑋2]
𝑋1
𝑋0
Table 5-1: Reactor 1
X T Kp1 ki ra 1/ra
1 0 908 0.4402 0.0497 0.0099 100.603
2 0.05 898.257 0.3671 0.0436 0.0082 121.558
3 0.10 889.014 0.3079 0.0386 0.0068 146.571
4 0.15 878.642 0.2516 0.0332 0.0054 183.939
5 0.20 869.428 0.2094 0.0291 0.0043 203.308
6 0.25 858.285 0.1669 0.0247 0.0032 307.256
7 0.30 847.842 0.1342 0.0211 0.0023 429.439
8 0.35 837.957 0.1086 0.0181 0.0015 663.020
There are two advantages of the 3/8th
rule:
1. First, the error term is smaller than Simpson's 1.3rd
rule.
2. The second more important use of the 3/8ths rule is for
uniformly sampled function integration.
Using Simpson 3/8th Rule
𝑊 = 𝐹𝐴𝑂 ∗
3ℎ
8
(𝑓1 + 3(𝑓2 + 𝑓3) + 𝑓4) = 𝐹𝐴𝑂 ∗ (20.417 + 57.682)
= 181.65 ∗ 78.09 = 14186.8 𝐾𝑔 = 14.186 𝑇𝑜𝑛
Bulk density of catalyst is 1300kg/m3
.
𝑉 =
𝑊𝑒𝑖𝑔ℎ𝑡
𝑑𝑒𝑛𝑠𝑖𝑡𝑦
=
14186.8
1300
= 10.91 𝑚3](https://image.slidesharecdn.com/productionofstyrene-190805163317/75/Production-of-styrene-58-2048.jpg)

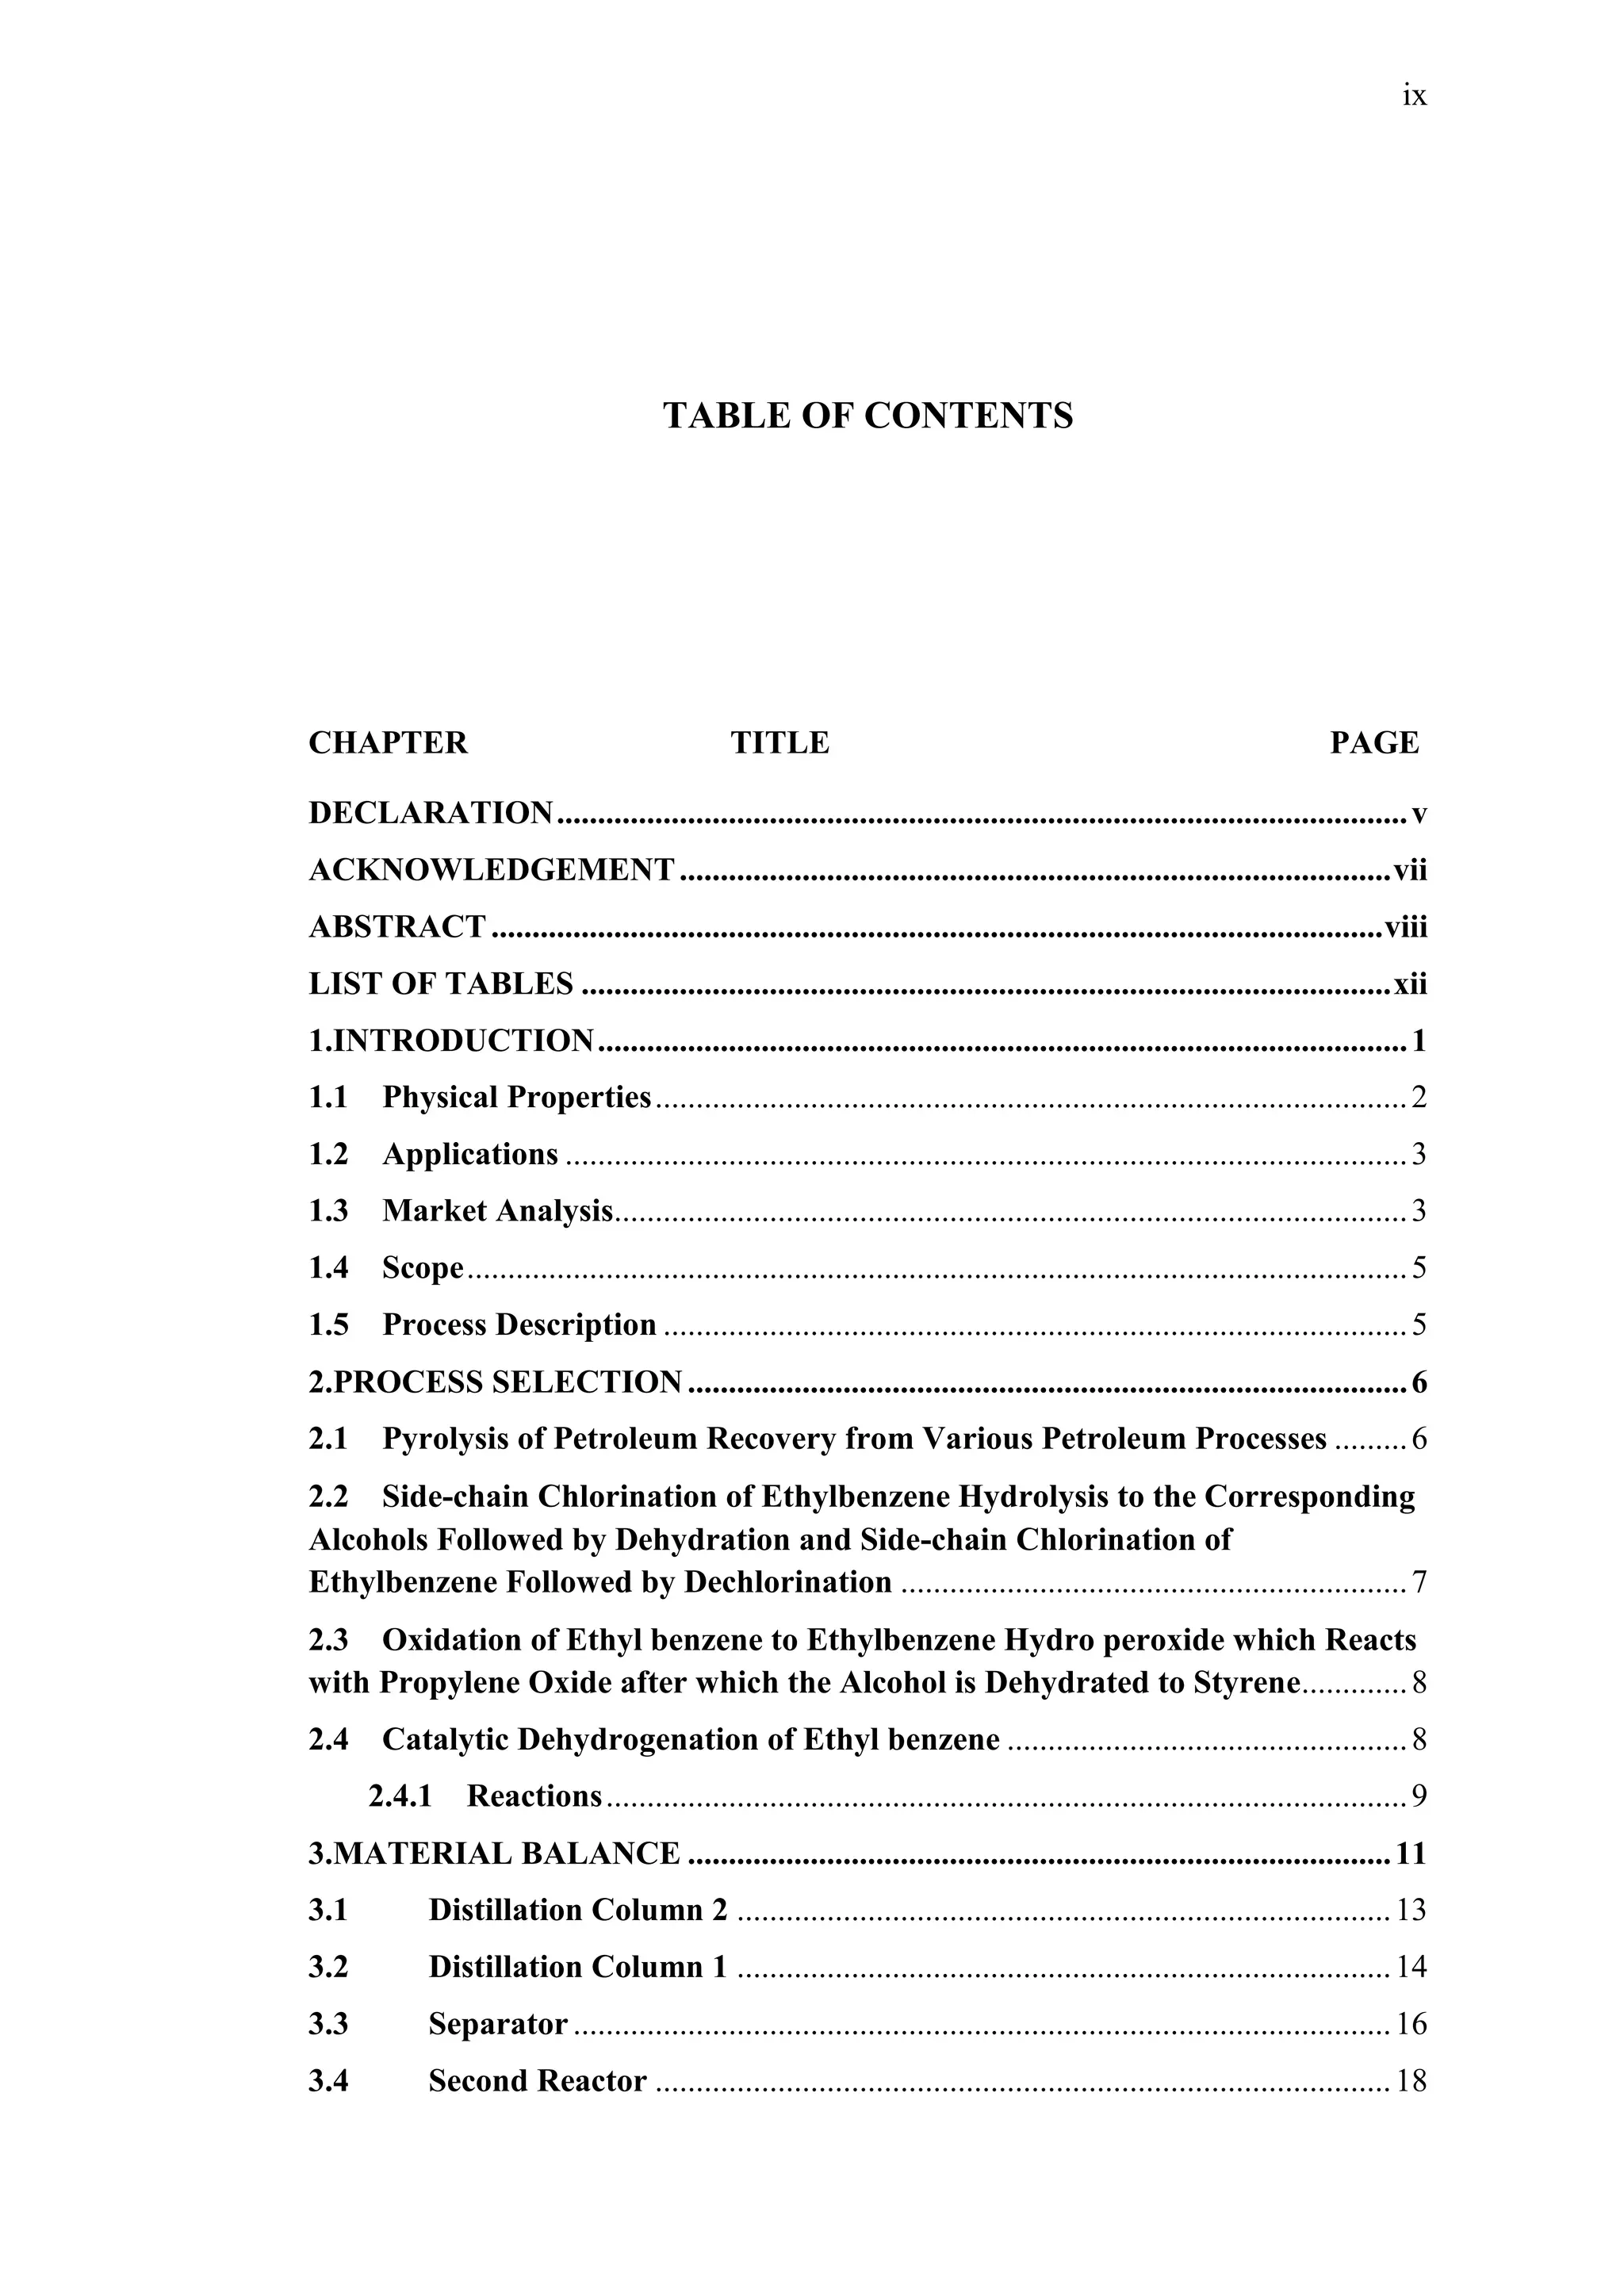
![48
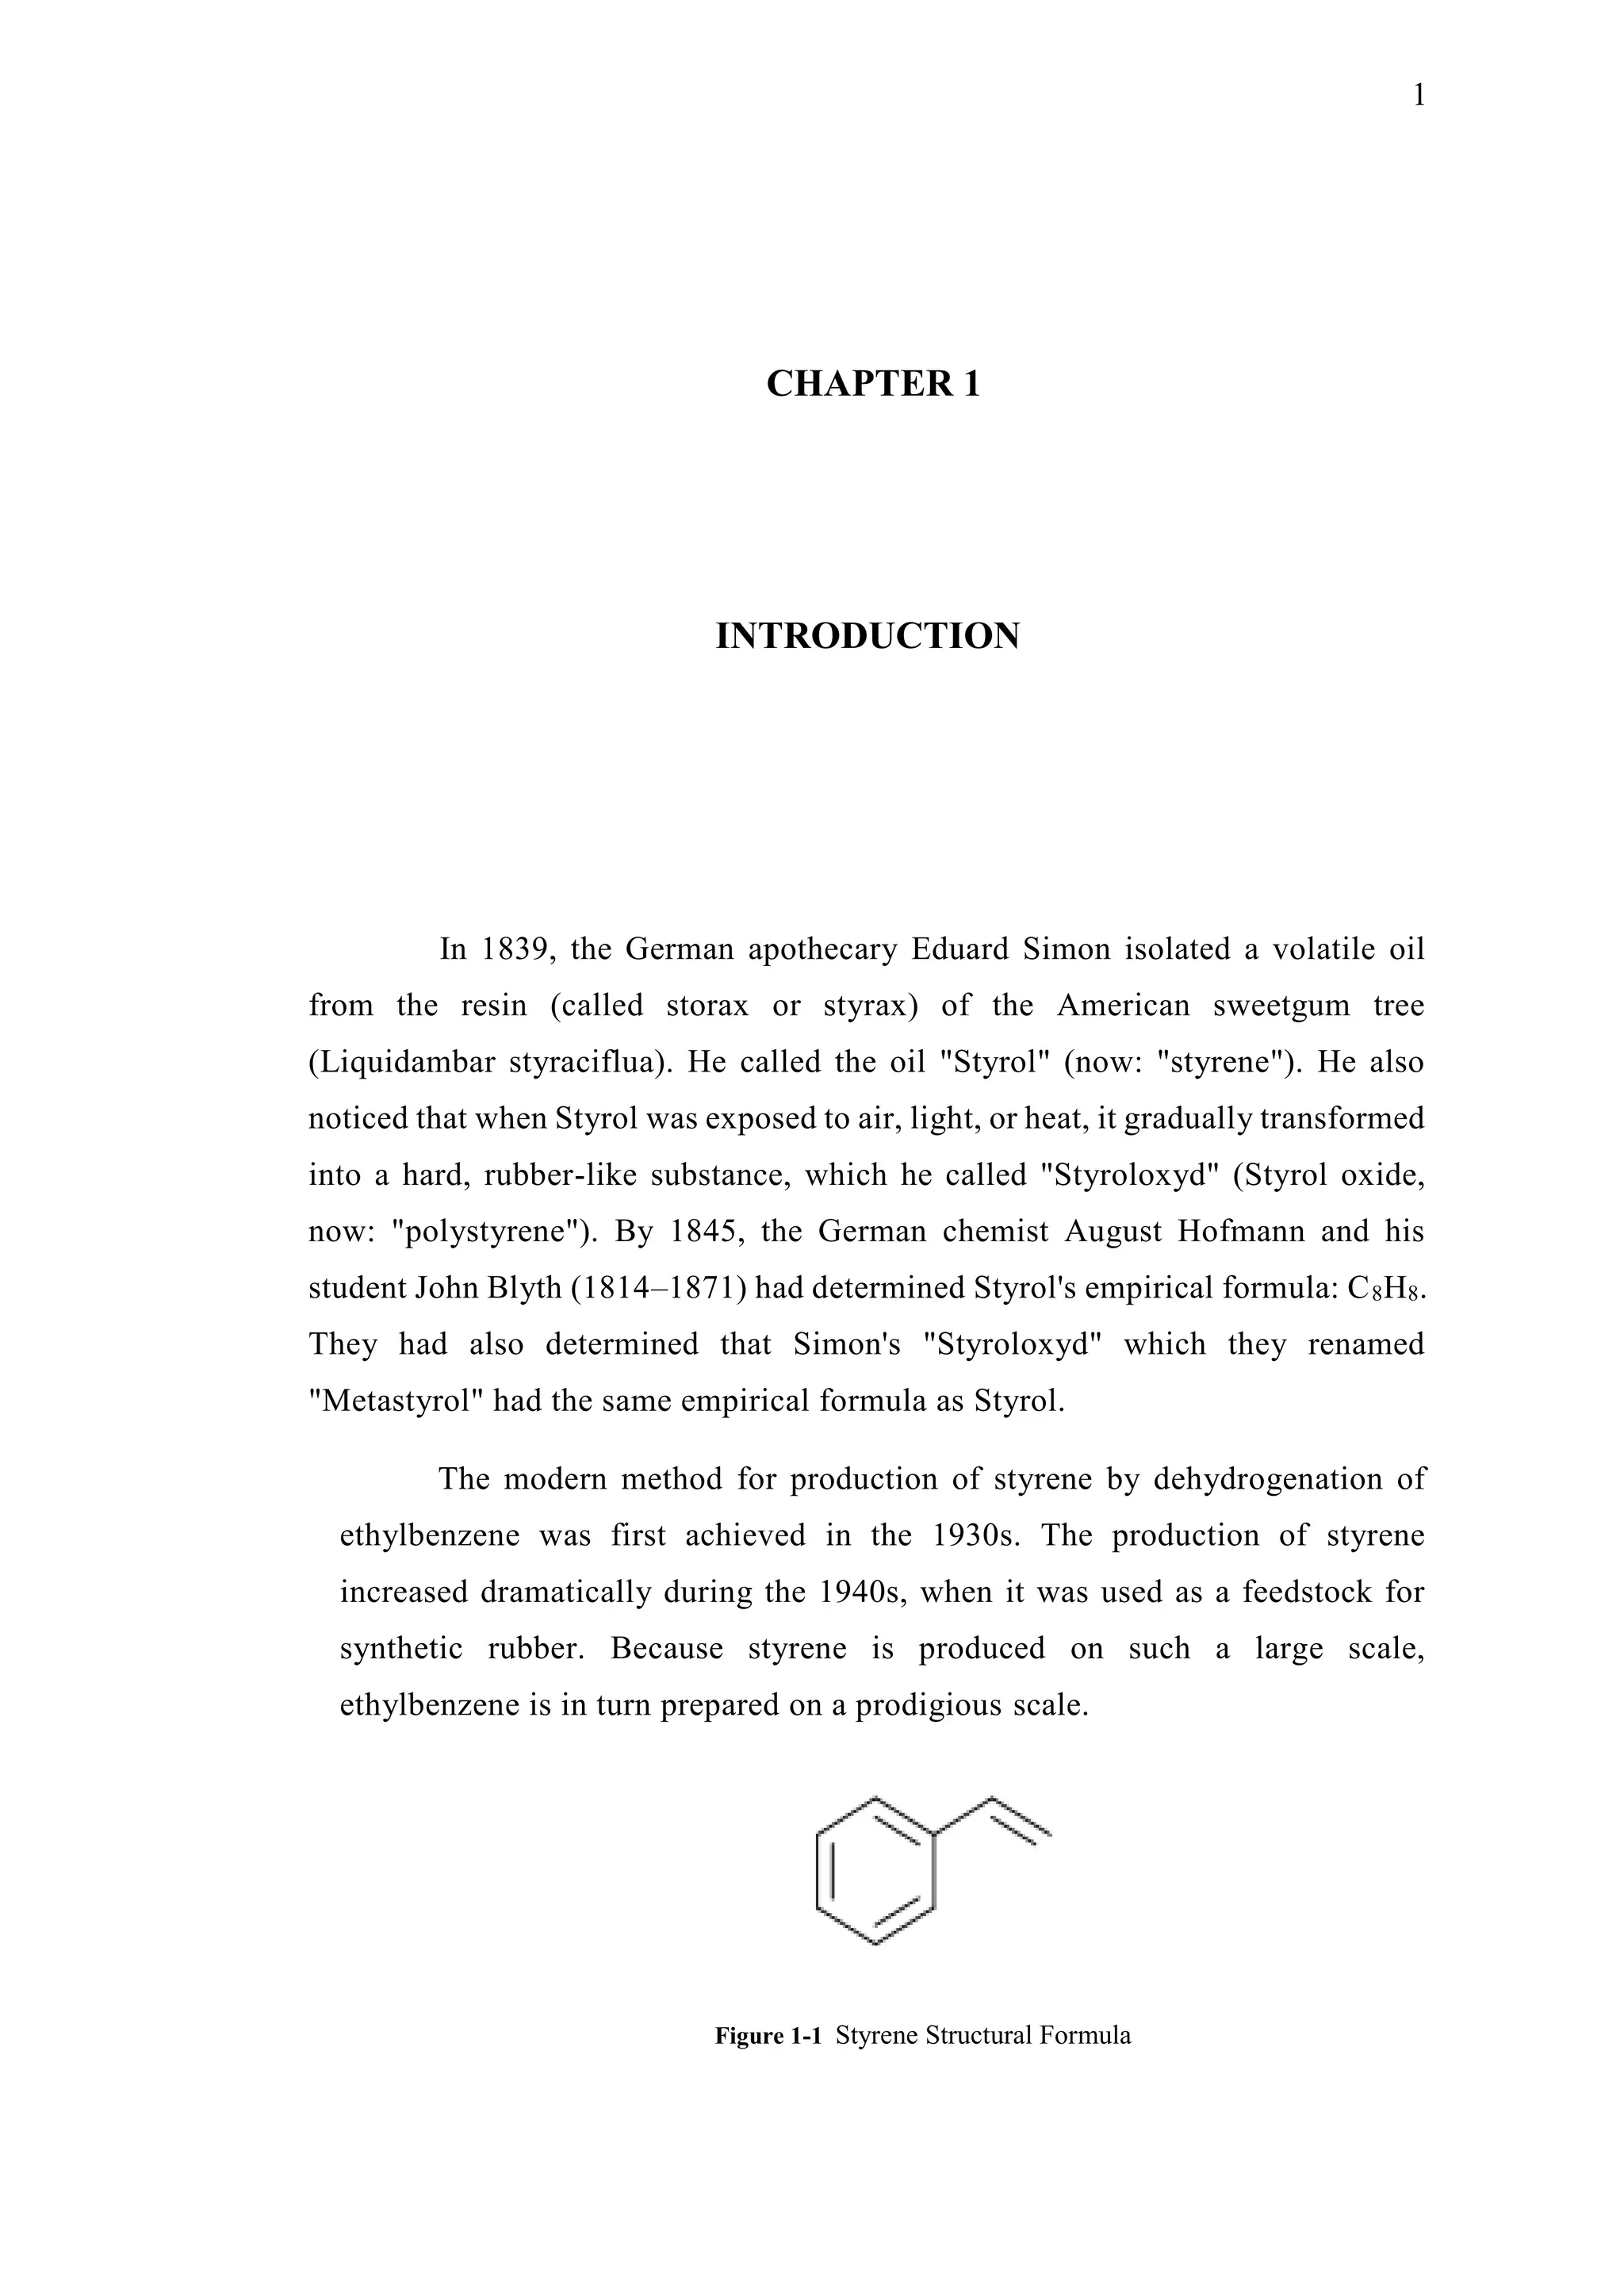
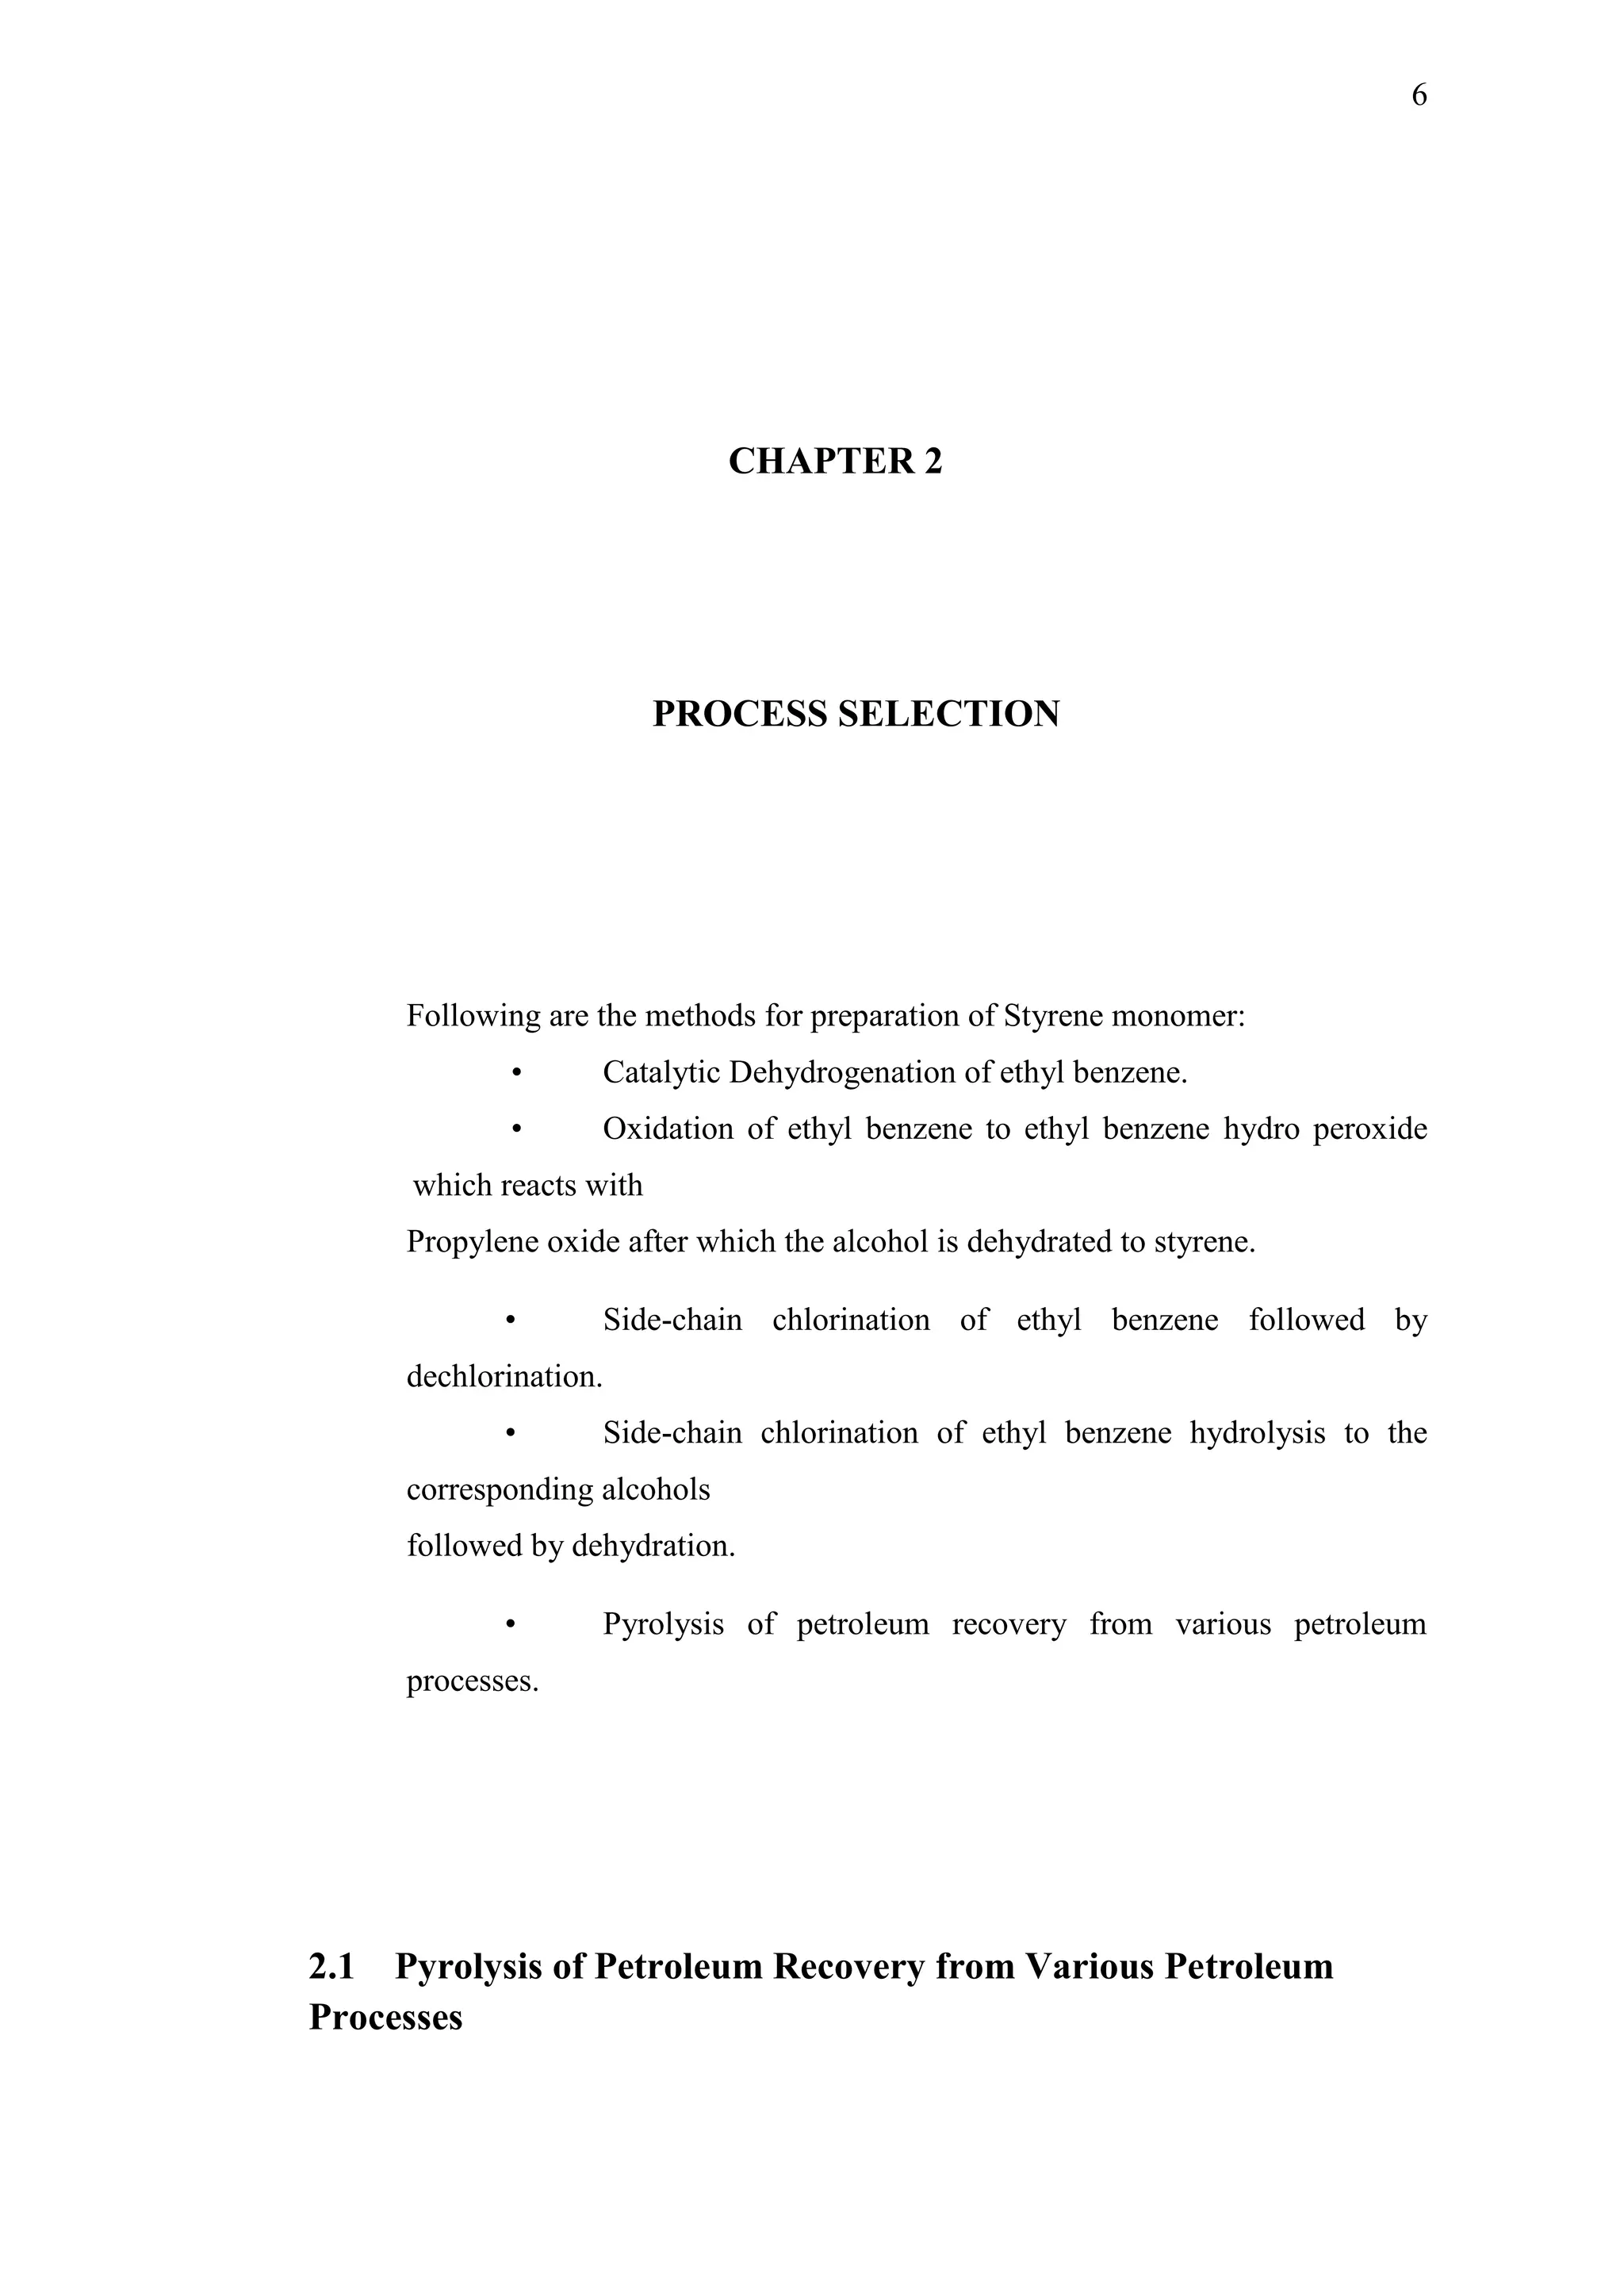
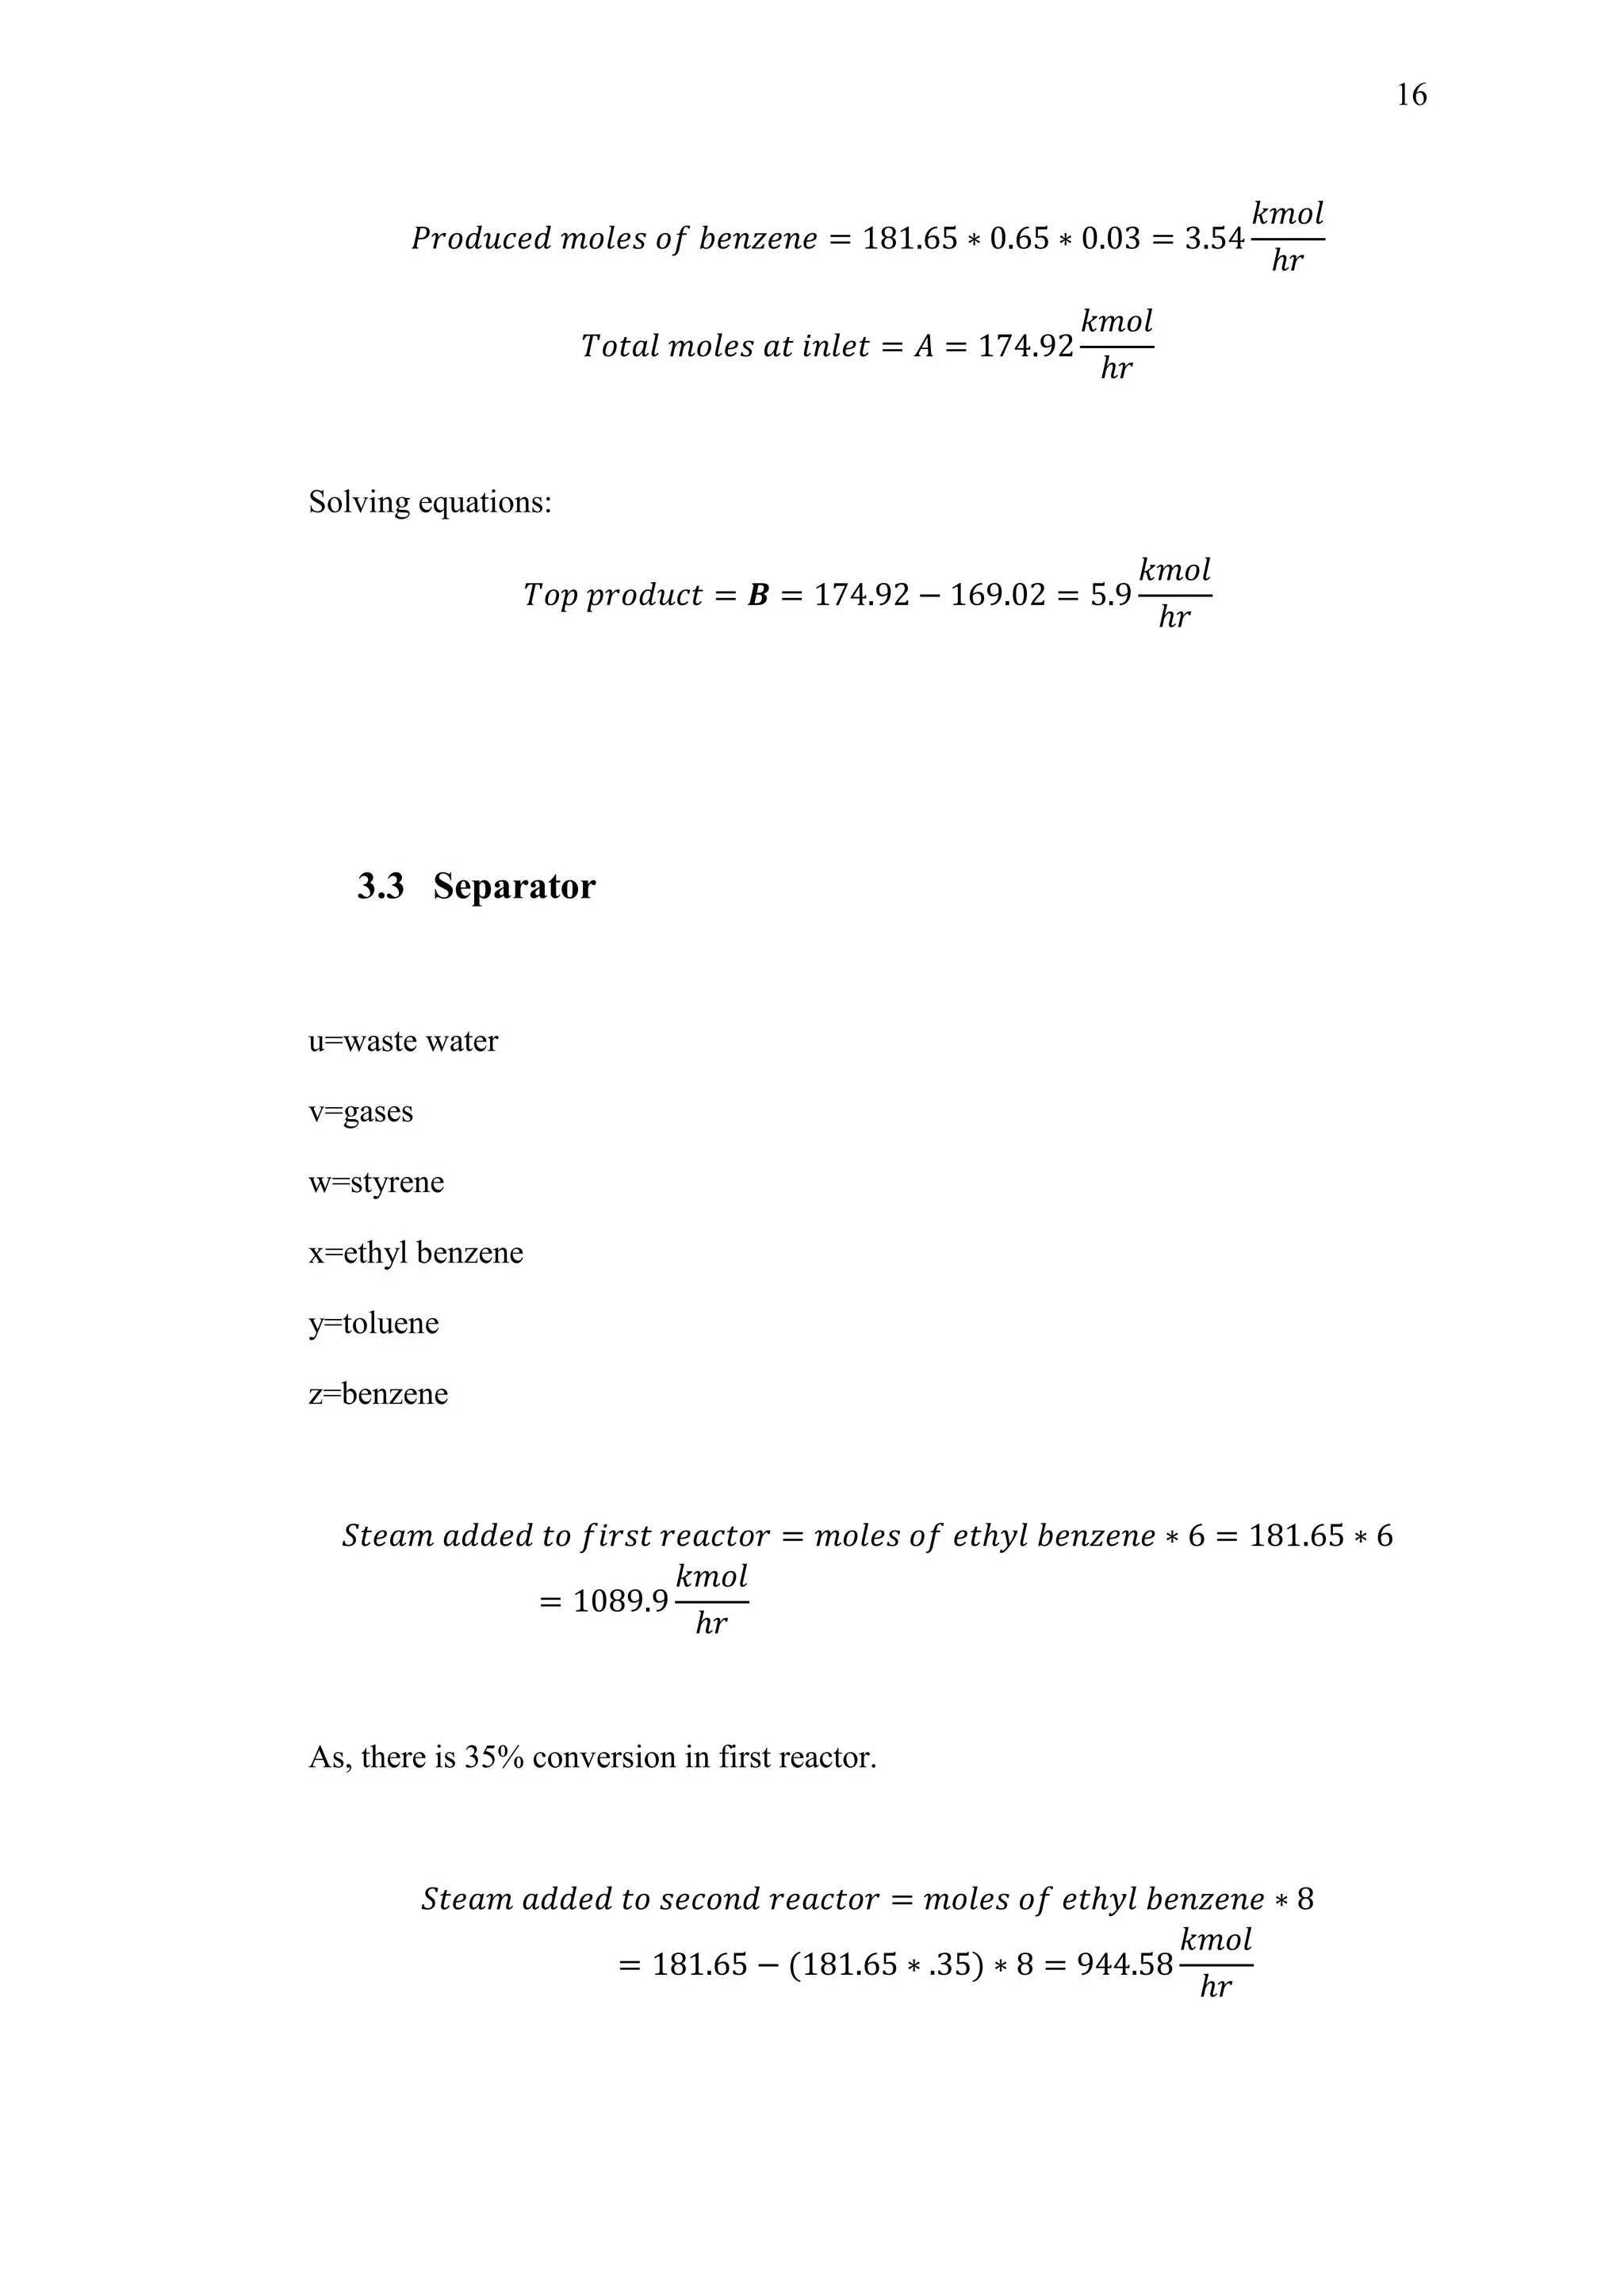
𝑦 =
𝑁 𝑂
𝑁 𝑇
In second reactor for 1 mole of ethyl benzene 6 moles of steam are injected.
𝑇𝑜𝑡𝑎𝑙 𝑚𝑜𝑙𝑒𝑠 𝑜𝑓 𝑟𝑒𝑎𝑐𝑡𝑎𝑛𝑡 = 1 𝑚𝑜𝑙𝑒 𝑜𝑓 𝐸𝐵 + 6 𝑚𝑜𝑙𝑒𝑠 𝑜𝑓 𝑆𝑡𝑒𝑎𝑚 = 7 𝑚𝑜𝑙𝑒𝑠
δ = −1 + 1 + 1 = 1
𝑦 𝐸𝐵 =
1 − 𝑋
7 + 𝑋
𝑦𝑆𝑇 =
𝑋
7 + 𝑋
And
𝑦 𝐻2
=
𝑋
7 + 𝑋
𝑃𝐸𝐵 = 𝑦 𝐸𝐵 ∗ 𝑃𝑇
𝑃𝑆𝑇 = 𝑦𝑆𝑇 ∗ 𝑃𝑇
And
𝑃 𝐻 = 𝑦 𝐻 ∗ 𝑃𝑇
Where subscripts EB, H, and ST refer to ethyl benzene, hydrogen, and styrene
respectively.
Energy Balance
Energy balance for adiabatic operation of packed bed reactor is given as
𝑋 =
𝛴𝜃𝑖 𝐶 𝑝 𝑖
(𝑇 − 𝑇0)
−[∆𝐻 𝑅𝑋
𝑂 (𝑇) + ∆𝐶 𝑃(𝑇 − 𝑇𝑅)]
∆𝐻 𝑅𝑋
𝑂
= 118000
𝐽
𝑚𝑜𝑙
By this relation temperature of reaction can be related to conversion.](https://image.slidesharecdn.com/productionofstyrene-190805163317/75/Production-of-styrene-60-2048.jpg)
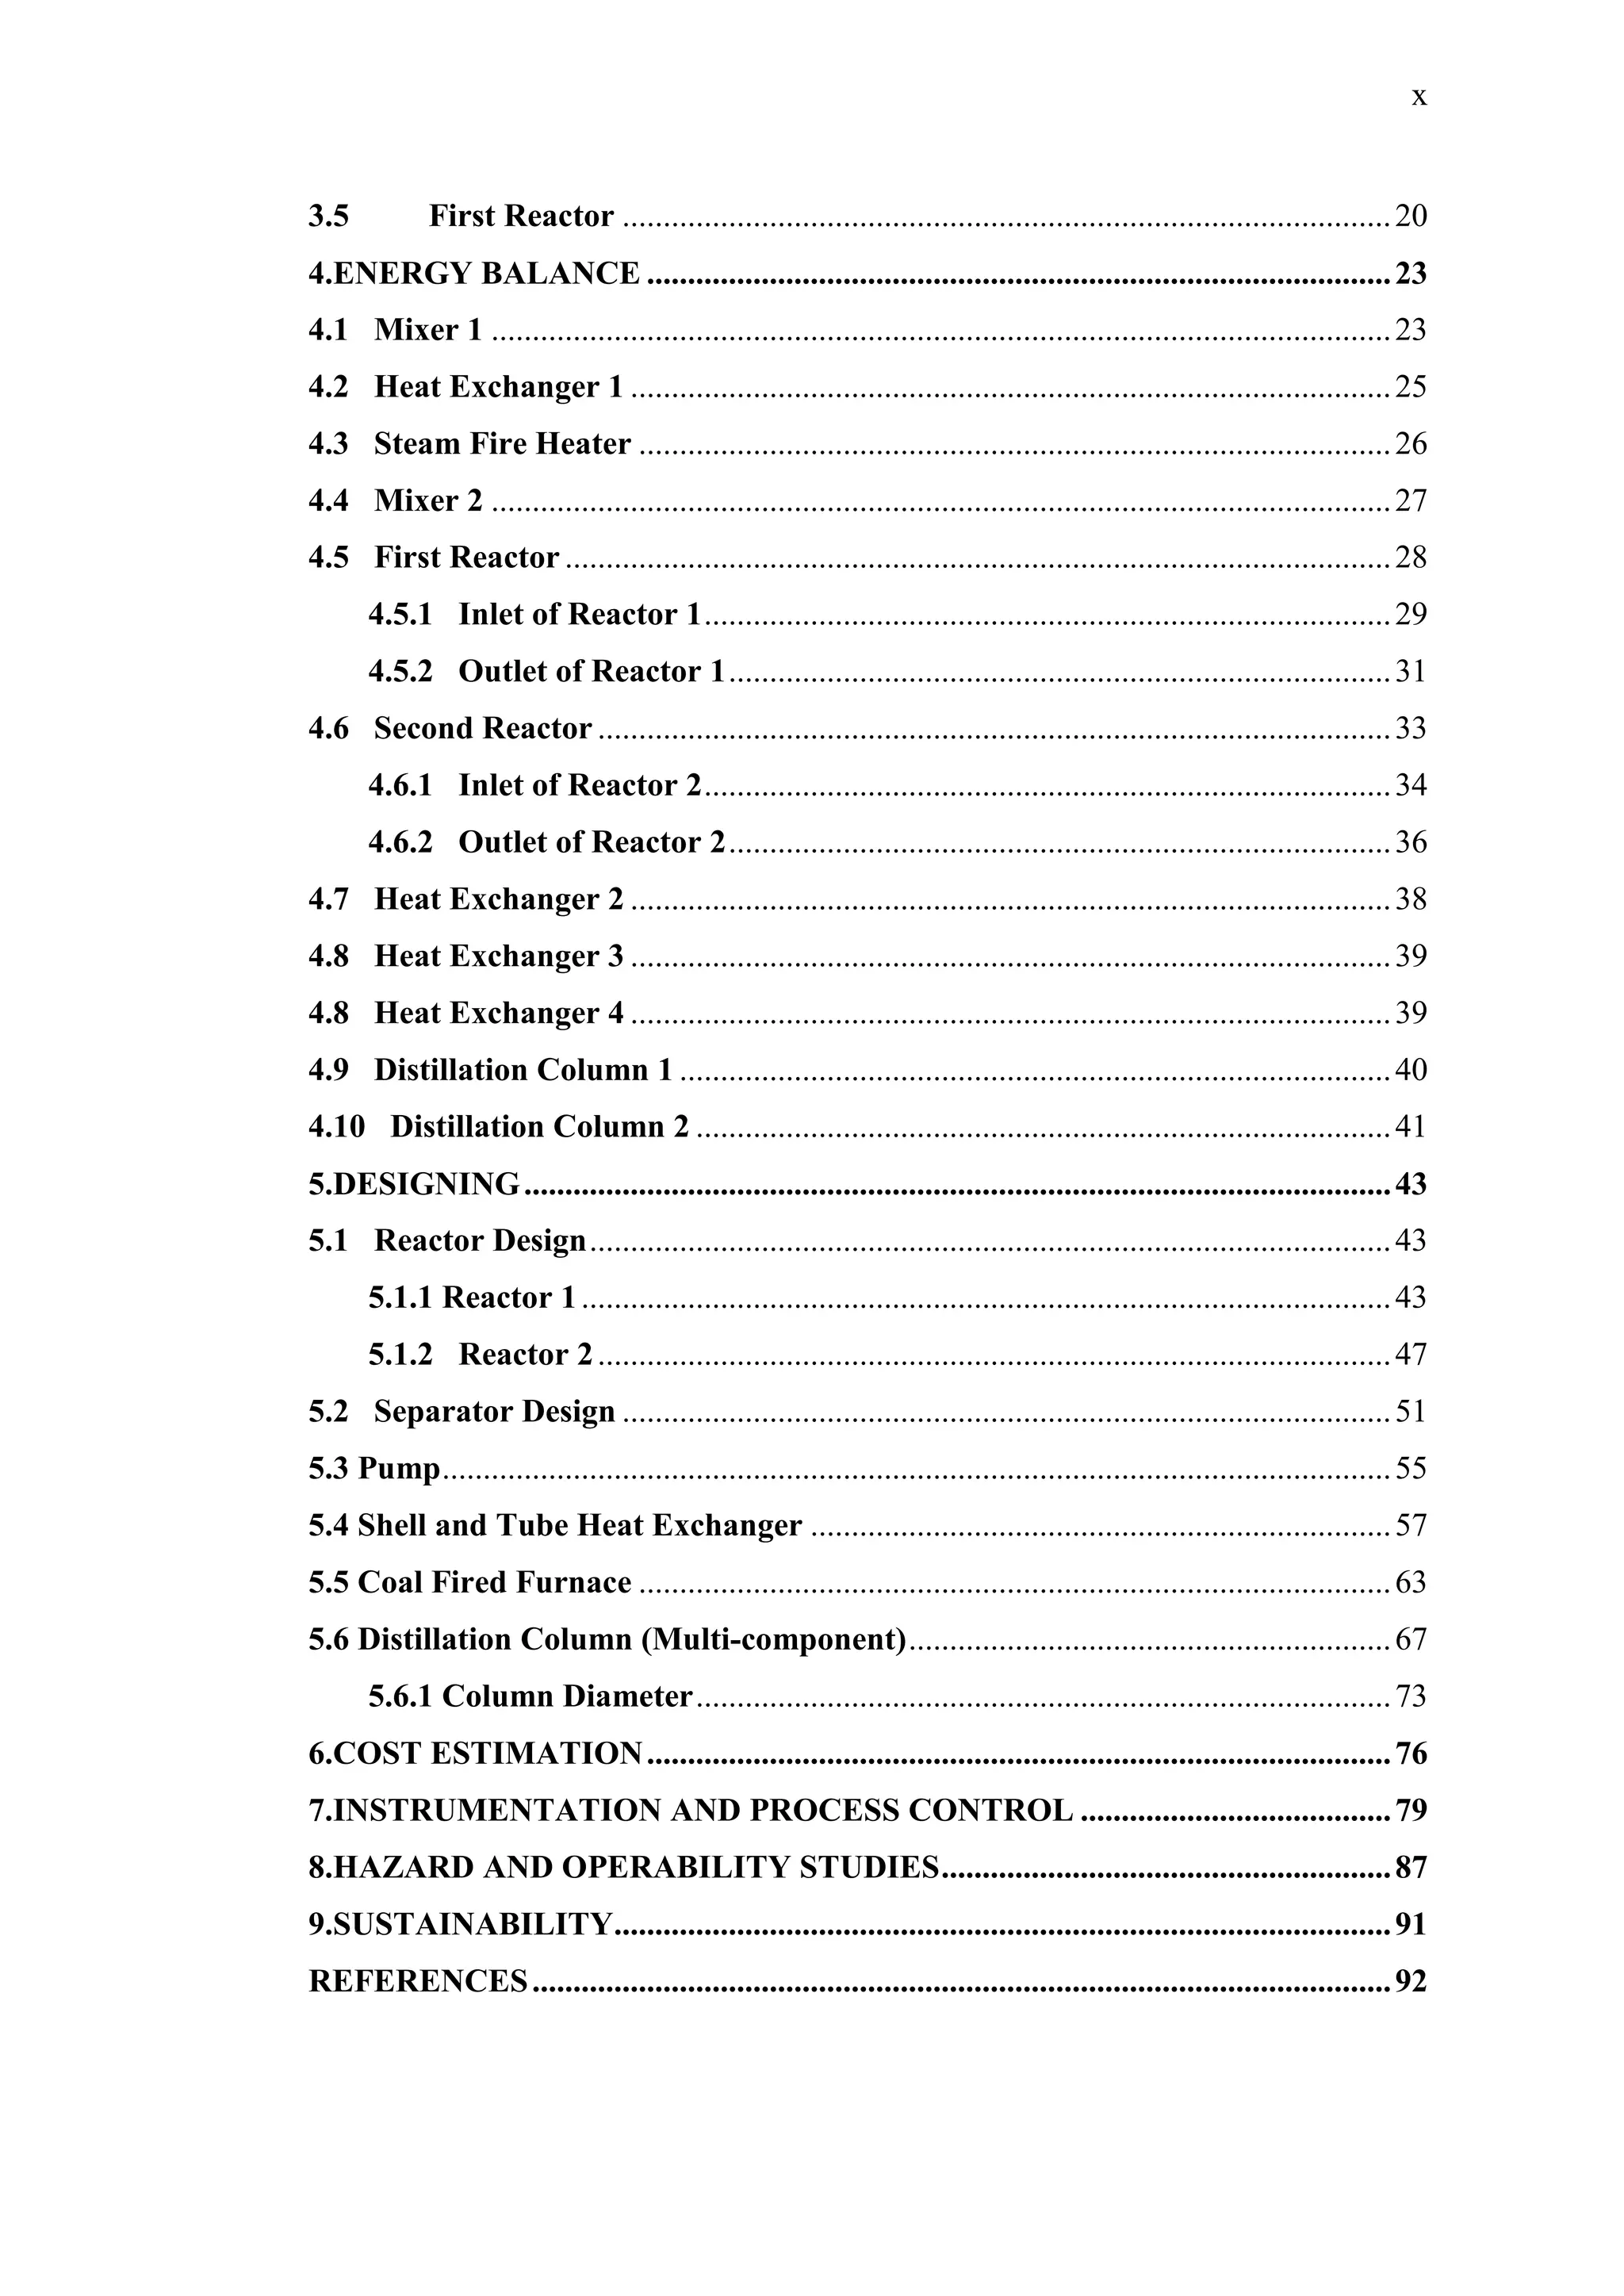
![49
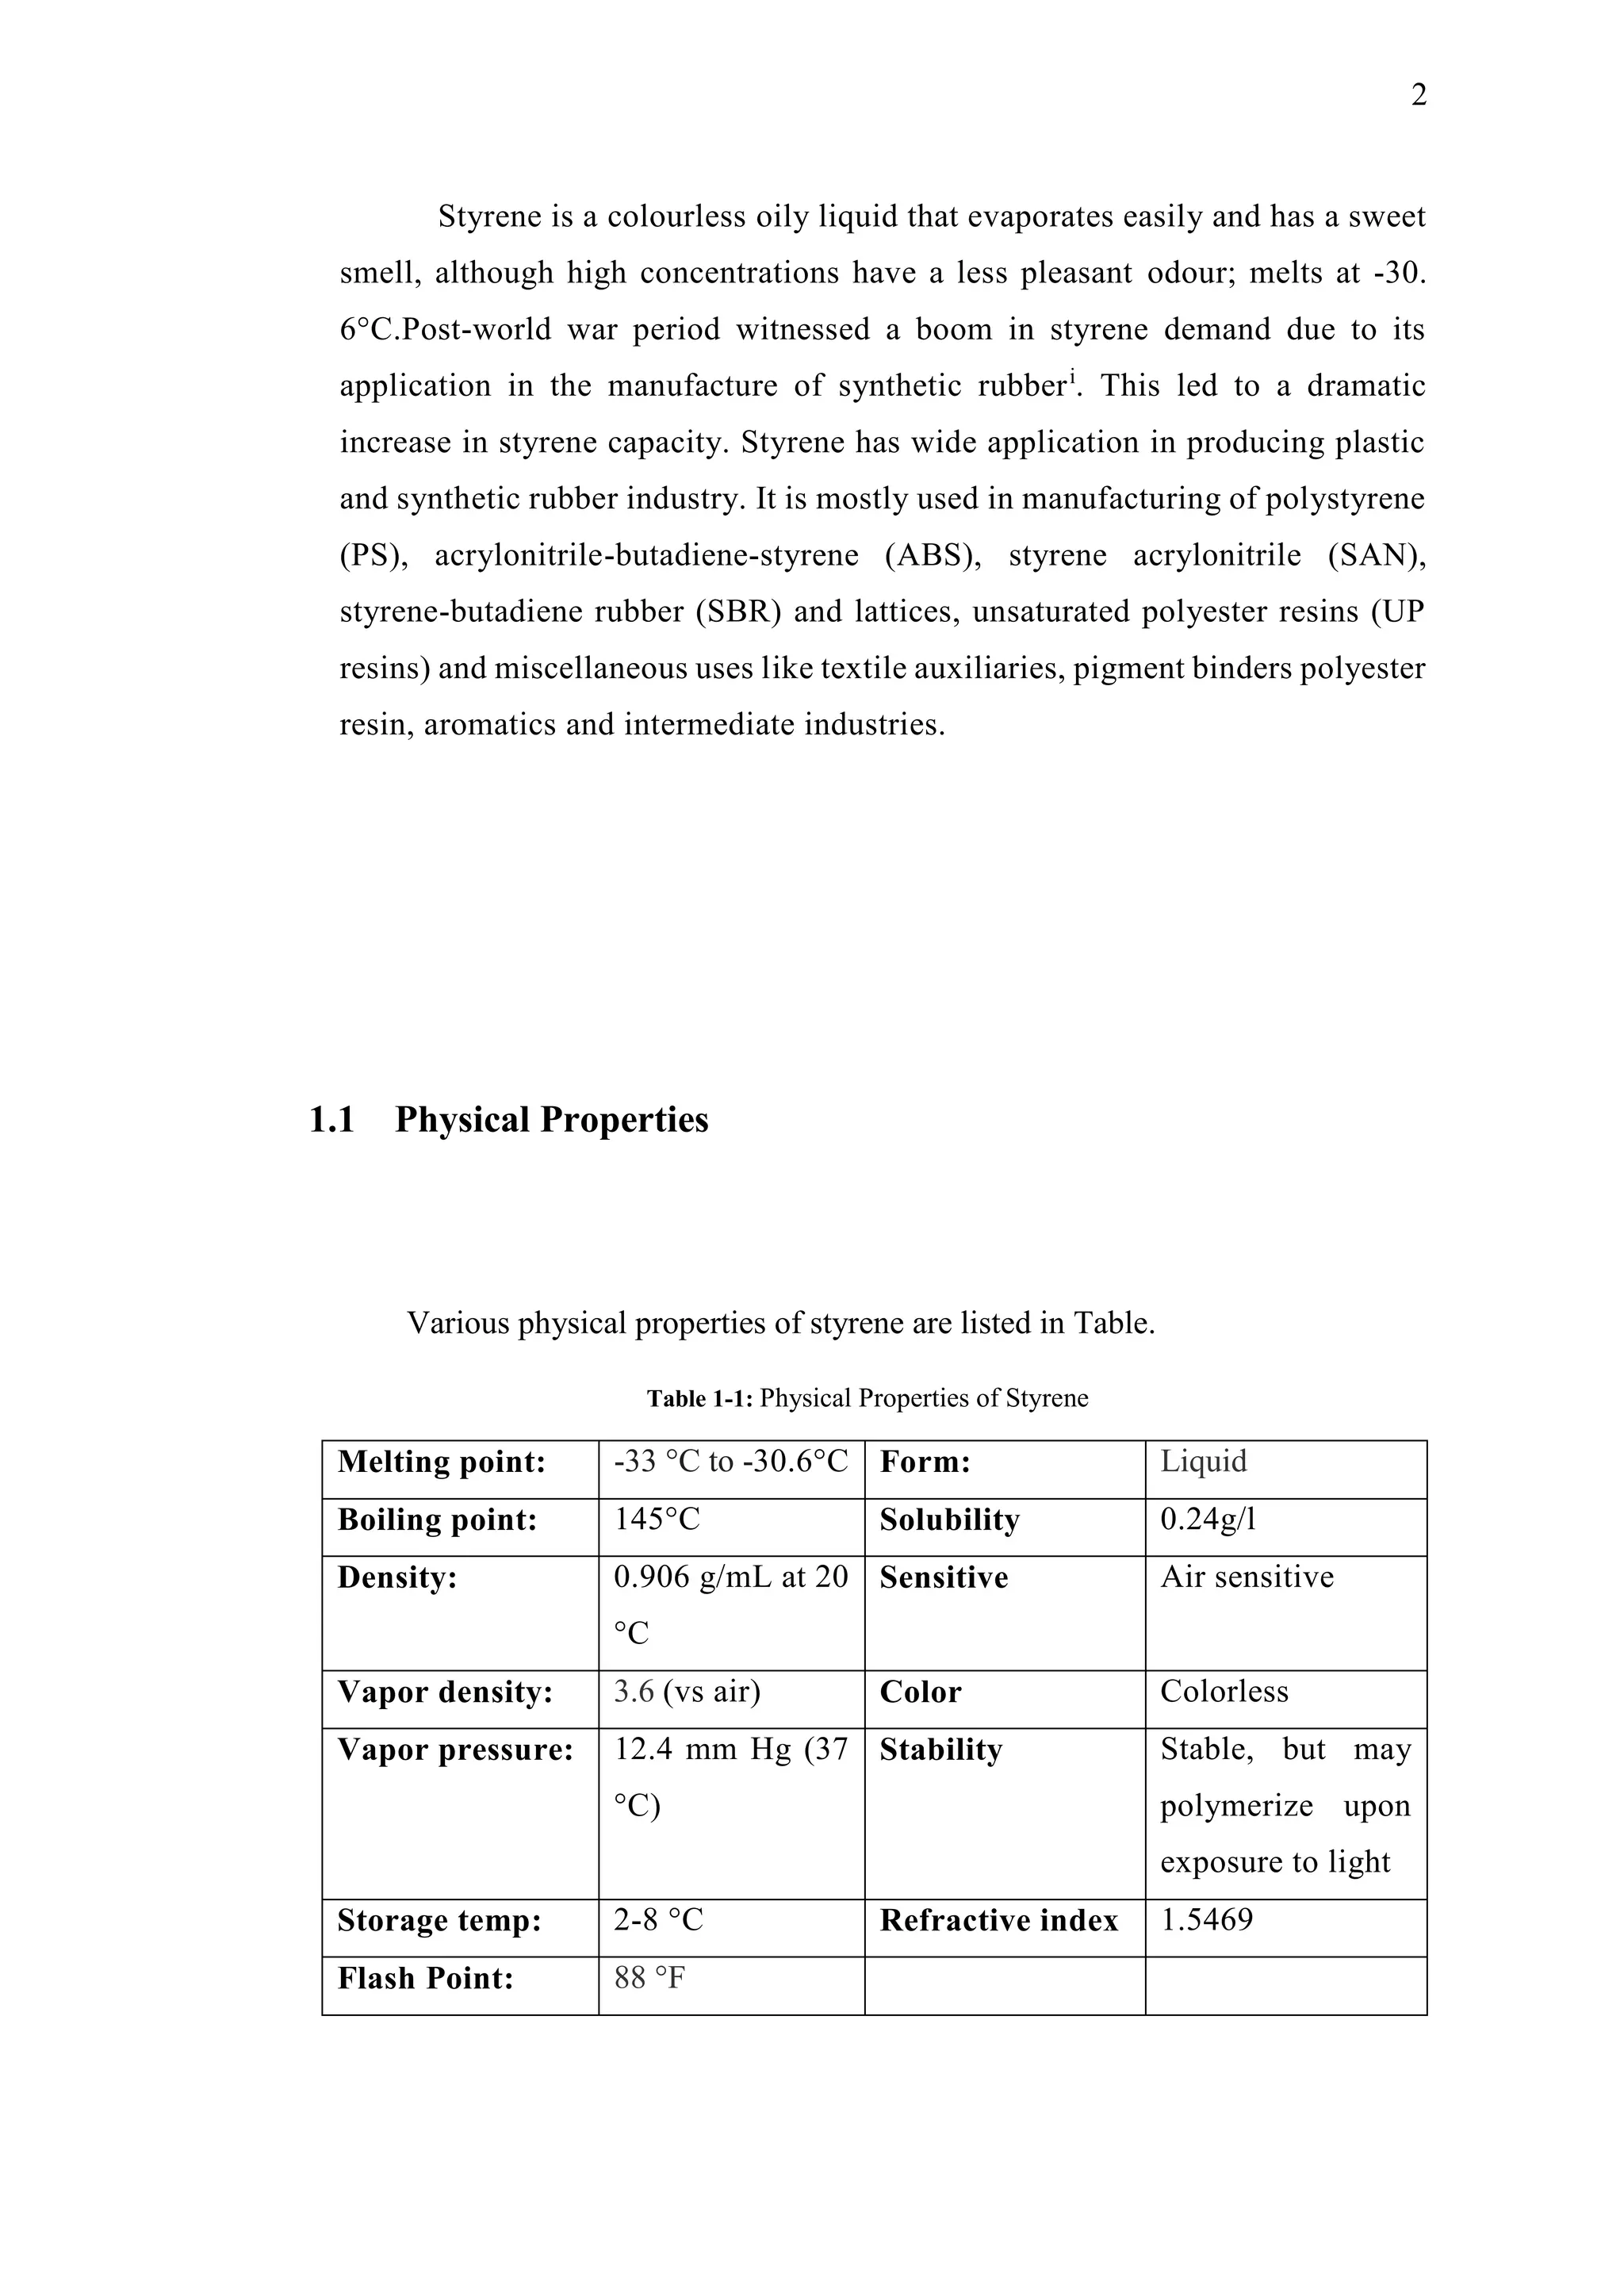
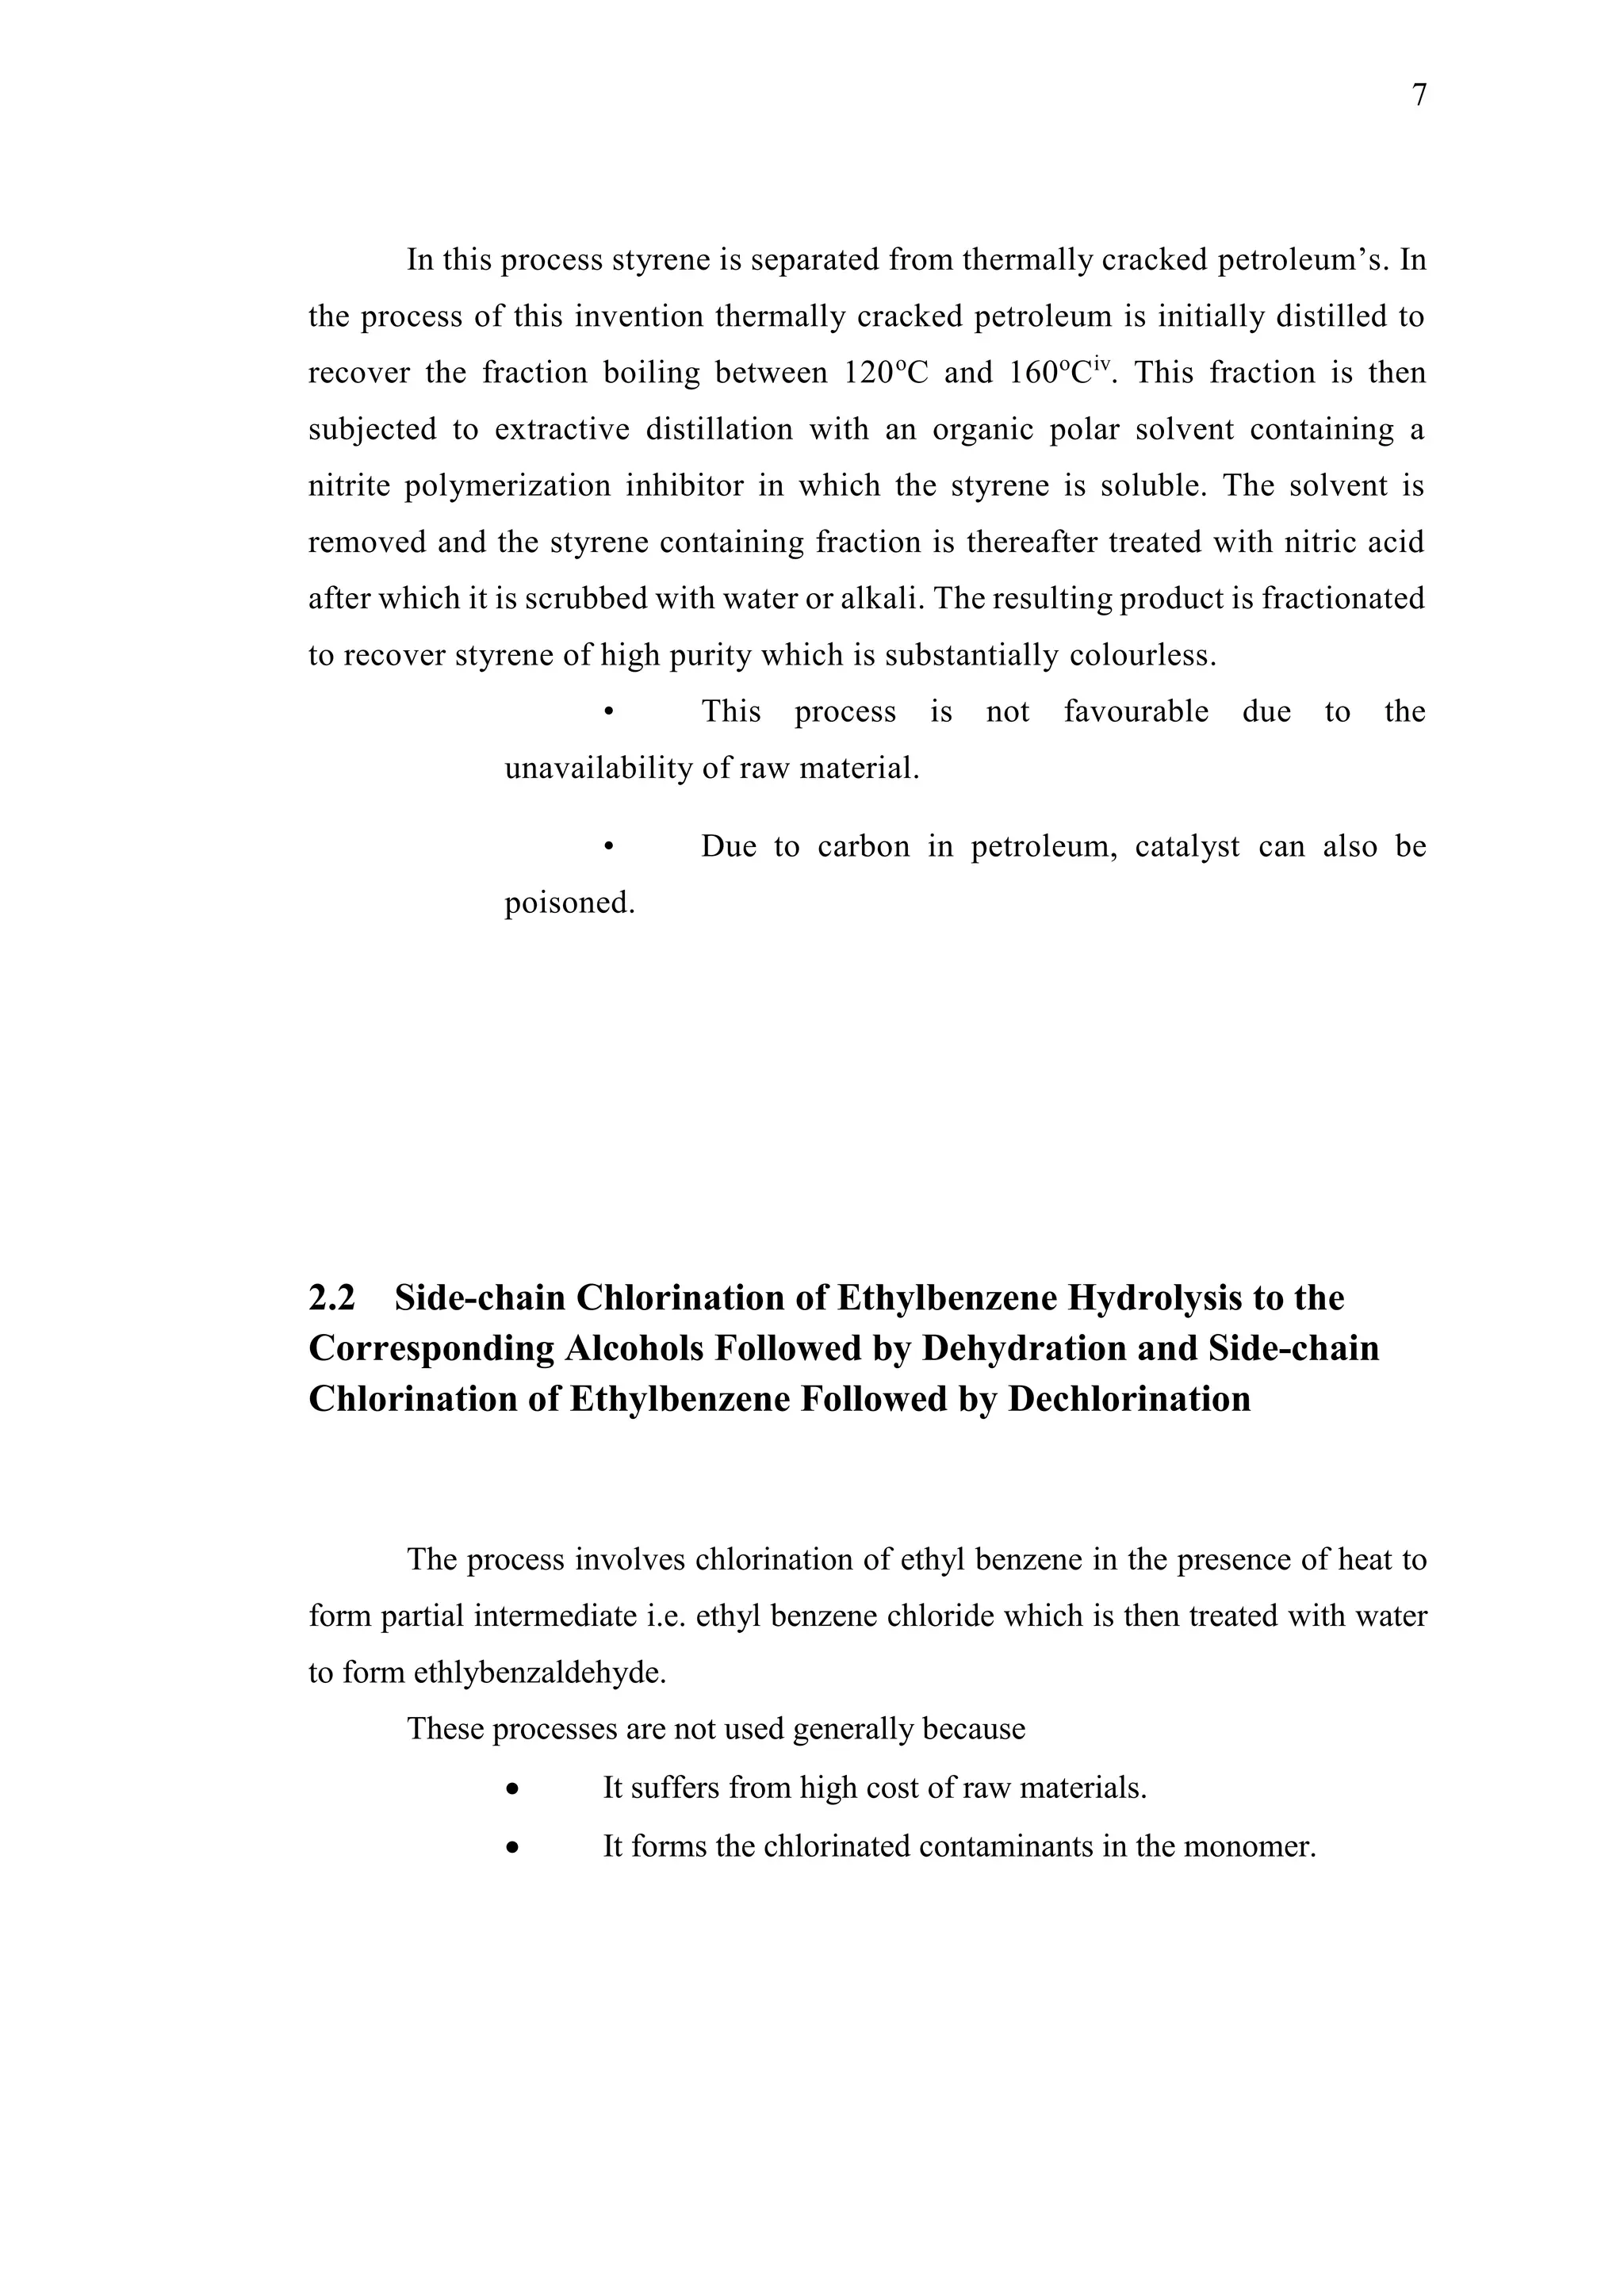
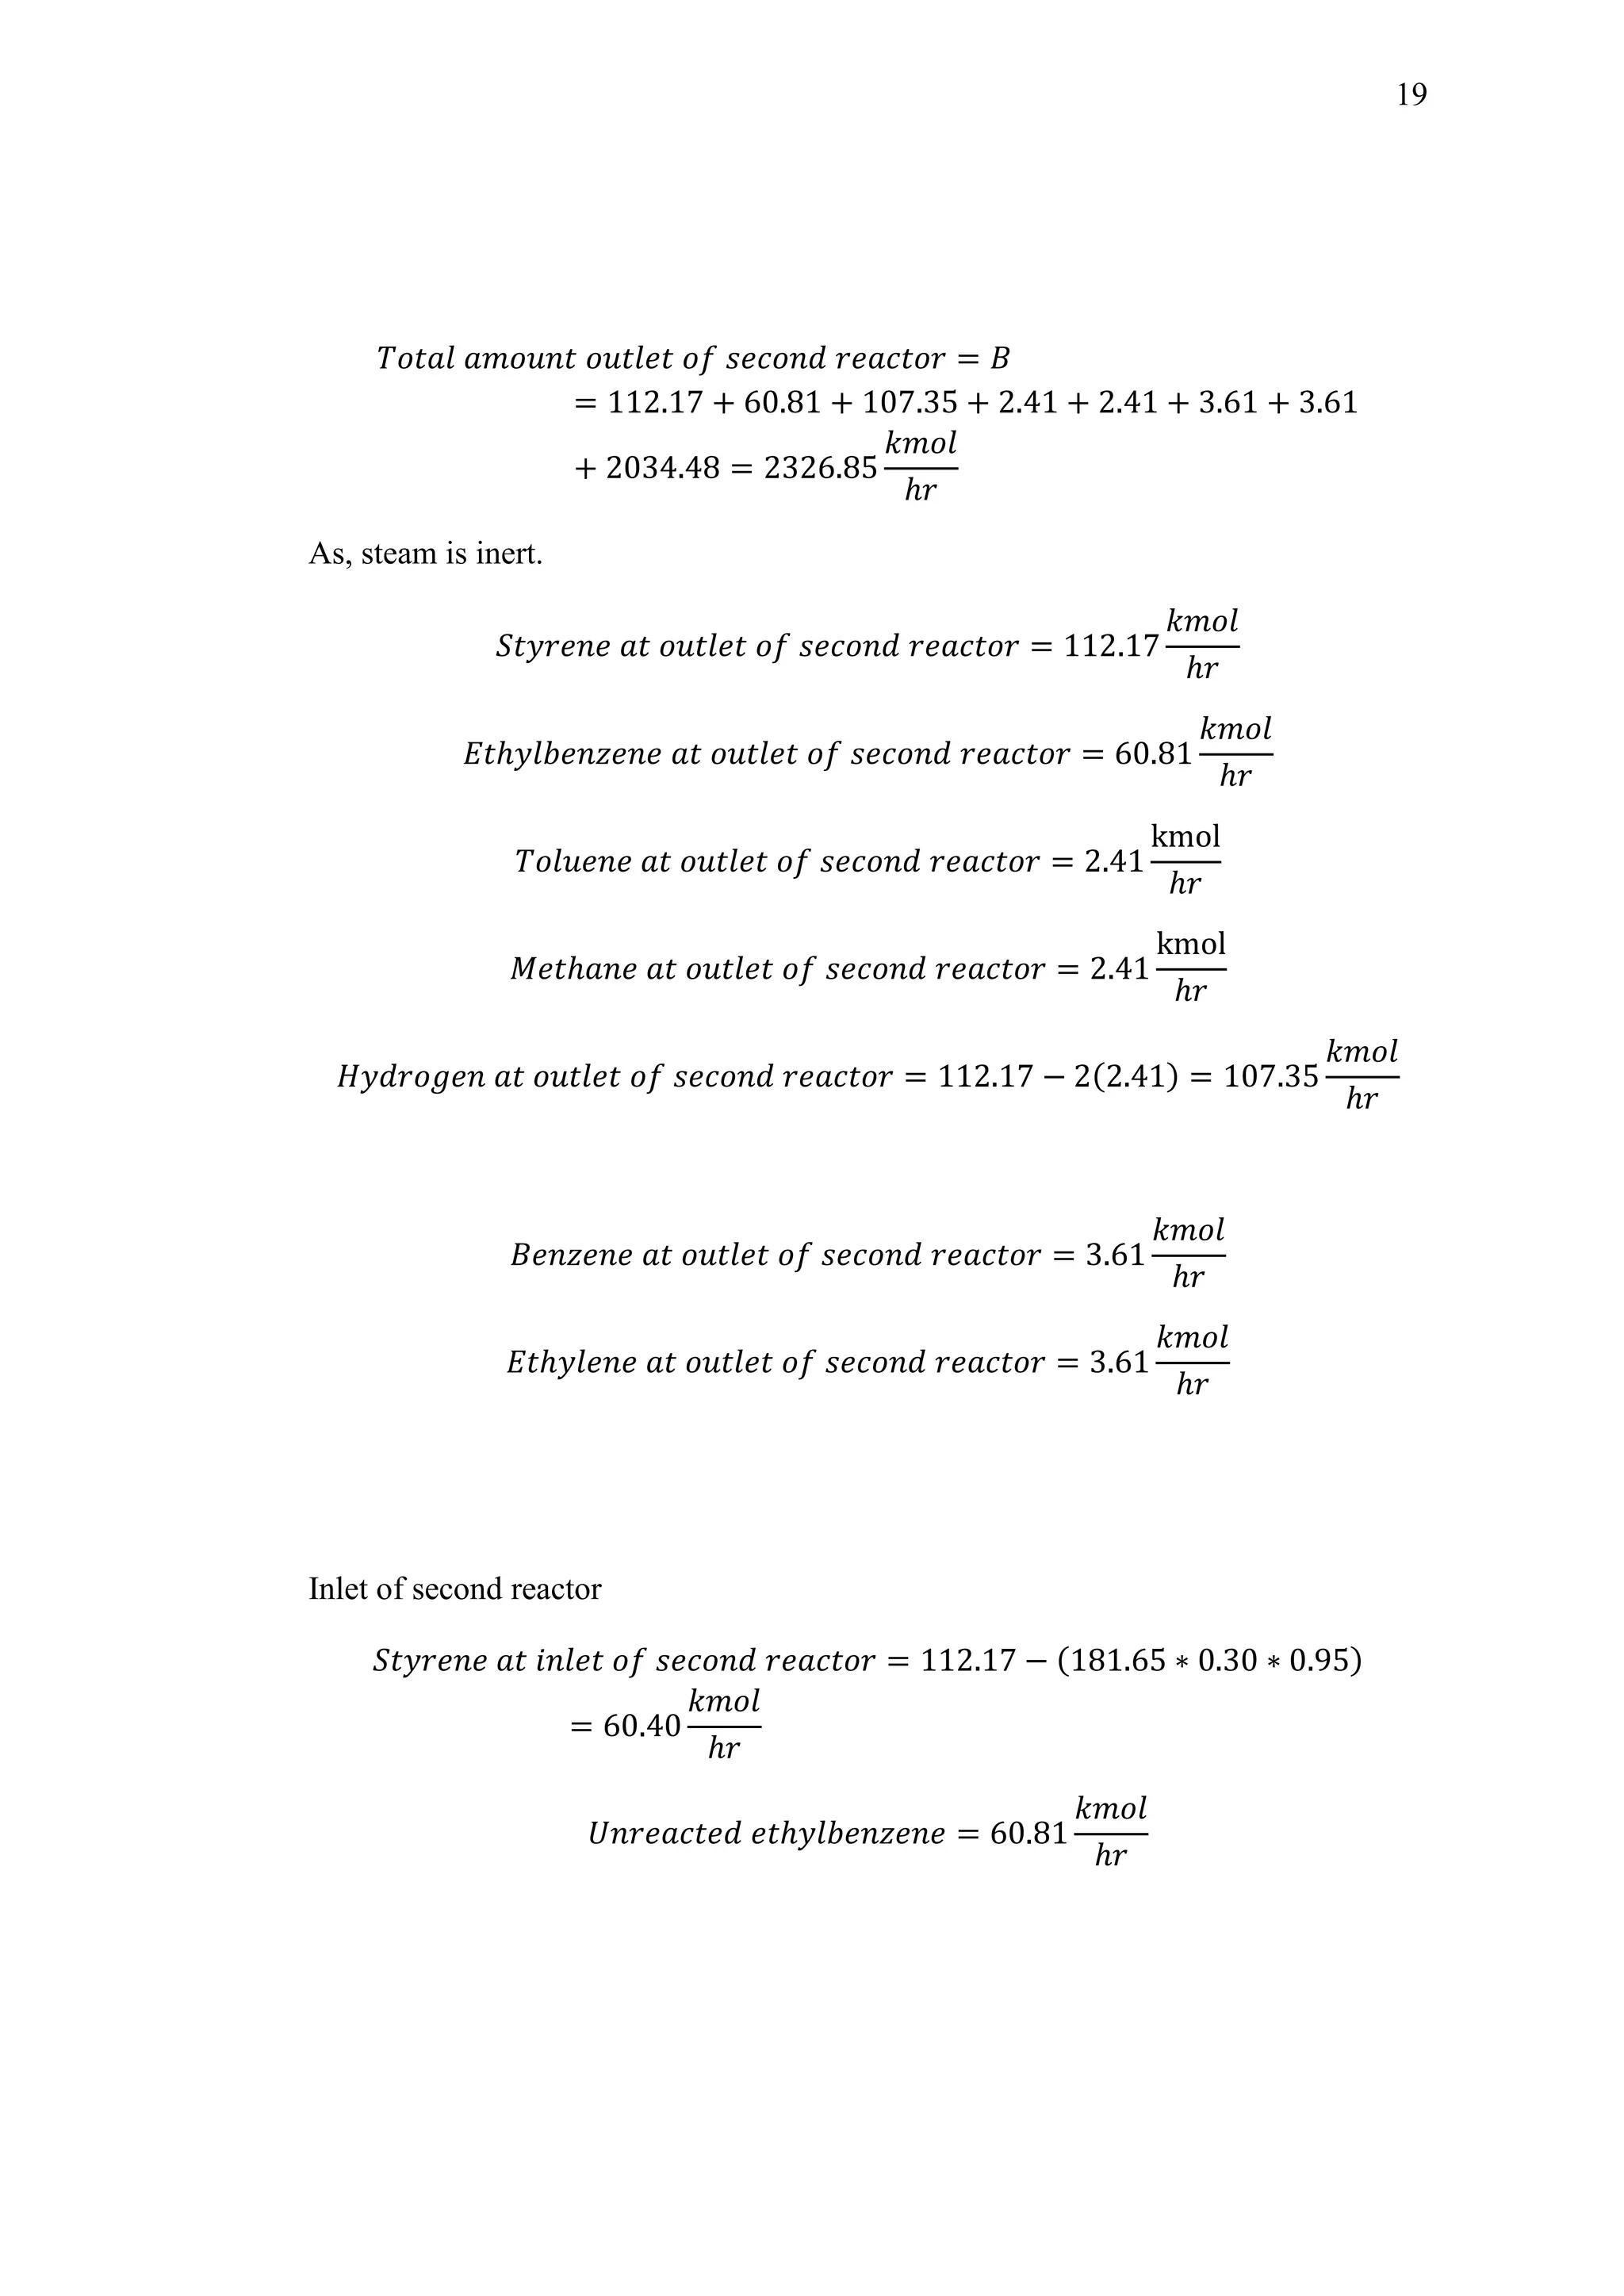
𝜃𝑖 = 1 + 1 − 1 = 1
𝛴𝜃𝑖 𝐶 𝑝 𝑖
= 𝐶 𝑝 𝐸𝐵+ 𝜃𝑠𝑡 𝐶 𝑝 𝑠𝑡
+ 𝜃 𝐻 𝐶 𝑝 𝐻
𝐶 𝑃 𝐸𝐵
= 299
𝐽
𝑚𝑜𝑙. 𝐾
𝐶 𝑃 𝑆𝑇
= 273
𝐽
𝑚𝑜𝑙. 𝐾
𝐶 𝑃 𝐻
= 30
𝐽
𝑚𝑜𝑙. 𝐾
Overall Rate Equation
−𝑟𝐸𝐵 = 𝑘𝑖[𝑃𝑇 𝑦 𝐸𝐵 − 𝑃𝑇
2 𝑦𝑆𝑇 𝑦 𝐻2
𝐾𝑝1
]
Now
𝑘 𝑝1 = 8.2 ∗ 106
∗ 𝑒(
−15200
𝑇
)
Where Kp1 is in bar.
And
𝑘𝑖 = 𝑒
[𝐴 𝑖−
−𝐸 𝑖
𝑅
(
1
𝑇 𝑅
)]
∗ 3600
Where
𝐴 = 0.851; 𝐸𝑖 = 90891
𝐽
𝑚𝑜𝑙
Putting rate equation in design equation
𝑊 = 𝐹𝐴𝑂 ∫
(7 + 𝑋)2
𝐾𝑝1 𝑑𝑋
𝑘𝑖 𝑃𝑇[(1 − 𝑋)(7 + 𝑋)𝐾𝑝1 − 𝑃𝑇 𝑋2]
𝑋1
𝑋0](https://image.slidesharecdn.com/productionofstyrene-190805163317/75/Production-of-styrene-61-2048.jpg)


![73
The value of Nm/N is determined based on Erbar-Maddox graph
𝑁 𝑚
𝑁
= 0.61
5.057
𝑁
= 0.61
And
𝑁 = 9.027
Efficiency of distillation column is 70%.
𝑁𝑎𝑐𝑡𝑢𝑎𝑙 =
𝑁
𝜂
=
9.027
0.7
= 12.89(𝟏𝟑 𝒑𝒍𝒂𝒕𝒆𝒔)
5.6.1 Column Diameter
The principal factor that determines the column diameter is the vapour flow-rate. The
vapour velocity is chose such that
Not allow high liquid entrainment
Gives less pressure drop
Souder’s and Brown equation can be used to estimate the maximum allowable
superficial vapour velocity and then column area and diameter.
𝑢 𝑣 = (−0.171 ∗ 𝑙 𝑡
2
+ 0.27 ∗ 𝑙 𝑡 − 0.047) [
(𝜌𝑙 − 𝜌 𝑣)
𝜌 𝑣
]
1/2
Where uv= maximum allowable vapour velocity, based on the total column cross-
sectional area
lt=plate spacing (range 0.5-1.5m).
Now](https://image.slidesharecdn.com/productionofstyrene-190805163317/75/Production-of-styrene-85-2048.jpg)
![74
Take plate spacing=0.5m
𝜌𝑙 = 903
𝑘𝑔
𝑚3
and
𝜌 𝑣 = 1.26
𝑘𝑔
𝑚3
𝑢 𝑣 = (−0.171 ∗ 0.52
+ 0.27 ∗ 0.5 − 0.047) [
(903 − 1.26)
1.26
]
1/2
= 1.21 𝑚/𝑠
Hence
𝐷𝑐 = √
4𝑉𝑤
𝜌 𝑣 ∗ 𝜋 ∗ 𝑢 𝑣
Vw=maximum vapor flow rate, kg/s.
𝐿 𝑛 = 𝑅 ∗ 𝐷 = 1.49738 ∗ 6.5288 = 9.77
𝐾𝑚𝑜𝑙
ℎ𝑟
𝑉𝑛 = 𝐿 𝑛 + 𝐷 = 9.77 + 6.5288 = 16.304
𝐾𝑚𝑜𝑙
ℎ𝑟
𝑉𝑚 = 𝑉𝑛 = 16.304
𝐾𝑚𝑜𝑙
ℎ𝑟
Total vapors=32.608 Kmol/hr.
𝑉𝑤 =
32.608
3600
= 0.009057
𝐾𝑚𝑜𝑙
𝑠
= 0.8611
𝐾𝑔
𝑠
So, diameter can be found by substituting values
𝐷𝑐 = √
4 ∗ 0.8611
1.26 ∗ 𝜋 ∗ 1.21
= 𝟎. 𝟖𝟒 𝒎
So, diameter of distillation column is 0.84.
Feed Location
Kirkbride has given an approximate method to estimate the feed-stage location.
𝑙𝑜𝑔
𝑁𝑟
𝑁𝑠
= 0.206log[(
𝑥 𝐻𝐹
𝑥 𝐿𝐹
) (
𝑊
𝐷
) (
𝑥 𝐿𝑊
𝑥 𝐻𝐷
)
2
]
Where](https://image.slidesharecdn.com/productionofstyrene-190805163317/75/Production-of-styrene-86-2048.jpg)
![75
Nr =number of stages above the feed, including any partial condenser
Ns= number of stages below the feed, including the reboiler
Putting values
𝑙𝑜𝑔
𝑁𝑟
𝑁𝑠
= 0.206 log [(
0.624
0.02
) (
169.54
6.5288
) (
0.00006
0.049
)
2
] = 0.6
𝑁𝑟
𝑁𝑠
= 3.981
𝑁𝑟 = 3.981𝑁𝑠
𝑇𝑜𝑡𝑎𝑙 𝑠𝑡𝑎𝑔𝑒𝑠 = 𝑁𝑟 + 𝑁𝑠 = 12.89
3.981𝑁𝑠 + 𝑁𝑠 = 12.89
𝑁𝑠 = 2.587
And
𝑁𝑟 = 10.303 So, feed is entered at third plate from below.](https://image.slidesharecdn.com/productionofstyrene-190805163317/75/Production-of-styrene-87-2048.jpg)


