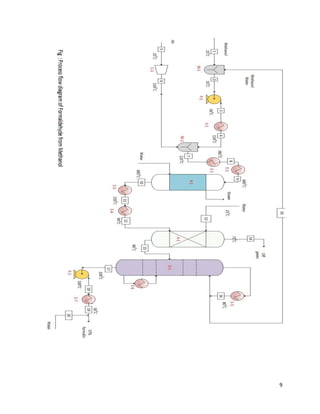
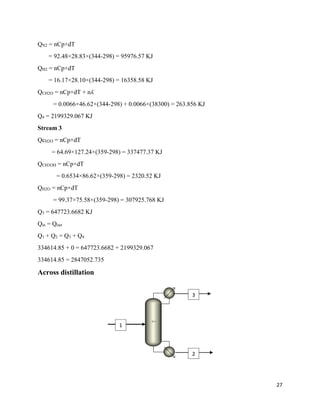
1. The document describes the production of formaldehyde via the silver catalytic process. Formaldehyde is produced from methanol using a silver catalyst at high temperatures.
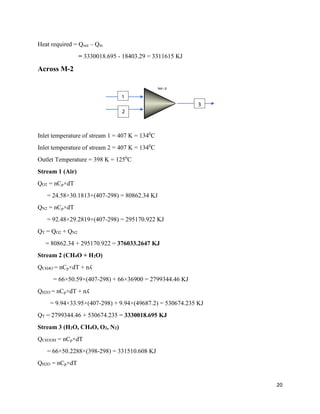
2. The reaction products are cooled and purified through absorption and distillation columns to separate the formaldehyde from unreacted methanol. Final products contain 37% formaldehyde solutions.
3. The silver catalytic process has advantages over alternative metal oxide processes in having lower costs, safer operations, higher yields, and more flexibility. Material and energy balances are required to design an optimal formaldehyde production process.

![10
CHAPTER # 4
MATERIAL BALANCE
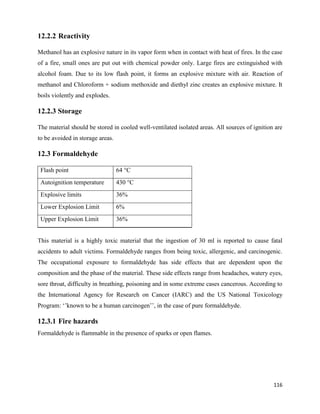
4.1 Material balance
Material balance is defined as the mass conserved; the mass entering in a process is
equal to mass exiting from the process. It is based on the law of conservation of mass which states
that mass is neither be created nor be destroyed.
4.2 Law conservation of mass
It states that:
[Rate of mass going into the system]-[Rate of mass going out of the system] +[Rate of mass
generation within the system]-[Rate of mass consumption within the system]=[Rate of mass
accumulation in the system]
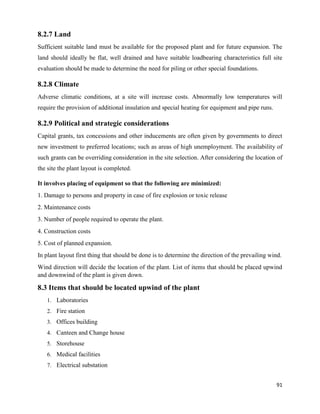
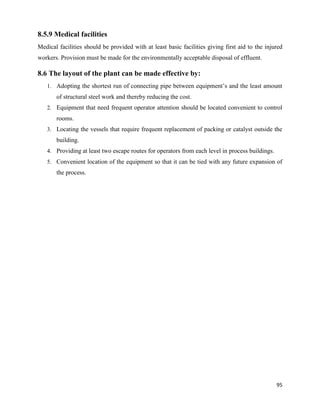
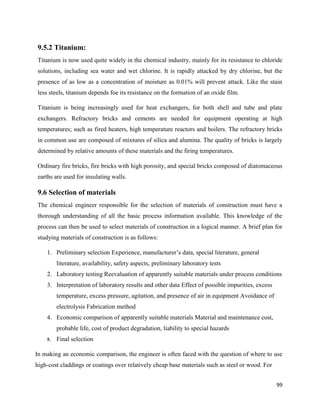
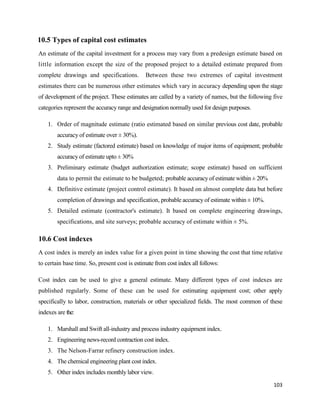
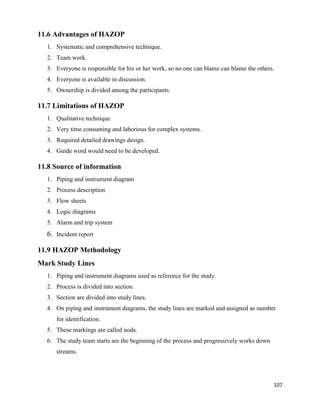
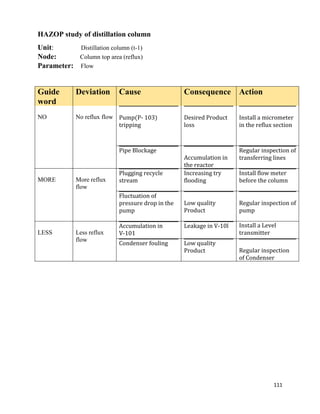
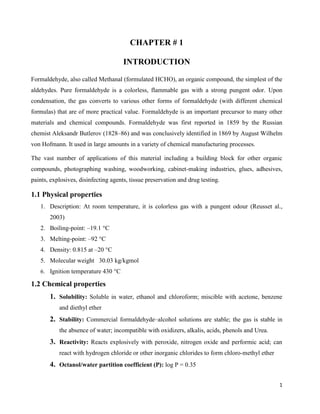
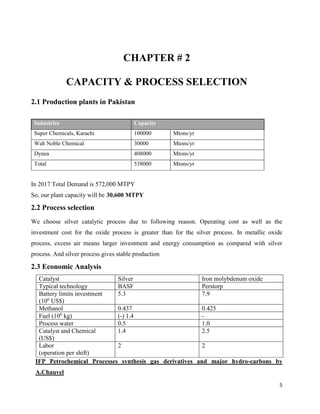
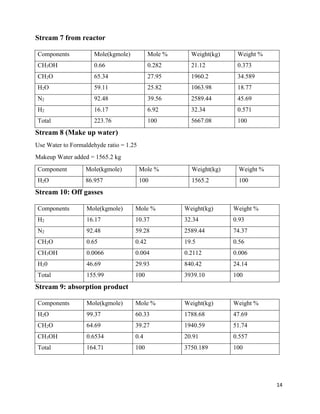
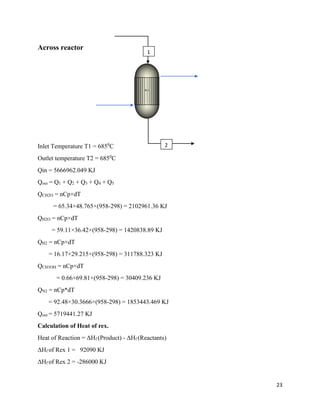
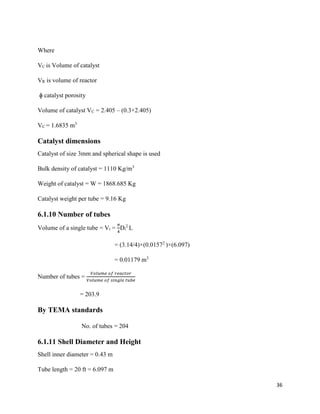
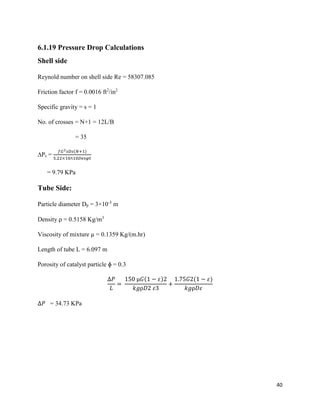
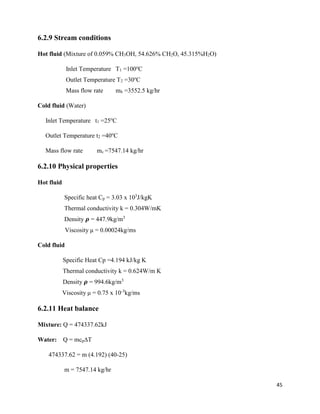
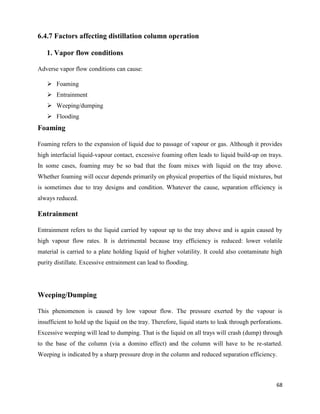
Across mixer 1
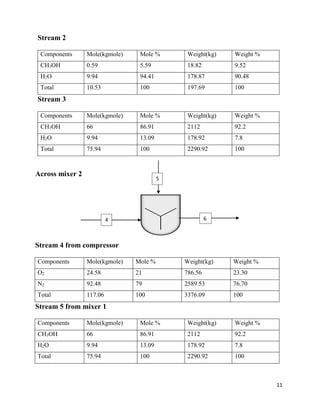
Stream 1
Component Mole(kgmole) Mole % Weight(kg) Weight %
CH3OH 65.41 100 2093.12 100
Total 65.41 100 2093.12 100
1
2
3](https://image.slidesharecdn.com/formaldehydefrommethanolandair-191231095217/85/Project-Formaldehyde-from-methanol-and-air-10-320.jpg)
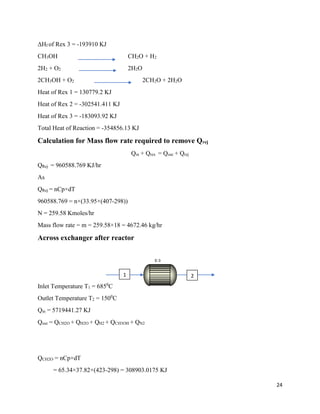
![17
CHAPTER # 5
ENERGY BALANCE
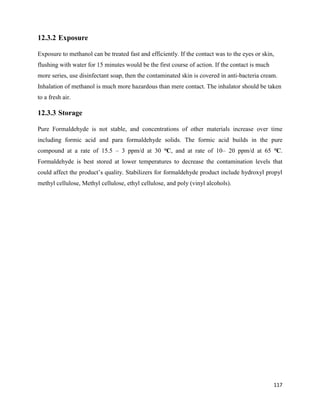
5.1 Introduction
Energy balance is defined as the energy conserved; the energy entering in a process is equal to
energy exiting from the process. It is based on the law of conservation of
energy that energy is neither be created nor be destroyed but it changes from one form to another.
5.2 Law of conservation of energy
It states that:
[Rate of energy going into the system]-[Rate of energy going out of the system] +[Rate of energy
generation within the system]-[Rate of energy consumption within the system]=[Rate of energy
accumulation in the system]
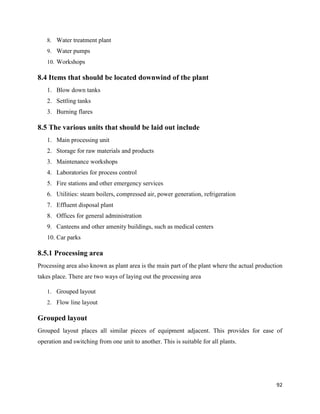
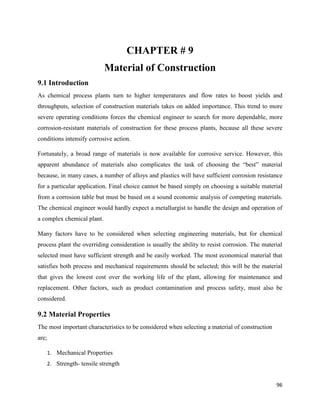
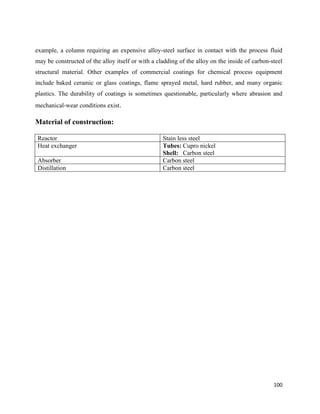
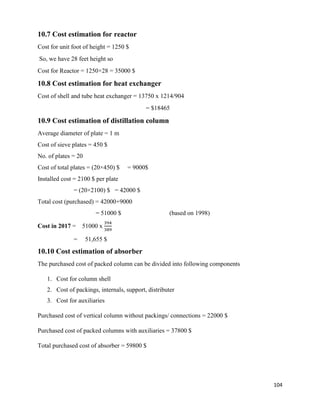
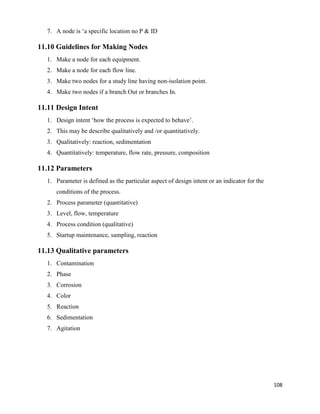
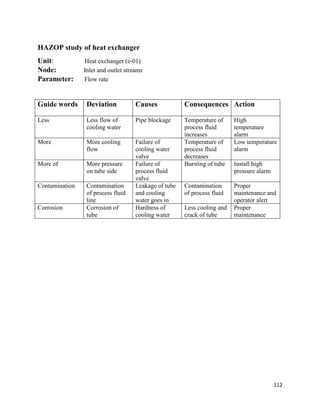
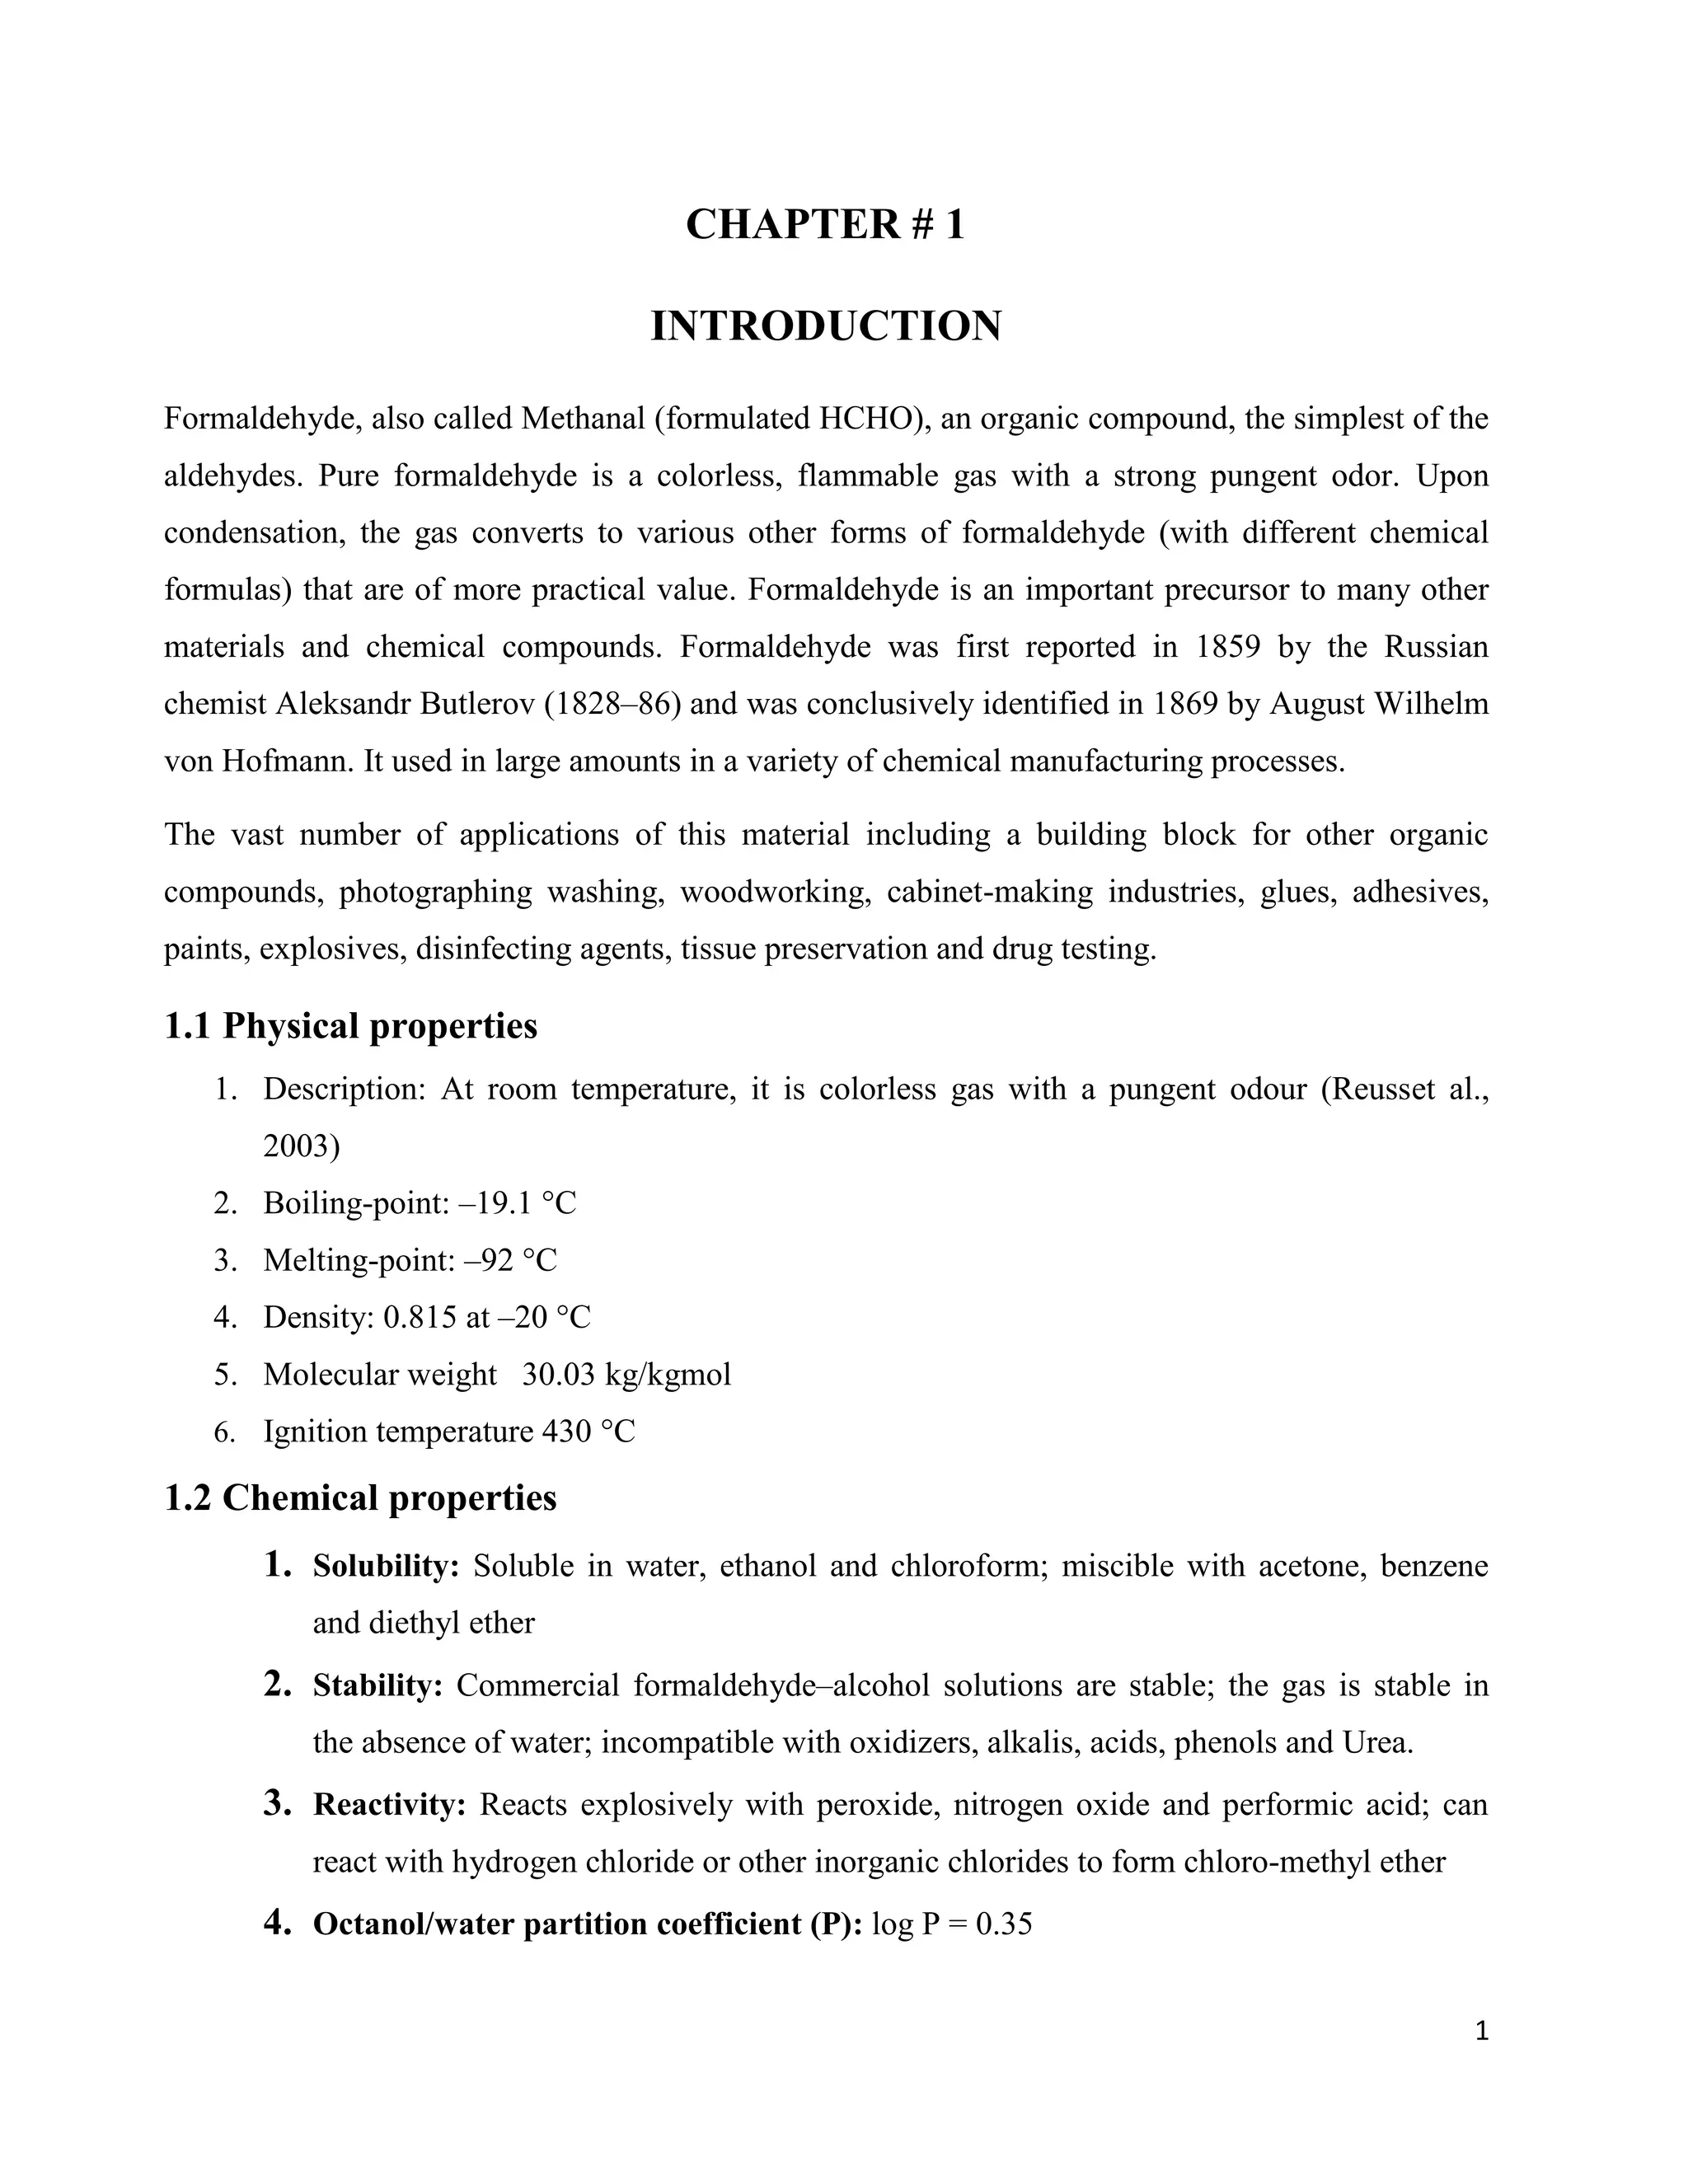
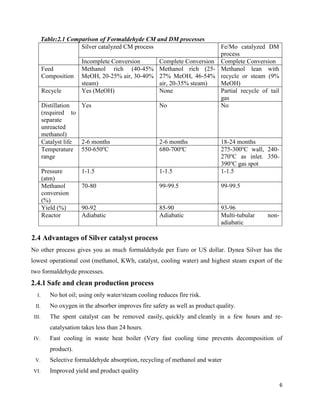
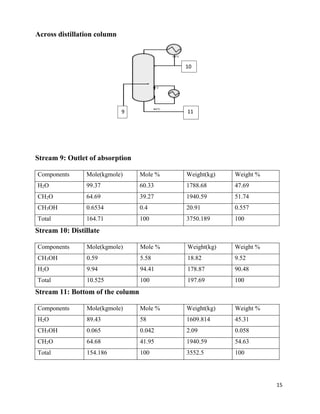
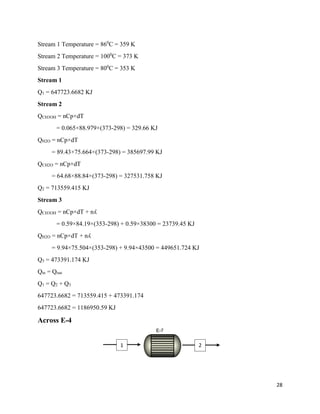
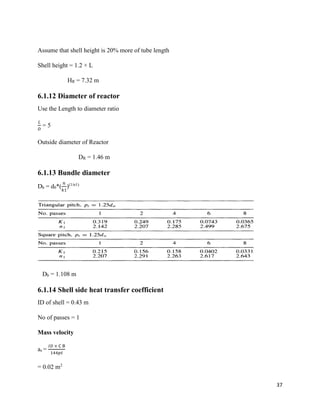
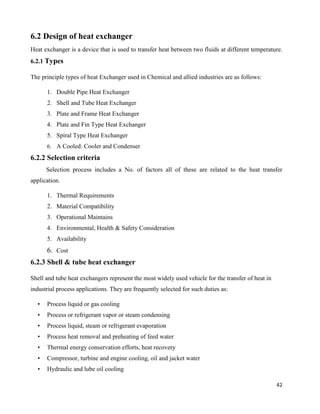
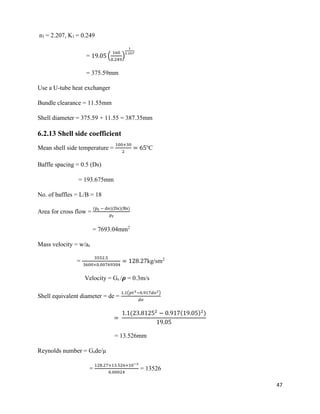
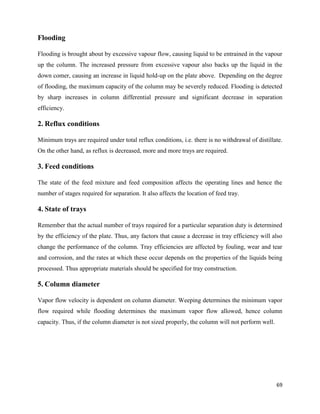
5.3 Reference condition
Condition for the calculations in energy balance is:
Temperature = 298 K
Constants Value for the Calculations of Heat Capacity of Gaseous Components.
Components A 103
B 106
C
CH3OH 13.431 -51.28 131.13
H2O 8.712 1.25 -0.18
CH2O 44.222 0.3986 -1.5358×10⁻³
O2 3.639 0.506 0
N2 3.280 0.593 0
H2 3.249 0.422 0
CH3OH(g) 2.211 12.216 -3.450
H2O(g) 3.470 1.450 0
CH2O(g) 2.264 7.022 -1.877
Cp = R[A+[B/2×(T0) ×(ῑ+1)] +[C/3×(T0
2)×(ῑ2+ῑ+1)]+[D/(ῑ×T0
2)]]
Where:
R = 8.314 J mol-1
K-1
ῑ = (T-T0)/T0
T0 = 298 K](https://image.slidesharecdn.com/formaldehydefrommethanolandair-191231095217/85/Project-Formaldehyde-from-methanol-and-air-17-320.jpg)
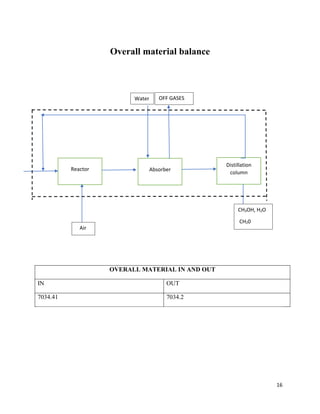
![31
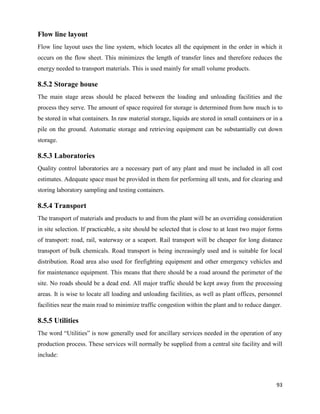
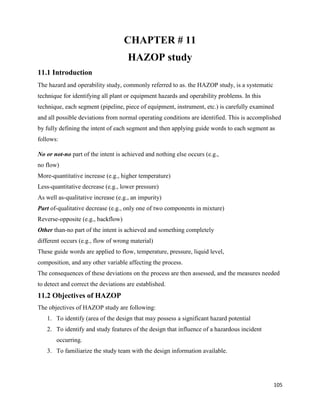
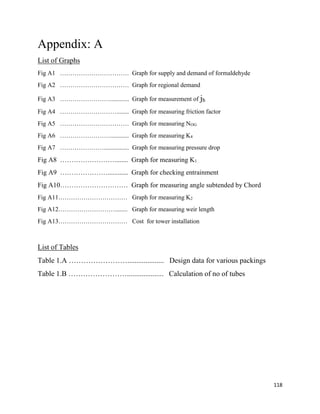
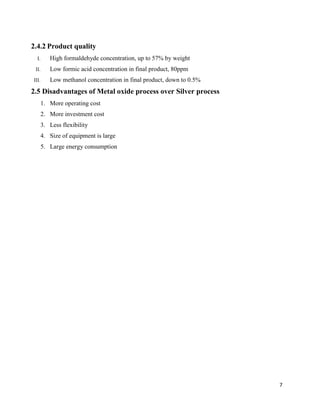
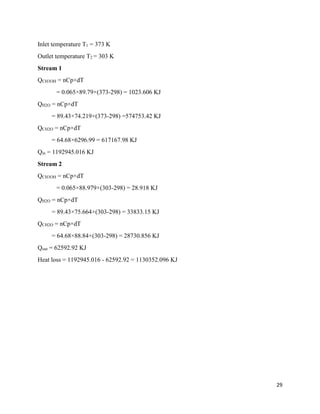
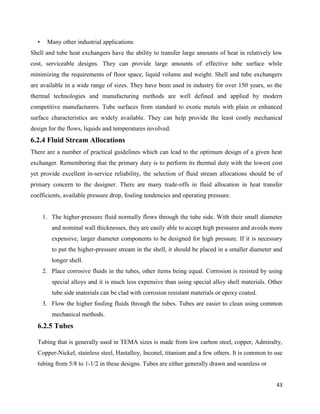
2. By following the change in some physical property of the fluid, such as the electrical
conductivity or refractive index.
3. By following the change in total pressure of a constant-volume system.
4. By following the change in volume of a constant-pressure system.
The experimental batch reactor is usually operated isothermally and at constant volume because
it is easy to interpret the results of such runs. This reactor is a relatively simple device adaptable
to small-scale laboratory set-ups, and it needs but little auxiliary equipment or instrumentation. [1]
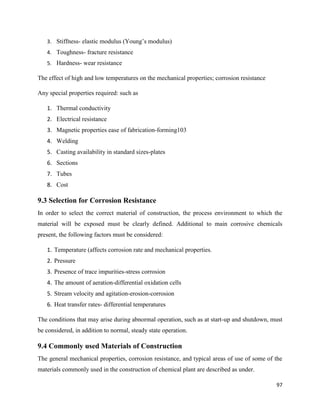
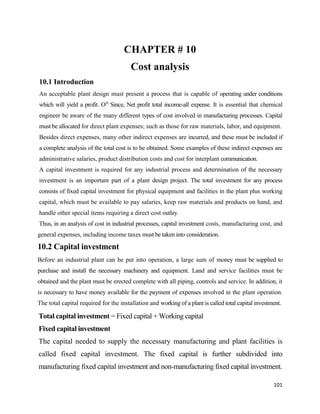
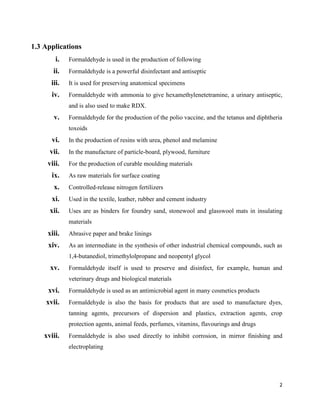
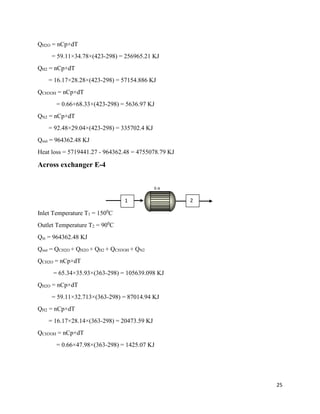
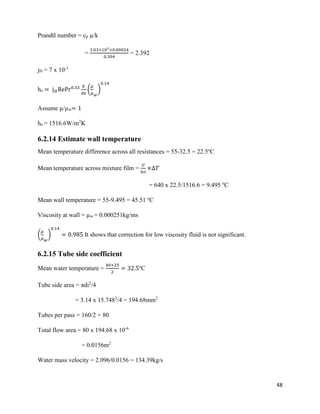
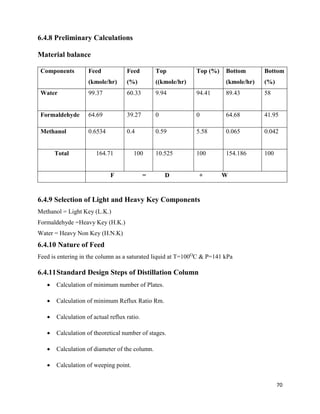
Continuous Reactor
The first of the two-ideal steady-state flow reactors is variously known as the
✓ Plug flow
✓ Slug flow
✓ Piston flow
✓ Ideal tubular, and
We refer to it as the plug flow reactor, or PFR, and to this pattern of flow as plug flow. It is
characterized by the fact that the flow of fluid through the reactor is orderly with no element of
fluid overtaking or mixing with any other element ahead or behind. The necessary and sufficient
condition for plug flow is for the residence time in the reactor to be the same for all elements of
fluid. The other ideal steady-state flow reactor is called the mixed reactor, the back-mix reactor,
the ideal stirred tank reactor, the C* (meaning C-star), CSTR, or the CFSTR (constant flow
stirred tank reactor), and, as its names suggest, it is a reactor in which the contents are well
stirred and uniform throughout. Thus, the exit stream from this reactor has the same composition
as the fluid within the reactor. [1]
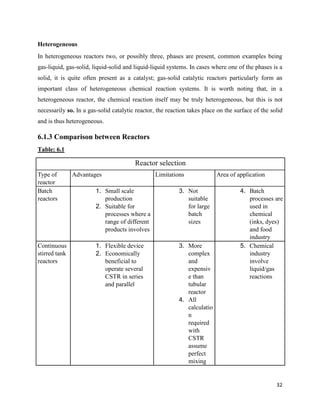
Homogeneous
In homogeneous reactors only one phase, usually a gas or a liquid, is present. If more than one
reactant is involved, provision must of course be made for mixing them together to form a
homogenous whole. Often, mixing the reactants is the way of starting off the reaction, although
sometimes the reactants are mixed and then brought to the required temperature.](https://image.slidesharecdn.com/formaldehydefrommethanolandair-191231095217/85/Project-Formaldehyde-from-methanol-and-air-31-320.jpg)

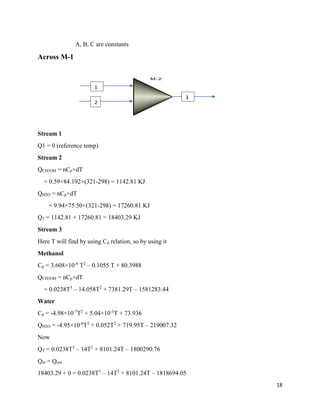
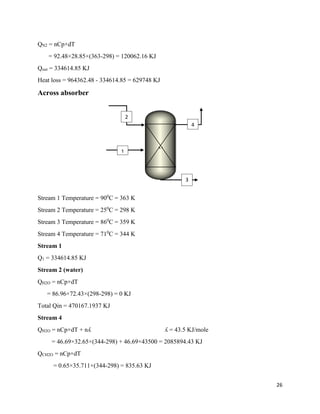
![46
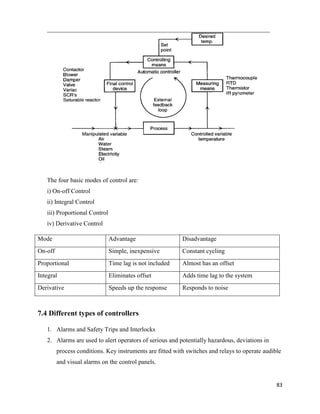
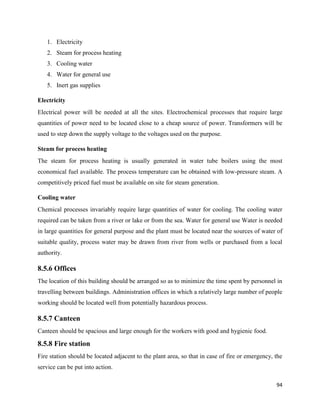
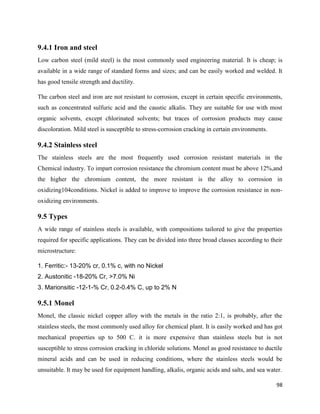
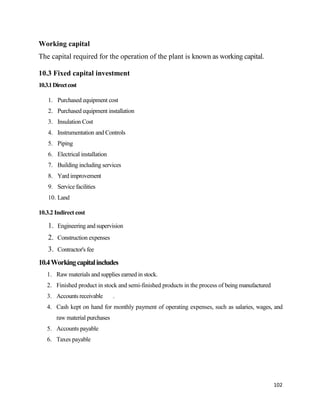
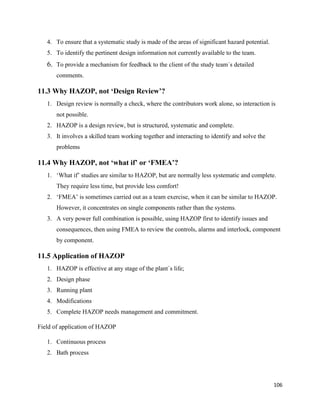
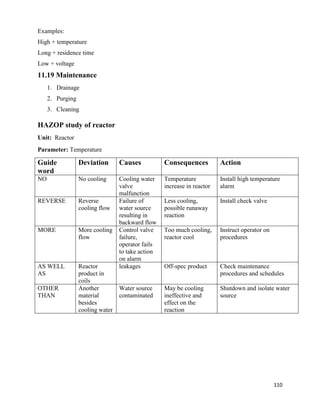
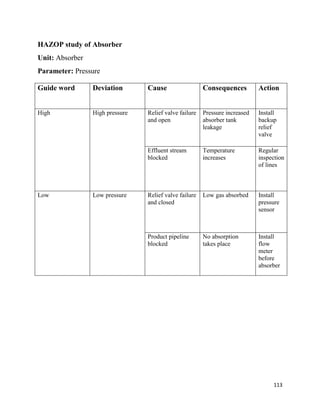
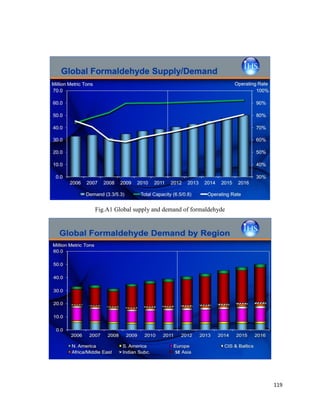
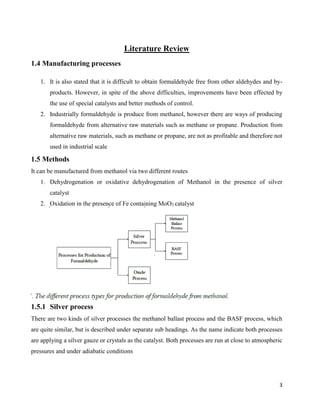
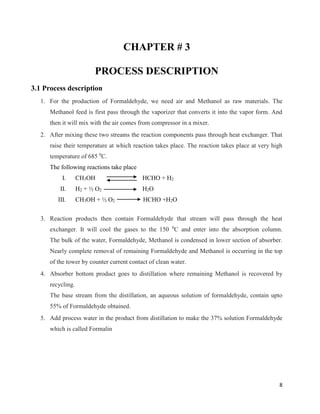
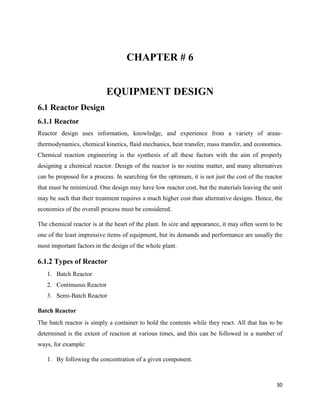
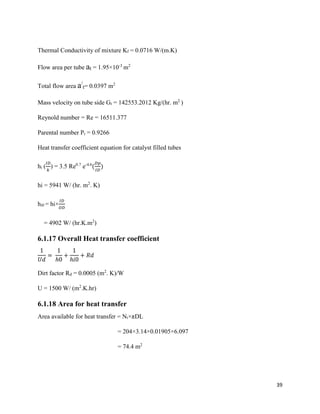
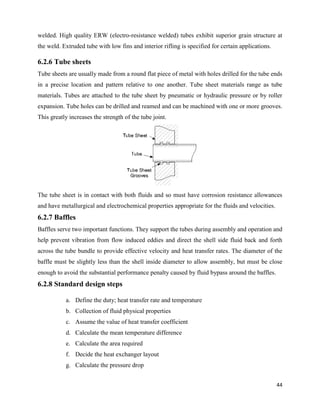
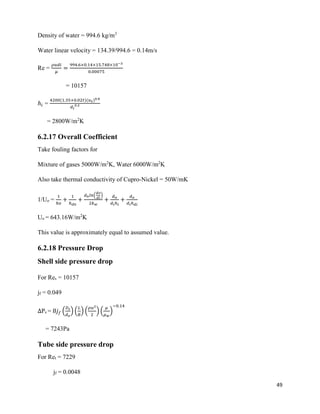
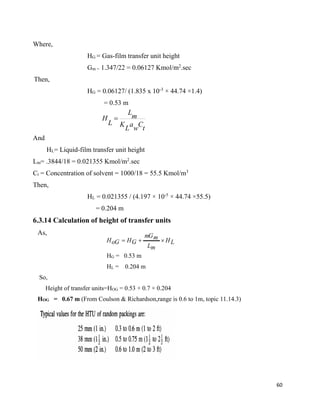
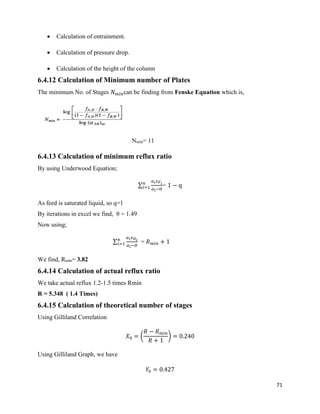
6.2.12 True temperature difference
Hot fluid Cold fluid Difference
100 Higher temperature 40 60
30 Lower temperature 25 5
70 Difference 15 55
LMTD =
∆t2−∆t1
ln
∆t2
∆t1
=
60−5
𝑙𝑛
60
5
= 17.39 o
C
R =
T1−𝑇2
𝑡2−𝑡1
= 3.47
S =
𝑡2−𝑡1
𝑇1−𝑡1
= 0.62
Ft =
√𝑅2+1ln(
1−𝑆
1−𝑅𝑆
)
(𝑅−1) ln[
2−𝑆(𝑅+1−√ 𝑅2+1)
2−𝑆(𝑅+1+√ 𝑅2+1)
]
= 0.76
∆t = LMTD x Ft
= 13.035o
C
Take U = 640W/m2
K
Area =
𝑄
𝑈∆𝑡
= 31.28m2
Choose 19.05mm o.d, 15.748mm i.d, 3.66m long tube, material: cupro-nickel
Area of one tube = πdol = 3.14 x 19.05 x 10-3
x 3.66
= 0.1955m2
Number of tubes = 31.28/0.1955 = 160
Tube pitch = 1.25do = 23.8125mm
Bundle diameter = 𝑑𝑜 (
𝑁𝑡
𝐾1
)
1
𝑛1](https://image.slidesharecdn.com/formaldehydefrommethanolandair-191231095217/85/Project-Formaldehyde-from-methanol-and-air-46-320.jpg)
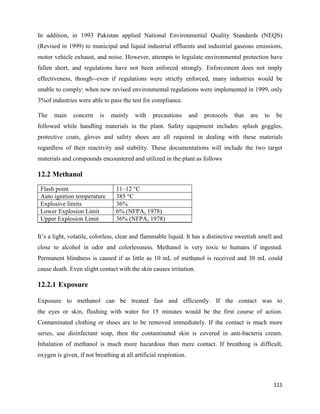
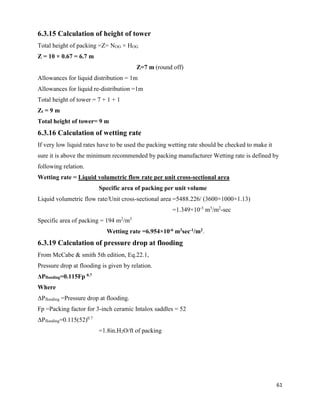
![57
m=0.2604
Gm/Lm=233.8234/86.956 = 2.6888
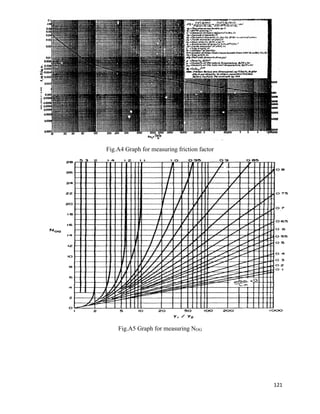
m Gm/Lm= 0.70
From graph
Area Under the curve= NOG=10
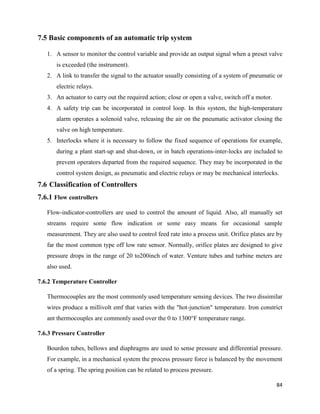
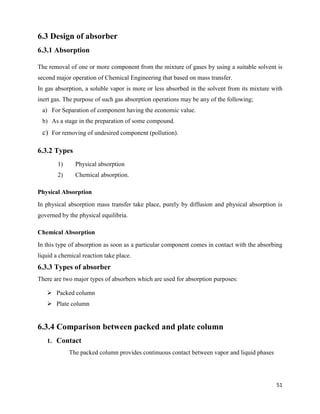
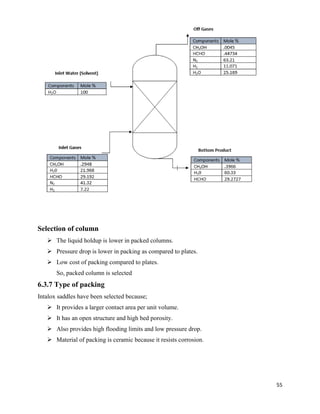
6.3.10 Calculation of Diameter of Column
Flow rate of entering gases =G =5488.226 Kg/hr
Flow rate of entering solvent=L= 1563.57 Kg/hr
Temperature of entering gas=Tg=90o
C =363K
Temperature of entering Solvent=TL=25o
C =298K
Pressure of entering gases=P= 1.4 atm
Average molecular weight of entering gases=22.01 Kg
Density of gas mixture=ρg = PM /RTg
= (1.4×22.01) / (0.08205×343)
=1.0937 Kg/m3
Density of liquid solvent at 25o
C=ρL=1000 Kg/m3
Viscosity of liquid solvent at 25o
C = µL =1/1000 Ns/m2
Viscosity of Gaseous mixture at 70o
C = µg = 1.5*10^-5 Ns/m2
Now
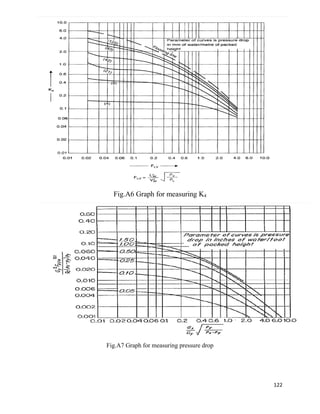
Abscissa of fig 11.44
= 0.02022
For pressure drop 20 mm of H2O /m of packing
K4 = 1
At flooding
K4’=6
% flooding = (K4/ K4’) 0.5
×100
=41.40%
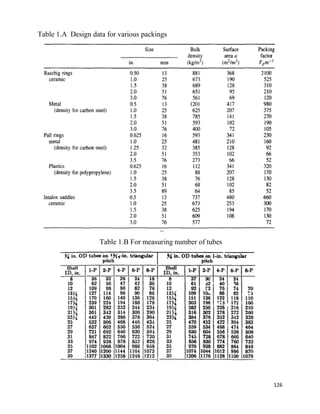
Packing factor for 1.5-inch ceramic Intalox - saddles =Fp=170/m
G* = [k4× ρg × (ρL-ρg) / 13.1×Fp× (µL /ρL) 0.1] ½
L
g
G
L](https://image.slidesharecdn.com/formaldehydefrommethanolandair-191231095217/85/Project-Formaldehyde-from-methanol-and-air-57-320.jpg)
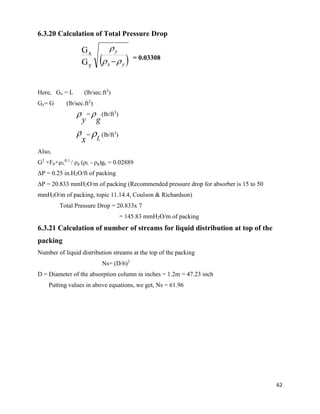
![58
G*= [1.2×1.0936× (1000-1.0936) /13.1×22× (1×10-3
/1000)0.1
]1/2
G*=1.53 Kg/m2
-sec.
Flow rate of gas entering =G =5488.226 /3600
=1.524 Kg/sec.
Area =A= G / G* =0.996 m2
Diameter of column=D= 4[A]½
[3.14] ½
Diameter of column= 1.13 m
Round off D’=1.2 m
then column area =A’=1.13 m2
Packing size to column D ratio = D’/38/1000 = 31.57
% flooding at selected diameter = 41.4(A/A’) = 36.47 %
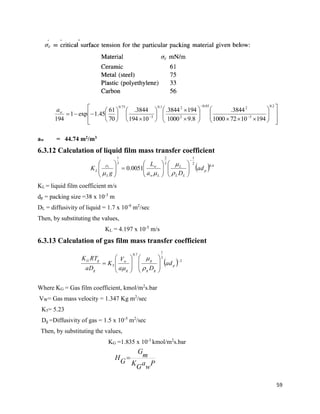
6.3.11 Calculation of Height of Transfer Units
Equation for calculation of effective interfacial area is given as.
Where
aw = effective interfacial area of packing per unit volume m2
/m3
Lw= liquid mass velocity kg/m2
s
a = actual area of packing per unit volume m2
/m3
σc = critical surface tension for particular packing material
σL = liquid surface tension N/m
a = 194 m2
/m3
Lw = 0.3844 kg/m2
s
σc = 61 x 10-3
N/m
σL = 72 x 10-3
N/m
µL=1 cP
ρL =1000Kg /m3
2.0205.0
2
21.075.0
45.1exp1
a
L
g
aL
a
L
a
a
LL
w
L
w
L
w
l
cw
](https://image.slidesharecdn.com/formaldehydefrommethanolandair-191231095217/85/Project-Formaldehyde-from-methanol-and-air-58-320.jpg)
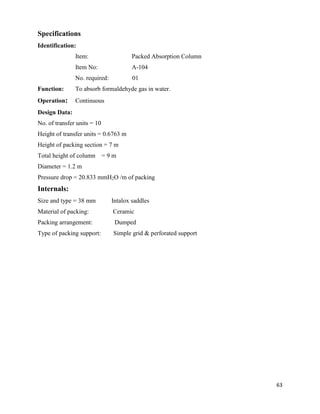
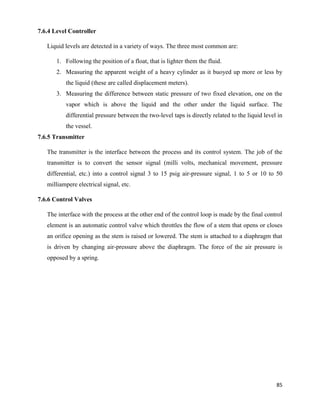
![72
𝑌0 = (
𝑁 − 𝑁 𝑚𝑖𝑛
𝑁 + 1
)
Ne = 20 Plates
6.4.16 Location of Feed Plate
Using Kirkbride Equation
𝑁 𝑅
𝑁𝑆
= ([
𝑋 𝐻𝐾
𝑋 𝐿𝐾
]
𝐹
[
𝐵
𝐷
] [
(𝑋 𝐿𝐾) 𝐵
(𝑋 𝐻𝐾) 𝐷
]
2
)
0.206
𝑁 𝑅
𝑁𝑆
= 3.49
And 𝑁 𝑅 + 𝑁𝑆 = 20( Excluding Reboiler)
So, NS = 5 NR = 15
Feed Plate =6th
plate from bottom, including reboiler.
6.4.17 Flow rates inside the column
For Rectifying Section
Ln = D × R =56.154Kgmol/hr
Vn = Ln + D = 66.679Kgmol/hr
For stripping section
Lm = Ln + F =56.154+164.71Kgmol/hr
Vm = Lm – W = 66.7Kgmol/hr
Let assume the100 mmH2O pressure drop per plate.
6.4.18 Densities at Top
ρ of the gas = 1.0294 kg/m3
ρ of liquid = 971 kg/m3
6.4.19 Densities at the bottom
ρ of the gas = 1.037 kg/m3](https://image.slidesharecdn.com/formaldehydefrommethanolandair-191231095217/85/Project-Formaldehyde-from-methanol-and-air-72-320.jpg)
![73
ρ of liquid = 970 kg/m3
Let assume the100 mmH2O pressure drop per plate.
Total column pressure drop = 100 x 10-3
x970x9.8x20
= 19012 Pa
Top pressure 1.1 atm = 111.4 x 10³ Pa
6.4.20 Estimated bottom pressure
= Top Pressure + Total column pressure drop
= 19012+111.4x103
= 130412 Pa
= 1.3 atm
6.4.21 Diameter of the column
Column Diameter = 𝐷 = √
4𝐴
𝜋
6.4.22 Flooding velocity
𝐹𝐿𝑉=
𝐿 𝑤
𝑉 𝑤
√
𝜌 𝑣
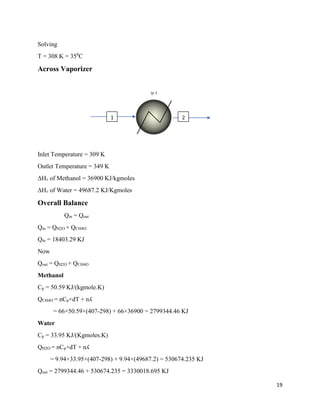
𝜌 𝐿
𝐹𝐿𝑉bottom =
220.86
66.68
√
1.037
970
= 0.0602 𝐹𝐿𝑉top=
56.154
66.7
√
1.0294
971
= 0.01467
Take plate spacing as 0.5 m
From Figure 11.27
base K1= 3 x 10⁻²
top K1 = 2.7 x 10⁻²
6.4.23 Correction for surface tensions
baseK1 =[Ϭ/0.02]0.2
x K1 = [0.06/0.02]0.02
x 3 x 10-2
= 3.1 x 10⁻²
topK1 =[Ϭ/0.02]0.2
x K1 = [0.08/0.02]0.02
x 2.7 x 10-2
= 3 x 10⁻²
6.4.24 flooding velocity
Base uf = K1 √
𝜌 𝑙−𝜌 𝑣
𝜌 𝑣
= 3.1 X 10⁻²
X √
970.21−0.3181
0.3181
= 1.65
Top uf=K1 √
𝜌 𝑙−𝜌 𝑣
𝜌 𝑣
= 3 X 10⁻²
X √
971.4−0.294
0.294
= 1.72
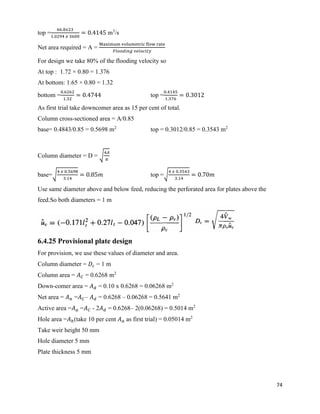
Maximum volumetric flow-rate =
𝐹𝑙𝑜𝑤 𝑟𝑎𝑡𝑒 𝑥 (𝑚𝑜𝑙𝑒𝑐𝑢𝑙𝑎𝑟 𝑚𝑎𝑠𝑠)𝑎𝑣𝑔
𝜌 𝑣 𝑥 3600
Base =
66.8𝑥35
1.037 𝑥 3600
= 0.6262 m3
/s](https://image.slidesharecdn.com/formaldehydefrommethanolandair-191231095217/85/Project-Formaldehyde-from-methanol-and-air-73-320.jpg)
![75
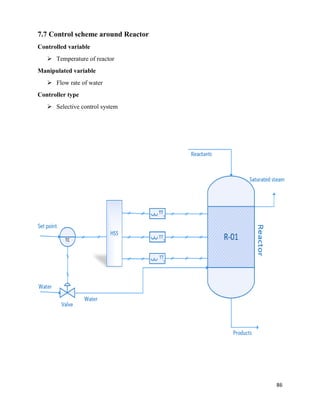
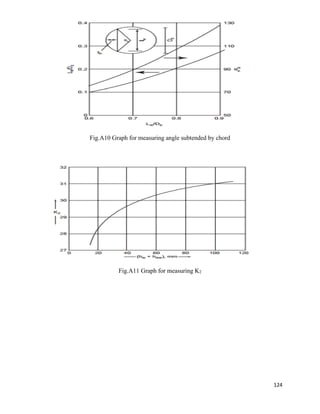
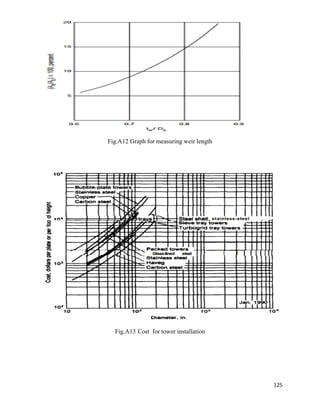
6.4.26 Weir Length
As we have,
𝐴 𝑑
𝐴 𝐶
𝑥 100 =
0.06268
0.6268
x 100 = 10%
From fig. 11.31,
𝑙 𝑤
𝐷𝑐
= 0.7
𝑙 𝑤 = 𝐷𝑐 𝑥 0.73 = 1 𝑥 0.73
𝑙 𝑤 = 0.73 𝑚
6.4.27 Weir Liquid Crest
Let, maximum liquid rate =
𝑙𝑖𝑞𝑢𝑖𝑑 𝑓𝑙𝑜𝑤 𝑟𝑎𝑡𝑒 𝑥 𝑚𝑜𝑙𝑒𝑐𝑢𝑙𝑎𝑟 𝑚𝑎𝑠𝑠
3600
=
220.86𝑥23
3600
= 1.411 m3
/s
Using equation
ℎ 𝑜𝑤 = 750 [
𝐿 𝑤
𝜌𝑙 𝑥 𝑙 𝑤
]
= 750 [
1.4
970𝑥0.73
]
ℎ 𝑜𝑤 = 11.81 𝑚𝑚𝑙𝑖𝑞
For minimum crest, its 70% is
ℎ 𝑜𝑤(min) = 0.70 𝑥 ℎ 𝑜𝑤 = 0.70 𝑥 11.81
= 8mmliq
Hence,
Min. Liquid Crest = ℎ 𝑜𝑤 + ℎ 𝑜𝑤(min)= 50 + 8= 58 mmliq](https://image.slidesharecdn.com/formaldehydefrommethanolandair-191231095217/85/Project-Formaldehyde-from-methanol-and-air-75-320.jpg)
![76
6.4.28 Weeping check
At minimum Liquid rate = ℎ 𝑜𝑤 + ℎ 𝑜𝑤(min) = 58 mm
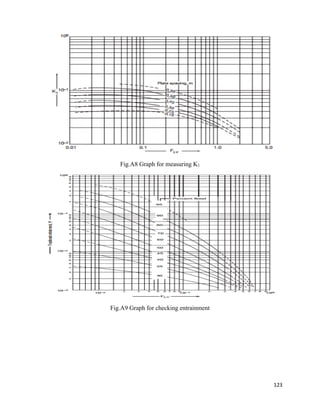
From Figure 11.30, K2= 30.3
Now, minimum design vapour velocity is given by:
𝑈 𝑚𝑖𝑛 =
𝐾2 − 0.90(25.4 − 𝑑ℎ)
(𝜌 𝑣)1/2
=
30.3 − 0.90(25.4 − 5)
(0.3186)1/2
= 6.78 m/s
And
𝐴𝑐𝑡𝑢𝑎𝑙 𝑚𝑖𝑛𝑖𝑚𝑢𝑚 𝑣𝑎𝑝𝑜𝑢𝑟 𝑣𝑒𝑙𝑜𝑐𝑖𝑡𝑦 =
min𝑖𝑚𝑢𝑚 𝑣𝑎𝑝𝑜𝑢𝑟 𝑟𝑎𝑡𝑒
𝐴ℎ
=
0.6262x0.70
0.05014
= 8.70 m/s (at 10% hole area)
Which is greater than minimum design vapour velocity. So minimum operating rate will be well
above weep point.
6.4.29 Entrainment-check
Actual velocity (based on net area) = Un =
𝑀𝑎𝑥. 𝑣𝑜𝑙𝑢𝑚𝑒𝑡𝑟𝑖𝑐 𝑓𝑙𝑜𝑤𝑟𝑎𝑡𝑒
𝑁𝑒𝑡 𝑎𝑟𝑒𝑎
=
0.6362
0.5641
= 1.13
Percentage flooding =
𝐴𝑐𝑡𝑢𝑎𝑙 𝑣𝑒𝑙𝑜𝑐𝑖𝑡𝑦 (𝑏𝑎𝑠𝑒𝑑 𝑜𝑛 𝑛𝑒𝑡 𝑎𝑟𝑒𝑎)
𝐹𝑙𝑜𝑜𝑑𝑖𝑛𝑔 𝑣𝑒𝑙𝑜𝑐𝑖𝑡𝑦
=
1.13
1.65
= 70 %
Also 𝐹𝑙𝑣(𝑏𝑜𝑡𝑡𝑜𝑚) = 0.0602
Ψ = 0.03 (Which is below 0.1). Hence, no Entrainment there.
[As a rough guide the upper limit of Ψ can be taken as 0.1; below this figure the effect on
efficiency will be small. The optimum design value may be above this figure, see Fair (1963).]](https://image.slidesharecdn.com/formaldehydefrommethanolandair-191231095217/85/Project-Formaldehyde-from-methanol-and-air-76-320.jpg)
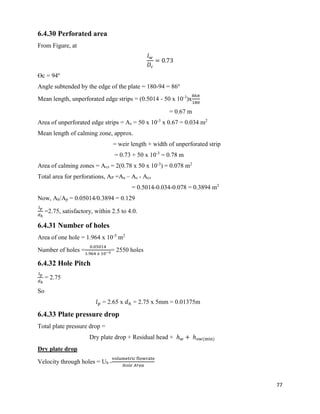
![78
=
0.6220
0.05014
= 12.4 𝑚/𝑠
At
Ah
Ap
= 0.12% and
plate thickness
𝐻𝑜𝑙𝑒 𝑑𝑖𝑎𝑚𝑒𝑡𝑒𝑟
=
5 𝑚𝑚
5 𝑚𝑚
= 1
From figure CO = 0.86
So,
ℎ 𝑑 = 51 [
𝑈ℎ
𝐶 𝑜
]
2
𝜌 𝑣
𝜌𝑙
= 51 [
12.4
0.86
]
2 0.3186
970
= 3.5 mmliq
6.4.34 Residual head
hr =
12.5 𝑥 103
𝜌 𝑣
= 13 mmliq
total plate pressure drops per plate = ℎ 𝑡= 3.5+13+(50+8) = 74 mm liq
= 0.074 m liq.
Less than 100mmliq (assumed) so acceptable.
Pressure drop per plate in terms of Pascal = ρgL = (𝜌 𝐿) ×g×(ℎ 𝑡)
ΔP = 970 x 9.8 x 0.074
= 0.7034 KPa
6.4.35 Total Pressure drop in the column
ΔPtot. = No. Of plates × ΔP
= 20x703 = 14060 Pa = 14 kPa
6.4.36 Down-comer liquid back-up
Back-up = hb =ℎ 𝑑𝑐 + ht+ ℎ 𝑤 + ℎ 𝑜𝑤(min)
6.4.37 Down-comer pressure loss (𝒉 𝒅𝒄)
Take hap =hw - 10 = 50 -10 = 40 mm.
Area under apron, Aap= hap (lw) = 0.73 x 40 x 10-3
= 0.0292 mm2
ℎ 𝑑𝑐 = 166 [
𝐿 𝑤
𝜌𝑙 𝑥 Aap
]
2
= 0.1102 mm
Down-comer Back-up = (50 + 8) + 74 + 0.1102 = 132mmliq
= 0.132mliq](https://image.slidesharecdn.com/formaldehydefrommethanolandair-191231095217/85/Project-Formaldehyde-from-methanol-and-air-78-320.jpg)