Process management seems more of an engineering tool to only be used in a manufacturing industry but it can be used effectively in management to map a process and discover problem areas (if any) or be used as a stimulus to improve the system. MIM students utilized the tool in dispatch testing to describe processes and analyze measurable parameters in the process. After thorough analysis of activities in two departments of Cementa Research AB (CRAB), chemical and physical departments, they discovered a few some areas which can be improved relative to delivery time.
Production of 66000 ton/year of Formaldehyde from Methanol using Silver catal...Engr Muhammad Zeeshan
Formaldehyde, the target product is an organic compound representing the most elementary configuration of the aldehydes. It behaves as a synthesis baseline for many other chemical compounds, including phenol formaldehyde, urea formaldehyde, melamine resin, Paints, and Glues. It is also used in medical field i.e. as a disinfectant and preservation of cell and tissues. The aim of this project is to reach 98% conversion of methanol using Silver Catalyst. Detailed calculations were performed in the report for all equipment in the plant including all expenses of the plant erection, taking into account the required process conditions to achieve a production capacity of 66000 ton/year of formaldehyde (as Formalin).
Programa MPR Master Planning of Resources – APICS CPIM
Objetivos:
A aChain é empresa APICS Channel Partner e realizará o curso de revisão do módulo MPR Master Planning of Resources .
No módulo MPR o participante será capaz de identificar, avaliar, desenvolver e melhorar os processos do S&OP – Sales and operations planning, forecasting, demand planning, distribution planning, replenishment e DRP Distribution Requirements Planning, aprenderá todos os detalhes do Master Schedule, MPS – Master Production Schedule, ATP – Available-To-Promise e FAS – Final Assembly Schedule. O curso foca em profundidade sobre todas as políticas, estratégias, objetivos e restrições de recursos no nível agregado (S&OP) e desagregado (MPS). O candidato ainda desenvolverá planos alinhados entre demanda e supply com a validação da capacidade.
Este módulo é fundamental para as áreas relacionadas com S&OP e demand planning.
Tópicos:
Session 1-Master Planning of Resources
Session 2-Forecasting Demand
Session 3-Demand Management and Customer Service
Session 4-Distribution Planning
Session 5-Sales and Operations Planning
Session 6-S&OP and Master Scheduling
Session 7-Managing the Master Schedule
Session 8-Case Studies
aChain - APICS - MPR conteúdo programático (http://www.achain.com.br/)
Giving and introduction to the site speed topic and talking about the limiting factors of site-speed, how site-speed can me measured and monitored, how site-speed can be connected to business metrics and finally about typical site speed optimizations.
LEAN OPERATIONS, Review the literature giving detailed examples of where within
industry Lean has been applied, the strategies followed when
implementing, the benefits achieved and whether there are any
lessons to be learned.
Process improvement using lean tool SMED, kaizan & spaghetti diagram to reduc...VishalPatelMEng
The target changeover time for each automated stamping line (progressive die stamping with 6 dies) is 40 minutes. The changeover is to be done by 2 operators. Team Leader will assist in changing/loading coils in the de-coiler.
Currently, the C/O process is taking 80-100 minutes on an average due to various factors. The target is to find the root causes, that is delaying the C/O process, considering C/O procedure, maintenance and set up issues, and come up with controls to reduce the delay in changeover process.
The cells need improvement in terms of 5S. The cells are not audited for 5S on a periodic basis. The cells don’t have work instruction/expectation visuals to keep their cells organized
The A-VAX Case Study involved the efforts of many individuals and would not have been made possible if it were not for the countless number of hours spent by the 5 participating companies (GlaxosmithKline, MedImmune, Merck, Pfizer, and sanofi pasteur).
The purpose of the paper is to improvise the six sigma process applied on the Wine making process using the TRIZ principles for the following problem.
The problem faced by the industry is that “Dry wines contain substances beneficial to human health; however, they cannot be given to children. The alcohol can be evaporated from the wine by boiling, but the high temperatures destroy the beneficial substances in the wine.”
Our approach to improve the process would be applying the 40 principles of TRIZ to the wine making process. The solution for the problem was found in the principles of physics using which used the concepts of pressure which are entirely outside the boundaries of wine making process.
2. Table of Contents
Executive Summary .......................................................................................................................... 2
1.0 Background ................................................................................................................ 3
2.0 Work Methodology .................................................................................................... 4
2.1 Methodology Used ............................................................................................................ 4
2.2 Cementa Research AB ....................................................................................................... 4
2.2.1 The Company ............................................................................................................. 4
2.2.2 Services Offered ......................................................................................................... 4
2.2.2.1 Product Control................................................................................................... 4
2.2.2.2 Product Development ......................................................................................... 4
2.2.2.3 Equipment and Machinery .................................................................................. 4
2.2.2.4 Process Development.......................................................................................... 4
2.2.2.5 Quality Control and Environmental Issues ......................................................... 5
3.0 Theory Used............................................................................................................... 6
3.1 Process ............................................................................................................................... 6
3.2 Process Classifications ....................................................................................................... 6
3.3 Process charting ................................................................................................................. 7
3.4 Flow chart .......................................................................................................................... 7
3.5 Six Sigma ........................................................................................................................... 8
4.0 Results ....................................................................................................................... 9
4.1 CEN and EN-197 ............................................................................................................... 9
4.2 Stakeholders ....................................................................................................................... 9
4.3 Process Descriptions .......................................................................................................... 9
4.3.1 Sample Registration ................................................................................................... 9
4.3.2 Testing ...................................................................................................................... 10
4.3.2.1 Physical Testing ................................................................................................ 10
4.3.2.2 Chemical Testing .............................................................................................. 10
4.3.3 Reporting .................................................................................................................. 10
4.4 Measurable Parameters .................................................................................................... 10
4.5 Other Information ............................................................................................................ 13
4.5.1 Management Processes............................................................................................. 13
4.5.2 Support Processes ..................................................................................................... 14
5.0 Proposal ................................................................................................................... 15
6.0 Reflections ............................................................................................................... 16
7.0 References ............................................................................................................... 17
Annex 1 .......................................................................................................................................... 18
Annex 1.1 ....................................................................................................................................... 19
-1-
3. Executive Summary
Process management seems more of an engineering tool to only be used in a manufacturing industry
but it can be used effectively in management to map a process and discover problem areas (if any) or
be used as a stimulus to improve the system. MIM students utilized the tool in dispatch testing to
describe processes and analyze measurable parameters in the process. After thorough analysis of
activities in two departments of Cementa Research AB (CRAB), chemical and physical departments,
they discovered a few some areas which can be improved relative to delivery time.
However, the project was undertaken at a very tricky period. Two events had overtaken CRAB that
have and will continue to have tremendous impact on their operations. One of them is the loss of
their major client, Maxit and the other one is the global economic recession. Thus, the workload has
been reduced and the pressure has disappeared.
-2-
4. 1.0 Background
MIM students studying Applied Process Management (APM) at Gotland University were
compulsorily commissioned to undertake a group project running simultaneously alongside APM
lectures. The overall aim was to marry theory with practical, divorce of which would produce half-
baked students out of this academic oven.
The specific area of focus was selected by the course instructor and the underlying tasks thereof.
Different groups were allocated to different organizations but all of them were charged with studying
a given process in the organization, preparing an overall process chart and proposing any
improvements that can be made.
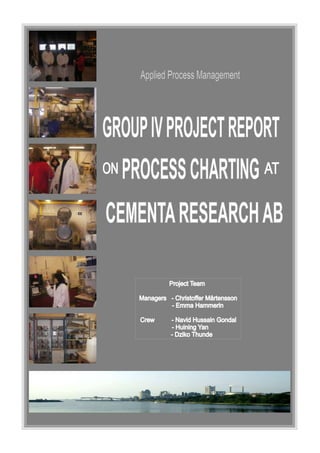
Group IV was appointed to undertake a process charting at Cementa Research AB. Group meetings
and company visits were made. Group members’ and team leaders’ knowledge, creativity,
experiences and tireless efforts in this project are conferred herein as a project report.
-3-
5. 2.0 Work Methodology
Here we describe the methodology that was used in undertaking the whole exercise.
2.1 Methodology Used
The project team (leaders and crew) held several meetings to plan for the project. The crew had to
revisit theory on process charting and dig out some information from the firm’s website prior to
visiting CRAB on 13th February 2009. During the visit, the team was shown the whole process and
then it was treated to a presentation about the process and the firm. Another visit was taken on 7th
March 2009, where the project crew gained in depth knowledge about the chemical and physical
analyses that are conducted. Consolidation concomitant to the visits and several team meetings have
given birth to this report.
2.2 Cementa Research AB1
2.2.1 The Company
This is a research company owned by Cementa AB which operates in Sweden under
Cementa Heidelberg Cement Group. It employs 45 people who work in five production
groups namely; chemical analyses, physical testing, cement investigation, cement premix and
software development. These production groups work in coordination with the MD,
Secretary and a Technical Department.
Cementa Research AB (CRAB) was accredited as a testing laboratory by Swedac (Swedish
Board for Technical Accreditation) for almost 150 testing methods. The company is situated
in Slite where it has a laboratory which is well equipped with modern facilities and
equipment which is used to undertake consultancy services, analyses and to bring new
knowledge into Heidelberg Cement.
2.2.2 Services Offered
Though its main activities are in mineral based materials, it goes over and above this. It
works with fuels, drinking water and waste water; environmental analyses, measurements,
environmental audits and development of environment management system of a company.
The Slite laboratory is equipped to undertake organic and inorganic chemistry functions as
well as physical testing. Its competence revolves around microbiology, theology and indoor
environment.
In mineral based building materials it has four main activities namely; product control,
product development, quality and environmental techniques and improvements in the
processing industry.
2.2.2.1 Product Control
In product control area, they use different methods or standards to control the
quality of cement and concrete.
-4-
6. 2.2.2.2 Product Development
Product development ensures quality of cement and concrete with respect to
different dimensions like durability of building materials, the mixing quantity of
different materials etc. Product development contributes in continuous
development towards better and more specialized products and it enhances the
competitive capability of the cement plant and helps in increasing its demand as
compared to its substitutes.
2.2.2.3 Quality Control and Environmental Issues
In quality and environment, Cementa AB runs different quality projects in the
field of cement and concrete production. It helps its customers in building quality
systems for certification and it also performs some type of quality audits.
2.2.2.4 Process Development
Leveraging on experienced employees, in process development, it performs
different comprehensive consultancies. It helps in improving products or
productivity to make the production more economical.
2.2.2.5 Equipment and Machinery
Cementa Research AB uses a lot of equipment in the following categories;
chemical analyses, particle size distribution and surface area measurement,
microstructure, cement testing equipment, concrete testing equipment, coal
testing, air and gas analyses, climate equipment and computer system.
It also produces quality handbooks, quality documents which are adjusted time
and again to guide and help them in offering their services to customers.
-5-
7. 3.0 Theory Used
The theory on which the project was based is discussed below.
3.1 Process
Process originate from the ‘processus’ and ‘procedere’ which are all Latin words which
mean ‘advancement’ or ‘move ahead’. 2 The concept of process can be applied in various
aspects or fields but in this project, the concept is narrowed to management. Hence, it is
defined as a set of activities with a specified beginning and end, which, using the resources of
an organization, repeatedly adds value to a measurable object from a supplier to a
predetermined measurable result to a customer.3
Interface
Supplier Process Customer/Stakeholder
Input Output
Value-adding
Resources
Figure 3.1.1 Process Diagram (From Bergman, B. & Klefjö, B. 2007)
3.2 Process Classifications
Processes can be distinguished by their aims. Using this classification, three types of
processes are realized, main, support and management processes.
Main processes are core processes, whose tasks are geared towards satisfying the external
customers’ needs, creating value for them and improving the products delivered by the
organization. Support processes are these are feeder processes because they feed resources
into the main process. Management processes are determinant processes in that they set
targets, devise strategies and work out improvements in the other processes in the
organization. In a process there are both internal and external customers. The internal
customers are the recipients of the output of the other departments which use them as
primary inputs in their activities while external customers are those that are outside the
organization and they are usually the ones that matter a lot because all the departments and
-6-
8. the main process using the organizational resources like information and energy work to
serve and satisfy their needs.3
3.3 Process charting
Process charting is a graphical method of showing an array of steps through which input is
converted to output. A process chart defines ownership, customer and boundaries. It helps in
finding control points, in this way it easy to establish measurements and show results.
Different process models can be used by any organization as a way of identifying
performance measurements and examining the process in detail to identify areas of possible
improvements. Proposed organizational system model, proposed basic process model, and
generic process model are commonly used for process measurements.
Main process
Activity A Activity B Activity C Activity D
B1 B2 B3
B3a B3b B3c
Figure 3.3.1 Process Diagram (From Bergman, B. & Klefjö, B. 2007)
3.4 Flow chart
A flow chart is a series of activities that are connected to one another sequentially determined
by appropriate decisions that are required to proceed to them. It can be used to find the
process improvements in detail. Flow charts are useful diagrams showing the steps of a
process clearly and how processes work. It is easy to understand the whole process step-by-
step. The organization can find what really happens next in the process; what the next step is;
what errors and wastes occur and where the process should be improved from start to the
end. Excellent flow charts show us every important detail of main process, sub process,
activities, and work tasks clearly.
Y Y
Start If Activity If Activity Stop
N
Y Y
No Activity Activity Activity
N
Stop
-7-
9. Figure 3.4.1 Flow chart (Adapted from the Applied Process Management lecture of
20-01-2009 at Gotland University)
3.5 Six Sigma
The essence of survival of a firm lie in the satisfaction and retention of customers. Customer
satisfaction is the duty of the overall company not just of the marketing department. The
marketing department can be the overall overseer of meeting a standards of customer
satisfaction. Customer seek consistency. They are loyal to a firm that offer a consistent
product or service. Six sigma is one of the tools that can be used to measure variations in
various processes that lie in the path of adding value to an input all the way to delivering an
output into the hands of a customer. Variations in processes are definitely affect the quality
of the product and will eventually be passed on to the customer.
Six Sigma was originally developed by Motorola in the 1980s as a quality improvement tool.
Basically it was used to reduce the number of defects and unwanted variations in the
organizational process. Six Sigma provides a systematic methodology to process
improvement. When companies are using this the Six Sigma approach to quality
improvement, “process flow” and “standard” are the most important concepts. They aim to
achieve the possible and necessary improvements. The steps that are followed in this
approach are abridged to DMAIC which stands for Define Measure Analyse Improve and
Control. DMAIC can be easily understood in a numerical layout as below: 9
- Define high-level project goals, and the current process
- Measure key aspects of the current process and collect relevant data.
- Analyze the data to verify cause-and-effect relationships. Determine what the
relationships are, and attempt to ensure that all factors have been considered.
- Improve or optimize the process based upon data analysis using techniques like Design of
experiments.
- Control to ensure that any deviations from target are corrected before they result in
defects. Set up pilot runs to establish process capability, move on to production, set up
control mechanisms and continuously monitor the process.”
-8-
10. 4.0 Results
The findings of the project follow hereinafter.
4.1 CEN and EN-197
Cement is a hydraulic binder. It is finely ground inorganic material that forms a paste when
mixed with water. The paste sets and hardens by means of hydration reactions and processes
but after hardening, it retains its strength and stability even under water. 1 Sweden is a
member of CEN (Comité Européen de Normalisation) which European Committee for
Standardization. CEN members are bound to comply to EN 197-1 which is the European
Standard about composition, specifications and conformity criteria for common cements. 4
Cement has to conform to EN 197-1 in mechanical, physical, chemical and durability
requirements. Mechanical requirements entail standard and early strength while physical
requirements focus on initial setting time and soundness. Chemical requirements revolve
around composition of the in terms of elements like hydrochloric acid, sodium carbonate,
sulfate and chloride while durability looks at the cements ability in terms of frost resistance,
chemical resistance and protection of reinforcement.5
Therefore, to check this conformity, cement has to be tested, hence the existence of Cementa
Research AB.
4.2 Stakeholders
The stakeholders or clients that benefit from this process or organisation are Cementa Slite
Plant and Cementa Marketing Department. The process is called dispatch testing meaning
that they get a sample from the lot that is going to be dispatched and test it. Apart from
controlling quality of final product, (thus physical and chemical properties) and ensuring
SPC, this process is also undertaken to maintain product database for Cementa and Cementa
customers.6
The process for checking conformity has never been mapped so mapping process
descriptions and showing process ownership will be an improvement and so will be
shortening delivery time so that it is shorter or good enough for the customer. 7
4.3 Process Descriptions8
4.3.1 Sample Registration
Sample registration sometimes starts with homogenization or ends with
homogenization. It just depends on the officer; he can homogenize it first or do
the other steps first and lastly homogenize it. Depending on what choice he has
made, he goes to mark the container of the sample and then check what test is
required from a check sheet. Previously, they did not have to check the kind of
test needed because for every sample, they were doing the full test, but now, due
to an economic slump, they have to choose which sample has to go through a full
test or a reduced test or just a physical test. He records the sample details into a
table and record more details about the sample in the computer. After this, an air
tight, sealable small storage bag is marked and some amount of the sample is put
-9-
11. in the bag and stored in a wooden box ready for collection by the chemical
department.
4.3.2 Testing
4.3.2.1 Physical Testing
Physical testing is performed in the physical department. They take part of the
sample from the dispatched container and mix it with either water or sand or just
use it the way it is. After the physical test, they record the results on a sheet of
paper and then transfer them to the computer.
4.3.2.2 Chemical Testing
When the sample details are recorded in the computer, it registers in the chemistry
department computers that there is a new sample which needs to be analyzed.
They get the sample from the physical department and check in the computer
what kind of test (thus, either full or reduced) is supposed to be performed on this
particular sample. They later do a chemical homogenization as a way of preparing
the sample and then they do a Spectra ICP Test, and then Chrome analyses. After
these, they get the preliminary results and match those results with the standards.
If the results are out of limit of the standards, then, they redo the test. Otherwise,
they enter the results in the computer using LIMS (Laboratory Information
Systems).
4.3.3 Reporting
When the results are entered into the LIMS, they are checked by the Cement
Investigation Department. If they are within the required parameters, they are
released and published to the server so that the client can access them online.
(For a complete illustration of the above processes, please refer to Annex 1)
4.4 Measurable Parameters
The only measurable parameter which can be used as a basis for improvement is delivery
time, thus, the time taken from receiving the sample to releasing the report to the client. The
chemical and physical department activities were followed closely to determine the delivery
time.
To start with, there is delivery time is set by the client. That is to say, the client put a
reasonable demand as to when they want the results. To follow this parameter correctly and
to analyze the activities deeply, Cementa AB Marketing department will be used as the only
client. Cementa AB can bring a sample that has to be analyzed and be reported on and it
specifies a delivery time.
Basically, this is what will be involved to reach that end:
1. Sample Registration
a. The sample container is marked with the sample number (continuation of numbers
derived from a LIMS)
- 10 -
12. b. The sample is taken for homogenization: Here the container is put on a machine which
rotates together with the sample container and continually shaking the contents inside
for 30 minutes.
c. A sheet of paper is checked to see what kind of test is supposed to be done on this
sample and then the sample details are recorded on the same sheet
d. The sample details are recorded into LIMS
e. Activities b, c and d can take approximately five minutes, thus, thirty-five minutes
together with activity b. However, the reader should note that the sample is not put in a
homogenizer and the officer stands there for thirty minutes waiting for it. He continues
with other tasks.
f. A sealable, air-tight A6 plastic bag is marked with the sample details and two
tablespoonfuls of the sample are placed into this bag and put into a box ready to be
collected by the physical department.
2. Physical Testing
Several physical tests can be performed on this sample but the priority ones include
a. Fann: Here a part of the sample is mixed with water to make slurry and the slurry is
tested for its thickness using a Viscometer. The resistance recorded on this machine is
the thickness. This figure is recorded immediately on a sheet of paper to be transferred
later to the computer. This takes approximately one and a half hours.
b. Vicat vatten (setting time): Here, part of the sample is mixed with water to form slurry
and then put in water and a needle from a gadget comes and pierces into this slurry at
intervals set by the officer. It continues to jab into this slurry until it cannot sink into it
more than 22 mm. This may take from 20 to 180 minutes.
c. Laser: Here less that a teaspoonful of the sample is taken and spread on a microscope
like machine which calculates the size of the particles of the cement. This takes less
than 30 minutes.
d. Blaine is a different form of a laser analysis
e. Determination of strength: Here, part of the sample is mixed with sand in a machine for
30 minutes. From the ‘mixer’ it is spread into a ‘molder’ which is placed into a
machine which lifts it every 2.5 seconds. After fifteen minutes, it is removed and the
brick(s) formed are placed in a moist chamber for one day and removed the following
day. After removing the brick, depending on the type of analysis, it is subjected to
further tests. For example, if it is 1 day strength, it is immediately taken to a machine
that crushes it. If it is 2 days strength, then it is placed in water for two days and after
that is crushed. If is a 28 days strength, it is placed in water for 28 days and then
removed and crushed.
The results for each test are recorded on a paper first then transferred into LIMS. Thus,
when a test is completed, the results can go into LIMS immediately, subject to how busy
the officer is. The department is manned by two officers and occasional assistance from
one staff from chemical department.
3. Chemical Testing
a. Collection of sample: When the sample details are recorded n LIMS, it registers in the
chemical department that they is a sample which need some attention in the physical
department. An officer from chemical department collects the sample and checks in
LIMS what kind of chemical test is supposed to be performed on this particular sample.
b. Chemical Homogenization: The sample is then chemically homogenized. This activity
prepares the sample particles to be in ready for chemical tests (its particles should be
consistently distributed per cubic millimeter).
c. Spectra ICP Test
- 11 -
13. d. Chrome Analysis
e. Preliminary results: The findings of the two tests are recorded as preliminary results.
f. Matching: The results are matched with standard. If they are out of limit of the
standard, they redo the test. If they are within the limit, they are then reported to
Cement Investigation Department.
4. Reporting: The Cement Investigation Department takes the results that are within the
limits and published them to the server so that are accessible by client.
Therefore, we can deduce that the delivery time will be affected mainly by the availability of
staff to do the tests and record the tests in time. Before the economic slowdown and before
losing one of their big clients, Maxit, the two departments were so much constrained to
deliver results on time because they were busy attending to other samples.
For Cement Investigation to report the results, all the required tests should be done and
recorded in LIMS. If the physical department is still busy with other samples, the chemical
department would have finished performing the required analyses on this sample and only
waiting for the chemical department to do their part or vice versa. Given the capacity of the
work last year, the two departments were understaffed to cope to the pressure and deliver in
time. In this period of recession and having lost one major client, they can cope and deliver
on time. The chemical department is considered overstaffed and will probably be a victim of
the impending job cuts in CRAB.
To explore delivery time further, let us look at a set of activities that are undertaken in
Physical Department to determine the strength of a sample of cement.
Determination of strength: 1 day strength (Refer to Annex 1.1)
a) Receiving sample
- Sample sent from Cementa AB is received in the Physical Department of Cementa
Research AB
b) Homogenization
- Sample is homogenized. It is taken to another room and put on a homogenizer (a
machine where the sample is tied with a belt and rotates up and down).
Homogenization helps to the sample particles to be consistent. This takes
approximately 30 minutes.
c) Registering sample on paper
- The sample after being returned to Physical Department is registered on a sheet of
paper
d) Registering sample in computer
- Then sample information is recorded in the computer
e) Picking up sample from container
- Some of the sample is picked up from the container
f) Weighing sample
- It is placed on a weight to until it reaches a maximum of 1.2 kg
g) Picking up packet of sand
- A packet of sand weighing 1 kg is taken from a box
h) Mixing up sample with sand
- 1.2kg of the sample is mixed with 1kg of the sand and some water in a ‘mixing
machine’. This takes approximately 30 minutes
i) Putting mixture in a ‘molder’
- 12 -
14. - The 2.2kg mixture is put in a ‘molder’ with two spaces
j) Putting mixture in ‘setting machine’
- The ‘molder’ is put in a ‘setting machine’ to eliminate any air spaces in the mixture
k) Putting bricks in ‘moisture chamber’
- The set mixture forms two bricks in the ‘molder’ which is place in a ‘moisture
chamber’ for 24 hours.
l) Removing bricks
- After 24 hours, the bricks is removed from the ‘moisture chamber’ and from the
‘molder’
m) Crushing bricks
- Both bricks are crushed by a ‘crushing machine’
n) Recording results on paper
- The force used to crush them is what the machine reads as the strength of the brick. The
reading on the machine is recorded on paper
o) Recording results in computer
- The reading on paper is recorded into the computer
p) Results at CID
- When the results are entered into the computer, Cement Investigation Department gets
them immediately since they are on a network of computers.
q) Communicating results to customer
- Cement Investigation Department publishes them on the server for the client to be able
to access them
From the above progression of activities, it can be seen that there are several factors that can
affect delivery time. These are:
a. Ownership of process
- Previously, the processes were mapped. This could affect the department in that it may
not be clear who should do what and work may lie waiting without staff taking the
responsibility, thus, causing unnecessary delays in delivery time (delivering results to
customer).
b. Number of available machines
- There is only one homogenizer, one ‘mixing machine’, one ‘setting machine’, one
scale. Even though they have technicians to repair them when they breakdown,
machine downtime can affect delivery time. If they have a high capacity, they cannot
do more than one sample at a time, like mixing two sets of samples at the same time,
they have to wait for over 30 minutes.
c. Number of staff
- The number of staff in the Physical Department on paper is six but, physically, they are
only two. In times of high capacity, they cannot cope and even though they are helped
by staff from Chemical Department, both departments are strained of staff during peak
periods resulting in extended delivery times. In an event that these two people are
simultaneously absent and the trained staff in the Chemical Department who helps then
is on vacation, the work in this department would grind to a halt.
4.5 Other Information
4.5.1 Management Processes
- 13 -
15. The company has five departments namely; Chemical, Physical, Cement
Investigation, Concrete Pre-mix and Software and is headed by a Managing
Director. Currently, they have 339 projects in which all the 43 members of staff
are involved. Dispatch testing running is one of the ongoing projects which can
just be termed as process. The chemical department has twelve people while the
physical department has six but from the analysis, six seems to the figure on the
organizational chart while the reality is that they are only two.
4.5.2 Support Processes
The two departments are supported by the technical and by finance and
administration staff. The goals and main decisions for these departments are from
management. They are also assisted in reporting to clients by the Cement
Investigation department.
- 14 -
16. 5.0 Proposal
From this study, we can make the following recommendations or proposals for improvement
in the Physical Department and even the Chemical Department.
1. It is necessary to map all or most of the important processes, activities and tasks of each
test that is carried out in the two departments. This would eliminate the waiting or delay
points and establish process ownership.
2. Train more people in Chemical Department to be able to assist the Physical Department
in times of pressure and times of emergency.
- 15 -
17. 6.0 Reflections
The acquisition of theory is the first step in the learning process. If the process ends here,
then the leaning process is not complete. Applying the theory learned is a fundamental part of
the learning because this where the assumptions are questioned and knowledge grounded in
one’s mind. The application of the theories of process management and six sigma in real life
situation were a reality check to the learning process and a reminder that knowledge once
acquired have to be adapted to the situations being faced. It cannot be used raw.
However, time was a great limitation factor in this study. Only two visits were made to the
factory. All of them on Fridays, one in the afternoon where it was not possible to observing
the processes happening since some of the staff had already left. It was a great disadvantage
because, being the first time, a lot of knowledge could have been acquired seeing the actors
of the processes in play. Therefore, the knowledge acquired was like scattered pieces of a jiq
saw puzzle. The second visit helped to put these pieces to form a clearer picture. But if there
was more time accorded to this project, more knowledge and application would have
resulted.
- 16 -
18. 7.0 References (both written and verbal)
1. http://www.cementaresearch.se (09-02-2009)
2. Bergman, B. & Klefjö, B. (2007) Quality from customer needs to customer satisfaction,
Studentlitteratur, Lund
3. Bergman, B. & Klefjö, B. (2007) Quality from customer needs to customer satisfaction,
Studentlitteratur, Lund
4. European Standards of Cement, EN 197-1:2000 (June 200)
5. European Standards of Cement, EN 197-1:2000 (June 200)
6. Patrick Thalin, presentation at Cementa Research on 13-02-2009 and discussions on 06-03-
2009
7. Patrick Thalin, presentation at Cementa Research on 13-02-2009 and discussions on 06-03-
2009
8. Ann-Kristin Askegren at Cementa Research on 13-02-2009
9. Bergman, B. & Klefjö, B. (2007) Quality from customer needs to customer satisfaction,
Studentlitteratur, Lund
- 17 -
19. Sample
INPUT Testing Reporting
Registration
Getting Results
Homogenization Decision LIMS
For Test
Chemical
Mark samples Physical
Testing Testing
Result recording
Check test type Recieving sample
Receiving sample
required Reporting to
customer
Record sample Testing Chemical
details on sheet Homogenization
OUTPUT
Record sample on Results recording Spectra ICP testing
computer on chart
Sample bags Results recording Chrome analysis
tagging in computer
Results comparison
Filling sample bags with standards
No Yes
Reporting
Putting in box Decision
Out of Within
limit limit
Annex 1 - Process Diagram (adapted from the descriptions given at CRAB and from the knowledge gained from APM lectures at Gotland University in February and March 2009)
20. Annex 1.1 – Sub Process Diagram (adapted from the descriptions given at CRAB and from the knowledge gained from APM lectures at Gotland University in February and March 2009)
(W indicates potential waiting /delay points)