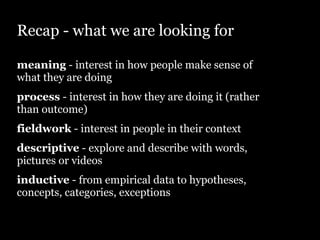
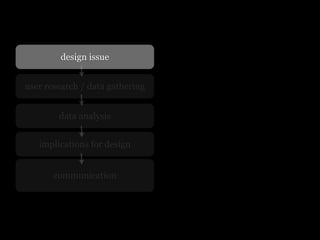
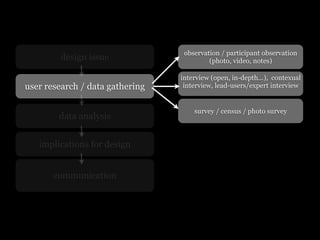
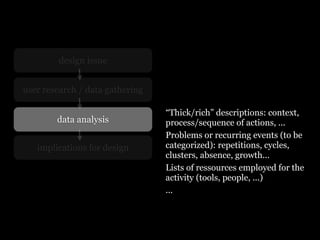
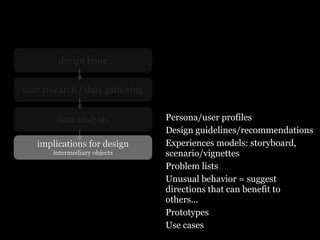
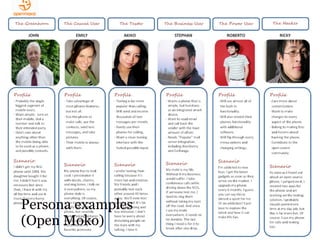
Course #5: data analysis
nicolas nova | liftlab
Head, Geneva | March, 25th 2010
Recap - what we are looking for

meaning - interest in how people make sense of
what they are doing
process - interest in how they are doing it (rather
than outcome)
fieldwork - interest in people in their context
descriptive - explore and describe with words,
pictures or videos
inductive - from empirical data to hypotheses,
concepts, categories, exceptions
design issue


user research / data gathering


        data analysis


   implications for design


       communication
observation / participant observation
        design issue                      (photo, video, notes)

                                 interview (open, in-depth...), contexual
user research / data gathering    interview, lead-users/expert interview


                                     survey / census / photo survey
        data analysis


   implications for design


       communication
design issue


user research / data gathering

                                 “Thick/rich” descriptions: context,
        data analysis            process/sequence of actions, ...
                                 Problems or recurring events (to be
   implications for design       categorized): repetitions, cycles,
                                 clusters, absence, growth...
                                 Lists of ressources employed for the
                                 activity (tools, people, ...)
                                 ...
How to analyze this big mess?

collected data preparation: interview transcriptions,
observational notes, visual material (photo, video),
diary, documents
aimed at reaching a “higher level” through data
“reduction” (patterns, categories, themes) and
“interpretation”, a “continuous dialogue with
empirical data”
“coding”: form categories by attaching codes to the
corresponding excerpts from the collected data
different coding strategies (one example in the next
slide)
How to “code” your data?
1. Data overview: get the sense of the data as a whole (read interview
transcriptions, look at pictures, video...), sort similar data (photo,
quotes), note your first reactions, ideas, questions as they come to mind.
Write separately feelings and intuition
2. Pick up one data item, understand and extract the main points and
topics you see (motivation to do something, opinion, peculiar stories, relevant behavior,
pertinent response to something, use of a tool/feature, surprising reaction, interesting problem
that reveal unmet needs, unexpected failure...)

3. Repeat this for several data items, make a list of all topics. Cluster the
similar topics, put them in a table with 3 columns (major topics, unique
topics, leftovers).
4. Use this list to get back to your data. Abbreviate topic names as codes
and write codes to the appropriate segments of the data (transcript,
photo).
5. Find the most descriptive wording for your topics and turn them into
categories. Draw inter-relationships between categories.
Recommendations when coding (H.Becker)

1. Find elements that do not fit, do not ignore inconvenient data items,
focus on data that “upset your thinking”.
2. There is always something happening: “what was happening when
nothing was happening”
3. Theories of “middle range”: “What is useful is the description of
something more general than the particular facts we discovered, but
less general than notions of identity or social interactions”. DO NOT
LOSE THE SPECIFICITY OF WHAT YOU FOUND
4. Do not mistake a specific instance of something for the entire class
of phenomena it belongs to (education, entertainment, ...)
How do things evolve over time?

1. Single occurence/repetition?
2. Growth/decrease over time?
3. Periodic cycle (irregular or not)?
4. Sequences: different steps
design issue


user research / data gathering


        data analysis            Persona/user profiles
                                 Design guidelines/recommendations
   implications for design       Experiences models: storyboard,
       intermediary objects      scenario/vignettes
                                 Problem lists
                                 Unusual behavior = suggest
                                 directions that can benefit to
                                 others...
                                 Prototypes
                                 Use cases
Mood board:
gamer hands
Activity sequence
(Lego)
Persona examples
(Open Moko)
Storyboard (Kars
Alfrink)
http://cli.gs/U0djhg
Prototype: design patterns
by Christian Crumlish
Prototype:
wireframe
Design framework
(T. Jobert & E.
Guerry)
Project discussion
Menu for next courses

➡ Course’s blog: http://usages.wordpress.com/
➡ Next course will be about “probes”
Assignement

➡ Each student will have to read a research paper and present it to
the class:
         • 10 minutes, no slides
         • Outline: summary + why is it relevant for design + personal opinion
         • Gaver, B., Dunne, T., and Pacenti, E. (1999). Design: Cultural probes.
         Interactions 6, 1 (Jan. 1999), 21-29. http://portal.acm.org/citation.cfm?
         id=291235

➡ Project:
         • Analyze the data collected from the field (one page verbal description)
         and turn them into an “intermediary object”: specification for a designed
         product, 3 personas, a use case of your product (narrative or storyboard).
➡ To be completed for May 27th, 2010
➡ A short report with:
         • Executive summary of the project (one page / 20 lines)
         • Summary of your design question (10 lines) + motivation to deal with this
         problem (10 lines)
         • Table (one page) that describes the research question in detail: What do I
         need to know? Why do I need to know this? What kind of data will answer
         the question? Where can I find the data? Whom do I contact to access these
         data?
         • Methodology description (one page): describe what you did (interview,
         pictures, number of people observed, etc.)
         • Result analysis (6-10 pages): describe the main results of your field study
         (the most important situation you observed, patterns and problems you
         noticed, exceptions you remarked) with excerpts of interviews, pictures
         (photo you took) and element from your personal observation.
         • Design implications (3-4 pages): specification for a designed product, 3
         personas, a use case of your product (narrative or storyboard).
         • Conclusion (one page): what you learned doing this, how you would
         continue such as a project, ideas for design, etc.
thanks
nicolas@liftlab.com

Field research and interaction design: course #5

  • 1.
    Course #5: dataanalysis nicolas nova | liftlab Head, Geneva | March, 25th 2010
  • 2.
    Recap - whatwe are looking for meaning - interest in how people make sense of what they are doing process - interest in how they are doing it (rather than outcome) fieldwork - interest in people in their context descriptive - explore and describe with words, pictures or videos inductive - from empirical data to hypotheses, concepts, categories, exceptions
  • 3.
    design issue user research/ data gathering data analysis implications for design communication
  • 4.
    observation / participantobservation design issue (photo, video, notes) interview (open, in-depth...), contexual user research / data gathering interview, lead-users/expert interview survey / census / photo survey data analysis implications for design communication
  • 6.
    design issue user research/ data gathering “Thick/rich” descriptions: context, data analysis process/sequence of actions, ... Problems or recurring events (to be implications for design categorized): repetitions, cycles, clusters, absence, growth... Lists of ressources employed for the activity (tools, people, ...) ...
  • 7.
    How to analyzethis big mess? collected data preparation: interview transcriptions, observational notes, visual material (photo, video), diary, documents aimed at reaching a “higher level” through data “reduction” (patterns, categories, themes) and “interpretation”, a “continuous dialogue with empirical data” “coding”: form categories by attaching codes to the corresponding excerpts from the collected data different coding strategies (one example in the next slide)
  • 8.
    How to “code”your data? 1. Data overview: get the sense of the data as a whole (read interview transcriptions, look at pictures, video...), sort similar data (photo, quotes), note your first reactions, ideas, questions as they come to mind. Write separately feelings and intuition 2. Pick up one data item, understand and extract the main points and topics you see (motivation to do something, opinion, peculiar stories, relevant behavior, pertinent response to something, use of a tool/feature, surprising reaction, interesting problem that reveal unmet needs, unexpected failure...) 3. Repeat this for several data items, make a list of all topics. Cluster the similar topics, put them in a table with 3 columns (major topics, unique topics, leftovers). 4. Use this list to get back to your data. Abbreviate topic names as codes and write codes to the appropriate segments of the data (transcript, photo). 5. Find the most descriptive wording for your topics and turn them into categories. Draw inter-relationships between categories.
  • 9.
    Recommendations when coding(H.Becker) 1. Find elements that do not fit, do not ignore inconvenient data items, focus on data that “upset your thinking”. 2. There is always something happening: “what was happening when nothing was happening” 3. Theories of “middle range”: “What is useful is the description of something more general than the particular facts we discovered, but less general than notions of identity or social interactions”. DO NOT LOSE THE SPECIFICITY OF WHAT YOU FOUND 4. Do not mistake a specific instance of something for the entire class of phenomena it belongs to (education, entertainment, ...)
  • 10.
    How do thingsevolve over time? 1. Single occurence/repetition? 2. Growth/decrease over time? 3. Periodic cycle (irregular or not)? 4. Sequences: different steps
  • 11.
    design issue user research/ data gathering data analysis Persona/user profiles Design guidelines/recommendations implications for design Experiences models: storyboard, intermediary objects scenario/vignettes Problem lists Unusual behavior = suggest directions that can benefit to others... Prototypes Use cases
  • 13.
  • 14.
  • 15.
  • 16.
  • 17.
  • 18.
  • 19.
  • 20.
  • 21.
    Menu for nextcourses ➡ Course’s blog: http://usages.wordpress.com/ ➡ Next course will be about “probes”
  • 22.
    Assignement ➡ Each studentwill have to read a research paper and present it to the class: • 10 minutes, no slides • Outline: summary + why is it relevant for design + personal opinion • Gaver, B., Dunne, T., and Pacenti, E. (1999). Design: Cultural probes. Interactions 6, 1 (Jan. 1999), 21-29. http://portal.acm.org/citation.cfm? id=291235 ➡ Project: • Analyze the data collected from the field (one page verbal description) and turn them into an “intermediary object”: specification for a designed product, 3 personas, a use case of your product (narrative or storyboard).
  • 23.
    ➡ To becompleted for May 27th, 2010 ➡ A short report with: • Executive summary of the project (one page / 20 lines) • Summary of your design question (10 lines) + motivation to deal with this problem (10 lines) • Table (one page) that describes the research question in detail: What do I need to know? Why do I need to know this? What kind of data will answer the question? Where can I find the data? Whom do I contact to access these data? • Methodology description (one page): describe what you did (interview, pictures, number of people observed, etc.) • Result analysis (6-10 pages): describe the main results of your field study (the most important situation you observed, patterns and problems you noticed, exceptions you remarked) with excerpts of interviews, pictures (photo you took) and element from your personal observation. • Design implications (3-4 pages): specification for a designed product, 3 personas, a use case of your product (narrative or storyboard). • Conclusion (one page): what you learned doing this, how you would continue such as a project, ideas for design, etc.
  • 24.