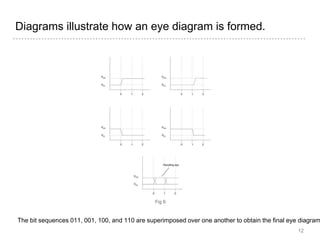
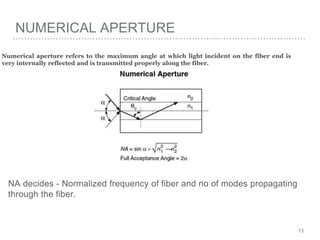
Gujarat Technological
University
Birla Vishvakarma Mahavidyalaya
Engg. College
Subject :-
Optical Fiber Communication
(2161006)
Prepared by:-
Kashyap Mandaliya
(140083112008)
Guided by:-
Prof. Rajvirsinh Rana 1
MEASUREMENT
OF DISPERSION,
NA AND EYE
DIAGRAM
2
WHAT IS ABOUT ?
➤ Optical power measurement is the most basic function in fiber
optics metrology.
➤ Parameters such as time, distance, wavelength, phase and
polarization vary ( not fixed quantity ).
3
TYPES :-
➤ Dispersion
➤ NA
➤ Eye diagram
4
DISPERSION
➤ Pulse broadening of light wave signals .
➤ Intermodal dispersion :- In multimode fibers, Intermodal
dispersion arises from that each mode in optical pulse travels
a slightly different distance and thus arrives at fiber end at
slightly offset times.
➤ Chromatic dispersion :- In chromatic dispersion ( probably in
singlemode ) stems from the variation in propagation speed
of individual wavelength components of optical signal.
➤ Polarization mode dispersion :- It arises from splitting of
polarized signal into orthogonal polarization mode, each has
different propagation speed.
5
TIME DOMAIN ANALYSIS OF INTERMODAL
DISPERSION
Laser diode is used to inject narrow pulse of optical energy.
Output pulse of laser diode is coupled through mode scrambler into test fiber.
Output of fiber is measured by optical sampling oscilloscope ( uilt in optical receiver,
photo diode)
Variable delay line is used to offset the difference in delay.
Fig 1
6
MATHEMATICAL FORMULAE
➤ RMS pulse width is given by :-
Where center t bar is determined by :-
7
CHROMATIC DISPERSION :-
The chromatic dispersion of an optical medium is the phenomenon that the phase velocity and group
velocity of light propagating in a transparent medium depend on the optical frequency.
Electric signal generator modulates the output of TNOS by intensity modulator.
A vevtor voltmeter is used to measure the phase of the modulation related to
electrical modulation source and this Phase measurements is repeated at
wavelength intervals by ∆.lambda across spectral band.
8
Fig 2
POLARIZATION DISPERSION :-
A polarizer or polariser is an optical filter that passes light of a specific polarization and blocks waves of other
polarizations. It can convert a beam of light of undefined or mixed polarization into a beam with well-defined p
-olarization, polarized light.
An Optical Spectrum Analyzer (or OSA) is a precision instrument designed to measure and display
the distribution of power of an optical source over a specified wavelength span.
9
Polarization mode dispersion (PMD) is a form of modal dispersion where two different
poloarization of light in a waveguide, which normally travel at the same speed, travel at
different speeds due to random imperfections and asymmetries, causing random
spreading of optical pulses. Unless it is compensated, which is difficult, this ultimately
limits the rate at which data can be transmitted over a fiber.
Fig 3
In the three types of dispersion in optical fiber, components of the signal are delayed differentially, broadening
the pulse.
Fig 4
10
EYE DIAGRAM TEST :-
An eye diagram is a common indicator of the quality of signals in high-speed digital transmissions.
An oscilloscope generates an eye diagram by overlaying sweeps of different segments of a long data
stream driven by a master clock., so called because the resulting image looks like the opening of an eye.
Fig 5
11
Diagrams illustrate how an eye diagram is formed.
The bit sequences 011, 001, 100, and 110 are superimposed over one another to obtain the final eye diagram
Fig 6
12
NUMERICAL APERTURE
Numerical aperture refers to the maximum angle at which light incident on the fiber end is
very internally reflected and is transmitted properly along the fiber.
NA decides - Normalized frequency of fiber and no of modes propagating
through the fiber.
13
THANKYOU 
14

Fiber Optic Communication.

  • 1.
    Gujarat Technological University Birla VishvakarmaMahavidyalaya Engg. College Subject :- Optical Fiber Communication (2161006) Prepared by:- Kashyap Mandaliya (140083112008) Guided by:- Prof. Rajvirsinh Rana 1
  • 2.
  • 3.
    WHAT IS ABOUT? ➤ Optical power measurement is the most basic function in fiber optics metrology. ➤ Parameters such as time, distance, wavelength, phase and polarization vary ( not fixed quantity ). 3
  • 4.
    TYPES :- ➤ Dispersion ➤NA ➤ Eye diagram 4
  • 5.
    DISPERSION ➤ Pulse broadeningof light wave signals . ➤ Intermodal dispersion :- In multimode fibers, Intermodal dispersion arises from that each mode in optical pulse travels a slightly different distance and thus arrives at fiber end at slightly offset times. ➤ Chromatic dispersion :- In chromatic dispersion ( probably in singlemode ) stems from the variation in propagation speed of individual wavelength components of optical signal. ➤ Polarization mode dispersion :- It arises from splitting of polarized signal into orthogonal polarization mode, each has different propagation speed. 5
  • 6.
    TIME DOMAIN ANALYSISOF INTERMODAL DISPERSION Laser diode is used to inject narrow pulse of optical energy. Output pulse of laser diode is coupled through mode scrambler into test fiber. Output of fiber is measured by optical sampling oscilloscope ( uilt in optical receiver, photo diode) Variable delay line is used to offset the difference in delay. Fig 1 6
  • 7.
    MATHEMATICAL FORMULAE ➤ RMSpulse width is given by :- Where center t bar is determined by :- 7
  • 8.
    CHROMATIC DISPERSION :- Thechromatic dispersion of an optical medium is the phenomenon that the phase velocity and group velocity of light propagating in a transparent medium depend on the optical frequency. Electric signal generator modulates the output of TNOS by intensity modulator. A vevtor voltmeter is used to measure the phase of the modulation related to electrical modulation source and this Phase measurements is repeated at wavelength intervals by ∆.lambda across spectral band. 8 Fig 2
  • 9.
    POLARIZATION DISPERSION :- Apolarizer or polariser is an optical filter that passes light of a specific polarization and blocks waves of other polarizations. It can convert a beam of light of undefined or mixed polarization into a beam with well-defined p -olarization, polarized light. An Optical Spectrum Analyzer (or OSA) is a precision instrument designed to measure and display the distribution of power of an optical source over a specified wavelength span. 9 Polarization mode dispersion (PMD) is a form of modal dispersion where two different poloarization of light in a waveguide, which normally travel at the same speed, travel at different speeds due to random imperfections and asymmetries, causing random spreading of optical pulses. Unless it is compensated, which is difficult, this ultimately limits the rate at which data can be transmitted over a fiber. Fig 3
  • 10.
    In the threetypes of dispersion in optical fiber, components of the signal are delayed differentially, broadening the pulse. Fig 4 10
  • 11.
    EYE DIAGRAM TEST:- An eye diagram is a common indicator of the quality of signals in high-speed digital transmissions. An oscilloscope generates an eye diagram by overlaying sweeps of different segments of a long data stream driven by a master clock., so called because the resulting image looks like the opening of an eye. Fig 5 11
  • 12.
    Diagrams illustrate howan eye diagram is formed. The bit sequences 011, 001, 100, and 110 are superimposed over one another to obtain the final eye diagram Fig 6 12
  • 13.
    NUMERICAL APERTURE Numerical aperturerefers to the maximum angle at which light incident on the fiber end is very internally reflected and is transmitted properly along the fiber. NA decides - Normalized frequency of fiber and no of modes propagating through the fiber. 13
  • 14.