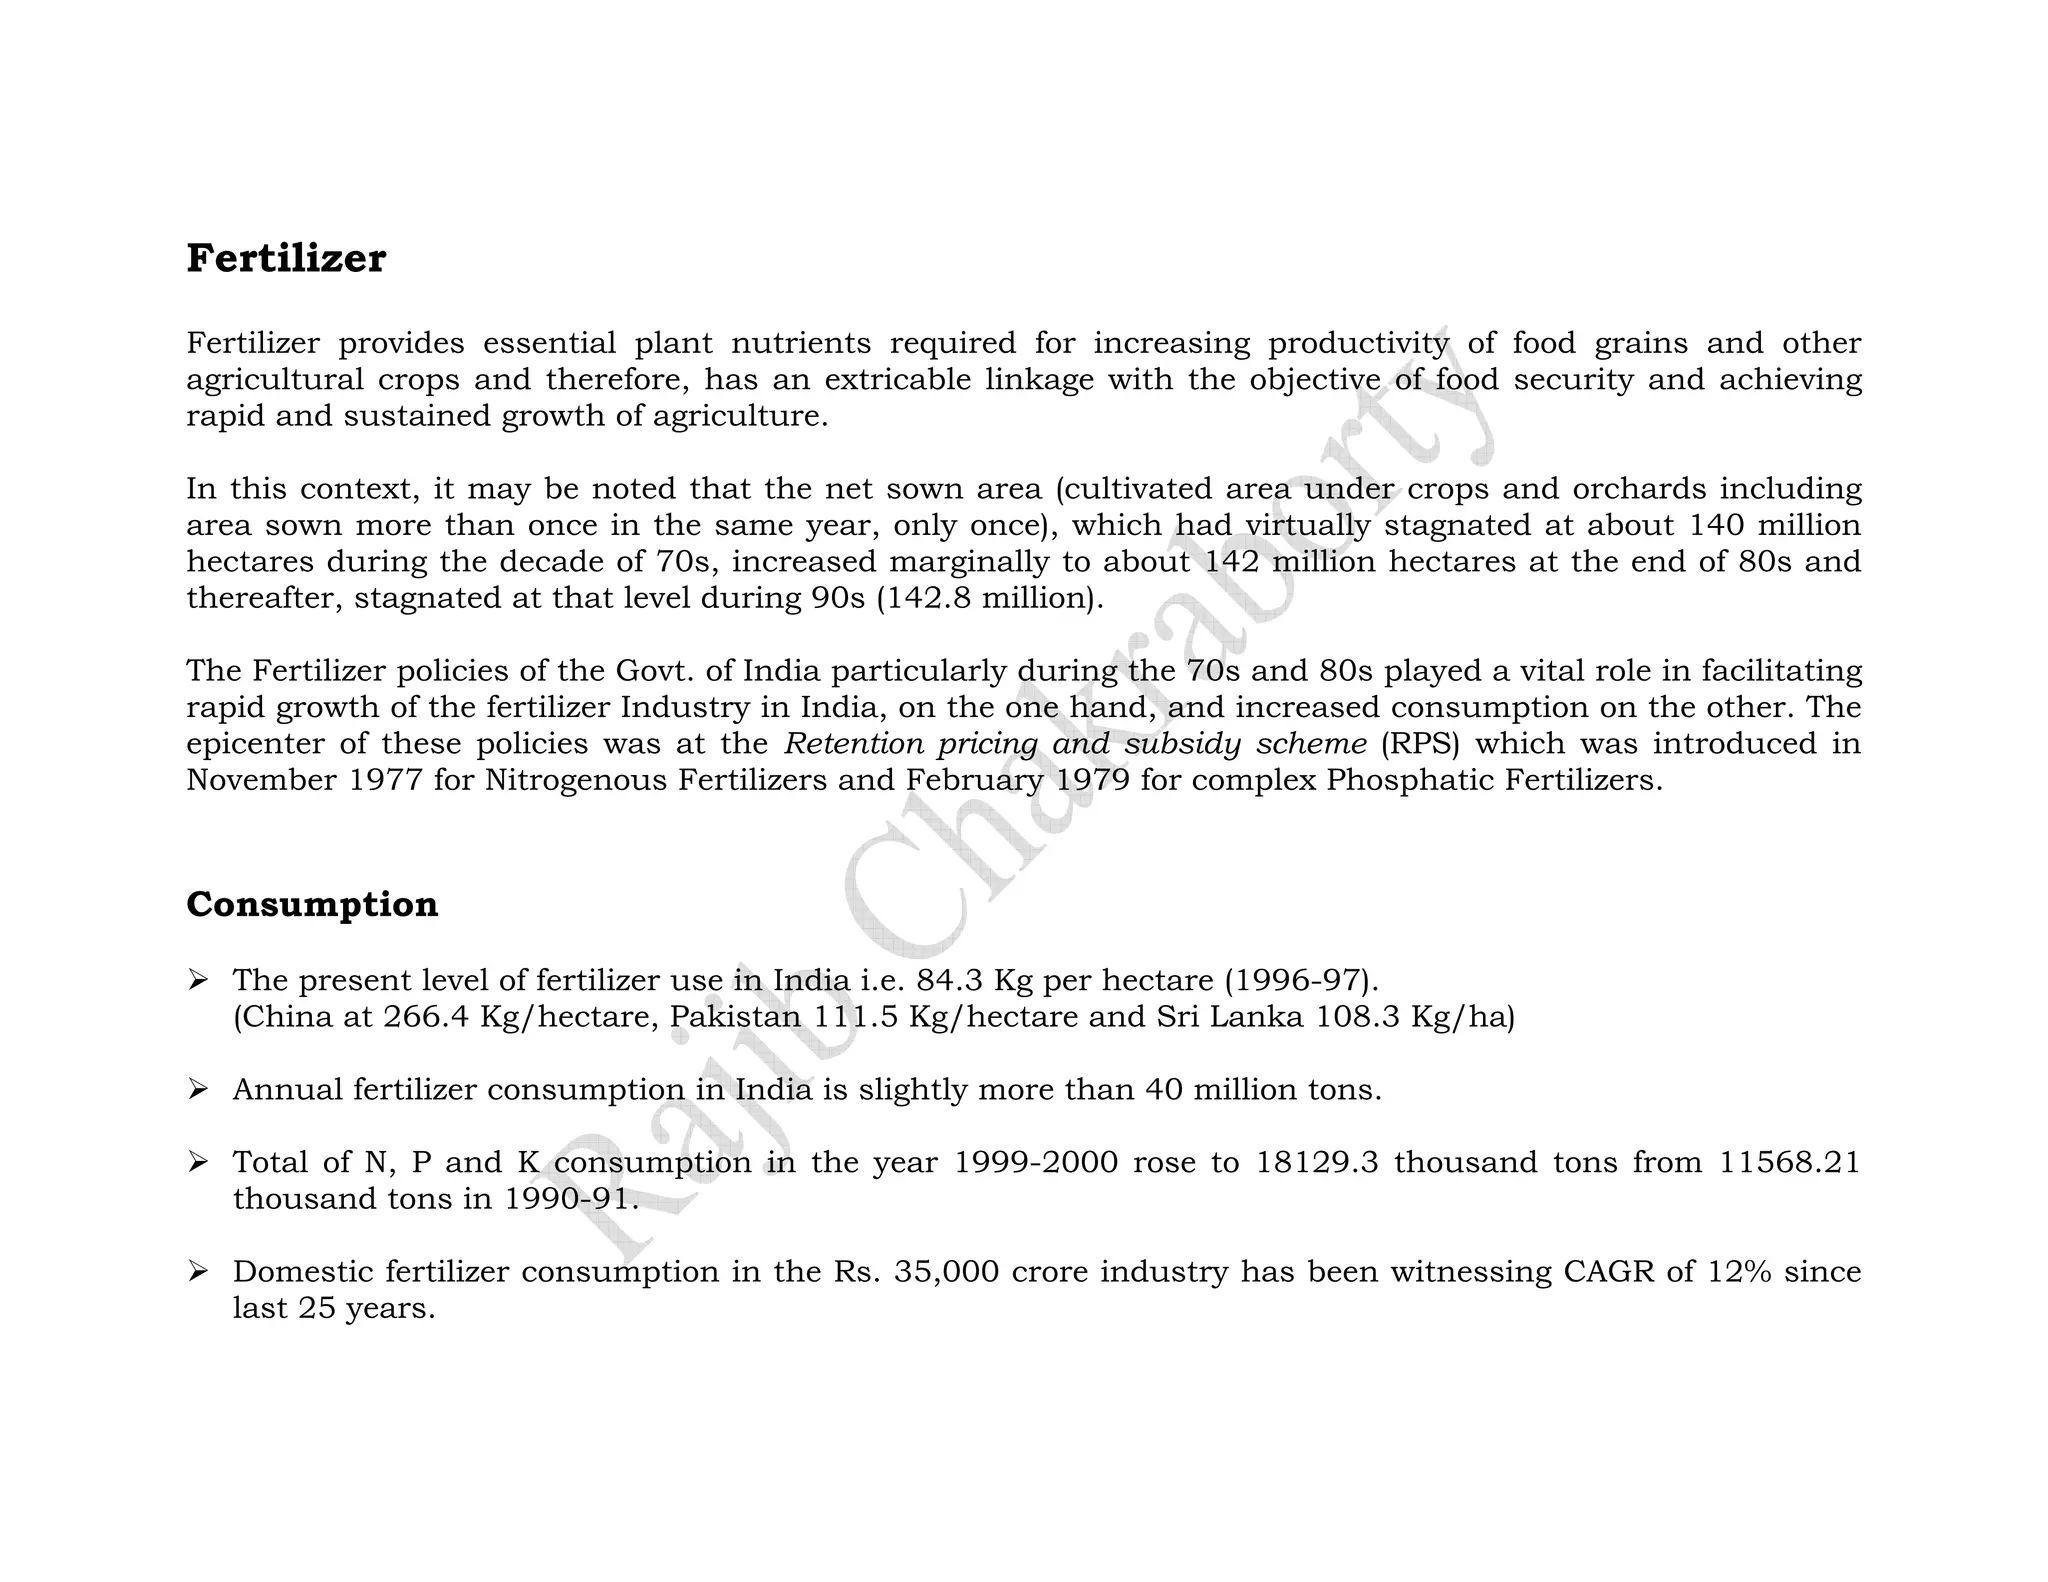
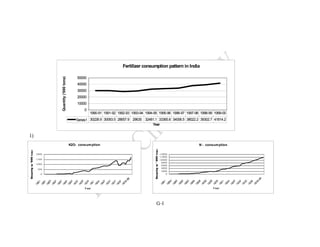
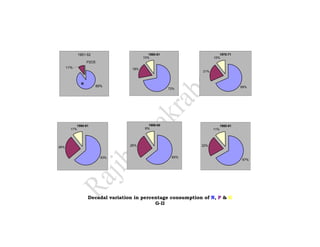
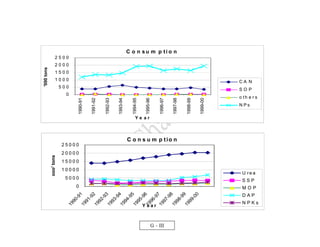
SlideShare a Scribd company logo
Fertilizer
Fertilizer provides essential plant nutrients required for increasing productivity of food grains and other
agricultural crops and therefore, has an extricable linkage with the objective of food security and achieving
rapid and sustained growth of agriculture.

In this context, it may be noted that the net sown area (cultivated area under crops and orchards including
area sown more than once in the same year, only once), which had virtually stagnated at about 140 million
hectares during the decade of 70s, increased marginally to about 142 million hectares at the end of 80s and
thereafter, stagnated at that level during 90s (142.8 million).

The Fertilizer policies of the Govt. of India particularly during the 70s and 80s played a vital role in facilitating
rapid growth of the fertilizer Industry in India, on the one hand, and increased consumption on the other. The
epicenter of these policies was at the Retention pricing and subsidy scheme (RPS) which was introduced in
November 1977 for Nitrogenous Fertilizers and February 1979 for complex Phosphatic Fertilizers.


Consumption

   The present level of fertilizer use in India i.e. 84.3 Kg per hectare (1996-97).
   (China at 266.4 Kg/hectare, Pakistan 111.5 Kg/hectare and Sri Lanka 108.3 Kg/ha)

   Annual fertilizer consumption in India is slightly more than 40 million tons.

   Total of N, P and K consumption in the year 1999-2000 rose to 18129.3 thousand tons from 11568.21
   thousand tons in 1990-91.

   Domestic fertilizer consumption in the Rs. 35,000 crore industry has been witnessing CAGR of 12% since
   last 25 years.
Fertilizer consumption pattern in India

                                       50000
            Quantity ('000 tons)


                                       40000
                                       30000
                                       20000
                                       10000
                                           0
                                               1990-91 1991-92 1992-93 1993-94 1994-95 1995-96 1996-97 1997-98 1998-99 1999-00
                                       Series1 30228.9 30093.5 28657.9 29635 32481.1 33365.8 34006.5 38022.2 39302.7 41814.2
                                                                                   Year


1)
                                   K2O- consum ption                                                          N - consum ption

     2000                                                                                 14000
                                                                                          12000
     1500                                                                                 10000
                                                                                           8000
     1000
                                                                                           6000
      500                                                                                  4000
                                                                                           2000
        0                                                                                     0


                                           Y ear                                                                      Y ear


                                                                                     G-I
Share of nitrogenous fertilizers is 65% (1999-00) to the total fertilizer consumption followed by
phosphorous 26% and potash 9%.

N, P2O5 and K2O consumption has been increasing on an average rate of 12.36 %, 17.17 % and 35.64 %
over last 50 years.

Share of Nitrogen in nutrient consumption is gradually declining (ref G-II) over the years whereas that of
Potassium and Phosphorous has increased substantially in the recent past.

Urea supplies around 83% of the total nitrogen requirement. (At present, only 50% of the total domestic
capacity is gas-based, about 30% is based on naphtha and rest on fuel, oil and coal).

Single super phosphate supplies 19% of the total phosphatic nutrients. (Both rock phosphate and sulphur
are imported).

Di-ammonium phosphate (DAP) meets 50% of phosphatic and 8% of nitrogenous nutrients. Rock
phosphate is the main feedstock.

Potassium fertilizers are not manufactured in India due to the non-availability of the basic feedstock.
Muriate of potash (MOP) is imported from countries like Canada, Jordan and Germany.

The domestic fertilizer demand was met largely by imports till the mid-1970s. To reduce import
dependence, the government implemented a Retention Pricing Scheme (RPS โ€“ details next page) in 1977
to encourage domestic capacity creation. Earlier, all fertilizers were under government control. However, in
1992-93, potassium and phosphatic fertilizers were deregulated.

Uttar Pradesh continued to be the highest consumer of fertilizer nutrients at 3.09mn tons followed by
Andhra Pradesh (2.0), Maharashtra (1.66) and Punjab (1.38mn tons). These four states together account
for 49% of all India consumption.
1951-52                        1960-61                   1970-71
                                        10%                       10%
                 P2O5
      11%                         18%
                                                            21%


             N
                      89%                                                         69%
                                                     72%


           1990-91                         1999-00                      1980-81
        11%                              9%                       11%


26%
                                 26%                        22%


                        63%                           65%
                                                                                  67%


                 Decadal variation in percentage consumption of N, P & K
                                           G-II
Retention pricing scheme

Urea, the most widely used fertilizer, is under government control. The production cost for each unit is
calculated separately, at a normative capacity level of 90% (80% in year 1). Adding the cost of production and
a fixed return on investment, one can arrive at the retention price. The government reimburses the difference
between the retention price and the selling price, which is also fixed by the government. Operating at higher
than 90% utilization levels enables a producer to generate more than 12% returns as all costs are covered at
90% utilization.

The retention price for most units is higher than the selling price. The difference is compensated to the
producer and reflected in the fertilizer subsidy. The revised estimate for urea subsidy is Rs86bn. The
concessions available to P and K will add another Rs40bn.

Implications of controls

Under the regime of assured returns, capacities were set up at high capital costs. These coexisted with older
units with lower retention prices. The system lacked incentives for upgradation and investments in
modernization. Although the profitability of the sector was assured, modernization efforts were limited
because of limited operational freedom and incentives.

Under political compulsions, successive governments have not been able to raise fertilizer prices in spite of
cost increases. With other sectors witnessing liberalization, especially the hydrocarbon sector, the prices of
petroleum feedstock (gas, fuel oil and naphtha) have increased. In line with the economic reforms, the
government decontrolled DAP, SSP and other fertilizers in August 1992, while urea was kept under state
control. DAP and SSP prices doubled. This has led to undesirable changes in the fertilizer mix used by the
farmers. This resulted in the NPK ratio changing to 10:3:1. In an attempt to mitigate this, DAP and other
complex fertilizers were given price sops.
'000 tons
                                        ooo' tons


                                                                                                                        0
                                                                                                                                500
                                                                                                                                       1000
                                                                                                                                              1500
                                                                                                                                                     2000
                                                                                                                                                            2500

            19
              90


                           0
                                 5000
                                           10000
                                                   15000
                                                           20000
                                                                   25000
                -9
                   1                                                                                     1990-91
            19
              91
                -9
                   2                                                                                     1991-92
            19
              92
                -9
                   3                                                                                     1992-93
            19
              93
                -9
                   4
            19                                                                                           1993-94
              94
                -9
                   5
            19                                                                                           1994-95
              95
                -9
                   6
                                                                                                 Ye ar


            19                                                                                           1995-96
              96


          Y ear
                -9
                   7
            19


G - III
              97                                                                                         1996-97
                -9
                   8
            19
                                                                                                                                                                   C o n su m p ti o n


                                                                           C o n s u m p tio n


              98                                                                                         1997-98
                -9
                   9
            19
              99                                                                                         1998-99
                -0
                   0
                                                                                                         1999-00
                                                                                                           N Ps
                                                                                                                               SOP
                                                                                                                                      CA N


                                SSP


                    DAP
                                        U rea


                          MOP
                                                                                                                  o th e r s


             NPKs
Selling Price of Major Fertilisers before and after decontrol
Excluding Sales Tax and other Local Taxes
Date         Urea      DAP          MOP        SSP              10:26:26    12:32:16   15:15:15   16:20:00   20:20:00
Prior to decontrol
25-7-91      3300      5040         1820       1340             4140         4560       2940      3220       3640
14-8-1991 3060         4680         1700       1240             3840         4220       2740      3000       3380
After decontrol of P & K Fertilizer (Urea remained under        control) (with concession)
25-8-1992 2760         7500-        5500-      2400-            6660-        6730-      5330-     6020-      5565-
                       8000         6000       2600             7050         6890       6255      6300       6120
1-4-1994     2760      6466-        3800-      2400-            660-6900 7160-          5880-     5100-      5600-
                       8038         5400       2600                          7800       6600      6100       6300
1-4-1995     3320      9200-        4100-      2660-            8800-        9000-      6440-     6700-      6570-
                       9860         4600       3000             9100         9900       6500      6760       7500
1-4-1996     3320      6500-        3500-      2000-            7554-        6220-      4980-     6080-      5130-
                       11000        5800       4200             9885         9887       7000      6731       7800
21-2-97      3660      7700-        4100-      2000-            7554-        7410-      5804-     6020-      6165-
                       9840         5540       4165             8360         8400       6500      7054       7300
1-4-1997     3660      8300         3700       2335-            7300         7400       6200      6400       6500
                                               3057
1-4-1999     4000      8300         3700       2500-            7300       7400        6200       6400       6500
                                               3500

Note: Rs. 1000 per ton concessions on DAP and MOP and proportionally on complexes.
B ih a r
                                                                              DAP
                                      6%               T a m iln a d u O ris s a A s s a m
                                                                         1%        1%                          1 9 % U tta r
                                                            4%
                                                                                              O th e rs         P ra d e s h
                                  W est ben gal
                                                                                                1%
                                          6%
                                K a rn a ta k a                                                           A n d h ra
                                     6%                                                                   p ra d e s h
                                                                                                             10%
                                R a ja s th a n
                                     6%         H a ry a n a
                                                                                           M adh ya          P u n ja b
                                                   7 % G u ja ra t                                            10%
                                                                      M a h a ra s h tra   P ra d e s h
                                                             7%
                                                                            8%                8%


UP           Andhra         MP                         Maharashtra                 Gujarat                Haryana                    Rajasthan              Karnataka
1131.2       697.97         565.84                     549.99                      481.99                 468.49                     453.18                 446.31
WB           Bihar          Tamilnadu                  Orissa                      Assam                  J& K                       Punjab                 others
426.79       389.08         272.42                     95.91                       36.09                  29.92                      674.49                 102.49


             SO Tam
               P                                               Andhra                              10:26:26                        Karnataka
                                                                                                                                                         12:32:16
                   ilna                            Orissa      pradesh       Kerala                                      Gujarat
                                                                                                                                      3%
                                                                                                                   Andhra 4%                   Madhya
                  du                                 3%          3%           2%
                                                                                                                   pradesh                     Pradesh              Haryana
  M adhya                                       Tamilnadu
                                                                                                   West bengal       4%                          3%                   2%
                                                   6%
  Pradesh                                                                                            38%
                      Andhra                Karnataka                                                             Himachal
    11%                                       12%                                                                 Pradesh
                      pradesh                                                                                       5%
   Karnata              52%                                                                                                                                   Uttar Pradesh
                                                            Maharashtra                                                   Punjab
     ka                                                        36%                                                         8%       Bihar                          62%
    37%                                                                                                                              9%

                                                                           G - IV
The state wise NP/NPK market concentration is as per the following diagram:


                        percentage share in
                                                                     NP/NPK market concentration
                                                     120


                           consumption
                                                                   83.2 %


                            Cumulative
                                                     100
                                                      80
                                                      60
                                                      40
                                                      20
                                                       0


                                                                                     h


                                                                                   sh
                                                                      Ta aka
                                                                                     h

                                                                                    ra


                                                                                   rry
                                                                                   an


                                                                                     a
                                                                         tb u


                                                                                   sh

                                                                                    la
                                                                                      l


                                                                                   ab
                                                                                    at


                                                                                     r


                                                                                                   oa
                                                                                   sa
                                                                                  ga


                                                                                  ha
                                                                                  es
                                                           es


                                                                    Po yan
                                                                                 ad


                                                                                 ra
                                                                                 ht


                                                                                 ar


                                                                               de
                                                                               de


                                                                                th


                                                                               he
                                                                                nj


                                                                                                   G
                                                                               ris
                                                                              en


                                                                             ad


                                                                              Bi
                                                                              at
                                                         ad


                                                                             iln
                                                                             as


                                                                            Ke


                                                                             uj


                                                                            as
                                                                          Pu

                                                                            ra
                                                                           ra


                                                                           ar

                                                                            ic
                                                                           O
                                                                          rn


                                                                          G
                                                                         Pr
                                                                          m
                                                     pr

                                                              ar


                                                                        nd
                                                                        lP

                                                                         aj

                                                                         H
                                                                        rP
                                                                       Ka


                                                                      es
                                                           ah


                                                                       R
                                                     a


                                                                       a


                                                                     ha
                                                                    tta
                                                hr


                                                                    hy
                                                                   W
                                                         M


                                                                  ac
                                                 d


                                                                  U


                                                                 ad
                                                                                      States

                                              An


                                                               im
                                                               M


                                                              H
This excludes DAP which is consumed by all the states across the country and it is considered to be the
most popular fertilizer next to Urea. The above diagram shows that only five states namely Andhra
Pradesh, Maharashtra, Karnataka, Tamilnadu and West Bengal consumes 83.2 % of NP/NPK.

Andhra Pradesh (AP) is the highest consumer of NP/NPKs (excluding DAP) with 1110.54 thousand tons in
the year 1999-00 (increased by 10.51 % compared to previous year).

Next to AP, Maharashtra is the second largest consumer of NP/NPKs in India with 924.74 thousand tons
in the year 1999-00. Increase in consumption over last year is 36.8 %.

In the similar pattern as above, Karnataka holds the third rank with a consumption of 783.1 thousand
tons with an increase of 8.4 % over last year.

Tamilnadu (398.93 thousand tons in 1999-00) and West Bengal (314.06 thousand tons) are viz. 4th and 5
5th largest consumer in this category. Increase in consumption over last year in these states are 5.6 % and
43.5 % respectively.
Andhra
                           16:20:00                                                               19:19:19                                      pradesh
                                                                                                                                                                    23:23:00        Arunachal
              Tamilnadu                         Madhya
                                                                                           Andhra                                                 4%           Gujarat               Pradesh
                6%                              Pradesh
                                                  2%
                                                                                           pradesh Goa                                                          3%                     0%
                                                                                             10%   5%                                          Karnataka
                                                                                                                   Maharasht
                                                                                                                                                  5%
      Andhra                                                                                                          ra
      pradesh                                                                                                        46%
                                               Karnataka                            Karnataka                                                                         Maharashtr
       41%
                                                 51%                                  39%                                                                                 a
                                                                                                                                                                        88%


                      17:17:17             Pondicherry             Madhya      Rajasthan                                 West bengal
                                              1%                   Pradesh        1%
                                                                                              20:20:00                      1%                                  W est    2 :2 :0
                                                                                                                                                                          8 8 0
                      Kerala                     Andhra              2%                            Bihar                                                                           M d ya
                                                                                                                                                                                     ah
Maharashtra
                       4%
                                                                                                                                                                b ga
                                                                                                                                                                 en l
   4%                                           pradesh        Gujarat                              1%                             Punjab                                          P d
                                                                                                                                                                                    ra esh
                                                  35%                                                                               1%                           1%
                                                                                                                                                                  1
                                                                 2%                                                                                                                  2%
                                                             Uttar Pradesh
Tamilnadu                                                                                                                         Andhra
                                                                   3%
  26%                                                                                                                             pradesh
                                                              Kerala                                                                34%                    Orissa                            A d ra
                                                                                                                                                                                              nh
                          Karnataka
                                                               8%                                          Maharashtra                                     2%8
                            30%
                                                                                      Karnataka               18%                                                                            p d
                                                                                                                                                                                              ra esh
                                                                  Tamilnadu
                                                                     11%
                                                                                        18%                                                                                                    5%
                                                                                                                                                                                                9


                                            Andhra                                                                                  14:35:14
                                            pradesh
                                                            15:15:15                  Madhya
                                                                     Gujarat                                                            Maharash
                                              3%           Bihar                      Pradesh                            Orissa
                                Tamilnadu                             1%                                                                  tra
                                                            2%                          1%                                13%
                                   3%                                                     Himachal              West                      2%
                                                                                          Pradesh              bengal
                                 Uttar                                                      1%                  13%
                                Pradesh                                                                                                              Andhra
                                  3%                                                  Maharashtra               Madhya                               pradesh
                                                                                         49%                    Pradesh                                56%
                                      West bengal     Karnataka                                                   16%
                                        15%             22%

                                                                                                  G-V
On including Uttar Pradesh and Kerela 92.4% of the market is under cover where the consumption are
242.19 (5.6 % of all India) and 152.33 (3.6%) thousand tons respectively.

Uttar Pradesh (UP) consumes highest quantities of SSP (693.71), DAP (1131.2) and NPK grade 12:32:16
(186.32) apart from normal consumption of CAN, MOP, 20:20:00 and 15:15:15. Here it is important to note
that consumption of NP/NPKs are least in the Northern states of the country. UP is the only state which
consumes the above two grades of NPK fertilizers. Moreover catapulted growth in consumption rate has
been observed in these categories in the recent past.

Next to UP Punjab and Haryana in the North also consumes considerable amounts of each of SSP (92.14 &
49.94), MOP (37.71 & 7.08), DAP (674.49 & 468.49). Penetration of NPKs is negligible in the northern
states (barring UP).

In the east, West Bengal (WB) is the main market for NP/NPKs (14:35:14 & 15:15:15) where the
consumption has positively changed by 22% as compared to the previous year (1998-99).


The overall increase in all India consumption of NP/NPKs (including DAP) has been 7%. For grades
16:20:00, 17:17:17, 20:20:00, 23:23:00 and 28:28:00 consumption increased by more than 50%.

More Related Content

What's hot

Session 2A - Les Shephard
Session 2A - Les ShephardSession 2A - Les Shephard
Session 2A - Les ShephardReenergize
ย 
Time and climate change - London Climate Forum 2012
Time and climate change - London Climate Forum 2012Time and climate change - London Climate Forum 2012
Time and climate change - London Climate Forum 2012Clive Bates
ย 
Session 1-2-james-fry-a-global-challenge-markets-oil-palm-expansion-1463
Session 1-2-james-fry-a-global-challenge-markets-oil-palm-expansion-1463Session 1-2-james-fry-a-global-challenge-markets-oil-palm-expansion-1463
Session 1-2-james-fry-a-global-challenge-markets-oil-palm-expansion-1463ZSL Biodiversity & Palm Oil Platform
ย 
India SCR in semi-arid and rainfed regions of Maharahtra
India SCR in semi-arid and rainfed regions of  MaharahtraIndia SCR in semi-arid and rainfed regions of  Maharahtra
India SCR in semi-arid and rainfed regions of MaharahtraStrengthening Climate Resilience
ย 
Shou qing wang
Shou qing wangShou qing wang
Shou qing wangjenidoyle
ย 
Presentacion Festival Agua Viva Canarias - Atun rojo
Presentacion Festival Agua Viva Canarias - Atun rojoPresentacion Festival Agua Viva Canarias - Atun rojo
Presentacion Festival Agua Viva Canarias - Atun rojoSebastiรกn Losada
ย 
Bangladesh experience: Water Security and Climate Change Adaptation presented...
Bangladesh experience: Water Security and Climate Change Adaptation presented...Bangladesh experience: Water Security and Climate Change Adaptation presented...
Bangladesh experience: Water Security and Climate Change Adaptation presented...Global Water Partnership
ย 
Agroforestry for food security and climate resilience
Agroforestry for food security and climate resilienceAgroforestry for food security and climate resilience
Agroforestry for food security and climate resiliencePatrick Worms
ย 
Animal genetic resources characterization and conservation research in Africa...
Animal genetic resources characterization and conservation research in Africa...Animal genetic resources characterization and conservation research in Africa...
Animal genetic resources characterization and conservation research in Africa...ILRI
ย 
May 2012 - Marketing Roundtable - Jeff Ewald
May 2012 - Marketing Roundtable - Jeff EwaldMay 2012 - Marketing Roundtable - Jeff Ewald
May 2012 - Marketing Roundtable - Jeff EwaldAnnArborSPARK
ย 
Genuity(r) DroughtGard(tm) Hybrids-2013 Commodity Classic
Genuity(r) DroughtGard(tm) Hybrids-2013 Commodity ClassicGenuity(r) DroughtGard(tm) Hybrids-2013 Commodity Classic
Genuity(r) DroughtGard(tm) Hybrids-2013 Commodity ClassicMatt Anselm
ย 
How to reduce the water footprint and improve food security in mountain commu...
How to reduce the water footprint and improve food security in mountain commu...How to reduce the water footprint and improve food security in mountain commu...
How to reduce the water footprint and improve food security in mountain commu...University of the Highlands and Islands
ย 
Fish distrubution along the indian coast
Fish distrubution along the indian coastFish distrubution along the indian coast
Fish distrubution along the indian coastadityasree2
ย 
Introduction of short duration pulses into rice-based cropping systems in wes...
Introduction of short duration pulses into rice-based cropping systems in wes...Introduction of short duration pulses into rice-based cropping systems in wes...
Introduction of short duration pulses into rice-based cropping systems in wes...ACIAR
ย 
Apresentaรงรฃo resultado eng final
Apresentaรงรฃo   resultado eng finalApresentaรงรฃo   resultado eng final
Apresentaรงรฃo resultado eng finalJBS RI
ย 

What's hot (20)

Session 2A - Les Shephard
Session 2A - Les ShephardSession 2A - Les Shephard
Session 2A - Les Shephard
ย 
Time and climate change - London Climate Forum 2012
Time and climate change - London Climate Forum 2012Time and climate change - London Climate Forum 2012
Time and climate change - London Climate Forum 2012
ย 
Session 1-2-james-fry-a-global-challenge-markets-oil-palm-expansion-1463
Session 1-2-james-fry-a-global-challenge-markets-oil-palm-expansion-1463Session 1-2-james-fry-a-global-challenge-markets-oil-palm-expansion-1463
Session 1-2-james-fry-a-global-challenge-markets-oil-palm-expansion-1463
ย 
Perspectives on the Future of Food Security
Perspectives on the Future of Food SecurityPerspectives on the Future of Food Security
Perspectives on the Future of Food Security
ย 
Priorities for Public Sector Research on Food Security and Nutrition
Priorities for Public Sector Research on Food Security and NutritionPriorities for Public Sector Research on Food Security and Nutrition
Priorities for Public Sector Research on Food Security and Nutrition
ย 
India SCR in semi-arid and rainfed regions of Maharahtra
India SCR in semi-arid and rainfed regions of  MaharahtraIndia SCR in semi-arid and rainfed regions of  Maharahtra
India SCR in semi-arid and rainfed regions of Maharahtra
ย 
Uintah Basin Energy and Transportation Study
Uintah Basin Energy and Transportation StudyUintah Basin Energy and Transportation Study
Uintah Basin Energy and Transportation Study
ย 
Shou qing wang
Shou qing wangShou qing wang
Shou qing wang
ย 
Presentacion Festival Agua Viva Canarias - Atun rojo
Presentacion Festival Agua Viva Canarias - Atun rojoPresentacion Festival Agua Viva Canarias - Atun rojo
Presentacion Festival Agua Viva Canarias - Atun rojo
ย 
Bangladesh experience: Water Security and Climate Change Adaptation presented...
Bangladesh experience: Water Security and Climate Change Adaptation presented...Bangladesh experience: Water Security and Climate Change Adaptation presented...
Bangladesh experience: Water Security and Climate Change Adaptation presented...
ย 
Agroforestry for food security and climate resilience
Agroforestry for food security and climate resilienceAgroforestry for food security and climate resilience
Agroforestry for food security and climate resilience
ย 
Animal genetic resources characterization and conservation research in Africa...
Animal genetic resources characterization and conservation research in Africa...Animal genetic resources characterization and conservation research in Africa...
Animal genetic resources characterization and conservation research in Africa...
ย 
May 2012 - Marketing Roundtable - Jeff Ewald
May 2012 - Marketing Roundtable - Jeff EwaldMay 2012 - Marketing Roundtable - Jeff Ewald
May 2012 - Marketing Roundtable - Jeff Ewald
ย 
From self sufficiency to food security: changing minds, changing market acces...
From self sufficiency to food security: changing minds, changing market acces...From self sufficiency to food security: changing minds, changing market acces...
From self sufficiency to food security: changing minds, changing market acces...
ย 
Genuity(r) DroughtGard(tm) Hybrids-2013 Commodity Classic
Genuity(r) DroughtGard(tm) Hybrids-2013 Commodity ClassicGenuity(r) DroughtGard(tm) Hybrids-2013 Commodity Classic
Genuity(r) DroughtGard(tm) Hybrids-2013 Commodity Classic
ย 
How to reduce the water footprint and improve food security in mountain commu...
How to reduce the water footprint and improve food security in mountain commu...How to reduce the water footprint and improve food security in mountain commu...
How to reduce the water footprint and improve food security in mountain commu...
ย 
Fish distrubution along the indian coast
Fish distrubution along the indian coastFish distrubution along the indian coast
Fish distrubution along the indian coast
ย 
Introduction of short duration pulses into rice-based cropping systems in wes...
Introduction of short duration pulses into rice-based cropping systems in wes...Introduction of short duration pulses into rice-based cropping systems in wes...
Introduction of short duration pulses into rice-based cropping systems in wes...
ย 
Apresentaรงรฃo resultado eng final
Apresentaรงรฃo   resultado eng finalApresentaรงรฃo   resultado eng final
Apresentaรงรฃo resultado eng final
ย 
Changing Donor Priorities and Strategies for Agricultural R&D in Developing C...
Changing Donor Priorities and Strategies for Agricultural R&D in Developing C...Changing Donor Priorities and Strategies for Agricultural R&D in Developing C...
Changing Donor Priorities and Strategies for Agricultural R&D in Developing C...
ย 

Viewers also liked

Ijieh_Ebholo_Poster
Ijieh_Ebholo_PosterIjieh_Ebholo_Poster
Ijieh_Ebholo_PosterEbholo Ijieh
ย 
Fertilizer comsumption pattern - 2001
Fertilizer comsumption pattern - 2001Fertilizer comsumption pattern - 2001
Fertilizer comsumption pattern - 2001Rajib Chakraborty
ย 
LETTER BNDES DIR4 03-2015.PDF
LETTER BNDES DIR4 03-2015.PDFLETTER BNDES DIR4 03-2015.PDF
LETTER BNDES DIR4 03-2015.PDFCarolina Folegatti
ย 
RMH ACAD CV 04.04.15
RMH ACAD CV 04.04.15RMH ACAD CV 04.04.15
RMH ACAD CV 04.04.15R. Michael Haynes
ย 
School Improvement Plan
School Improvement PlanSchool Improvement Plan
School Improvement PlanLiz Marshall
ย 
YoCrunch Case Study
YoCrunch Case StudyYoCrunch Case Study
YoCrunch Case StudySonya Shelton
ย 
Kraft Sales Rep of the Quarter
Kraft Sales Rep of the QuarterKraft Sales Rep of the Quarter
Kraft Sales Rep of the QuarterPreston Whitfield
ย 
World of learning conference 2016 session
World of learning conference 2016 sessionWorld of learning conference 2016 session
World of learning conference 2016 sessionWillowDNA
ย 
ุณู‚ุท ุงู„ูุฑูŠู‚ ุงู„ูˆุทู†ูŠ ูุณู‚ุท ู…ุนู‡ ุงู„ู…ุฏุฑุจ ูˆ ุงู„ุทุงู‚ู…
ุณู‚ุท ุงู„ูุฑูŠู‚ ุงู„ูˆุทู†ูŠ ูุณู‚ุท ู…ุนู‡ ุงู„ู…ุฏุฑุจ ูˆ ุงู„ุทุงู‚ู…ุณู‚ุท ุงู„ูุฑูŠู‚ ุงู„ูˆุทู†ูŠ ูุณู‚ุท ู…ุนู‡ ุงู„ู…ุฏุฑุจ ูˆ ุงู„ุทุงู‚ู…
ุณู‚ุท ุงู„ูุฑูŠู‚ ุงู„ูˆุทู†ูŠ ูุณู‚ุท ู…ุนู‡ ุงู„ู…ุฏุฑุจ ูˆ ุงู„ุทุงู‚ู…BOUNOUA ROUISSAT
ย 
ุชู… ุจุญู…ุฏ ุงู„ู„ู‡ ุงู„ูŠูˆู… ุงู„ุฏุฑุงุณูŠ ุงู„ุฎุงุต ุจุดุฎุตูŠุฉ ุงู„ุญุงุฌ
ุชู… ุจุญู…ุฏ ุงู„ู„ู‡ ุงู„ูŠูˆู… ุงู„ุฏุฑุงุณูŠ ุงู„ุฎุงุต ุจุดุฎุตูŠุฉ ุงู„ุญุงุฌุชู… ุจุญู…ุฏ ุงู„ู„ู‡ ุงู„ูŠูˆู… ุงู„ุฏุฑุงุณูŠ ุงู„ุฎุงุต ุจุดุฎุตูŠุฉ ุงู„ุญุงุฌ
ุชู… ุจุญู…ุฏ ุงู„ู„ู‡ ุงู„ูŠูˆู… ุงู„ุฏุฑุงุณูŠ ุงู„ุฎุงุต ุจุดุฎุตูŠุฉ ุงู„ุญุงุฌBOUNOUA ROUISSAT
ย 
Leadership Stew
Leadership StewLeadership Stew
Leadership StewJohn Jackson
ย 
Pesticide industry
Pesticide industryPesticide industry
Pesticide industrysimarpreet singh
ย 
Fertilizer and their use in india
Fertilizer and their use in indiaFertilizer and their use in india
Fertilizer and their use in indiarockypraveen
ย 
Environmental effects of pesticides by Muhammad Fahad Ansari12IEEM14
Environmental effects of pesticides by Muhammad Fahad Ansari12IEEM14Environmental effects of pesticides by Muhammad Fahad Ansari12IEEM14
Environmental effects of pesticides by Muhammad Fahad Ansari12IEEM14fahadansari131
ย 
Environmental effects of pesticide
Environmental effects of pesticideEnvironmental effects of pesticide
Environmental effects of pesticideSaman Dissanayaka
ย 
Pesticides problems
Pesticides problemsPesticides problems
Pesticides problemsKarl Pointer
ย 
Fertilizer in agriculture of india
Fertilizer in agriculture of indiaFertilizer in agriculture of india
Fertilizer in agriculture of indiaH Janardan Prabhu
ย 

Viewers also liked (18)

Ijieh_Ebholo_Poster
Ijieh_Ebholo_PosterIjieh_Ebholo_Poster
Ijieh_Ebholo_Poster
ย 
Fertilizer comsumption pattern - 2001
Fertilizer comsumption pattern - 2001Fertilizer comsumption pattern - 2001
Fertilizer comsumption pattern - 2001
ย 
LETTER BNDES DIR4 03-2015.PDF
LETTER BNDES DIR4 03-2015.PDFLETTER BNDES DIR4 03-2015.PDF
LETTER BNDES DIR4 03-2015.PDF
ย 
RMH ACAD CV 04.04.15
RMH ACAD CV 04.04.15RMH ACAD CV 04.04.15
RMH ACAD CV 04.04.15
ย 
School Improvement Plan
School Improvement PlanSchool Improvement Plan
School Improvement Plan
ย 
YoCrunch Case Study
YoCrunch Case StudyYoCrunch Case Study
YoCrunch Case Study
ย 
Kraft Sales Rep of the Quarter
Kraft Sales Rep of the QuarterKraft Sales Rep of the Quarter
Kraft Sales Rep of the Quarter
ย 
World of learning conference 2016 session
World of learning conference 2016 sessionWorld of learning conference 2016 session
World of learning conference 2016 session
ย 
ุณู‚ุท ุงู„ูุฑูŠู‚ ุงู„ูˆุทู†ูŠ ูุณู‚ุท ู…ุนู‡ ุงู„ู…ุฏุฑุจ ูˆ ุงู„ุทุงู‚ู…
ุณู‚ุท ุงู„ูุฑูŠู‚ ุงู„ูˆุทู†ูŠ ูุณู‚ุท ู…ุนู‡ ุงู„ู…ุฏุฑุจ ูˆ ุงู„ุทุงู‚ู…ุณู‚ุท ุงู„ูุฑูŠู‚ ุงู„ูˆุทู†ูŠ ูุณู‚ุท ู…ุนู‡ ุงู„ู…ุฏุฑุจ ูˆ ุงู„ุทุงู‚ู…
ุณู‚ุท ุงู„ูุฑูŠู‚ ุงู„ูˆุทู†ูŠ ูุณู‚ุท ู…ุนู‡ ุงู„ู…ุฏุฑุจ ูˆ ุงู„ุทุงู‚ู…
ย 
ุชู… ุจุญู…ุฏ ุงู„ู„ู‡ ุงู„ูŠูˆู… ุงู„ุฏุฑุงุณูŠ ุงู„ุฎุงุต ุจุดุฎุตูŠุฉ ุงู„ุญุงุฌ
ุชู… ุจุญู…ุฏ ุงู„ู„ู‡ ุงู„ูŠูˆู… ุงู„ุฏุฑุงุณูŠ ุงู„ุฎุงุต ุจุดุฎุตูŠุฉ ุงู„ุญุงุฌุชู… ุจุญู…ุฏ ุงู„ู„ู‡ ุงู„ูŠูˆู… ุงู„ุฏุฑุงุณูŠ ุงู„ุฎุงุต ุจุดุฎุตูŠุฉ ุงู„ุญุงุฌ
ุชู… ุจุญู…ุฏ ุงู„ู„ู‡ ุงู„ูŠูˆู… ุงู„ุฏุฑุงุณูŠ ุงู„ุฎุงุต ุจุดุฎุตูŠุฉ ุงู„ุญุงุฌ
ย 
Leadership Stew
Leadership StewLeadership Stew
Leadership Stew
ย 
Pesticide industry
Pesticide industryPesticide industry
Pesticide industry
ย 
Fertilizer and their use in india
Fertilizer and their use in indiaFertilizer and their use in india
Fertilizer and their use in india
ย 
Environmental effects of pesticides by Muhammad Fahad Ansari12IEEM14
Environmental effects of pesticides by Muhammad Fahad Ansari12IEEM14Environmental effects of pesticides by Muhammad Fahad Ansari12IEEM14
Environmental effects of pesticides by Muhammad Fahad Ansari12IEEM14
ย 
Environmental effects of pesticide
Environmental effects of pesticideEnvironmental effects of pesticide
Environmental effects of pesticide
ย 
Pesticides
PesticidesPesticides
Pesticides
ย 
Pesticides problems
Pesticides problemsPesticides problems
Pesticides problems
ย 
Fertilizer in agriculture of india
Fertilizer in agriculture of indiaFertilizer in agriculture of india
Fertilizer in agriculture of india
ย 

Similar to Indian Fertilizer Consumption pattern - 2001

Indonesiaโ€™S Agriculture Sector Development
Indonesiaโ€™S Agriculture Sector DevelopmentIndonesiaโ€™S Agriculture Sector Development
Indonesiaโ€™S Agriculture Sector Developmentedunetwork
ย 
Day2 session 3: Jordan
Day2 session 3: JordanDay2 session 3: Jordan
Day2 session 3: JordanRCREEE
ย 
Global and national implications of alternative metrics - Reisinger et al
Global and national implications of alternative metrics - Reisinger et al Global and national implications of alternative metrics - Reisinger et al
Global and national implications of alternative metrics - Reisinger et al Environmental Protection Agency, Ireland
ย 
Laura Burke, Director General of the EPA presentation to Smurfit Business Sch...
Laura Burke, Director General of the EPA presentation to Smurfit Business Sch...Laura Burke, Director General of the EPA presentation to Smurfit Business Sch...
Laura Burke, Director General of the EPA presentation to Smurfit Business Sch...Alice Charles
ย 
Jeremy Leggett, Hillary Laureate, at the Hillary Symposium
Jeremy Leggett, Hillary Laureate, at the Hillary SymposiumJeremy Leggett, Hillary Laureate, at the Hillary Symposium
Jeremy Leggett, Hillary Laureate, at the Hillary SymposiumHillarySymposium
ย 
Food&energy security
Food&energy securityFood&energy security
Food&energy securitySimla Tokgoz
ย 
China: life sciences industry overview and opportunities, Gao Ronghui
China: life sciences industry overview and opportunities, Gao Ronghui China: life sciences industry overview and opportunities, Gao Ronghui
China: life sciences industry overview and opportunities, Gao Ronghui Biocat, BioRegion of Catalonia
ย 
A new directive on energy efficiency
A new directive on energy efficiencyA new directive on energy efficiency
A new directive on energy efficiencySimply Marcomms
ย 
5 Dan Berman USDA Perspectiva Agricola entre Estados Unidos y Mรฉxico
5 Dan Berman USDA Perspectiva Agricola entre Estados Unidos y Mรฉxico5 Dan Berman USDA Perspectiva Agricola entre Estados Unidos y Mรฉxico
5 Dan Berman USDA Perspectiva Agricola entre Estados Unidos y MรฉxicoConsejo MexicanodelaCarne
ย 
1530 andries potgieter
1530 andries potgieter1530 andries potgieter
1530 andries potgieterJoanna Hicks
ย 
A spatial analysis: creating similarity domains for targeted research sites i...
A spatial analysis: creating similarity domains for targeted research sites i...A spatial analysis: creating similarity domains for targeted research sites i...
A spatial analysis: creating similarity domains for targeted research sites i...Joanna Hicks
ย 
Murphy Oil Corporation 2012 Annual Shareholders Presentation
Murphy Oil Corporation 2012 Annual Shareholders PresentationMurphy Oil Corporation 2012 Annual Shareholders Presentation
Murphy Oil Corporation 2012 Annual Shareholders PresentationCompany Spotlight
ย 
Leds 1st worshop_jelavic
Leds 1st worshop_jelavicLeds 1st worshop_jelavic
Leds 1st worshop_jelavicUNDPhr
ย 
Farland agro project presentation
Farland agro project presentationFarland agro project presentation
Farland agro project presentationmenarkhan
ย 
Janet Gellici - October 6, 2011
Janet Gellici - October 6, 2011Janet Gellici - October 6, 2011
Janet Gellici - October 6, 2011p21decision
ย 
From Technology to Product
From Technology to ProductFrom Technology to Product
From Technology to ProductSVPMA
ย 
Monitoring small piped water services in West Africa
Monitoring small piped water services in West AfricaMonitoring small piped water services in West Africa
Monitoring small piped water services in West AfricaIRC
ย 

Similar to Indian Fertilizer Consumption pattern - 2001 (20)

Improving Soil Fertility and Nutrient Management in Developing Countries
Improving Soil Fertility and Nutrient Management in Developing CountriesImproving Soil Fertility and Nutrient Management in Developing Countries
Improving Soil Fertility and Nutrient Management in Developing Countries
ย 
Indonesiaโ€™S Agriculture Sector Development
Indonesiaโ€™S Agriculture Sector DevelopmentIndonesiaโ€™S Agriculture Sector Development
Indonesiaโ€™S Agriculture Sector Development
ย 
Day2 session 3: Jordan
Day2 session 3: JordanDay2 session 3: Jordan
Day2 session 3: Jordan
ย 
Global and national implications of alternative metrics - Reisinger et al
Global and national implications of alternative metrics - Reisinger et al Global and national implications of alternative metrics - Reisinger et al
Global and national implications of alternative metrics - Reisinger et al
ย 
Laura Burke, Director General of the EPA presentation to Smurfit Business Sch...
Laura Burke, Director General of the EPA presentation to Smurfit Business Sch...Laura Burke, Director General of the EPA presentation to Smurfit Business Sch...
Laura Burke, Director General of the EPA presentation to Smurfit Business Sch...
ย 
Seminar 13 Mar 13 - Session 4 - Who drives deforestation in Kalimantan by DGa...
Seminar 13 Mar 13 - Session 4 - Who drives deforestation in Kalimantan by DGa...Seminar 13 Mar 13 - Session 4 - Who drives deforestation in Kalimantan by DGa...
Seminar 13 Mar 13 - Session 4 - Who drives deforestation in Kalimantan by DGa...
ย 
Jeremy Leggett, Hillary Laureate, at the Hillary Symposium
Jeremy Leggett, Hillary Laureate, at the Hillary SymposiumJeremy Leggett, Hillary Laureate, at the Hillary Symposium
Jeremy Leggett, Hillary Laureate, at the Hillary Symposium
ย 
Food&energy security
Food&energy securityFood&energy security
Food&energy security
ย 
China: life sciences industry overview and opportunities, Gao Ronghui
China: life sciences industry overview and opportunities, Gao Ronghui China: life sciences industry overview and opportunities, Gao Ronghui
China: life sciences industry overview and opportunities, Gao Ronghui
ย 
Seminar 13 Mar 2013 - Session 4 - Oilpalm Indonesia-Cameroon-Colombia_ by PLe...
Seminar 13 Mar 2013 - Session 4 - Oilpalm Indonesia-Cameroon-Colombia_ by PLe...Seminar 13 Mar 2013 - Session 4 - Oilpalm Indonesia-Cameroon-Colombia_ by PLe...
Seminar 13 Mar 2013 - Session 4 - Oilpalm Indonesia-Cameroon-Colombia_ by PLe...
ย 
A new directive on energy efficiency
A new directive on energy efficiencyA new directive on energy efficiency
A new directive on energy efficiency
ย 
5 Dan Berman USDA Perspectiva Agricola entre Estados Unidos y Mรฉxico
5 Dan Berman USDA Perspectiva Agricola entre Estados Unidos y Mรฉxico5 Dan Berman USDA Perspectiva Agricola entre Estados Unidos y Mรฉxico
5 Dan Berman USDA Perspectiva Agricola entre Estados Unidos y Mรฉxico
ย 
1530 andries potgieter
1530 andries potgieter1530 andries potgieter
1530 andries potgieter
ย 
A spatial analysis: creating similarity domains for targeted research sites i...
A spatial analysis: creating similarity domains for targeted research sites i...A spatial analysis: creating similarity domains for targeted research sites i...
A spatial analysis: creating similarity domains for targeted research sites i...
ย 
Murphy Oil Corporation 2012 Annual Shareholders Presentation
Murphy Oil Corporation 2012 Annual Shareholders PresentationMurphy Oil Corporation 2012 Annual Shareholders Presentation
Murphy Oil Corporation 2012 Annual Shareholders Presentation
ย 
Leds 1st worshop_jelavic
Leds 1st worshop_jelavicLeds 1st worshop_jelavic
Leds 1st worshop_jelavic
ย 
Farland agro project presentation
Farland agro project presentationFarland agro project presentation
Farland agro project presentation
ย 
Janet Gellici - October 6, 2011
Janet Gellici - October 6, 2011Janet Gellici - October 6, 2011
Janet Gellici - October 6, 2011
ย 
From Technology to Product
From Technology to ProductFrom Technology to Product
From Technology to Product
ย 
Monitoring small piped water services in West Africa
Monitoring small piped water services in West AfricaMonitoring small piped water services in West Africa
Monitoring small piped water services in West Africa
ย 

Recently uploaded

New Product Development.kjiy7ggbfdsddggo9lo
New Product Development.kjiy7ggbfdsddggo9loNew Product Development.kjiy7ggbfdsddggo9lo
New Product Development.kjiy7ggbfdsddggo9logalbokkahewagenitash
ย 
Matt Conway - Attorney - A Knowledgeable Professional - Kentucky.pdf
Matt Conway - Attorney - A Knowledgeable Professional - Kentucky.pdfMatt Conway - Attorney - A Knowledgeable Professional - Kentucky.pdf
Matt Conway - Attorney - A Knowledgeable Professional - Kentucky.pdfMatt Conway - Attorney
ย 
Hyundai capital 2024 1quarter Earnings release
Hyundai capital 2024 1quarter Earnings releaseHyundai capital 2024 1quarter Earnings release
Hyundai capital 2024 1quarter Earnings releaseirhcs
ย 
HR and Employment law update: May 2024.
HR and Employment law update:  May 2024.HR and Employment law update:  May 2024.
HR and Employment law update: May 2024.FelixPerez547899
ย 
Enterprise Excellence is Inclusive Excellence.pdf
Enterprise Excellence is Inclusive Excellence.pdfEnterprise Excellence is Inclusive Excellence.pdf
Enterprise Excellence is Inclusive Excellence.pdfKaiNexus
ย 
Memorandum Of Association Constitution of Company.ppt
Memorandum Of Association Constitution of Company.pptMemorandum Of Association Constitution of Company.ppt
Memorandum Of Association Constitution of Company.pptseri bangash
ย 
April 2024 Nostalgia Products Newsletter
April 2024 Nostalgia Products NewsletterApril 2024 Nostalgia Products Newsletter
April 2024 Nostalgia Products NewsletterNathanBaughman3
ย 
Cree_Rey_BrandIdentityKit.PDF_PersonalBd
Cree_Rey_BrandIdentityKit.PDF_PersonalBdCree_Rey_BrandIdentityKit.PDF_PersonalBd
Cree_Rey_BrandIdentityKit.PDF_PersonalBdcreerey
ย 
Transforming Max Life Insurance with PMaps Job-Fit Assessments- Case Study
Transforming Max Life Insurance with PMaps Job-Fit Assessments- Case StudyTransforming Max Life Insurance with PMaps Job-Fit Assessments- Case Study
Transforming Max Life Insurance with PMaps Job-Fit Assessments- Case StudyPMaps Assessments
ย 
Equinox Gold Corporate Deck May 24th 2024
Equinox Gold Corporate Deck May 24th 2024Equinox Gold Corporate Deck May 24th 2024
Equinox Gold Corporate Deck May 24th 2024Equinox Gold Corp.
ย 
Digital Transformation in PLM - WHAT and HOW - for distribution.pdf
Digital Transformation in PLM - WHAT and HOW - for distribution.pdfDigital Transformation in PLM - WHAT and HOW - for distribution.pdf
Digital Transformation in PLM - WHAT and HOW - for distribution.pdfJos Voskuil
ย 
Improving profitability for small business
Improving profitability for small businessImproving profitability for small business
Improving profitability for small businessBen Wann
ย 
The-McKinsey-7S-Framework. strategic management
The-McKinsey-7S-Framework. strategic managementThe-McKinsey-7S-Framework. strategic management
The-McKinsey-7S-Framework. strategic managementBojamma2
ย 
Putting the SPARK into Virtual Training.pptx
Putting the SPARK into Virtual Training.pptxPutting the SPARK into Virtual Training.pptx
Putting the SPARK into Virtual Training.pptxCynthia Clay
ย 
FINAL PRESENTATION.pptx12143241324134134
FINAL PRESENTATION.pptx12143241324134134FINAL PRESENTATION.pptx12143241324134134
FINAL PRESENTATION.pptx12143241324134134LR1709MUSIC
ย 
IPTV Subscription in Ireland: Elevating Your Entertainment Experience
IPTV Subscription in Ireland: Elevating Your Entertainment ExperienceIPTV Subscription in Ireland: Elevating Your Entertainment Experience
IPTV Subscription in Ireland: Elevating Your Entertainment ExperienceDragon Dream Bar
ย 
anas about venice for grade 6f about venice
anas about venice for grade 6f about veniceanas about venice for grade 6f about venice
anas about venice for grade 6f about veniceanasabutalha2013
ย 
Taurus Zodiac Sign_ Personality Traits and Sign Dates.pptx
Taurus Zodiac Sign_ Personality Traits and Sign Dates.pptxTaurus Zodiac Sign_ Personality Traits and Sign Dates.pptx
Taurus Zodiac Sign_ Personality Traits and Sign Dates.pptxmy Pandit
ย 
Sustainability: Balancing the Environment, Equity & Economy
Sustainability: Balancing the Environment, Equity & EconomySustainability: Balancing the Environment, Equity & Economy
Sustainability: Balancing the Environment, Equity & EconomyOperational Excellence Consulting
ย 
Team-Spandex-Northern University-CS1035.
Team-Spandex-Northern University-CS1035.Team-Spandex-Northern University-CS1035.
Team-Spandex-Northern University-CS1035.smalmahmud11
ย 

Recently uploaded (20)

New Product Development.kjiy7ggbfdsddggo9lo
New Product Development.kjiy7ggbfdsddggo9loNew Product Development.kjiy7ggbfdsddggo9lo
New Product Development.kjiy7ggbfdsddggo9lo
ย 
Matt Conway - Attorney - A Knowledgeable Professional - Kentucky.pdf
Matt Conway - Attorney - A Knowledgeable Professional - Kentucky.pdfMatt Conway - Attorney - A Knowledgeable Professional - Kentucky.pdf
Matt Conway - Attorney - A Knowledgeable Professional - Kentucky.pdf
ย 
Hyundai capital 2024 1quarter Earnings release
Hyundai capital 2024 1quarter Earnings releaseHyundai capital 2024 1quarter Earnings release
Hyundai capital 2024 1quarter Earnings release
ย 
HR and Employment law update: May 2024.
HR and Employment law update:  May 2024.HR and Employment law update:  May 2024.
HR and Employment law update: May 2024.
ย 
Enterprise Excellence is Inclusive Excellence.pdf
Enterprise Excellence is Inclusive Excellence.pdfEnterprise Excellence is Inclusive Excellence.pdf
Enterprise Excellence is Inclusive Excellence.pdf
ย 
Memorandum Of Association Constitution of Company.ppt
Memorandum Of Association Constitution of Company.pptMemorandum Of Association Constitution of Company.ppt
Memorandum Of Association Constitution of Company.ppt
ย 
April 2024 Nostalgia Products Newsletter
April 2024 Nostalgia Products NewsletterApril 2024 Nostalgia Products Newsletter
April 2024 Nostalgia Products Newsletter
ย 
Cree_Rey_BrandIdentityKit.PDF_PersonalBd
Cree_Rey_BrandIdentityKit.PDF_PersonalBdCree_Rey_BrandIdentityKit.PDF_PersonalBd
Cree_Rey_BrandIdentityKit.PDF_PersonalBd
ย 
Transforming Max Life Insurance with PMaps Job-Fit Assessments- Case Study
Transforming Max Life Insurance with PMaps Job-Fit Assessments- Case StudyTransforming Max Life Insurance with PMaps Job-Fit Assessments- Case Study
Transforming Max Life Insurance with PMaps Job-Fit Assessments- Case Study
ย 
Equinox Gold Corporate Deck May 24th 2024
Equinox Gold Corporate Deck May 24th 2024Equinox Gold Corporate Deck May 24th 2024
Equinox Gold Corporate Deck May 24th 2024
ย 
Digital Transformation in PLM - WHAT and HOW - for distribution.pdf
Digital Transformation in PLM - WHAT and HOW - for distribution.pdfDigital Transformation in PLM - WHAT and HOW - for distribution.pdf
Digital Transformation in PLM - WHAT and HOW - for distribution.pdf
ย 
Improving profitability for small business
Improving profitability for small businessImproving profitability for small business
Improving profitability for small business
ย 
The-McKinsey-7S-Framework. strategic management
The-McKinsey-7S-Framework. strategic managementThe-McKinsey-7S-Framework. strategic management
The-McKinsey-7S-Framework. strategic management
ย 
Putting the SPARK into Virtual Training.pptx
Putting the SPARK into Virtual Training.pptxPutting the SPARK into Virtual Training.pptx
Putting the SPARK into Virtual Training.pptx
ย 
FINAL PRESENTATION.pptx12143241324134134
FINAL PRESENTATION.pptx12143241324134134FINAL PRESENTATION.pptx12143241324134134
FINAL PRESENTATION.pptx12143241324134134
ย 
IPTV Subscription in Ireland: Elevating Your Entertainment Experience
IPTV Subscription in Ireland: Elevating Your Entertainment ExperienceIPTV Subscription in Ireland: Elevating Your Entertainment Experience
IPTV Subscription in Ireland: Elevating Your Entertainment Experience
ย 
anas about venice for grade 6f about venice
anas about venice for grade 6f about veniceanas about venice for grade 6f about venice
anas about venice for grade 6f about venice
ย 
Taurus Zodiac Sign_ Personality Traits and Sign Dates.pptx
Taurus Zodiac Sign_ Personality Traits and Sign Dates.pptxTaurus Zodiac Sign_ Personality Traits and Sign Dates.pptx
Taurus Zodiac Sign_ Personality Traits and Sign Dates.pptx
ย 
Sustainability: Balancing the Environment, Equity & Economy
Sustainability: Balancing the Environment, Equity & EconomySustainability: Balancing the Environment, Equity & Economy
Sustainability: Balancing the Environment, Equity & Economy
ย 
Team-Spandex-Northern University-CS1035.
Team-Spandex-Northern University-CS1035.Team-Spandex-Northern University-CS1035.
Team-Spandex-Northern University-CS1035.
ย 

Indian Fertilizer Consumption pattern - 2001

  • 1. Fertilizer Fertilizer provides essential plant nutrients required for increasing productivity of food grains and other agricultural crops and therefore, has an extricable linkage with the objective of food security and achieving rapid and sustained growth of agriculture. In this context, it may be noted that the net sown area (cultivated area under crops and orchards including area sown more than once in the same year, only once), which had virtually stagnated at about 140 million hectares during the decade of 70s, increased marginally to about 142 million hectares at the end of 80s and thereafter, stagnated at that level during 90s (142.8 million). The Fertilizer policies of the Govt. of India particularly during the 70s and 80s played a vital role in facilitating rapid growth of the fertilizer Industry in India, on the one hand, and increased consumption on the other. The epicenter of these policies was at the Retention pricing and subsidy scheme (RPS) which was introduced in November 1977 for Nitrogenous Fertilizers and February 1979 for complex Phosphatic Fertilizers. Consumption The present level of fertilizer use in India i.e. 84.3 Kg per hectare (1996-97). (China at 266.4 Kg/hectare, Pakistan 111.5 Kg/hectare and Sri Lanka 108.3 Kg/ha) Annual fertilizer consumption in India is slightly more than 40 million tons. Total of N, P and K consumption in the year 1999-2000 rose to 18129.3 thousand tons from 11568.21 thousand tons in 1990-91. Domestic fertilizer consumption in the Rs. 35,000 crore industry has been witnessing CAGR of 12% since last 25 years.
  • 2. Fertilizer consumption pattern in India 50000 Quantity ('000 tons) 40000 30000 20000 10000 0 1990-91 1991-92 1992-93 1993-94 1994-95 1995-96 1996-97 1997-98 1998-99 1999-00 Series1 30228.9 30093.5 28657.9 29635 32481.1 33365.8 34006.5 38022.2 39302.7 41814.2 Year 1) K2O- consum ption N - consum ption 2000 14000 12000 1500 10000 8000 1000 6000 500 4000 2000 0 0 Y ear Y ear G-I
  • 3. Share of nitrogenous fertilizers is 65% (1999-00) to the total fertilizer consumption followed by phosphorous 26% and potash 9%. N, P2O5 and K2O consumption has been increasing on an average rate of 12.36 %, 17.17 % and 35.64 % over last 50 years. Share of Nitrogen in nutrient consumption is gradually declining (ref G-II) over the years whereas that of Potassium and Phosphorous has increased substantially in the recent past. Urea supplies around 83% of the total nitrogen requirement. (At present, only 50% of the total domestic capacity is gas-based, about 30% is based on naphtha and rest on fuel, oil and coal). Single super phosphate supplies 19% of the total phosphatic nutrients. (Both rock phosphate and sulphur are imported). Di-ammonium phosphate (DAP) meets 50% of phosphatic and 8% of nitrogenous nutrients. Rock phosphate is the main feedstock. Potassium fertilizers are not manufactured in India due to the non-availability of the basic feedstock. Muriate of potash (MOP) is imported from countries like Canada, Jordan and Germany. The domestic fertilizer demand was met largely by imports till the mid-1970s. To reduce import dependence, the government implemented a Retention Pricing Scheme (RPS โ€“ details next page) in 1977 to encourage domestic capacity creation. Earlier, all fertilizers were under government control. However, in 1992-93, potassium and phosphatic fertilizers were deregulated. Uttar Pradesh continued to be the highest consumer of fertilizer nutrients at 3.09mn tons followed by Andhra Pradesh (2.0), Maharashtra (1.66) and Punjab (1.38mn tons). These four states together account for 49% of all India consumption.
  • 4. 1951-52 1960-61 1970-71 10% 10% P2O5 11% 18% 21% N 89% 69% 72% 1990-91 1999-00 1980-81 11% 9% 11% 26% 26% 22% 63% 65% 67% Decadal variation in percentage consumption of N, P & K G-II
  • 5. Retention pricing scheme Urea, the most widely used fertilizer, is under government control. The production cost for each unit is calculated separately, at a normative capacity level of 90% (80% in year 1). Adding the cost of production and a fixed return on investment, one can arrive at the retention price. The government reimburses the difference between the retention price and the selling price, which is also fixed by the government. Operating at higher than 90% utilization levels enables a producer to generate more than 12% returns as all costs are covered at 90% utilization. The retention price for most units is higher than the selling price. The difference is compensated to the producer and reflected in the fertilizer subsidy. The revised estimate for urea subsidy is Rs86bn. The concessions available to P and K will add another Rs40bn. Implications of controls Under the regime of assured returns, capacities were set up at high capital costs. These coexisted with older units with lower retention prices. The system lacked incentives for upgradation and investments in modernization. Although the profitability of the sector was assured, modernization efforts were limited because of limited operational freedom and incentives. Under political compulsions, successive governments have not been able to raise fertilizer prices in spite of cost increases. With other sectors witnessing liberalization, especially the hydrocarbon sector, the prices of petroleum feedstock (gas, fuel oil and naphtha) have increased. In line with the economic reforms, the government decontrolled DAP, SSP and other fertilizers in August 1992, while urea was kept under state control. DAP and SSP prices doubled. This has led to undesirable changes in the fertilizer mix used by the farmers. This resulted in the NPK ratio changing to 10:3:1. In an attempt to mitigate this, DAP and other complex fertilizers were given price sops.
  • 6. '000 tons ooo' tons 0 500 1000 1500 2000 2500 19 90 0 5000 10000 15000 20000 25000 -9 1 1990-91 19 91 -9 2 1991-92 19 92 -9 3 1992-93 19 93 -9 4 19 1993-94 94 -9 5 19 1994-95 95 -9 6 Ye ar 19 1995-96 96 Y ear -9 7 19 G - III 97 1996-97 -9 8 19 C o n su m p ti o n C o n s u m p tio n 98 1997-98 -9 9 19 99 1998-99 -0 0 1999-00 N Ps SOP CA N SSP DAP U rea MOP o th e r s NPKs
  • 7. Selling Price of Major Fertilisers before and after decontrol Excluding Sales Tax and other Local Taxes Date Urea DAP MOP SSP 10:26:26 12:32:16 15:15:15 16:20:00 20:20:00 Prior to decontrol 25-7-91 3300 5040 1820 1340 4140 4560 2940 3220 3640 14-8-1991 3060 4680 1700 1240 3840 4220 2740 3000 3380 After decontrol of P & K Fertilizer (Urea remained under control) (with concession) 25-8-1992 2760 7500- 5500- 2400- 6660- 6730- 5330- 6020- 5565- 8000 6000 2600 7050 6890 6255 6300 6120 1-4-1994 2760 6466- 3800- 2400- 660-6900 7160- 5880- 5100- 5600- 8038 5400 2600 7800 6600 6100 6300 1-4-1995 3320 9200- 4100- 2660- 8800- 9000- 6440- 6700- 6570- 9860 4600 3000 9100 9900 6500 6760 7500 1-4-1996 3320 6500- 3500- 2000- 7554- 6220- 4980- 6080- 5130- 11000 5800 4200 9885 9887 7000 6731 7800 21-2-97 3660 7700- 4100- 2000- 7554- 7410- 5804- 6020- 6165- 9840 5540 4165 8360 8400 6500 7054 7300 1-4-1997 3660 8300 3700 2335- 7300 7400 6200 6400 6500 3057 1-4-1999 4000 8300 3700 2500- 7300 7400 6200 6400 6500 3500 Note: Rs. 1000 per ton concessions on DAP and MOP and proportionally on complexes.
  • 8. B ih a r DAP 6% T a m iln a d u O ris s a A s s a m 1% 1% 1 9 % U tta r 4% O th e rs P ra d e s h W est ben gal 1% 6% K a rn a ta k a A n d h ra 6% p ra d e s h 10% R a ja s th a n 6% H a ry a n a M adh ya P u n ja b 7 % G u ja ra t 10% M a h a ra s h tra P ra d e s h 7% 8% 8% UP Andhra MP Maharashtra Gujarat Haryana Rajasthan Karnataka 1131.2 697.97 565.84 549.99 481.99 468.49 453.18 446.31 WB Bihar Tamilnadu Orissa Assam J& K Punjab others 426.79 389.08 272.42 95.91 36.09 29.92 674.49 102.49 SO Tam P Andhra 10:26:26 Karnataka 12:32:16 ilna Orissa pradesh Kerala Gujarat 3% Andhra 4% Madhya du 3% 3% 2% pradesh Pradesh Haryana M adhya Tamilnadu West bengal 4% 3% 2% 6% Pradesh 38% Andhra Karnataka Himachal 11% 12% Pradesh pradesh 5% Karnata 52% Uttar Pradesh Maharashtra Punjab ka 36% 8% Bihar 62% 37% 9% G - IV
  • 9. The state wise NP/NPK market concentration is as per the following diagram: percentage share in NP/NPK market concentration 120 consumption 83.2 % Cumulative 100 80 60 40 20 0 h sh Ta aka h ra rry an a tb u sh la l ab at r oa sa ga ha es es Po yan ad ra ht ar de de th he nj G ris en ad Bi at ad iln as Ke uj as Pu ra ra ar ic O rn G Pr m pr ar nd lP aj H rP Ka es ah R a a ha tta hr hy W M ac d U ad States An im M H This excludes DAP which is consumed by all the states across the country and it is considered to be the most popular fertilizer next to Urea. The above diagram shows that only five states namely Andhra Pradesh, Maharashtra, Karnataka, Tamilnadu and West Bengal consumes 83.2 % of NP/NPK. Andhra Pradesh (AP) is the highest consumer of NP/NPKs (excluding DAP) with 1110.54 thousand tons in the year 1999-00 (increased by 10.51 % compared to previous year). Next to AP, Maharashtra is the second largest consumer of NP/NPKs in India with 924.74 thousand tons in the year 1999-00. Increase in consumption over last year is 36.8 %. In the similar pattern as above, Karnataka holds the third rank with a consumption of 783.1 thousand tons with an increase of 8.4 % over last year. Tamilnadu (398.93 thousand tons in 1999-00) and West Bengal (314.06 thousand tons) are viz. 4th and 5 5th largest consumer in this category. Increase in consumption over last year in these states are 5.6 % and 43.5 % respectively.
  • 10. Andhra 16:20:00 19:19:19 pradesh 23:23:00 Arunachal Tamilnadu Madhya Andhra 4% Gujarat Pradesh 6% Pradesh 2% pradesh Goa 3% 0% 10% 5% Karnataka Maharasht 5% Andhra ra pradesh 46% Karnataka Karnataka Maharashtr 41% 51% 39% a 88% 17:17:17 Pondicherry Madhya Rajasthan West bengal 1% Pradesh 1% 20:20:00 1% W est 2 :2 :0 8 8 0 Kerala Andhra 2% Bihar M d ya ah Maharashtra 4% b ga en l 4% pradesh Gujarat 1% Punjab P d ra esh 35% 1% 1% 1 2% 2% Uttar Pradesh Tamilnadu Andhra 3% 26% pradesh Kerala 34% Orissa A d ra nh Karnataka 8% Maharashtra 2%8 30% Karnataka 18% p d ra esh Tamilnadu 11% 18% 5% 9 Andhra 14:35:14 pradesh 15:15:15 Madhya Gujarat Maharash 3% Bihar Pradesh Orissa Tamilnadu 1% tra 2% 1% 13% 3% Himachal West 2% Pradesh bengal Uttar 1% 13% Pradesh Andhra 3% Maharashtra Madhya pradesh 49% Pradesh 56% West bengal Karnataka 16% 15% 22% G-V
  • 11. On including Uttar Pradesh and Kerela 92.4% of the market is under cover where the consumption are 242.19 (5.6 % of all India) and 152.33 (3.6%) thousand tons respectively. Uttar Pradesh (UP) consumes highest quantities of SSP (693.71), DAP (1131.2) and NPK grade 12:32:16 (186.32) apart from normal consumption of CAN, MOP, 20:20:00 and 15:15:15. Here it is important to note that consumption of NP/NPKs are least in the Northern states of the country. UP is the only state which consumes the above two grades of NPK fertilizers. Moreover catapulted growth in consumption rate has been observed in these categories in the recent past. Next to UP Punjab and Haryana in the North also consumes considerable amounts of each of SSP (92.14 & 49.94), MOP (37.71 & 7.08), DAP (674.49 & 468.49). Penetration of NPKs is negligible in the northern states (barring UP). In the east, West Bengal (WB) is the main market for NP/NPKs (14:35:14 & 15:15:15) where the consumption has positively changed by 22% as compared to the previous year (1998-99). The overall increase in all India consumption of NP/NPKs (including DAP) has been 7%. For grades 16:20:00, 17:17:17, 20:20:00, 23:23:00 and 28:28:00 consumption increased by more than 50%.