1. Signal Processing and Machine Learning Applied to Power Frequency
Artifacts in Frequency Disturbance Recorder Signals
Ebholo, Ijieh. Tennessee State University, Nashville.
Mark, Buckner. Ph.D., Power and Energy Systems Research Division, Oak Ridge National Laboratory, Oak Ridge.
• Signals from individual Frequency Disturbance Recorder (FDR) units
have special unique characteristics.
• These characteristics such as frequency, phase angle and voltage
could be used to distinguish them from other FDRs.
• The Fast Fourier Transform (FFT) and supervised Machine Learning
Algorithms (MLA) are used to filter and extract features, to
differentiate the electrical signals from different outlets in the same
building, and potentially identify the source of the signal.
Background
• Signals are preprocessed to normalized to their mean and the
amplitudes are scaled with the standard deviation (unit variance) to
assure the smaller data are not dominated by the larger samples during
training and testing.
• Signals are smoothed with a constant window size prior to performing
the FFT.
• Smoothing reduces the power of the amplitude at the ends, “spectral
leakage,” the effect is reduced by overlapping the frames (number of
cycles/sec) such that the new frames are streamed in before previous
frames are finished.
• The overlapping ensures the robustness of the shifted signal, which is
the spectrum of each data frame and output is the FFT feature data
used by the MLAs.
Signals from the FDR units are not linearly separable, the Support Vector
Machine (SVM), Naïve Bayes (NB), and the Neural Network (NN) classifiers
are use to build the five-class nonlinear models.
SVM Model
• Radial Basis Function RBF Kernels enable the SVM to map high
dimensional space of non-linear samples onto parametric values for
selecting the best model, this project identified the best parameters for
the model using a grid-search approach.
• The SVM classifier trained and tested using 10-fold cross-validation
resulted in an accuracy of 44.8%.
NB Model
• The NB model estimated the prior probability and the Gaussian of each
class, which is used as the basis for the classifier model.
• The NB model multiplies the Gaussians for each class to estimate that class
probability.
ANN Model
• In the Multi-Layer Perceptron MLP, the Broyden–Fletcher–Goldfarb–
Shannon (BFGS) algorithm searches for the global minimum to optimize
the network.
• A hyperbolic tangent function allows the activation of the hidden neurons
and the softmax for the output unit activations, which the algorithms uses
to compare the cross entropy error function and the output error with a
backpropagation technique.
• Scaling and FFT generally improves performance of the MLA models.
• The MLP performance is 5% better than the other MLA models used.
Modeling and Classification Algorithms
Results
Conclusions
Acknowledgments
• Thanks to my Mentor for his contributions and success of this work
• This work was supported in part by Volkswagen Chattanooga through the
Volkswagen Distinguished Scholars Program
Preprocessing and Features Extraction
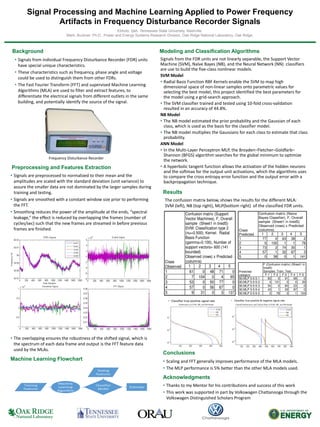
Machine Learning Flowchart
Frequency Disturbance Recorder
The confusion matrix below, shows the results for the different MLA:
SVM (left), NB (top right), MLP(bottom right) of the classified FDR units.
• Classifier true positive signal rate • Classifier true positive & negative signal rate