Download to read offline

![Food Security
Global Food Production
0.35
Global per capita harvested area [ ha person -1]
Global cereal yields [kg ha-1]
3,000
0.25
2,000
1,000
0.15
source: Lui et al & FAO
1960 1970 1980 1990 2000 2010](https://image.slidesharecdn.com/1530andriespotgieter-111027232336-phpapp01/85/1530-andries-potgieter-4-320.jpg)
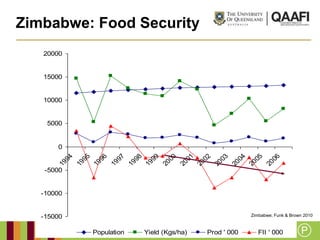
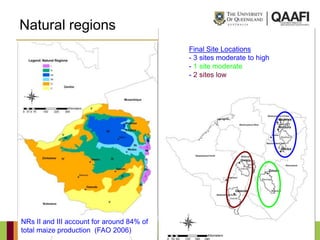
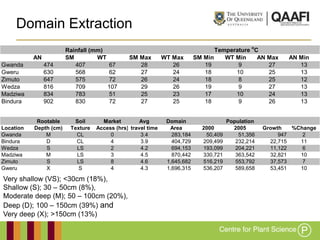
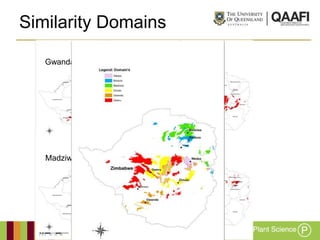
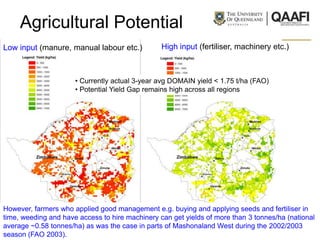


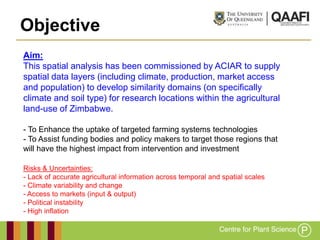
This spatial analysis created six similarity domains for targeted research sites in Zimbabwe based on climate, soil type, population, market access, and agricultural potential. The domains showed relatively low average travel times to markets but noted constraints to input access could still limit yields. While current average yields are below 1.75 tons/ha, the analysis found a continued high potential yield gap across the regions. It identified spatial areas that would most benefit from extrapolating targeted farming technologies from the research locations.


![[Day 2] Center Presentation: IFPRI](https://cdn.slidesharecdn.com/ss_thumbnails/cgiar-csi-day2-1apr2009-center-ifpri-090405003244-phpapp02-thumbnail.jpg?width=640&height=640&fit=bounds)


