Download to read offline

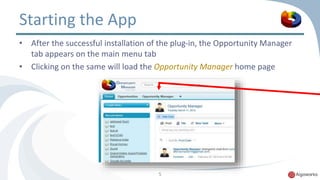
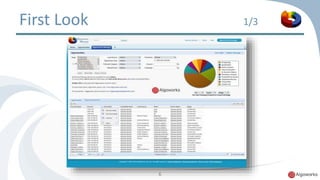
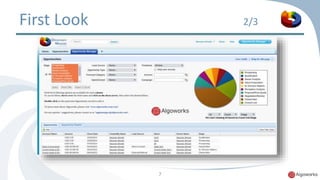
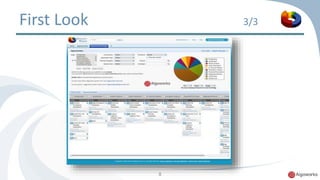
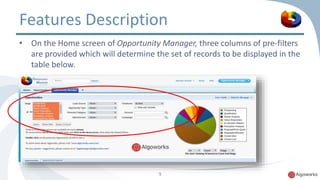
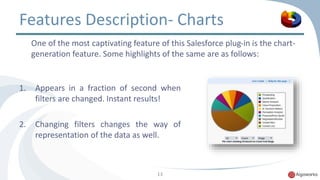
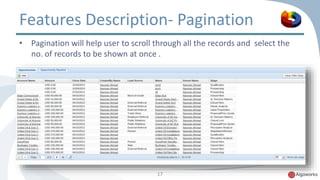
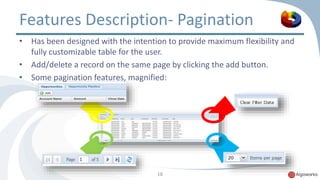
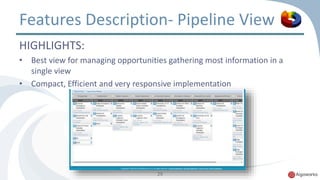
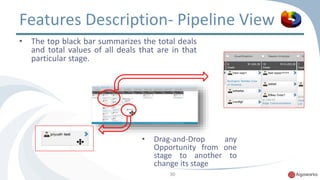
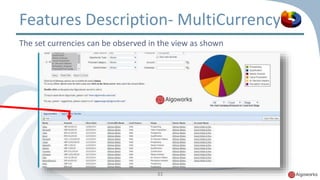

This document introduces an opportunity manager app for Salesforce that provides powerful features to help users manage opportunities. The app allows users to view all opportunities on a single page, update records quickly, and view opportunities distributed by stage. It also introduces info-graphics tools to display data via interactive charts. The app aims to minimize time spent on records while providing a consolidated and compact view of opportunities.


![[Business Strategy] Pump Up Your Revenue: Retain Customers With Salesforce!](https://cdn.slidesharecdn.com/ss_thumbnails/pptretaincustomerswithsalesforce-181003084830-thumbnail.jpg?width=640&height=640&fit=bounds)


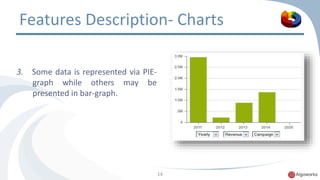
![[Business Strategy] DevOps Implementation Failure. Save It Before You Fail It!](https://cdn.slidesharecdn.com/ss_thumbnails/pptondevopsimplementationfailure1-180621141857-thumbnail.jpg?width=640&height=640&fit=bounds)


