GSK Consumer: Operating Profit ramps up by 16.29% in Q4FY15; Buy
•
1 like•301 views

GSK Consumer's Q4FY15 net sales up 8.55% to Rs. 12155.40 mn, Firstcall recommends Buy

Recommended
Recommended
More Related Content
What's hot
What's hot (19)
Viewers also liked
Viewers also liked (16)
Similar to GSK Consumer: Operating Profit ramps up by 16.29% in Q4FY15; Buy
Similar to GSK Consumer: Operating Profit ramps up by 16.29% in Q4FY15; Buy (17)
More from IndiaNotes.com
More from IndiaNotes.com (19)
Recently uploaded
Recently uploaded (20)
GSK Consumer: Operating Profit ramps up by 16.29% in Q4FY15; Buy
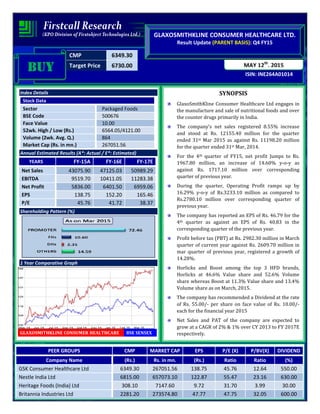
- 1. CMP 6349.30 Target Price 6730.00 ISIN: INE264A01014 MAY 12th , 2015 GLAXOSMITHKLINE CONSUMER HEALTHCARE LTD. Result Update (PARENT BASIS): Q4 FY15 BUYBUYBUYBUY Index Details Stock Data Sector Packaged Foods BSE Code 500676 Face Value 10.00 52wk. High / Low (Rs.) 6564.05/4121.00 Volume (2wk. Avg. Q.) 864 Market Cap (Rs. in mn.) 267051.56 Annual Estimated Results (A*: Actual / E*: Estimated) YEARS FY-15A FY-16E FY-17E Net Sales 43075.90 47125.03 50989.29 EBITDA 9519.70 10411.05 11283.38 Net Profit 5836.00 6401.50 6959.06 EPS 138.75 152.20 165.46 P/E 45.76 41.72 38.37 Shareholding Pattern (%) 1 Year Comparative Graph GLAXOSMITHKLINE CONSUMER HEALTHCARE BSE SENSEX SYNOPSIS GlaxoSmithKline Consumer Healthcare Ltd engages in the manufacture and sale of nutritional foods and over the counter drugs primarily in India. The company’s net sales registered 8.55% increase and stood at Rs. 12155.40 million for the quarter ended 31st Mar 2015 as against Rs. 11198.20 million for the quarter ended 31st Mar, 2014. For the 4th quarter of FY15, net profit Jumps to Rs. 1967.80 million, an increase of 14.60% y-o-y as against Rs. 1717.10 million over corresponding quarter of previous year. During the quarter, Operating Profit ramps up by 16.29% y-o-y of Rs.3233.10 million as compared to Rs.2780.10 million over corresponding quarter of previous year. The company has reported an EPS of Rs. 46.79 for the 4th quarter as against an EPS of Rs. 40.83 in the corresponding quarter of the previous year. Profit before tax (PBT) at Rs. 2982.30 million in March quarter of current year against Rs. 2609.70 million in mar quarter of previous year, registered a growth of 14.28%. Horlicks and Boost among the top 3 HFD brands, Horlicks at 46.6% Value share and 52.6% Volume share whereas Boost at 11.3% Value share and 13.4% Volume share as on March, 2015. The company has recommended a Dividend at the rate of Rs. 55.00/- per share on face value of Rs. 10.00/- each for the financial year 2015 Net Sales and PAT of the company are expected to grow at a CAGR of 2% & 1% over CY 2013 to FY 2017E respectively. PEER GROUPS CMP MARKET CAP EPS P/E (X) P/BV(X) DIVIDEND Company Name (Rs.) Rs. in mn. (Rs.) Ratio Ratio (%) GSK Consumer Healthcare Ltd 6349.30 267051.56 138.75 45.76 12.64 550.00 Nestle India Ltd 6815.00 657073.10 122.87 55.47 23.16 630.00 Heritage Foods (India) Ltd 308.10 7147.60 9.72 31.70 3.99 30.00 Britannia Industries Ltd 2281.20 273574.80 47.77 47.75 32.05 600.00
- 2. QUARTERLY HIGHLIGHTS (PARENT BASIS) Results updates- Q4 FY15, GlaxoSmithKline Consumer Healthcare Ltd has a strong marketing and distribution network in India comprising over 7000 distributors and a direct coverage of over 8 lakh retail outlets. The company has reported its financial results for the quarter ended 31st March 2015. The company has achieved a turnover of Rs. 12155.40 million for the 4th quarter of the financial year 2015 as against Rs. 11198.20 million in the corresponding quarter of the previous year. The company has reported an EBITDA of Rs. 3233.10 million in the corresponding quarter of the previous year. During the quarter, net profit of Rs. 1967.80 million against Rs. 1717.10 million in the corresponding quarter of the previous year. The company has reported an EPS of Rs. 46.79 for the 4th quarter as against an EPS of Rs. 40.83 in the corresponding quarter of the previous year. Break up of Expenditure Rs. In million MAR-15 MAR-14 % Change Net Sales 12155.40 11198.20 8.55 PAT 1967.80 1717.10 14.60 EPS 46.79 40.83 14.60 EBITDA 3233.10 2780.10 16.29 Break up of Expenditure (Values in millions) Q4 FY15 Q4 FY14 Chng % Cost of Material Consumed 3188.60 3345.20 -5% Purchase of Stock in Trade 341.80 482.20 -29% Employee Benefit Expenses 1402.50 1003.20 40% Advertising & Promotions 1824.10 1857.50 -2% Dep & Amortzation Exp 249.10 168.70 48% Other Expenditure 2344.3 1859.3 26%
- 3. Latest Updates • The company’s health drink portfolio continues to be a market leader with 58% (Value share) and 66% (Volume share) as on March, 2015. • Horlicks and Boost among the top 3 HFD brands, Horlicks at 46.6% Value share and 52.6% Volume share whereas Boost at 11.3% Value share and 13.4% Volume share as on March, 2015. • The company has recommended a Dividend at the rate of Rs. 55.00/- per share on face value of Rs. 10.00/- each for the financial year 2015. Regional Split:
- 4. COMPANY PROFILE GlaxoSmithKline Consumer Healthcare Limited engages in the manufacture and sale of nutritional foods and over the counter drugs primarily in India. It offers malt based foods, cereal based beverages, protein rich food, biscuits, nutrition bar sweetmeat, ready-to-drink, and instant noodles with seasoning, and ghee, milk fluid and milk cream. The group exports to Bangladesh, Myanmar, Sri Lanka, Middle East, Nepal and other markets. It was incorporated in 1958 as a 40% subsidiary of Smithkline Beecham Plc of UK. GSKCH’s manufacturing facilities are located at Nabha (Punjab), Sonepat (Haryana) and Rajahmundry (Andhra Pradesh). Apart from that the company has contract manufacturing arrangements with nine third-party manufacturers for the production of its various brands. GSK Consumer Healthcare globally owns some of the world’s best loved healthcare brands, successful in over 100 countries. These include Sensodyne, Voltaren, Theraflu, Paradontax, Panadol, Polident, Otrivin, Horlicks and Physiogel. GSK consumer healthcare has a strong marketing and distribution network in India comprising over 7000 distributors and a direct coverage of over 8 lakh retail outlets. Its Flagship product, Horlicks, is a widely regarded and highly respected brand for over 150 years. The company also manufactures and markets boost, viva and maltova and in additional markets and distributes a number of products in diverse categorie, which include prominent names such as eno, crocin and iodex as well as products from the global portfolio like sensodyne. The Gurgaon-based R&D center of GLAXOCON has been fully functional. The company plans to leverage its expertise in the food processing industry to innovate and serve the domestic consumers who are becoming more and more health conscious. GLAXOCON wants to improve its out-of-home business by boosting its vending business. Products • Nutritional o Horlicks o Boost o Maltova o Viva • Vending • OTC o Crocin o Eno o Iodex
- 5. FINANCIAL HIGHLIGHT (PARENT BASIS) (A*- Actual, E* -Estimations & Rs. In Millions) Balance sheet for the period of CY 2013 to FY 2017E CY-13A (15m) FY-15A FY-16E FY-17E I EQUITY & LIABILITIES A) Shareholder's Funds Share Capital 420.60 420.60 420.60 420.60 Reserves and Surplus 17707.90 20709.80 23907.39 27015.35 Sub-Total-Total Net worth 18128.50 21130.40 24327.99 27435.95 B) Non Current Liabilities Other Long term liabilities 92.80 99.30 104.27 110.52 Long term Provisions 1577.50 2076.00 2553.48 3089.71 Sub-Total-Total Non Current liabilities 1670.30 2175.30 2657.75 3200.23 C) Current Liabilities Trade payables 6715.90 7597.80 8433.56 9192.58 Other Current liabilities 4631.90 5340.60 5960.11 6556.12 Short term Provisions 2968.10 3951.40 4939.25 5927.10 Sub-Total- Current Liabilities 14315.90 16889.80 19332.92 21675.80 TOTAL EQUITY & LIABILITIES (A + B + C) 34114.70 40195.50 46318.66 52311.98 II ASSETS D) Non-Current Assets Fixed Assets 3783.60 5340.50 6440.64 7374.54 Long Term loans and advances 1888.80 757.40 515.03 422.33 Deferred Tax Asset 903.00 1043.40 1158.17 1273.97 Sub-Total-Non-Current Assets 6575.40 7141.30 8113.85 9070.83 E) Current Assets Inventories 4074.20 4662.50 5198.69 5718.56 Trade receivables 2993.40 3133.60 3321.62 3467.77 Cash and Bank Balances 18387.80 22965.20 27190.80 31373.63 Short-terms loans & advances 754.70 852.50 946.28 1040.90 Other current assets 1329.20 1440.40 1547.43 1640.29 Sub-Total-Current Assets 27539.30 33054.20 38204.81 43241.15 TOTAL ASSETS (D + E) 34114.70 40195.50 46318.66 52311.98
- 6. Annual Profit & Loss Statement for the period of CY 2013 to FY 2017E Value(Rs.in.mn) CY13 FY15 FY 16E FY 17E Description 15m 12m 12m 12m Net Sales 48685.80 43075.90 47125.03 50989.29 Other Income 2069.10 2218.90 2494.04 2778.36 Total Income 50754.90 45294.80 49619.08 53767.65 Expenditure -39958.00 -35775.10 -39208.03 -42484.27 Operating Profit 10796.90 9519.70 10411.05 11283.38 Interest -10.50 -7.40 -5.55 -5.72 Gross profit 10786.40 9512.30 10405.50 11277.66 Depreciation -625.50 -620.90 -676.78 -733.63 Profit Before Tax 10160.90 8891.40 9728.72 10544.03 Tax -3413.30 -3055.40 -3327.22 -3584.97 Net Profit 6747.60 5836.00 6401.50 6959.06 Equity capital 420.60 420.60 420.60 420.60 Reserves 17707.90 20709.80 23907.39 27015.35 Face value 10.00 10.00 10.00 10.00 EPS 160.43 138.75 152.20 165.46 Quarterly Profit & Loss Statement for the period of 30 SEP, 2014 to 30 JUNE, 2015E Value(Rs.in.mn) 30-Sep-14 31-Dec-14 31-Mar-15 30-Jun-15E Description 3m 3m 3m 3m Net sales 11136.00 10124.80 12155.40 10526.58 Other income 618.60 547.90 594.80 573.39 Total Income 11754.60 10672.70 12750.20 11099.96 Expenditure -9178.80 -9065.90 -9517.10 -8705.48 Operating profit 2575.80 1606.80 3233.10 2394.48 Interest -1.90 -1.90 -1.70 -1.96 Gross profit 2573.90 1604.90 3231.40 2392.53 Depreciation -121.40 -131.30 -249.10 -153.45 Profit Before Tax 2452.50 1473.60 2982.30 2239.08 Tax -849.60 -509.50 -1014.50 -764.65 Net Profit 1602.90 964.10 1967.80 1474.44 Equity capital 420.60 420.60 420.60 420.60 Face value 10.00 10.00 10.00 10.00 EPS 38.11 22.92 46.79 35.06
- 7. Ratio Analysis Particulars CY-13A (15M) FY-15A (12M) FY-16E (12M) FY-17E (12M) EPS (Rs.) 160.43 138.75 152.20 165.46 EBITDA Margin (%) 22.18% 22.10% 22.09% 22.13% PBT Margin (%) 20.87% 20.64% 20.64% 20.68% PAT Margin (%) 13.86% 13.55% 13.58% 13.65% P/E Ratio (x) 39.58 45.76 41.72 38.37 ROE (%) 37.22% 27.62% 26.31% 25.36% ROCE (%) 63.01% 47.99% 45.58% 43.80% EV/EBITDA (x) 23.03 25.64 23.04 20.89 Book Value (Rs.) 431.02 502.39 578.41 652.31 P/BV 14.73 12.64 10.98 9.73 Charts
- 8. OUTLOOK AND CONCLUSION At the current market price of Rs. 6349.30, the stock P/E ratio is at 41.72 x FY16E and 38.37 x FY17E respectively. Earning per share (EPS) of the company for the earnings for FY16E and FY17E is seen at Rs.152.20 and Rs.165.46 respectively. Net Sales and PAT of the company are expected to grow at a CAGR of 2% & 1% over CY 2013 to FY 2017E respectively. On the basis of EV/EBITDA, the stock trades at 23.04 x for FY16E and 20.89 x for FY17E. Price to Book Value of the stock is expected to be at 10.98 x and 9.73 x respectively for FY16E and FY17E. We expect that the company surplus scenario is likely to continue for the next three years, will keep its growth story in the coming quarters also. We recommend ‘BUY’ in this particular scrip with a target price of Rs. 6730.00 for Medium to Long term investment. INDUSTRY OVERVIEW The Indian food industry is poised for huge growth, increasing its contribution in world food trade every year. In India, the food sector has emerged as a high-profit sector on the back of the scope it offers for value addition, particularly with the food processing industry getting recognised as a high-priority area. Accounting for about 32 per cent of the country’s total food market, the food processing industry is one of the largest industries in India and is ranked fifth in terms of production, consumption, export and expected growth. The total food production in India is likely to double in the next 10 years with the country’s domestic food market estimated to reach US$ 258 billion by 2015. The role of the Indian government has been instrumental in the growth and development of the industry. The government through the Ministry of Food Processing Industries (MoFPI) is making all efforts to encourage investments in the sector. It has approved proposals for joint ventures (JV), foreign collaboration, industrial licences and 100 per cent export oriented units. Market Size The Indian food and grocery market is the world’s sixth largest, with retail contributing 70 per cent of the sales. It is projected to grow at the rate of 104 per cent, touching US$ 482 billion by 2020. The Indian food processing industry accounts for 32 per cent of the country’s total food market, 14 per cent of manufacturing GDP, 13 per cent of India’s exports and six per cent of total industrial investment. Indian food service industry is expected to reach US$ 78 billion by 2018.
- 9. The Indian gourmet food market is currently valued at US$ 1.3 billion and is growing at a CAGR of 20 per cent. It is expected to cross US$ 2.8 billion by 2015. Indian food brands are increasingly finding prime shelf space in retail chains abroad. These include Bikanervala Foods, MTR ready to eat foodstuff and ITC’s Kitchens of India. The online food ordering business in India is in its nascent stage. Share of online food ordering would be in single digits of the overall food ordering business which in 2014 was estimated to be around Rs 50000-60000 mn (US$ 800.19-960.12 million). We are growing at 20-30 per cent month-on-month. Government Initiatives • Union Minister for Food Processing Industries, Government of India has inaugurated the first of its kind Rs 136 crore (US$ 21.76 million) mega international food park at Dabwala Kalan, Punjab. • Ministry of Food Processing Industries has a scheme for human resource development (HRD) in the food processing sector. The HRD scheme is being implemented through State Governments under the National Mission on Food Processing. The scheme has the following four components: Creation of infrastructure facilities for degree/diploma courses in food processing sector Entrepreneurship Development Programme (EDP) Food Processing Training Centres (FPTC) Training at recognised institutions at State/National level • The Food Safety and Standards Authority of India (FSSAI) under the Ministry of Health and Family Welfare has issued the Food Safety and Standards (Food Product Standards and Food Additives) Regulations, 2011 and the Food Safety and Standards (Contaminants, Toxins and Residues) Regulations, 2011 which prescribe the quality and safety standards, respectively for food products. • The Ministry of Food Processing Industries has taken some new initiatives to develop the food processing sector which will also help to enhance the incomes of farmers and export of agro and processed foods among others. The government has also approved the setting up of five numbers of Mega Food Parks in the states of Bihar, Maharashtra, Himachal Pradesh and Chattisgarh. • The Indian Institute of Packaging (IIP) has planned to offer a packaging solution to the famed Tirupati ‘Laddu’ to enhance its shelf life. They have also planned to install automatic vacuum packaging system for the packaging of ‘Laddu’ with higher shelf life.
- 10. Road Ahead Further,the adoption of food safety and quality assurance mechanisms such as Total Quality Management (TQM) including ISO 9000, ISO 22000, Hazard Analysis and Critical Control Points (HACCP), Good Manufacturing Practices (GMP) and Good Hygienic Practices (GHP) by food processing industry enable adherence to stringent quality and hygiene norms and thereby protect consumer health, prepare the industry to face global competition, enhance product acceptance by overseas buyers and keep the industry technologically abreast of international best practices. The allocation of Rs 20000.00 mn (US$ 319.98 million) as a separate National Bank for Agriculture and Rural Development (NABARD) fund for food processing industries during the Union Budget 2014–15 is all set to give a big boost to this sector in India. Disclaimer: This document is prepared by our research analysts and it does not constitute an offer or solicitation for the purchase or sale of any financial instrument or as an official confirmation of any transaction. The information contained herein is from publicly available data or other sources believed to be reliable but we do not represent that it is accurate or complete and it should not be relied on as such. Firstcall Research or any of its affiliates shall not be in any way responsible for any loss or damage that may arise to any person from any inadvertent error in the information contained in this report. Firstcall Research and/ or its affiliates and/or employees will not be liable for the recipients’ investment decision based on this document.
- 11. Firstcall India Equity Research: Email – info@firstobjectindia.com C.V.S.L.Kameswari Pharma & Diversified U. Janaki Rao Capital Goods B. Anil Kumar Auto, IT & FMCG M. Vinayak Rao Diversified G. Amarender Diversified Firstcall Research Provides Industry Research on all the Sectors and Equity Research on Major Companies forming part of Listed and Unlisted Segments For Further Details Contact: Tel.: 022-2527 2510/2527 6077 / 25276089 Telefax: 022-25276089 040-20000235 /20000233 E-mail: info@firstobjectindia.com www.firstcallresearch.com