Torrent Pharma Q1FY16: IndiaNivesh maintain 'buy' for an upgraded price target
•
1 like•620 views

We attended conference call to understand Q1FY16 results and future outlook in key markets of Torrent Pharmaceutical (TRP IN) in greater details.

Recommended
Recommended
More Related Content
What's hot
What's hot (20)
Viewers also liked
Viewers also liked (11)
Similar to Torrent Pharma Q1FY16: IndiaNivesh maintain 'buy' for an upgraded price target
Similar to Torrent Pharma Q1FY16: IndiaNivesh maintain 'buy' for an upgraded price target (20)
More from IndiaNotes.com
More from IndiaNotes.com (20)
Recently uploaded
Recently uploaded (20)
Torrent Pharma Q1FY16: IndiaNivesh maintain 'buy' for an upgraded price target
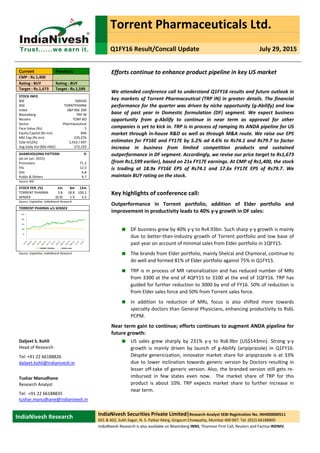
- 1. Torrent Pharmaceuticals Ltd. Q1FY16 Result/Concall Update July 29, 2015 IndiaNivesh Research IndiaNivesh Securities Private Limited|Research Analyst SEBI Registration No. INH000000511 601 & 602, Sukh Sagar, N. S. Patkar Marg, Girgaum Chowpatty, Mumbai 400 007. Tel: (022) 66188800 IndiaNivesh Research is also available on Bloomberg INNS, Thomson First Call, Reuters and Factiva INDNIV. Efforts continue to enhance product pipeline in key US market We attended conference call to understand Q1FY16 results and future outlook in key markets of Torrent Pharmaceutical (TRP IN) in greater details. The financial performance for the quarter was driven by niche opportunity (g‐Abilify) and low base of past year in Domestic formulation (DF) segment. We expect business opportunity from g‐Abilify to continue in near term as approval for other companies is yet to kick in. TRP is in process of ramping its ANDA pipeline for US market through in‐house R&D as well as through M&A route. We raise our EPS estimates for FY16E and FY17E by 5.2% ad 4.6% to Rs74.1 and Rs79.7 to factor increase in business from limited competition products and sustained outperformance in DF segment. Accordingly, we revise our price target to Rs1,673 (from Rs1,599 earlier), based on 21x FY17E earnings. At CMP of Rs1,400, the stock is trading at 18.9x FY16E EPS of Rs74.1 and 17.6x FY17E EPS of Rs79.7. We maintain BUY rating on the stock. Key highlights of conference call: Outperformance in Torrent portfolio, addition of Elder portfolio and improvement in productivity leads to 40% y‐y growth in DF sales: DF business grew by 40% y‐y to Rs4.93bn. Such sharp y‐y growth is mainly due to better‐than‐industry growth of Torrent portfolio and low base of past year on account of minimal sales from Elder portfolio in 1QFY15. The brands from Elder portfolio, mainly Shelcal and Chymoral, continue to do well and formed 81% of Elder portfolio against 75% in Q1FY15. TRP is in process of MR rationalization and has reduced number of MRs from 3300 at the end of 4QFY15 to 3100 at the end of 1QFY16. TRP has guided for further reduction to 3000 by end of FY16. 50% of reduction is from Elder sales force and 50% from Torrent sales force. In addition to reduction of MRs, focus is also shifted more towards specialty doctors than General Physicians, enhancing productivity to Rs6L PCPM. Near term gain to continue; efforts continues to augment ANDA pipeline for future growth: US sales grew sharply by 231% y‐y to Rs8.9bn (US$143mn). Strong y‐y growth is mainly driven by launch of g‐Abilify (aripiprazole) in Q1FY16. Despite genericization, innovator market share for aripiprazole is at 33% due to lower inclination towards generic version by Doctors resulting in lesser off‐take of generic version. Also, the branded version still gets re‐ imbursed in few states even now. The market share of TRP for this product is about 10%. TRP expects market share to further increase in near term. Daljeet S. Kohli Head of Research Tel: +91 22 66188826 daljeet.kohli@indianivesh.in Tushar Manudhane Research Analyst Tel: +91 22 66188835 tushar.manudhane@indianivesh.in Current Previous CMP : Rs.1,400 Rating : BUY Rating : BUY Target : Rs.1,673 Target : Rs.1,599 STOCK INFO BSE 500420 NSE TORNTPHARM Index S&P BSE 200 Bloomberg TRP IN Reuters TORP.BO Sector Pharmaceutical Face Value (Rs) 5 Equity Capital (Rs mn) 846 Mkt Cap (Rs mn) 235,276 52w H/L(Rs) 1,410 / 697 Avg Daily Vol (BSE+NSE) 272,193 SHAREHOLDING PATTERN % (as on Jun. 2015) Promoters 71.2 FIIs 12.3 DIIs 6.8 Public & Others 9.7 Source: BSE STOCK PER. (%) 1m 3m 12m TORRENT PHARMA 3.8 18.8 100.2 SENSEX (0.9) 1.4 5.5 Source: Capitaline, IndiaNivesh Research TORRENT PHARMA v/s SENSEX Source: Capitaline, IndiaNivesh Research ‐ 50 100 150 200 250 TORRENT PHARMA SENSEX Index
- 2. Q1FY16 Result/Concall Update (contd...) Torrent Pharmaceuticals Ltd. (contd...) July 29, 2015 | 2 TRP has 19 ANDAs pending for approval and 44 products are under development. TRP has guided for augmenting ANDA pipeline through in‐house R&D along with increasing presence in new segments like Dermatology, Oncology & Ophthalmology. Medium term opportunities for TRP are generic version of Nexium and Detrol. TRP had successful USFDA audit at its Indrad as well as Dahej plant in April 2015. Currency headwind adversely affects Europe and Brazil sales Due to currency headwinds, TRP had muted y‐y growth in Europe sales in INR terms. However, it had 15% constant currency y‐y growth in Europe market for the quarter. Though Brazil sales declined by 7.4% y‐y to Rs1.38bn, TRP exhibited constant currency growth of 20% y‐y in Brazil market for the quarter. Other key highlights from the concall: TRP has guided for increase in R&D spent from 4.8% in FY15 to 6% in FY16 and expected to inch up further for increased efforts towards complex generics. TRP has guided for capex of Rs1.5bn‐Rs2bn for FY16. The capex spent would be much higher in FY17 for expansion at Sikkim and building manufacturing plant for Oncology products. TRP expects commercial manufacturing in Dahej to start from December 2015, which would reduce capacity constraint for US market. Valuation: We raise our EPS estimates for FY16E and FY17E by 5.2% ad 4.6% to Rs74.1 and Rs79.7 to factor increased business from limited competition products and sustained outperformance in DF segment. Accordingly, we revise our price target to Rs1,673 (from Rs1,599 earlier), based on 21x FY17E earnings. We remain positive on the stock on the back of increased R&D effort towards building robust ANDA pipeline for US market and sustained outperformance in DF market. At CMP of Rs1,400, the stock is trading at 18.9x FY16E EPS of Rs74.1 and 17.6x FY17E EPS of Rs79.7. We maintain BUY rating on the stock. Key changes in estimates: FY16E FY17E FY16E FY17E FY16E FY17E Sales 64,250 70,224 66,110 71,999 2.9 2.5 EBITDA 17,146 18,529 17,926 19,283 4.6 4.1 PAT 11,929 12,887 12,545 13,483 5.2 4.6 EPS (Rs) 70.5 76.1 74.1 79.7 5.2 4.6 PT (Rs) 1,599 1,673 Rs mn Old estimates New estimates Change (%)
- 3. Q1FY16 Result/Concall Update (contd...) Torrent Pharmaceuticals Ltd. (contd...) July 29, 2015 | 3 Quarterly result summary Rs mn Q1FY16 Q1FY15 Y‐y (%) Q4FY15 Q‐q (%) FY15 FY14 Y‐y (%) Net Sales 18,860 10,920 72.7 11,340 66.3 45,850 40,360 13.6 Other operating income 610 220 177.3 200 205.0 680 1,480 (54.1) Consumption of raw material 4,180 3,010 38.9 3,610 15.8 14,150 12,430 13.8 Employee Cost 2,100 1,840 14.1 2,350 (10.6) 8,420 7,410 13.6 Manufacturing & Other Expenditure 4,100 2,840 44.4 3,960 3.5 13,760 12,480 10.3 Operating Expenses 10,380 7,690 35.0 9,920 4.6 36,330 32,320 12.4 EBITDA 8,480 3,230 162.5 1,420 497.2 9,520 8,040 18.4 Other income 670 490 36.7 1,000 (33.0) 2,860 740 286.5 Depreciation and Amortization 590 210 181.0 600 (1.7) 1,910 870 119.5 EBIT 9,170 3,730 145.8 2,020 354.0 11,150 9,390 18.7 Net Interest Expenses 580 240 141.7 470 23.4 1,750 590 196.6 Profit Before Tax 8,590 3,490 146.1 1,550 454.2 9,400 8,800 6.8 Tax 4,100 930 340.9 250 1,540.0 1,890 1,800 5.0 Net Profit After Tax 4,490 2,560 75.4 1,300 245.4 7,510 7,000 7.3 Minority Interest ‐ ‐ NA ‐ NA ‐ ‐ NA Adj. PAT 4,490 2,560 75.4 1,300 245.4 7,510 7,000 7.3 Adj. EPS (Rs) 26.5 15.1 75.4 7.7 245.4 44.4 41.4 7.3 EO items ‐ ‐ ‐ ‐ (360.0) Reported PAT 4,490 2,560 75.4 1,300 245.4 7,510 6,640 13.1 Rep. EPS (Rs) 26.5 15.1 75.4 7.7 245.4 44.4 39.2 13.1 Key ratios Ratios Adj Gross Margins 77.8 72.4 540 68.2 967 69.1 69.2 (6) Adj EBITDA margin 45.0 29.6 1,538 12.5 3,244 20.8 19.9 84 Net Margin 23.1 23.0 8 11.3 1,180 16.1 16.7 (59) Material cost/Net Sales 22.2 27.6 (540) 31.8 (967) 30.9 30.8 6 Employee Cost/ Net Sales 11.1 16.8 (572) 20.7 (959) 18.4 18.4 0 Other Expenditure/ Net Slaes 21.7 26.0 (427) 34.9 (1,318) 30.0 30.9 (91) Tax Rate 47.7 26.6 2,108 16.1 3,160 20.1 20.5 (35) Source: Company Filings; IndiaNivesh Research Niche opportunity drive US sales for the quarter Outperformance in TRP portfolio and addition of Elder business led robust y‐y growth in DF segment EBITDA margins up 1,538bps y‐y and 3,244bps q‐q Source: Company Filings; IndiaNivesh Research Source: Company Filings; IndiaNivesh Research Source: Company Filings; IndiaNivesh Research 43.0 24.5 73.1 334.8 138.0 45.2 16.0 ‐45.0 231.2 ‐100 ‐50 0 50 100 150 200 250 300 350 400 ‐ 1.0 2.0 3.0 4.0 5.0 6.0 7.0 8.0 9.0 10.0 Q1FY14 Q2FY14 Q3FY14 Q4FY14 Q1FY15 Q2FY15 Q3FY15 Q4FY15 Q1FY16 US sales (Rs bn) Y‐y growth (%) 3.2 3.0 3.0 2.6 3.6 4.4 4.2 4.0 4.9 12.8 8.3 13.6 16.4 12.7 48.8 42.0 54.7 38.5 0 10 20 30 40 50 60 ‐ 1.0 2.0 3.0 4.0 5.0 6.0 Q1FY14 Q2FY14 Q3FY14 Q4FY14 Q1FY15 Q2FY15 Q3FY15 Q4FY15 Q1FY16 DF sales (Rs bn) Y‐y growth (%) 7.8 16.6 16.7 26.0 27.4 20.4 18.7 10.8 41.7 ‐ 5.0 10.0 15.0 20.0 25.0 30.0 35.0 40.0 45.0 Q1FY14 Q2FY14 Q3FY14 Q4FY14 Q1FY15 Q2FY15 Q3FY15 Q4FY15 Q1FY16 EBITDA margin (%)
- 4. Q1FY16 Result/Concall Update (contd...) Torrent Pharmaceuticals Ltd. (contd...) July 29, 2015 | 4 Financial Summary Source: Company Filings; IndiaNivesh Research Profit & Loss Y E March (Rs m) FY13 FY14 FY15 FY16E FY17E Net sales 30,540 40,360 45,850 66,110 71,999 Growth % 17.7% 32.2% 13.6% 44.2% 8.9% Other Operating Income 1,580 1,480 680 1,090 1,137 Total sales 32,120 41,840 46,530 67,200 73,136 Expenditure Raw Material 9,260 12,430 14,150 20,990 21,600 Employee cost 6,230 7,410 8,420 10,716 12,014 Other expenses 9,700 12,480 13,760 17,568 20,239 EBITDA 6,930 9,520 10,200 17,926 19,283 Growth % 38.4% 37.4% 7.1% 75.7% 7.6% EBITDA Margin % 17.5% 19.9% 20.8% 25.5% 25.2% Depreciation 830 870 1,910 1,995 2,102 EBIT 6,100 8,650 8,290 15,930 17,182 EBIT Margin % 20.0% 21.4% 18.1% 24.1% 23.9% Other Income 430 380 2,860 1,800 1,500 Interest 340 590 1,750 1,850 1,615 PBT 6,190 8,440 9,400 15,880 17,067 Tax 1,470 1,800 1,890 3,335 3,584 Effective tax rate % 23.7% 21.3% 20.1% 21.0% 21.0% Extraordinary items (370) ‐ ‐ ‐ ‐ Minority Interest (20) ‐ ‐ ‐ ‐ Adjusted PAT 4,700 6,640 7,510 12,545 13,483 Growth% 34.5% 41.3% 13.1% 67.0% 7.5% PAT margin % 15.4% 16.5% 16.4% 19.0% 18.7% Reported PAT 4,330 6,640 7,510 12,545 13,483 Growth% 52.4% 53.3% 13.1% 67.0% 7.5% Balance sheet Y E March (Rs m) FY13 FY14 FY15 FY16E FY17E Share Capital 423 846 846 846 846 Reserves & Surplus 13,796 18,178 24,060 34,102 44,792 Net Worth 14,219 19,024 24,906 34,948 45,639 Minority Interest 4 4 4 4 4 Secured Loans 5,474 8,890 30,376 28,376 26,376 Unsecured Loans 1,587 2,464 2,464 2,464 2,464 Total debt 7,061 11,354 32,840 30,840 28,840 Net defered tax liability 258 (182) 1,050 1,050 1,050 Total Liabilities 21,542 30,201 58,801 66,842 75,533 Gross Block 12,955 14,200 38,900 40,883 45,203 Less: Depreciation 4,757 5,447 7,357 9,352 11,454 Net Block 8,198 8,753 32,243 32,231 34,449 Capital Work in Progress 3,273 6,177 6,057 6,057 6,057 Investments 844 2,464 2,980 2,980 2,980 Current Assets Inventories 9,239 10,060 10,670 19,018 20,712 Sundry Debtors 6,878 10,994 15,950 14,852 16,175 Cash & Bank Balance 6,270 7,694 5,671 16,184 21,952 Other Current Assets 1,859 2,590 4,730 4,730 4,730 Loans & advances 968 1,209 3,160 1,630 1,775 25,213 32,547 40,181 56,414 65,345 Current Liabilities & provisions Current Liabilities 12,266 16,202 18,280 26,460 28,918 Provisions 3,720 3,538 4,380 4,380 4,380 15,986 19,740 22,660 30,840 33,298 Net Current Assets 9,227 12,807 17,521 25,574 32,047 Total assets 21,542 30,201 58,801 66,842 75,533 Cash Flow Y E March (Rs m) FY13 FY14 FY15 FY16E FY17E PBT 5,820 8,440 6,494 15,880 17,067 Depreciation 827 870 1,910 1,995 2,102 Interest ‐ 312 1,750 1,850 1,615 Other non cash charges 430 186 ‐ ‐ ‐ Changes in working capital (4,218) (1,197) (6,738) 2,460 (704) Tax (1,325) (2,617) (1,249) (3,335) (3,584) Cash flow fromoperations 1,535 5,994 2,167 18,851 16,495 Capital expenditure (2,929) (4,001) (25,400) (1,983) (4,320) Free Cash Flow (1,394) 1,994 (23,232) 16,867 12,175 Other income 425 337 ‐ ‐ ‐ Investments 87 106 700 ‐ ‐ Cash flow from investments (2,417) (3,558) (24,700) (1,983) (4,320) Equity capital raised ‐ ‐ ‐ ‐ ‐ Loans availed or (repaid) 1,343 4,149 21,486 (2,000) (2,000) Interest paid (312) (610) (1,750) (1,850) (1,615) Dividend paid (incl tax) (834) (2,674) (1,083) (2,504) (2,792) Cash flow from Financing 197 865 18,653 (6,354) (6,407) Net change in cash (685) 3,301 (3,880) 10,513 5,768 Cash at the beginning of the year 7,608 6,270 9,550 5,671 16,184 Foreign currency exchange impact (49) (624) ‐ ‐ ‐ Cash at the end of the year 6,270 7,694 5,671 16,184 21,952 Key ratios Y E March FY13 FY14 FY15 FY16E FY17E EPS (Rs) 25.6 39.2 44.4 74.1 79.7 Cash EPS (Rs) 30.5 44.4 55.7 85.9 92.1 DPS (Rs) 11.5 10.0 5.5 12.7 14.2 BVPS 84.0 112.4 147.2 206.5 269.7 ROCE 13.4% 16.9% 8.6% 16.3% 15.8% ROE 30.5% 34.9% 30.2% 35.9% 29.5% EBITDA Margin % 17.5% 19.9% 20.8% 25.5% 25.2% Net Margin % 15.4% 16.5% 16.4% 19.0% 18.7% PER (x) 54.7 35.7 31.5 18.9 17.6 P/BV (x) 16.7 12.5 9.5 6.8 5.2 P/CEPS (x) 45.9 31.5 25.2 16.3 15.2 EV/EBITDA (x) 34.30 25.27 25.89 14.04 1.03 Dividend Payout (%) 45.6 27.0 20.0 20.0 20.0 m cap/sales (x) 7.8 5.9 5.2 3.6 3.3 net debt/equity (x) 0.1 0.2 1.1 0.4 0.2 net debt/ebitda (x) 0.1 0.4 2.7 0.8 0.0
- 5. Q1FY16 Result/Concall Update (contd...) Torrent Pharmaceuticals Ltd. (contd...) July 29, 2015 | 5 Disclaimer: This document has been prepared by IndiaNivesh Securities Private Limited (“INSPL”), for use by the recipient as information only and is not for circulation or public distribution. INSPL includes subsidiaries, group and associate companies, promoters, employees and affiliates. INSPL researches, aggregates and faithfully reproduces information available in public domain and other sources, considered to be reliable and makes them available for the recipient, though its accuracy or completeness has not been verified by INSPL independently and cannot be guaranteed. The third party research material included in this document does not represent the views of INSPL and/or its officers, employees and the recipient must exercise independent judgement with regard to such content. This document has been published in accordance with the provisions of Regulation 18 of the Securities and Exchange Board of India (Research Analysts) Regulations, 2014. This document is not to be altered, transmitted, reproduced, copied, redistributed, uploaded or published or made available to others, in any form, in whole or in part, for any purpose without prior written permission from INSPL. This document is solely for information purpose and should not to be construed as an offer to sell or the solicitation of an offer to buy any security. Recipients of this document should be aware that past performance is not necessarily a guide for future performance and price and value of investments can go up or down. The suitability or otherwise of any investments will depend upon the recipients particular circumstances. INSPL does not take responsibility thereof. The research analysts of INSPL have adhered to the code of conduct under Regulation 24 (2) of the Securities and Exchange Board of India (Research Analysts) Regulations, 2014. This document is based on technical and derivative analysis center on studying charts of a stock’s price movement, outstanding positions and trading volume, as opposed to focusing on a company’s fundamentals and, as such, may not match with a report on a company’s fundamentals. Nothing in this document constitutes investment, legal, accounting and/or tax advice or a representation that any investment or strategy is suitable or appropriate to recipients’ specific circumstances. INSPL does not accept any responsibility or whatever nature for the information, assurances, statements and opinion given, made available or expressed herein or for any omission or for any liability arising from the use of this document. Opinions expressed are our current opinions as of the date appearing on this document only. The opinions are subject to change without any notice. INSPL directors/employees and its clients may have holdings in the stocks mentioned in the document. This report is based / focused on fundamentals of the Company and forward‐looking statements as such, may not match with a report on a company’s technical analysis report Each of the analysts named below hereby certifies that, with respect to each subject company and its securities for which the analyst is responsible in this report, (1) all of the views expressed in this report accurately reflect his or her personal views about the subject companies and securities, and (2) no part of his or her compensation was, is, or will be, directly or indirectly, related to the specific recommendations or views expressed in this report: Daljeet S Kohli, Amar Maurya, Abhishek Jain, Yogesh Hotwani, Prerna Jhunjhunwala, Kaushal Patel, Rahul Koli, Tushar Manudhane, Aman Vij, Abhitesh Agarwal, Harshraj Aggarwal & Dharmesh Kant. Following table contains the disclosure of interest in order to adhere to utmost transparency in the matter: Disclosure of Interest Statement 1 Details of business activity of IndiaNivesh Securities Private Limited (INSPL) INSPL is a Stock Broker registered with BSE, NSE and MCX ‐ SX in all the major segments viz. Cash, F & O and CDS segments. INSPL is also a Depository Participant and registered with both Depository viz. CDSL and NSDL. Further, INSPL is a Registered Portfolio Manager and is registered with SEBI. 2 Details of Disciplinary History of INSPL No disciplinary action is / was running / initiated against INSPL 3 Details of Associates of INSPL Please refer to the important 'Stock Holding Disclosure' report on the IndiaNivesh website (investment Research Section ‐http://www.indianivesh.in/Research/Holding_Disclosure.aspx?id=10 link). Also, please refer to the latest update on respective stocks for the disclosure status in respect of those stocks. INSPL and its affiliates may have investment positions in the stocks recommended in this report. 4 Research analyst or INSPL or its relatives'/associates' financial interest in the subject company and nature of such financial interest No (except to the extent of shares held by Research analyst or INSPL or its relatives'/associates') 5 Research analyst or INSPL or its relatives'/associates' actual/beneficial ownership of 1% or more in securities of the subject company, at the end of the month immediately preceding the date of publication of the document. Please refer to the important 'Stock Holding Disclosure' report on the IndiaNivesh website (investment Research Section ‐ http://www.indianivesh.in/Research/Holding_Disclosure.aspx?id=10 link). Also, please refer to the latest update on respective stocks for the disclosure status in respect of those stocks. INSPL and its affiliates may have investment positions in the stocks recommended in this report. 6 Research analyst or INSPL or its relatives'/associates' any other material conflict of interest at the time of publication of the document No 7 Has research analyst or INSPL or its associates received any compensation from the subject company in the past 12 months No 8 Has research analyst or INSPL or its associates managed or co‐ managed public offering of securities for the subject company in the past 12 months No 9 Has research analyst or INSPL or its associates received any compensation for investment banking or merchant banking or brokerage services from the subject company in the past 12 months No 10 Has research analyst or INSPL or its associates received any compensation for products or services other than investment banking or merchant banking or brokerage services from the subject company in the past 12 months No 11 Has research analyst or INSPL or its associates received any compensation or other benefits from the subject company or third party in connection with the document. No 12 Has research analyst served as an officer, director or employee of the subject company No 13 Has research analyst or INSPL engaged in market making activity for the subject company No 14 Other disclosures No INSPL, its affiliates, directors, its proprietary trading and investment businesses may, from time to time, make investment decisions that are inconsistent with or contradictory to the recommendations expressed herein. The views contained in this document are those of the analyst, and the company may or may not subscribe to all the views expressed within. This information is subject to change, as per applicable law, without any prior notice. INSPL reserves the right to make modifications and alternations to this statement, as may be required, from time to time. Definitions of ratings BUY. We expect this stock to deliver more than 15% returns over the next 12 months. HOLD. We expect this stock to deliver ‐15% to +15% returns over the next 12 months. SELL. We expect this stock to deliver <‐15% returns over the next 12 months. Our target prices are on a 12‐month horizon basis. Other definitions NR = Not Rated. The investment rating and target price, if any, have been arrived at due to certain circumstances not in control of INSPL CS = Coverage Suspended. INSPL has suspended coverage of this company. UR=Under Review. Such e invest review happens when any developments have already occurred or likely to occur in target company & INSPL analyst is waiting for some more information to draw conclusion on rating/target. NA = Not Available or Not Applicable. The information is not available for display or is not applicable. NM = Not Meaningful. The information is not meaningful and is therefore excluded. Research Analyst has not served as an officer, director or employee of Subject Company One year Price history of the daily closing price of the securities covered in this note is available at www.nseindia.com and www.economictimes.indiatimes.com/markets/stocks/stock‐quotes. (Choose name of company in the list browse companies and select 1 year in icon YTD in the price chart) IndiaNivesh Securities Private Limited Research Analyst SEBI Registration No. INH000000511 601 & 602, Sukh Sagar, N. S. Patkar Marg, Girgaum Chowpatty, Mumbai 400 007. Tel: (022) 66188800 / Fax: (022) 66188899 e‐mail: research@indianivesh.in | Website: www.indianivesh.in